


Languages
Pages
Legal


3547
Serum levels of alkaline phosphatase (ALP) and phosphate are primarily used as markers of liver disease or bone
disease in clinical practice. Recent epidemiological studies have demonstrated that elevated ALP or phosphate levels are associated with the presence of atherosclerosis in coronary and peripheral arteries, increased cardiovascular events, and mortality.1–5 ALP and phosphate are also considered to be sur-rogate markers of systemic inflammation, malnutrition, and metabolic syndrome, which may lead to worse clinical out-comes in patients with stroke.1,3 Therefore, we investigated whether ALP/phosphate is associated with cerebral athero-sclerosis and long-term functional outcomes in patients with acute cerebral infarction.
MethodsThis was a hospital-based, retrospective observational study. Candidates were patients admitted with a first-ever acute cere-bral infarction. Patient inclusion and exclusion criteria are shown in Figure I in the online-only Data Supplement. Serum ALP and phosphate levels were measured at admission using peripheral ve-nous blood with a Hitachi 7600-210 automatic analyzer (HITACHI, Tokyo, Japan). We collected data, including baseline characteristics, National Institutes of Health Stroke Scale score at admission, risk factors, and laboratory findings.
Cerebral atherosclerosis was defined as occlusion or significant stenosis (≥50%) of cerebral artery on the basis of digital subtraction angiography, magnetic resonance angiography, or computed tomo-graphic angiography. The presence of cerebral atherosclerosis was assessed in intracranial cerebral arteries (anterior cerebral, middle cerebral, posterior cerebral, basilar, intracranial internal carotid, and intracranial vertebral arteries) and extracranial cerebral arter-ies (extracranial internal carotid and extracranial vertebral arteries). Then, patients were subdivided into 4 groups according to the loca-tion of cerebral atherosclerosis (no atherosclerosis, only intracranial, only extracranial, and both intracranial and extracranial atheroscle-rosis). We also collected data for the presence of coronary artery disease and peripheral artery disease. We defined a poor functional outcome as a modified Rankin Scale score of >2 at 3 months af-ter stroke onset. Definition of risk factors, collected data, and sta-tistical methods is shown in the Methods in the online-only Data Supplement. The Institutional Review Board of Severance Hospital, Yonsei University Health System, approved this study and waived the need for informed consent because of the retrospective and ob-servational nature of the study.
ResultsOf the 1043 patients, 62.51% were men, and their mean age was 65.82±12.79 years. Mean values were 62.45±19.61 U/L for ALP and 1.07±0.21 mmol/L for phosphate. Clinical char-acteristics and their associations with ALP/phosphate are
Background and Purpose—Higher serum alkaline phosphatase (ALP) and phosphate levels are associated with atherosclerotic disease and an increased risk of cardiovascular events. However, the association of ALP/phosphate with cerebral atherosclerosis and prognosis in patients with acute stroke is not well known.
Methods—In 1034 patients with first-ever acute cerebral infarction, levels of ALP and phosphate were compared with (1) cerebral atherosclerosis and (2) poor long-term functional outcomes as defined by the modified Rankin Scale >2 at 3 months after stroke onset.
Results—ALP levels were not associated with cerebral atherosclerosis. However, higher levels of ALP were associated with a poor functional outcome (adjusted odds ratio per 1 SD, 1.25; 95% confidence interval, 1.04–1.50). Phosphate was associated with neither cerebral atherosclerosis nor functional outcome.
Conclusions—A higher level of ALP was not associated with cerebral atherosclerosis but was an independent prognostic factor for long-term functional outcome after acute cerebral infarction. (Stroke. 2013;44:3547-3549.)
Key Words: alkaline phosphatase ◼ atherosclerosis ◼ phosphate ◼ stroke
Serum Alkaline Phosphatase and Phosphate in Cerebral Atherosclerosis and Functional Outcomes
After Cerebral InfarctionJinkwon Kim, MD; Tae-Jin Song, MD; Dongbeom Song, MD; Hye Sun Lee, MS;
Chung Mo Nam, PhD; Hyo Suk Nam, MD, PhD; Young Dae Kim, MD, PhD; Ji Hoe Heo, MD, PhD
Received July 23, 2013; accepted August 15, 2013.From the Department of Neurology, CHA Bundang Medical Center, CHA University, Seongnam, Republic of Korea (J.K.); Department of Neurology,
Ewha Womans University, Seoul, Republic of Korea (T.-J.S.); and Departments of Neurology (J.K., D.S., H.S.N., Y.D.K., J.H.H.) and Biostatistics (H.S.L., C.M.N.), Yonsei University College of Medicine, Seoul, Republic of Korea.
The online-only Data Supplement is available with this article at http://stroke.ahajournals.org/lookup/suppl/doi:10.1161/STROKEAHA. 113.002959/-/DC1.
Correspondence to Ji Hoe Heo, MD, PhD, Department of Neurology, Yonsei University College of Medicine, 50 Yonsei-ro, Seodaemoon-ku, 120–752 Seoul, Republic of Korea. E-mail [email protected]
© 2013 American Heart Association, Inc.
Stroke is available at http://stroke.ahajournals.org DOI: 10.1161/STROKEAHA.113.002959
by guest on September 9, 2017
http://stroke.ahajournals.org/D
ownloaded from
by guest on Septem
ber 9, 2017http://stroke.ahajournals.org/
Dow
nloaded from
by guest on September 9, 2017
http://stroke.ahajournals.org/D
ownloaded from
by guest on Septem
ber 9, 2017http://stroke.ahajournals.org/
Dow
nloaded from
by guest on September 9, 2017
http://stroke.ahajournals.org/D
ownloaded from
by guest on Septem
ber 9, 2017http://stroke.ahajournals.org/
Dow
nloaded from
by guest on September 9, 2017
http://stroke.ahajournals.org/D
ownloaded from
by guest on Septem
ber 9, 2017http://stroke.ahajournals.org/
Dow
nloaded from
by guest on September 9, 2017
http://stroke.ahajournals.org/D
ownloaded from
by guest on Septem
ber 9, 2017http://stroke.ahajournals.org/
Dow
nloaded from
by guest on September 9, 2017
http://stroke.ahajournals.org/D
ownloaded from

3548 Stroke December 2013
shown in Tables I and II in the online-only Data Supplement. ALP was associated with old age, higher frequency of hyper-cholesterolemia, and higher hemoglobin, cholesterol, alanine aminotransferase, and glucose. Phosphate was associated with female sex, lower National Institutes of Health Stroke Scale score at admission, higher cholesterol, triglyceride, and calcium, and lower hemoglobin and high-sensitivity C-reactive protein.
There were 623 patients (59.73%) with cerebral atheroscle-rosis. The levels of ALP/phosphate were not associated with intracranial or extracranial cerebral atherosclerosis (Table 1). When we subdivided patients according to the degree of cere-bral atherosclerosis (no atherosclerosis, <50%, 50%–75%, and ≥75% or occlusion), there was no significant difference of ALP/phosphate among them (Table III in the online-only Data Supplement).
At 3 months, 243 patients (23.3%) showed poor functional outcomes. Elevated ALP levels were associated with a poor functional outcome (61.17±17.24 versus 66.66±25.51 U/L; P=0.002), but phosphate levels were not (1.07±0.20 versus 1.07±0.22 mmol/L; P=0.826). After adjustment for sex, age, and other covariates that had a P<0.05 on univariate analysis (Table IV in the online-only Data Supplement), odds ratio for 1 increase of SD in ALP (19.61 U/L) was 1.25 (95% confidence interval, 1.04–1.50; P=0.017; Table 2). Penalized-spline curve demonstrated a positive relationship between levels of ALP and an increased risk for poor functional outcomes (Figure).
DiscussionIn this study, we tested the hypothesis that elevated ALP/phosphate levels are associated with cerebral atheroscle-rosis, which was based on previous reports that showed a higher prevalence of coronary artery disease and peripheral artery disease in patients with elevated ALP/phosphate levels. However, such a relationship between serum ALP/phosphate
levels and cerebral atherosclerosis was not found in our study. The action of ALP/phosphate might differ in each vascular bed. Susceptibility to atherosclerosis is strongly influenced by intrinsic differences in the cells composing each vascular system.6 Associated risk factors and pathological findings, including calcification, differ according to the location of the atherosclerosis. Although we defined atherosclerosis as sig-nificant stenosis (≥ 50%) on angiographic studies, most previ-ous studies used definitions based on coronary artery calcium score, ankle-brachial index, and carotid intima thickness. ALP and phosphate are suggested to enhance medial calcifica-tion and stiffening of the vessel and further atherosclerosis.5,7 Medial calcification has a longitudinal, uniform distribution (pipeline-like) without focal luminal narrowing.6 Thus, ALP-/phosphate-related medial calcification and atherosclerosis might be undetected in angiographic studies.
Inflammation may be a link between elevated ALP levels and poor clinical outcomes.3,4 ALP is increased in inflamma-tory conditions, poor nutrition, and infections, which could lead to worse functional outcomes after stroke.3,8 In contrast to ALP, phosphate is not associated with functional outcomes in this study. Although there are reports for increased mortality with high levels of serum phosphate, low levels of phosphate are also associated with malnutrition, low physical activ-ity, hypertension, and metabolic syndrome.3,9 Racial differ-ences and genetic polymorphisms among Western and Asian individuals might be present.5 Compared with Asian diets, Western diets are relatively high in bioavailable phosphate.5 The lack of an association in this study between phosphate and functional outcomes in Asian patients with stroke may be partly ascribed to the complex nature of phosphate.
This study has some limitations. Selection bias might be present because this was a retrospective observational study in a single center, and many patients were excluded because of missing data. The mechanism behind the association between
Table 1. Level of Alkaline Phosphatase and Phosphate According to the Cerebral Atherosclerosis
Location of Cerebral Atherosclerosis Number (%) Alkaline Phosphatase, U/L P Value Phosphate, mmol/L P Value
No atherosclerosis 420 (40.3) 62.82±19.81 0.083 3.32±0.65 0.294
Only intracranial 374 (35.9) 61.32±18.35 3.33±0.62
Only extracranial 135 (12.9) 65.01±19.81 3.25±0.64
Both intracranial and extracranial
114 (10.9) 65.45±19.61 3.22±0.62
P value is derived from 1-way ANOVA.
Table 2. Prognostic Value of Alkaline Phosphatase and Phosphate for Functional Outcomes at 3 Months After Stroke Onset
Alkaline Phosphatase Phosphate
OR (95% CI)* P Value OR (95% CI)* P Value
Unadjusted 1.30 (1.13–1.49) <0.001 1.02 (0.88–1.17) 0.826
Adjusted† 1.25 (1.04–1.50) 0.017 … …
CI indicates confidence interval; and OR, odds ratio.*OR for poor functional outcome per 1 SD increase in alkaline phosphatase (19.61 U/L) or phosphate (0.21 mmol/L). †Adjusted for sex,
age, National Institute of Health Stroke Scale, thrombolysis, hypertension, current smoking, atrial fibrillation, peripheral artery disease, cerebral atherosclerosis, hemoglobin, high-sensitivity C-reactive protein, cholesterol, triglyceride, albumin, total bilirubin, calcium, and estimated glomerular filtration rate.
by guest on September 9, 2017
http://stroke.ahajournals.org/D
ownloaded from

Kim et al ALP/Phosphate and Functional Outcomes After Stroke 3549
elevated ALP and poor functional outcomes is unclear. We could not conclude whether elevated ALP caused poor out-comes or was only a marker for stroke prognosis. Other poten-tial factors, such as alcohol consumption, not collected in this study might act as confounders.
ConclusionsWe did not find a significant association between serum ALP/phosphate and cerebral atherosclerosis. Patients with elevated ALP levels had poor functional outcomes after acute cerebral infarction.
Sources of FundingThis work was supported by a grant from the Korea Healthcare Technology Research and Development Project, Ministry for Health and Welfare, Republic of Korea (HI10C2020).
DisclosuresNone.
References 1. Tonelli M, Curhan G, Pfeffer M, Sacks F, Thadhani R, Melamed ML,
et al. Relation between alkaline phosphatase, serum phosphate, and all-cause or cardiovascular mortality. Circulation. 2009;120:1784–1792.
2. Tonelli M, Sacks F, Pfeffer M, Gao Z, Curhan G; Cholesterol And Recurrent Events Trial Investigators. Relation between serum phosphate level and cardiovascular event rate in people with coronary disease. Circulation. 2005;112:2627–2633.
3. Wannamethee SG, Sattar N, Papcosta O, Lennon L, Whincup PH. Alkaline phosphatase, serum phosphate, and incident cardiovascular disease and total mortality in older men. Arterioscler Thromb Vasc Biol. 2013;33:1070–1076.
4. Park JB, Kang DY, Yang HM, Cho HJ, Park KW, Lee HY, et al. Serum alkaline phosphatase is a predictor of mortality, myocardial infarction, or stent thrombosis after implantation of coronary drug-eluting stent. Eur Heart J. 2013;34:920–931.
5. Ellam TJ, Chico TJ. Phosphate: the new cholesterol? The role of the phosphate axis in non-uremic vascular disease. Atherosclerosis. 2012;220:310–318.
6. Drüeke TB. Arterial intima and media calcification: distinct entities with different pathogenesis or all the same? Clin J Am Soc Nephrol. 2008;3:1583–1584.
7. Demer LL, Tintut Y. Vascular calcification: pathobiology of a multifac-eted disease. Circulation. 2008;117:2938–2948.
8. Ryu WS, Lee SH, Kim CK, Kim BJ, Yoon BW. Increased serum alka-line phosphatase as a predictor of long-term mortality after stroke. Neurology. 2010;75:1995–2002.
9. Park W, Kim BS, Lee JE, Huh JK, Kim BJ, Sung KC, et al. Serum phos-phate levels and the risk of cardiovascular disease and metabolic syn-drome: a double-edged sword. Diabetes Res Clin Pract. 2009;83:119–125.
Figure. Relationship between alkaline phosphatase levels and risk for poor functional outcomes. The solid line represents the log odds ratio, and the dotted lines represent 95% confidence intervals. The odds ratio was adjusted for the same variables listed in Table 2. Bars represent the alkaline phosphatase distri-bution. mRS indicates modified Rankin Scale.
by guest on September 9, 2017
http://stroke.ahajournals.org/D
ownloaded from

Young Dae Kim and Ji Hoe HeoJinkwon Kim, Tae-Jin Song, Dongbeom Song, Hye Sun Lee, Chung Mo Nam, Hyo Suk Nam,
Outcomes After Cerebral InfarctionSerum Alkaline Phosphatase and Phosphate in Cerebral Atherosclerosis and Functional
Print ISSN: 0039-2499. Online ISSN: 1524-4628 Copyright © 2013 American Heart Association, Inc. All rights reserved.
is published by the American Heart Association, 7272 Greenville Avenue, Dallas, TX 75231Stroke doi: 10.1161/STROKEAHA.113.002959
2013;44:3547-3549; originally published online September 10, 2013;Stroke.
http://stroke.ahajournals.org/content/44/12/3547World Wide Web at:
The online version of this article, along with updated information and services, is located on the
http://stroke.ahajournals.org/content/suppl/2013/09/10/STROKEAHA.113.002959.DC1Data Supplement (unedited) at:
http://stroke.ahajournals.org//subscriptions/
is online at: Stroke Information about subscribing to Subscriptions:
http://www.lww.com/reprints Information about reprints can be found online at: Reprints:
document. Permissions and Rights Question and Answer process is available in the
Request Permissions in the middle column of the Web page under Services. Further information about thisOnce the online version of the published article for which permission is being requested is located, click
can be obtained via RightsLink, a service of the Copyright Clearance Center, not the Editorial Office.Strokein Requests for permissions to reproduce figures, tables, or portions of articles originally publishedPermissions:
by guest on September 9, 2017
http://stroke.ahajournals.org/D
ownloaded from

SUPPLEMENT MATERIAL
Title: Serum alkaline phosphatase and phosphate in cerebral atherosclerosis and functional
outcomes after cerebral infarction
Authors: Jinkwon Kim, MD; Tae-Jin Song, MD; Dongbeom Song, MD; Hye Sun Lee, MS;
Chung Mo Nam, PhD; Hyo Suk Nam, MD, PhD; Young Dae Kim, MD, PhD; Ji Hoe Heo,
MD, PhD
Supplementary Method
Supplementary Figure I. Flow of participants according to the inclusion and exclusion
criteria in this study
Supplementary Table I. Clinical characteristics according to quartiles of serum alkaline
phosphatase
Supplementary Table II. Clinical characteristics according to quartiles of serum phosphate
Supplementary Table III. The levels of alkaline phosphatase and phosphate in subgroups
according to the degree of cerebral atherosclerosis
Supplementary Table IV. Comparison between patients with and without poor functional
outcomes after 3 months.
Supplementary References

Supplementary Method
Collection of clinical data
We collected clinical data including sex, age, time from stroke onset to hospital arrival, and
National Institute of Health Stroke Scale (NIHSS) score at admission. Data for the presence
of hypertension, diabetes mellitus, hypercholesterolemia, current smoking, atrial fibrillation,
coronary artery disease (CAD), peripheral artery disease (PAD), and use of thrombolysis
(intravenous, intra-arterial or combined) were obtained. We collected other laboratory results
that might act as confounders, including total white blood cell count, hemoglobin, high-
sensitivity C-reactive protein, total cholesterol, triglyceride, albumin, total bilirubin, aspartate
aminotransferase, alanine aminotransferase, calcium, glucose, and estimated glomerular
filtration rate (eGFR). eGFR was calculated using the abbreviated Modification of Diet in
Renal Disease Study Equation [186 x Serum Creatinine-1.154 x Age-0.203 x (0.742 if female)].1
Definition of risk factors
Hypertension was diagnosed when a patient was on anti-hypertensive medication or had
systolic blood pressures ≥ 140 mmHg or diastolic blood pressures ≥ 90 mmHg on repeated
measurements during admission. Diabetes mellitus was diagnosed if the patient had a fasting
plasma glucose level ≥ 7.0 mmol/L or was being treated with anti-diabetic medications or
insulin. Hypercholesterolemia was diagnosed if the patient had low-density lipoprotein
cholesterol ≥ 4.1 mmol/L, total cholesterol ≥ 6.2 mmol/L, or the patient was treated with lipid
lowering agents after diagnosis of hypercholesterolemia. Current smoking was defined as
having smoked a cigarette in the year prior to admission. The presence of CAD was identified
when a patient had a history of acute myocardial infarction, unstable angina, angiographically
confirmed coronary artery occlusive disease, or a coronary artery bypass graft or
percutaneous coronary artery stent/angioplasty. The presence of PAD was determined if a
patient had an ankle-brachial index < 0.9 on either the right or left side measured during
admission, or a previous history of angiographically-confirmed PAD.
Assessment for cerebral atherosclerosis
MRA was conducted using a 3.0-T system (Achieva, Philips, Best, the Netherlands, or Trio,
Siemens, Erlangen, Germany). CTA was performed using a 64-slice CT scanner (Siemens
Sensation 64, Siemens Medical Solutions, Forchheim, Germany). For those patients who
received both DSA and MRA or CTA, the results of the DSA were used for analysis. The
degree of stenosis in the extracranial cerebral artery was measured using the method in the
North American Symptomatic Carotid Endarterectomy Trial,2 and that in the intracranial
cerebral artery was measured using the method in the Warfarin vs. Aspirin for Symptomatic
Intracranial Disease Trial.3 All angiographic findings were evaluated and determined during
the weekly stroke conference based on the consensus of stroke specialists and on the
radiology report, and were prospectively registered in the Yonsei stroke registry.4

Patient management and determination of functional outcome
Patients were treated with the standard stroke treatment protocols of our hospital, which are
based on the guidelines for ischemic stroke.5,6 Patients admitted within 6 hours of stroke
onset were considered for intravenous tissue-type plasminogen activator, intra-arterial
thrombolysis, or combined thrombolysis.7 Patients with high-risk potential cardioembolic
sources such as atrial fibrillation, intracardiac thrombus, or a mechanical prosthetic valve
received an oral anticoagulant. Others received antiplatelet agents unless the patient had a
contraindication to antithrombotic medication. All patients except those with
contraindications were given a statin. Early rehabilitation was strongly encouraged in patients
with neurological deficits. Long-term functional outcome was assessed using the modified
Rankin Scale (mRS) via a direct interview performed by a clinician or a telephone interview
conducted by a well-trained research nurse.
Statistical analyses
All statistical analyses were performed using the R package for Windows (version 3.0.1, R
Foundation for Statistical Computing, Vienna, Austria) and the Statistical Package for the
Social Sciences for Windows (SPSS version 18.0, SPSS Inc., Chicago, IL, USA). NIHSS
score was considered a continuous variable. Continuous variables were expressed as mean
standard deviation or median [interquartile range].
To evaluate the association between clinical characteristics and ALP/phosphate, patients were
subdivided into quartile groups according to the levels of ALP and phosphate. The difference
across the quartile groups were evaluated using Fisher’s exact test, one-way analysis of
variance or the Kruskal-Wallis test, appropriately. In subgroups of patients, levels of
ALP/phosphate were compared using independent t-test or one-way analysis of variance.
Univariate logistic regression was performed to identify potential variables associated with a
poor functional outcome (mRS >2). The levels of ALP and phosphate were treated as
continuous variables in the regression analysis. If there was a significant association between
ALP/phosphate and a poor functional outcome, we performed multivariate logistic regression
adjusted for sex, age, and those variables which had p<0.05 in univariate analysis.
Additionally, penalized regression smoothing splines (P-spline) were performed to exam
dose-response relation and to illustrate the likelihood of poor functional outcome across the
levels of ALP/phosphate. The P-spline curve was fitted via the “gam” function in the “mgcv”
package of R software. All statistical tests were two-tailed, and p<0.05 was considered
statistically significant.
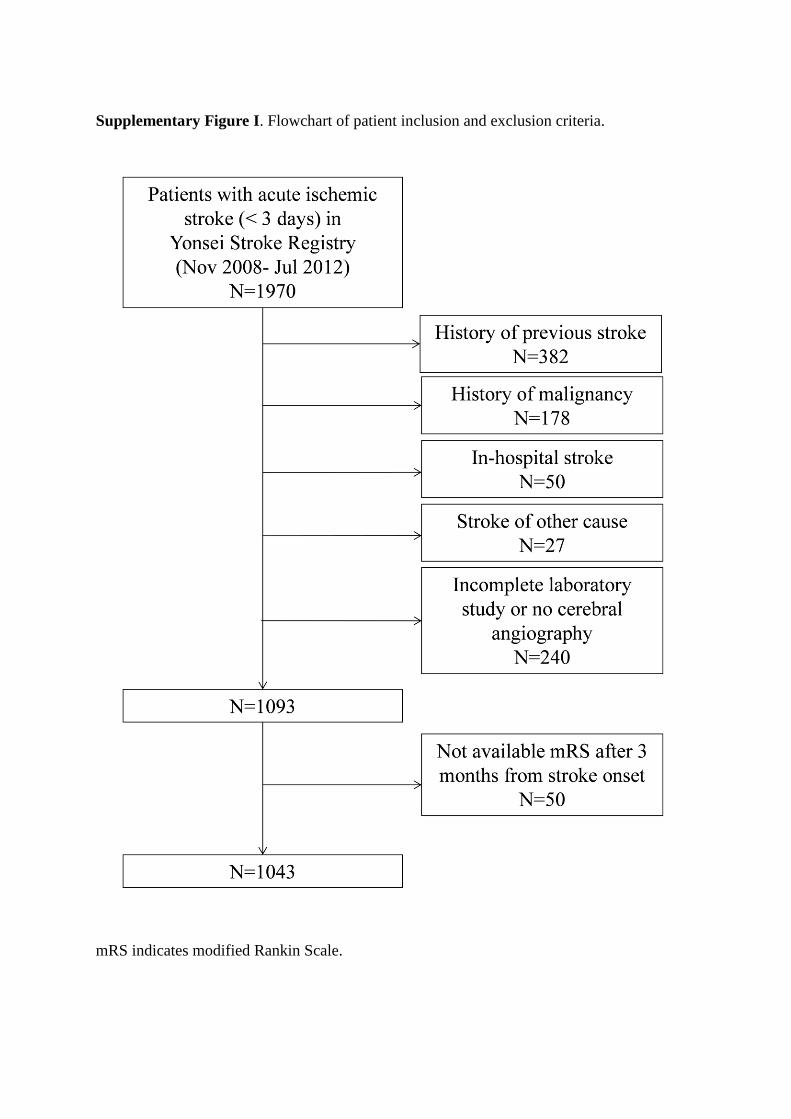
Supplementary Figure I. Flowchart of patient inclusion and exclusion criteria.
mRS indicates modified Rankin Scale.

Supplementary Table I. Clinical characteristics according to quartiles of serum alkaline
phosphatase
ALP Q1:
<49 U/L
ALP Q2:
49-59 U/L
ALP Q3:
60-71 U/L
ALP Q4:
>71 U/L P-value
(N=248) (N=270) (N=259) (N=266)
Baseline characteristics
Sex, male 149 (60.1) 175 (64.8) 170 (65.6) 158 (59.4) 0.332
Age, year 64.73 ± 14.17 64.76 ± 12.07 64.78 ± 12.13 68.93 ± 12.32 <0.001
Time from stroke onset to
hospital arrival, hour 11 [3-25] 13 [4-30] 13 [4-27] 12 [4-26] 0.167
NIHSS score at admission 3 [1-10] 3 [1-6] 3 [1-7] 4 [1-9] 0.216
Risk factors
Hypertension 166 (66.9) 206 (76.3) 182 (70.3) 198 (74.4) 0.078
Diabetes mellitus 70 (28.2) 73 (27.0) 84 (32.4) 87 (32.7) 0.370
Hypercholesterolemia 50 (20.2) 57 (21.1) 78 (30.1) 78 (29.3) 0.009
Current smoking 57 (23.0) 72 (26.7) 65 (25.1) 75 (28.2) 0.573
Atrial fibrillation 69 (27.8) 54 (20.0) 60 (23.2) 65 (24.4) 0.215
Coronary artery disease 49 (19.8) 61 (22.6) 59 (22.8) 63 (23.7) 0.737
Peripheral artery disease 17 (6.9) 17 (6.3) 22 (8.5) 31 (11.7) 0.111
Laboratory findings
Phosphate, mmol/L 1.05 ± 0.22 1.07 ± 0.21 1.07 ± 0.18 1.06 ± 0.20 0.631
Hemoglobin, g/dL 13.75 ± 1.59 14.04 ± 1.81 14.30 ± 1.80 14.21 ± 1.89 0.003
hs-CRP, nmol/L 75.14 ± 179.76 90.56 ± 283.06 82.55 ± 206.31 104.22 ± 246.26 0.530
Cholesterol, mmol/L 4.71 ± 0.95 4.92 ± 1.09 4.89 ± 1.07 5.15 ± 1.23 <0.001
Triglyceride, mmol/L 1.33 ± 1.14 1.40 ± 0.92 1.40 ± 0.84 1.36 ± 0.82 0.820
Albumin, g/dL 4.21 ± 0.40 4.24 ± 0.45 4.26 ± 0.40 4.27 ± 0.45 0.388
Total bilirubin, μmol/L 11.36 ± 5.00 11.96 ± 6.66 11.49 ± 5.07 12.03 ± 7.10 0.498
AST, U/L 24.43 ± 13.33 25.19 ± 19.15 24.96 ± 14.51 27.33 ± 24.41 0.293
ALT, U/L 20.53 ± 12.45 21.11 ± 15.26 22.42 ± 15.13 24.59 ± 23.07 0.033
Calcium, mmol/L 2.24 ± 0.12 2.26 ± 0.12 2.26 ± 0.11 2.26 ± 0.12 0.179
Glucose, mmol/L 7.62 ± 2.53 7.79 ± 3.27 7.94 ± 3.27 8.76 ± 4.21 0.001
eGFR, mL/min/1.73m2 83.83 ± 26.97 82.31 ± 25.62 85.02 ± 25.91 79.90 ± 26.02 0.132
Values are mean ± standard deviation, median [interquartile range] or number (%).
P-value is derived from Fisher`s exact test, Kruskal-Wallis test or one-way analysis of variance.
NIHSS indicates National Institute of Health Stroke Scale; hs-CRP, high-sensitivity C-reactive protein; ALP,
alkaline phosphatase; AST, aspartate aminotransferase; ALT, alanine aminotransferase; eGFR, estimated
glomerular filtration rate.

Supplementary Table II. Clinical characteristics according to quartiles of serum phosphate
Phosphate Q1:
<0.93 mmol/L
Phosphate Q2:
0.93-1.05
mmol/L
Phosphate Q3:
1.06-1.17
mmol/L
Phosphate Q4:
>1.17 mmol/L P-value
(N=223) (N=270) (N=260) (N=290)
Baseline characteristics
Sex, male 171 (76.7) 176 (65.2) 166 (63.8) 139 (47.9) <0.001
Age, year 66.87 ± 12.37 66.04 ± 13.48 65.04 ± 12.98 65.51 ± 12.26 0.436
Time from stroke onset to
hospital arrival, hour 11 [3-24] 12 [3-29] 14 [4-26] 14 [5-27] 0.191
NIHSS score at admission 3 [1-10] 4 [2-9] 3 [1-7] 3 [1-7] 0.041
Risk factors
Hypertension 160 (71.7) 201 (74.4) 191 (73.5) 200 (69.0) 0.494
Diabetes mellitus 62 (27.8) 81 (30.0) 81 (31.2) 90 (31.0) 0.846
Hypercholesterolemia 56 (25.1) 58 (21.5) 70 (26.9) 79 (27.2) 0.389
Current smoking 50 (22.4) 73 (27.0) 70 (26.9) 76 (26.2) 0.629
Atrial fibrillation 60 (26.9) 70 (25.9) 62 (23.9) 56 (19.3) 0.165
Coronary artery disease 46 (20.6) 65 (24.1) 48 (18.5) 73 (25.2) 0.218
Peripheral artery disease 21 (9.4) 26 (9.6) 23 (8.9) 17 (5.9) 0.343
Laboratory findings
Alkaline phosphatase, U/L 61.52 ± 18.43 62.41 ± 18.42 63.07 ± 20.17 62.65 ± 21.05 0.851
Hemoglobin, g/dL 14.34 ± 1.59 14.01 ± 1.77 14.24 ± 1.91 13.81 ± 1.80 0.003
hs-CRP, nmol/L 136.20 ± 328.82 93.84 ± 243.60 78.01 ± 197.23 55.84 ± 141.81 0.001
Cholesterol, mmol/L 4.81 ± 1.06 4.75 ± 0.99 5.09 ± 1.12 5.02 ± 1.19 0.001
Triglyceride, mmol/L 1.29 ± 0.70 1.27 ± 0.78 1.43 ± 0.94 1.47 ± 1.18 0.023
Albumin, g/dL 4.20 ± 0.43 4.24 ± 0.40 4.25 ± 0.42 4.28 ± 0.44 0.237
Total bilirubin, μmol/L 11.82 ± 6.21 12.08 ± 6.37 11.93 ± 5.94 11.10 ± 5.70 0.225
AST, U/L 26.31 ± 19.04 26.13 ± 22.86 24.92 ± 15.54 24.80 ± 15.77 0.702
ALT, U/L 23.17 ± 21.05 21.55 ± 17.09 22.52 ± 15.43 21.72 ± 14.95 0.698
Calcium, mmol/L 2.23 ± 0.12 2.25 ± 0.11 2.26 ± 0.11 2.27 ± 0.12 <0.001
Glucose, mmol/L 8.08 ± 2.65 7.91 ± 2.90 8.19 ± 3.99 7.96 ± 3.80 0.774
eGFR, mL/min/1.73m2 83.01 ± 24.42 84.79 ± 25.92 82.56 ± 24.78 80.75 ± 28.72 0.338
Values are mean ± standard deviation, median [interquartile range] or number (%).
P-value is derived from Fisher`s exact test, Kruskal-Wallis test or one-way analysis of variance.
NIHSS indicates National Institute of Health Stroke Scale; hs-CRP, high-sensitivity C-reactive protein; ALP,
alkaline phosphatase; AST, aspartate aminotransferase; ALT, alanine aminotransferase; eGFR, estimated
glomerular filtration rate.

Supplementary Table III. The levels of alkaline phosphatase and phosphate in subgroups
according to the degree of cerebral atherosclerosis
Number
(%)
Alkaline
phosphatase
(IU/L)
P-value Phosphate
(mmol/L)
P-value
Degree of cerebral
atherosclerosis
0.679 0.833
no atherosclerosis 248 (23.8) 62.52 ± 21.56 3.31 ± 0.66
<50% 172 (16.5) 60.81 ± 16.97 3.32 ± 0.63
50~75% 211 (20.2) 63.00 ± 18.79 3.31 ± 0.68
≥75% or occlusion 412 (39.5) 62.81 ± 19.84 3.28 ± 0.59
Values are mean ± standard deviation.
P-value is derived from one-way analysis of variance test.

Supplementary Table IV. Comparison between patients with and without poor functional
outcomes after 3 months
Variables OR [95% CI] P-value
Baseline characteristics at admission
Sex, male 0.561 [0.419-0.751] <0.001
Age, year 1.066 [1.051-1.082] <0.001
Time from stroke onset to hospital arrival, hour 0.992 [0.983-1.000] 0.055
NIHSS score at admission, per 1 point 1.243 [1.207-1.281] <0.001
Thrombolysis at admission 2.406 [1.617-3.556] <0.001
Risk factors
Hypertension 1.713 [1.218-2.447] 0.002
Diabetes mellitus 1.217 [0.892-1.652] 0.213
Hypercholesterolemia 0.809 [0.571-1.132] 0.220
Current smoking 0.493 [0.336-0.709] <0.001
Atrial fibrillation 2.513 [1.835-3.435] <0.001
Coronary artery disease 1.198 [0.851-1.672] 0.297
Peripheral artery disease 2.294 [1.440-3.613] 0.001
Cerebral atherosclerosis
no atherosclerosis Reference
only intracranial 3.517 [2.404-5.146] <0.001
only extracranial 3.509 [2.167-5.680] <0.001
both intracranial and extracranial 5.846 [3.601-9.489] <0.001
Laboratory findings
Alkaline phosphatase, U/L 1.013 [1.006-1.020] <0.001
Phosphate, mmol/L 1.082 [0.537-2.178] 0.826
Hemoglobin, g/dL 0.829 [0.765-0.898] <0.001
hs-CRP, nmol/L 1.002 [1.002-1.003] <0.001
Cholesterol, mmol/L 0.846 [0.739-0.968] 0.015
Triglyceride, mmol/L 0.639 [0.506-0.806] <0.001
Albumin, g/dL 0.288 [0.204-0.407] <0.001
Total bilirubin, μmol/L 1.027 [1.005-1.050] 0.018
AST, U/L 1.004 [0.997-1.011] 0.250
ALT, U/L 0.991 [0.981-1.001] 0.085
Calcium, mmol/L 0.011 [0.003-0.042] <0.001
Glucose, mmol/L 1.016 [0.975-1.058] 0.451
eGFR, mL/min/1.73m2 0.988 [0.983-0.994] <0.001
OR and P-value are derived from univariate logistic regression using modified Rankin Scale >2 as the
dependent variable. NIHSS indicates National Institute of Health Stroke Scale; hs-CRP, high-sensitivity C-
reactive protein; ALP, alkaline phosphatase; AST, aspartate aminotransferase; ALT, alanine aminotransferase;
eGFR, estimated glomerular filtration rate; OR, odds ratio; CI, confidence intervals.

Supplementary References
1. National Kidney Foundation. K/doqi clinical practice guidelines for chronic kidney
disease: Evaluation, classification, and stratification. Am J Kidney Dis. 2002;39:S1-
266
2. North American Symptomatic Carotid Endarterectomy Trial Collaborators. Beneficial
effect of carotid endarterectomy in symptomatic patients with high-grade carotid
stenosis. North american symptomatic carotid endarterectomy trial collaborators. N
Engl J Med. 1991;325:445-453
3. Warfarin-Aspirin Symptomatic Intracranial Disease (WASID) Trial Investigators.
Design, progress and challenges of a double-blind trial of warfarin versus aspirin for
symptomatic intracranial arterial stenosis. Neuroepidemiology. 2003;22:106-117
4. Lee BI, Nam HS, Heo JH, Kim DI, Yonsei Stroke T. Yonsei stroke registry. Analysis
of 1,000 patients with acute cerebral infarctions. Cerebrovasc Dis. 2001;12:145-151
5. Jauch EC, Saver JL, Adams HP, Jr., Bruno A, Connors JJ, Demaerschalk BM, et al.
Guidelines for the early management of patients with acute ischemic stroke: A
guideline for healthcare professionals from the american heart association/american
stroke association. Stroke. 2013;44:870-947
6. Furie KL, Kasner SE, Adams RJ, Albers GW, Bush RL, Fagan SC, et al. Guidelines
for the prevention of stroke in patients with stroke or transient ischemic attack: A
guideline for healthcare professionals from the american heart association/american
stroke association. Stroke. 2011;42:227-276
7. Lee KY, Kim DI, Kim SH, Lee SI, Chung HW, Shim YW, et al. Sequential
combination of intravenous recombinant tissue plasminogen activator and intra-
arterial urokinase in acute ischemic stroke. AJNR Am J Neuroradiol. 2004;25:1470-
1475
Top Related