


Languages
Pages
Legal

Selected Acquisition Report (SAR)
RCS: DD-A&T(Q&A)823-212
V-22As of December 31, 2011
Defense Acquisition Management Information Retrieval
(DAMIR)
UNCLASSIFIED

V-22 December 31, 2011 SAR
UNCLASSIFIED 2
Table of Contents
Program Information 3Responsible Office 3References 3Mission and Description 4Executive Summary 5Threshold Breaches 7Schedule 8Performance 12Track To Budget 15Cost and Funding 17Low Rate Initial Production 39Nuclear Cost 40Foreign Military Sales 40Unit Cost 41Cost Variance 44Contracts 48Deliveries and Expenditures 55Operating and Support Cost 56

Program Information
Responsible Office
References
Designation And Nomenclature (Popular Name)V-22 Joint Services Advanced Vertical Lift Aircraft - Osprey (V-22)
DoD ComponentNavy
Joint ParticipantsUSMC; USN; USSOCOM; USAF
Responsible OfficeCol Gregory Masiello Program Executive Office (PMA-275) Air, Anti-Submarine Warfare, Assault & Special Mission Programs 47123 Buse Road Unit #IPT Patuxent River, MD 20670-1547
Phone Fax DSN Phone DSN Fax
301-757-5161 301-757-7558 757-5161 757-7558
[email protected] Date Assigned August 20, 2009
SAR Baseline (Production Estimate)Defense Acquisition Executive (DAE) Approved Acquisition Program Baseline (APB) dated September 28, 2005 Approved APBDefense Acquisition Executive (DAE) Approved Acquisition Program Baseline (APB) dated October 31, 2011
V-22 December 31, 2011 SAR
UNCLASSIFIED 3
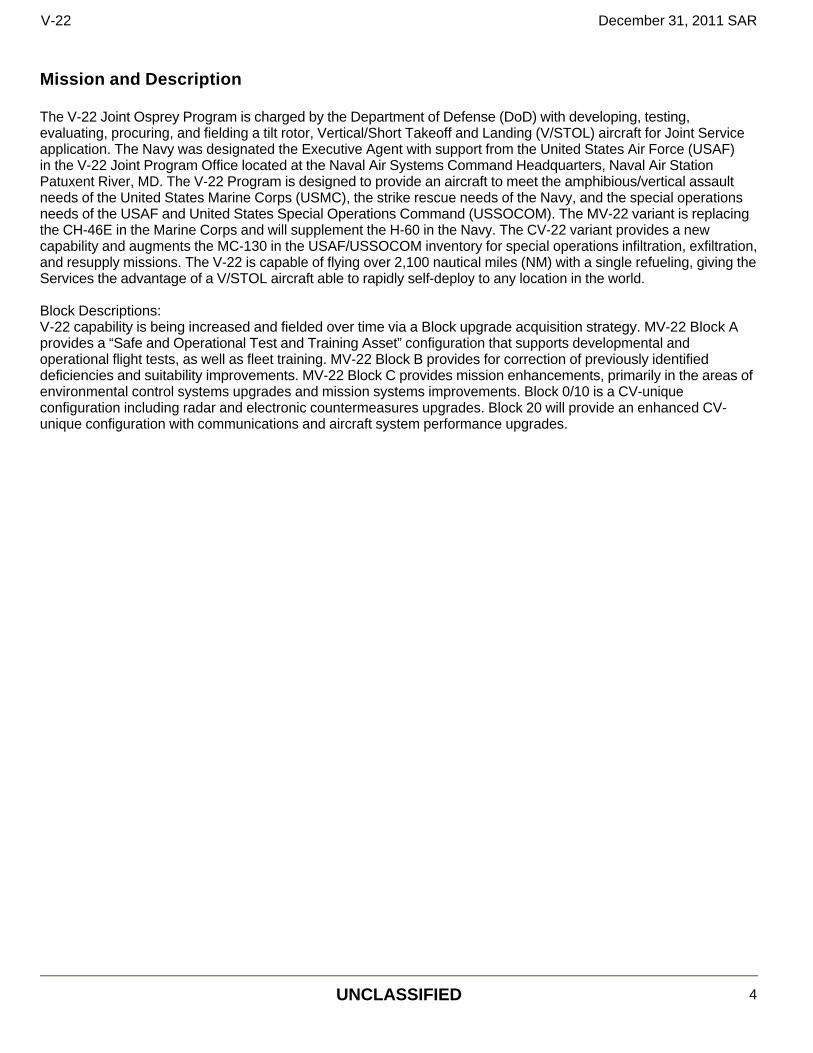
Mission and Description The V-22 Joint Osprey Program is charged by the Department of Defense (DoD) with developing, testing, evaluating, procuring, and fielding a tilt rotor, Vertical/Short Takeoff and Landing (V/STOL) aircraft for Joint Service application. The Navy was designated the Executive Agent with support from the United States Air Force (USAF) in the V-22 Joint Program Office located at the Naval Air Systems Command Headquarters, Naval Air Station Patuxent River, MD. The V-22 Program is designed to provide an aircraft to meet the amphibious/vertical assault needs of the United States Marine Corps (USMC), the strike rescue needs of the Navy, and the special operations needs of the USAF and United States Special Operations Command (USSOCOM). The MV-22 variant is replacing the CH-46E in the Marine Corps and will supplement the H-60 in the Navy. The CV-22 variant provides a new capability and augments the MC-130 in the USAF/USSOCOM inventory for special operations infiltration, exfiltration, and resupply missions. The V-22 is capable of flying over 2,100 nautical miles (NM) with a single refueling, giving the Services the advantage of a V/STOL aircraft able to rapidly self-deploy to any location in the world. Block Descriptions: V-22 capability is being increased and fielded over time via a Block upgrade acquisition strategy. MV-22 Block A provides a “Safe and Operational Test and Training Asset” configuration that supports developmental and operational flight tests, as well as fleet training. MV-22 Block B provides for correction of previously identified deficiencies and suitability improvements. MV-22 Block C provides mission enhancements, primarily in the areas of environmental control systems upgrades and mission systems improvements. Block 0/10 is a CV-unique configuration including radar and electronic countermeasures upgrades. Block 20 will provide an enhanced CV-unique configuration with communications and aircraft system performance upgrades.
V-22 December 31, 2011 SAR
UNCLASSIFIED 4

Executive Summary The V-22 Osprey continues to meet all Key Performance Parameters and excel operationally as it matures into its lifecycle. East coast transition is complete with six MV-22 operational squadrons and one CV-22 operational squadron established at Marine Corps Air Station New River, NC and Hurlburt Field, FL respectively (the MV-22 variant is replacing the CH-46E in the Marine Corps and will supplement the H-60 in the Navy, and the CV-22 variant provides a new capability and augments the MC-130 in the United States Air Force/United States Special Operations Command inventory). The program continues its expansion on the west coast with five MV squadrons at Marine Corps Air Station Miramar, CA and one CV-22 squadron at Cannon Air Force Base, NM now operational. The two services now have numerous consecutive and highly-successful deployments to their credit, including Operation Iraqi Freedom, Operation Enduring Freedom, operations in South America, operations in Africa, and amphibious operations with Marine Expeditionary Units (MEUs). The fleet exceeded 100,000 flight hours in February 2011 and finished the year at nearly 130,000; 62% of these total hours have been flown in the last three years.
As the platform continues to excel operationally, the program is working aggressively to both improve readiness and reduce operating costs. These efforts are yielding positive results. The program’s FY 2011 Cost per Flying Hour (CPFH) continued its positive downward trend, finishing 13% below the actual FY 2010 CPFH. The Mission Capability (MC) rate improved by 19% above the FY 2010 rate. These improvements are being achieved through team execution of a comprehensive plan, which has included reliability and maintainability improvements, maintenance concept changes, standup of additional repair capability, improved repair turnaround times, repair price reductions, and contract strategy changes. The program was presented the Defense Department’s 2011 David Packard Excellence in Acquisition Award for its CPFH reduction efforts.
The program has funded the final year of a five year Multi-Year Procurement (MYP) contract, covering FY 2008 - FY 2012. Thirty-four V-22s (28 MV-22/six CV-22) were delivered from the production line during Calendar Year (CY) 2011. Production deliveries continue to be on or ahead of schedule, with underruns being realized from efforts such as the implementation of cost reduction initiatives and strategic business alliances with sub-vendors. The program is preparing for a second MYP contract which, upon approval, will cover aircraft purchases from FY 2013 - FY 2017. Program budgets for these years currently reflect the significant savings of a multi-year contract approach.
Development efforts continue to progress well. MV-22 Block C flight testing at Patuxent River completed in September 2011 with no major issues identified. The first Block C aircraft delivered in January 2012. CV-22 Block 20 flight testing continues at Hurlburt Field, FL, with concentration on Terrain Following and Terrain Avoidance capabilities. The first aircraft with Block 20 capabilities delivered in December 2011 to the Air Force test community. Follow-on test and evaluation for fielded aircraft continues to emphasize increasing component Time on Wing (TOW). In November, the follow-on operational test was completed for the biannual software suite as well as formal test of the Interim Defensive Weapon System and other hardware. The planned software suite brings increased performance via increased gross weight capability in addition to improved handling qualities and enhanced built-in test indications. The productivity of our test program continues to be a challenge, as our primary test asset is several configurations removed from the current production configuration. The program is on track to replace the only fully instrumented V-22 test aircraft, with contract award expected in 2012.
On the international front, the Israeli Air Force conducted several weeks of training and flight evaluation on the MV-22 Osprey, with follow-on information exchanges ongoing. Additionally, Canada requested information for its Fixed-Wing Search and Rescue (FWSAR) requirement. The MV-22 Osprey made its first appearance at the United Arab Emirates (UAE) Dubai Air Show, generating considerable interest and multiple follow-on briefs and demonstrations. Finally, the MV-22 flight clearance was increased to include French National Mistral Class Ships. Domestically, in support of the US Navy V-22s in the V-22 Acquisition Program of Record, Naval Air Systems Command (NAVAIR) has issued Flight Clearances for MV-22 and CV-22 aircraft to operate on United States Navy Aircraft Carriers.
V-22 December 31, 2011 SAR
UNCLASSIFIED 5

There are no significant software-related issues with this program at this time.
V-22 December 31, 2011 SAR
UNCLASSIFIED 6
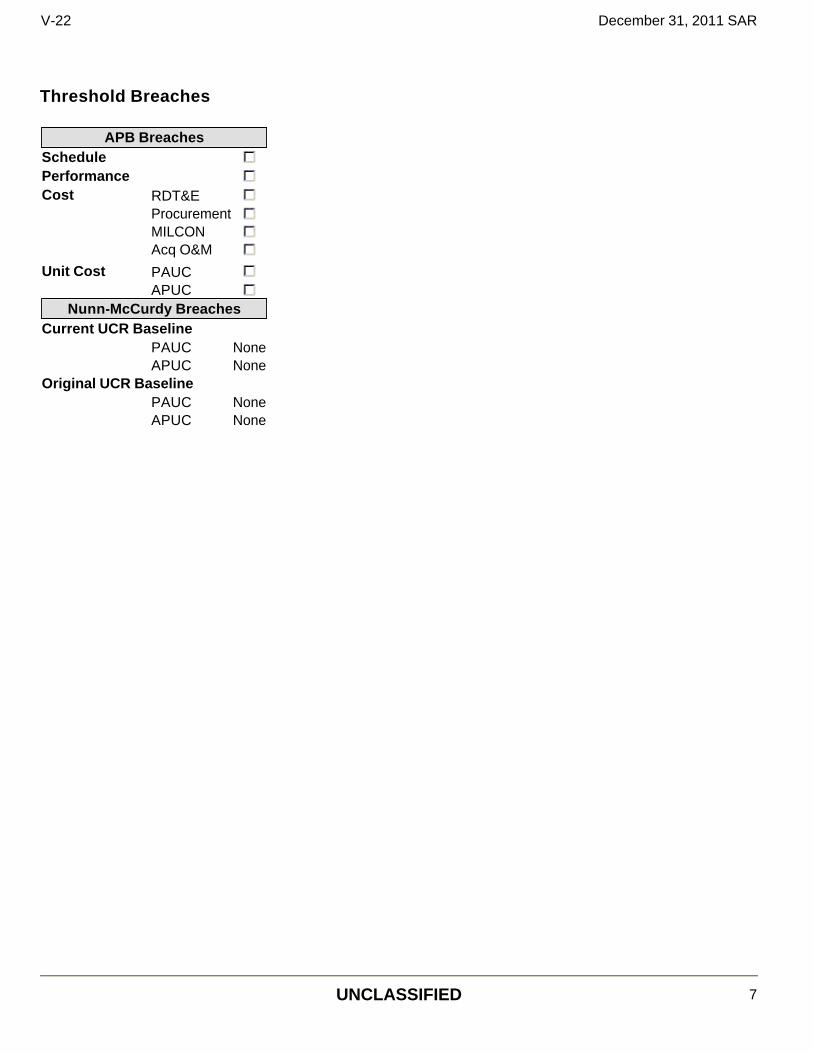
Threshold Breaches
APB Breaches Schedule Performance Cost RDT&E
Procurement MILCON Acq O&M
Unit Cost PAUC APUC
Nunn-McCurdy Breaches Current UCR Baseline
PAUC NoneAPUC None
Original UCR Baseline PAUC NoneAPUC None
V-22 December 31, 2011 SAR
UNCLASSIFIED 7

Schedule
V-22 December 31, 2011 SAR
UNCLASSIFIED 8
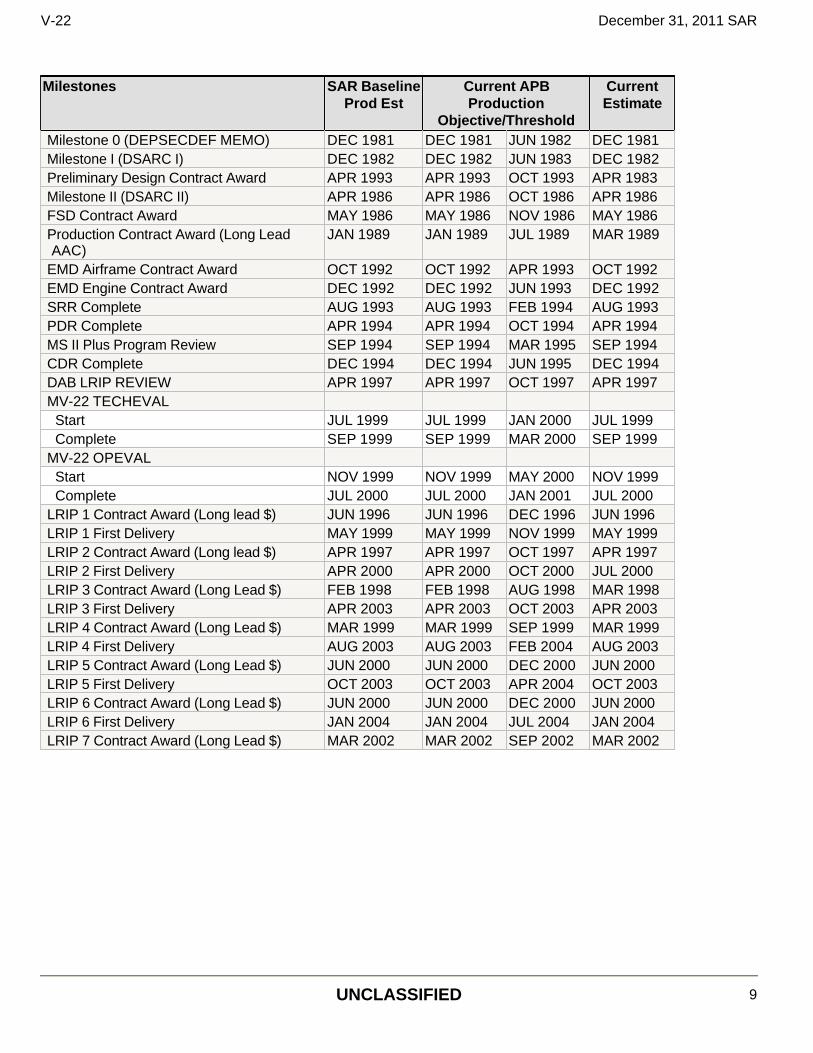
Milestones SAR Baseline Prod Est
Current APB Production
Objective/Threshold
Current Estimate
Milestone 0 (DEPSECDEF MEMO) DEC 1981 DEC 1981 JUN 1982 DEC 1981Milestone I (DSARC I) DEC 1982 DEC 1982 JUN 1983 DEC 1982Preliminary Design Contract Award APR 1993 APR 1993 OCT 1993 APR 1983Milestone II (DSARC II) APR 1986 APR 1986 OCT 1986 APR 1986FSD Contract Award MAY 1986 MAY 1986 NOV 1986 MAY 1986Production Contract Award (Long Lead AAC)
JAN 1989 JAN 1989 JUL 1989 MAR 1989
EMD Airframe Contract Award OCT 1992 OCT 1992 APR 1993 OCT 1992EMD Engine Contract Award DEC 1992 DEC 1992 JUN 1993 DEC 1992SRR Complete AUG 1993 AUG 1993 FEB 1994 AUG 1993PDR Complete APR 1994 APR 1994 OCT 1994 APR 1994MS II Plus Program Review SEP 1994 SEP 1994 MAR 1995 SEP 1994CDR Complete DEC 1994 DEC 1994 JUN 1995 DEC 1994DAB LRIP REVIEW APR 1997 APR 1997 OCT 1997 APR 1997MV-22 TECHEVAL
Start JUL 1999 JUL 1999 JAN 2000 JUL 1999Complete SEP 1999 SEP 1999 MAR 2000 SEP 1999
MV-22 OPEVAL Start NOV 1999 NOV 1999 MAY 2000 NOV 1999Complete JUL 2000 JUL 2000 JAN 2001 JUL 2000
LRIP 1 Contract Award (Long lead $) JUN 1996 JUN 1996 DEC 1996 JUN 1996LRIP 1 First Delivery MAY 1999 MAY 1999 NOV 1999 MAY 1999LRIP 2 Contract Award (Long lead $) APR 1997 APR 1997 OCT 1997 APR 1997LRIP 2 First Delivery APR 2000 APR 2000 OCT 2000 JUL 2000LRIP 3 Contract Award (Long Lead $) FEB 1998 FEB 1998 AUG 1998 MAR 1998LRIP 3 First Delivery APR 2003 APR 2003 OCT 2003 APR 2003LRIP 4 Contract Award (Long Lead $) MAR 1999 MAR 1999 SEP 1999 MAR 1999LRIP 4 First Delivery AUG 2003 AUG 2003 FEB 2004 AUG 2003LRIP 5 Contract Award (Long Lead $) JUN 2000 JUN 2000 DEC 2000 JUN 2000LRIP 5 First Delivery OCT 2003 OCT 2003 APR 2004 OCT 2003LRIP 6 Contract Award (Long Lead $) JUN 2000 JUN 2000 DEC 2000 JUN 2000LRIP 6 First Delivery JAN 2004 JAN 2004 JUL 2004 JAN 2004LRIP 7 Contract Award (Long Lead $) MAR 2002 MAR 2002 SEP 2002 MAR 2002
V-22 December 31, 2011 SAR
UNCLASSIFIED 9
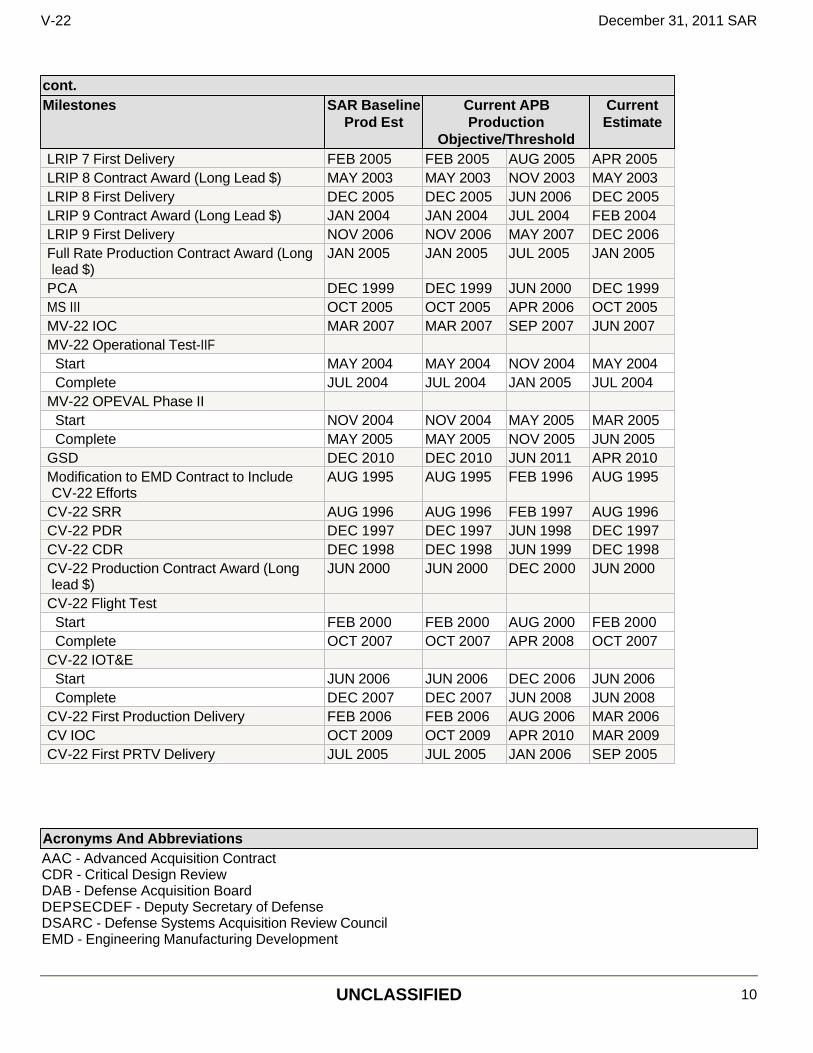
cont.Milestones SAR Baseline
Prod Est Current APB Production
Objective/Threshold
Current Estimate
LRIP 7 First Delivery FEB 2005 FEB 2005 AUG 2005 APR 2005LRIP 8 Contract Award (Long Lead $) MAY 2003 MAY 2003 NOV 2003 MAY 2003LRIP 8 First Delivery DEC 2005 DEC 2005 JUN 2006 DEC 2005LRIP 9 Contract Award (Long Lead $) JAN 2004 JAN 2004 JUL 2004 FEB 2004LRIP 9 First Delivery NOV 2006 NOV 2006 MAY 2007 DEC 2006Full Rate Production Contract Award (Long lead $)
JAN 2005 JAN 2005 JUL 2005 JAN 2005
PCA DEC 1999 DEC 1999 JUN 2000 DEC 1999MS III OCT 2005 OCT 2005 APR 2006 OCT 2005MV-22 IOC MAR 2007 MAR 2007 SEP 2007 JUN 2007MV-22 Operational Test-IIF
Start MAY 2004 MAY 2004 NOV 2004 MAY 2004Complete JUL 2004 JUL 2004 JAN 2005 JUL 2004
MV-22 OPEVAL Phase II Start NOV 2004 NOV 2004 MAY 2005 MAR 2005Complete MAY 2005 MAY 2005 NOV 2005 JUN 2005
GSD DEC 2010 DEC 2010 JUN 2011 APR 2010Modification to EMD Contract to Include CV-22 Efforts
AUG 1995 AUG 1995 FEB 1996 AUG 1995
CV-22 SRR AUG 1996 AUG 1996 FEB 1997 AUG 1996CV-22 PDR DEC 1997 DEC 1997 JUN 1998 DEC 1997CV-22 CDR DEC 1998 DEC 1998 JUN 1999 DEC 1998CV-22 Production Contract Award (Long lead $)
JUN 2000 JUN 2000 DEC 2000 JUN 2000
CV-22 Flight Test Start FEB 2000 FEB 2000 AUG 2000 FEB 2000Complete OCT 2007 OCT 2007 APR 2008 OCT 2007
CV-22 IOT&E Start JUN 2006 JUN 2006 DEC 2006 JUN 2006Complete DEC 2007 DEC 2007 JUN 2008 JUN 2008
CV-22 First Production Delivery FEB 2006 FEB 2006 AUG 2006 MAR 2006CV IOC OCT 2009 OCT 2009 APR 2010 MAR 2009CV-22 First PRTV Delivery JUL 2005 JUL 2005 JAN 2006 SEP 2005
Acronyms And Abbreviations AAC - Advanced Acquisition Contract CDR - Critical Design Review DAB - Defense Acquisition Board DEPSECDEF - Deputy Secretary of Defense DSARC - Defense Systems Acquisition Review Council EMD - Engineering Manufacturing Development
V-22 December 31, 2011 SAR
UNCLASSIFIED 10

FSD - Full Scale Development GSD - Government Support Date IOC - Initial Operational Capability IOT&E - Initial Operational Test and Evaluation LRIP - Low Rate Initial Production MS - Milestone OPEVAL - Operational Evaluation PCA - Physical Configuration Audit PDR - Program Design Review PRTV - Production Representative Test Vehicle SRR - System Requirements Review TECHEVAL - Technical Evaluation
Change Explanations None
V-22 December 31, 2011 SAR
UNCLASSIFIED 11

Performance Characteristics SAR Baseline
Prod Est Current APB Production
Objective/Threshold
Demonstrated Performance
Current Estimate
MV-22 Interoperability Satisfy all
top level IE Rs
Satisfy all top level IERs
Satisfy all top level IERS designated as critical
Satisfy all top level IERs designated as critical
Satisfy all top level IERs designated as critical
Cruise Speed (kts) 270 270 240 255 281 (Ch-1)
Mission Radius (NM) Land Trooplift 200X1 200X1 200X1 210x1 218x1 (Ch-1)
Land External 110X1 110X1 50X1 69x1 52x1 (Ch-1)
Sea Trooplift 110X2 110X2 50X2 53x2 98x2 (Ch-1)
Sea External 110X1 110X1 50X1 89x1 112x1 (Ch-1)
Amphibious Pre-Assault/Raid Ops (NM)
200X1 200X1 200X1 230x1 315x1 (Ch-1)
Payload Troops 24 24 24 24 24External Lift (lbs) 15,000 15,000 10,000 10,000 12,500 (Ch-1)
Aerial Refuel Capable yes yes yes yes yesSelf-Deployment (nm) 2100 w/no
refuel 2100 w/no refuel
2100 w/1 refuel
2660 w/1 ariel refuel
2229 w/1 aerial refuel
(Ch-1)
Shipboard Compatible
yes yes yes yes yes
V/STOL Capable yes yes yes yes yesSurvivability (mm API @90%vel)
14.5 14.5 12.7 classified classified
Reliability MFHBF (log) >=1.2 >=1.2 >=0.9 1.3 >=1.4 (Ch-1)
MFHBA 17 Hrs 17 Hrs 17 Hrs 21.2 28 (Ch-1)
CV-22 Interoperability Satisfy all
top level IE Rs
Satisfy all top level IERs
Satisfy all top level IERs designated as critical
Satisfy all top level IERs designated as critical
Satisfy all top level IERs designated as critical
Cruise Speed (kts) 270 270 230 264 256 (Ch-1)
Mission Radius (nm) 750 750 500 538 558 (Ch-1)
Payload - Troops 24 24 18 18 18Aerial Refuel Capable yes yes yes yes yesSelf-Deployment (nm) 2100 w/0
aerial refuel 2100 w/0 aerial refuel
2100 w/1 aerial refuel
2144 w/1 aerial refuel
2144 w/1 aerial refuel
Shipboard yes yes yes yes yes
V-22 December 31, 2011 SAR
UNCLASSIFIED 12

Requirements Source: Capabilities Production Document (CPD), dated September 1, 2010.
Compatible Operational Environment
100' TF/TA, Day/Night, VMC/IMC
100' TF/TA, Day/Night, VMC/IMC
300' TF/TA, Day/Night, VMC/IMC
100' TF/TA, Day/Night, VMC/IMC
100' TF/TA, Day/Night, VMC/IMC
Precision Navigation (diameter @ MAX Combat Radius)
Locate LZ W/IN 1 Rotor
Locate LZ W/IN 1 Rotor
Locate LZ W/IN 2X Rotor
Locate LZ W/IN 2X Rotor
Locate LZ W/IN 2X Rotor
Operational Enviroment DECM SIRFC w/RF
Jamming DIRCM
SIRFC w/RF Jamming DIRCM
SIRFC w/RWR, MW, CMDS
SIRFC w/RF, Jamming DIRCM
SIRFC w/RF, Jamming DIRCM
MMR (TF/TA) 100 FT 100 FT 300 FT 100FT 100 FTReliability
MFHBF (LOG) >=1.2 >=1.2 >=0.9 1.2 >=1.4 (Ch-1)
MFHBA 15 Hrs 15 Hrs 15 Hrs 32 >=25 (Ch-1)
Acronyms And Abbreviations API - Armor Piercing Incendiary CMDS - Counter-Measures Dispenser System DECM - Defensive Electronic Countermeasure DIRCM - Directed Infrared Countermeasures Ft - Feet Hrs - Hours IERs - Information Exchange Requirements Kts - Knots Lbs - Pounds LZ w/IN - Landing Zone Within MAX - Maximum MFHBA - Mean Flight Hours Between Aborts MFHBF - Mean Flight Hours Between Failures mm - Millimeter MMR - Multi-Mode Radar MW - Missile Warning NM - Nautical Miles SIRFC - Suite of Integrated Radio Frequency Countermeasures TF/TA - Terrain Following/Terrain Avoidance V/STOL - Vertical/Short Takeoff and Landing vel - Velocity VMC/IMC - Visual Meteorological Conditions/Instrument Meteorological Conditions w/RF - with Radio Frequency w/RWR - with Radar Warning Receiver
Change Explanations (Ch-1) The current estimate values have changed based upon the V-22 Block C/20 performance predictions.
V-22 December 31, 2011 SAR
UNCLASSIFIED 13
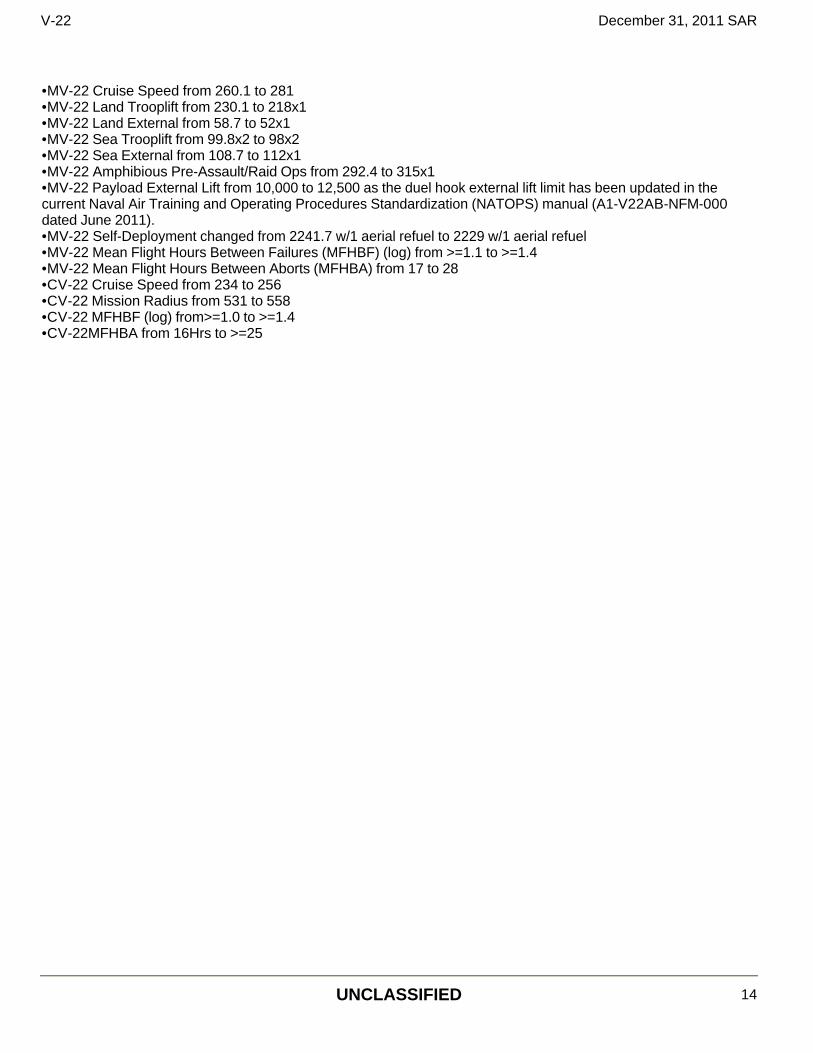
•MV-22 Cruise Speed from 260.1 to 281 •MV-22 Land Trooplift from 230.1 to 218x1 •MV-22 Land External from 58.7 to 52x1 •MV-22 Sea Trooplift from 99.8x2 to 98x2 •MV-22 Sea External from 108.7 to 112x1 •MV-22 Amphibious Pre-Assault/Raid Ops from 292.4 to 315x1 •MV-22 Payload External Lift from 10,000 to 12,500 as the duel hook external lift limit has been updated in the current Naval Air Training and Operating Procedures Standardization (NATOPS) manual (A1-V22AB-NFM-000 dated June 2011). •MV-22 Self-Deployment changed from 2241.7 w/1 aerial refuel to 2229 w/1 aerial refuel •MV-22 Mean Flight Hours Between Failures (MFHBF) (log) from >=1.1 to >=1.4 •MV-22 Mean Flight Hours Between Aborts (MFHBA) from 17 to 28 •CV-22 Cruise Speed from 234 to 256 •CV-22 Mission Radius from 531 to 558 •CV-22 MFHBF (log) from>=1.0 to >=1.4 •CV-22MFHBA from 16Hrs to >=25
V-22 December 31, 2011 SAR
UNCLASSIFIED 14
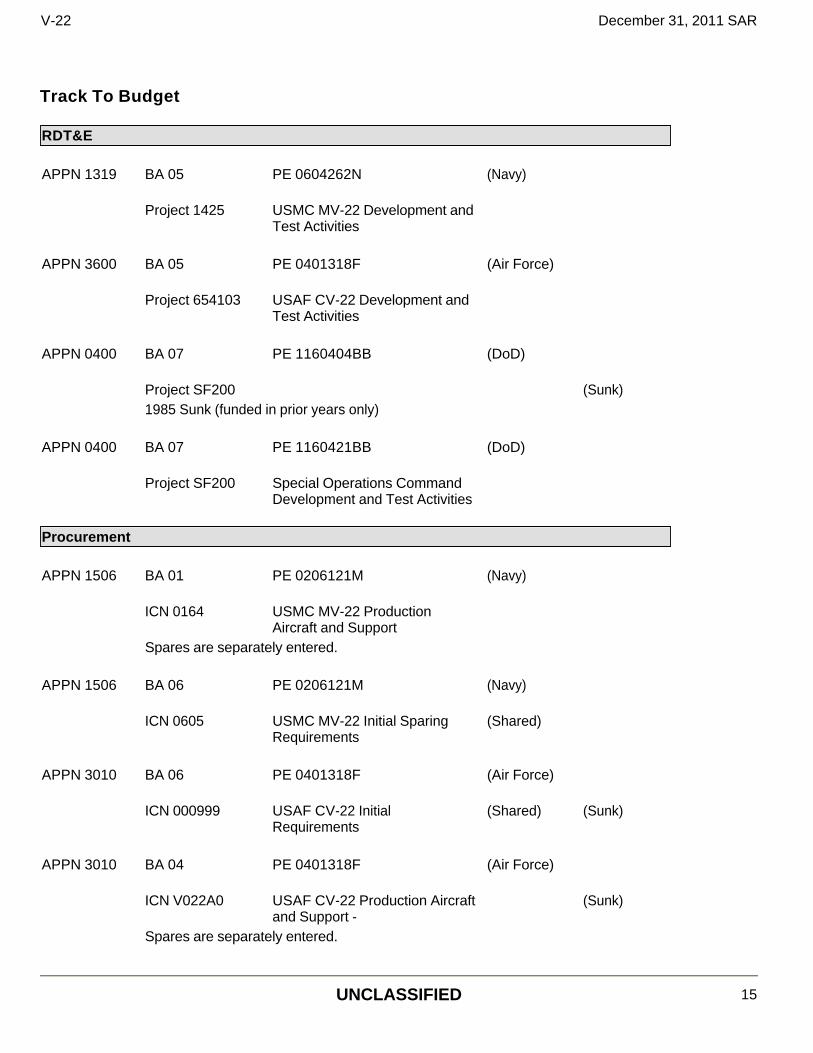
Track To Budget RDT&E APPN 1319 BA 05 PE 0604262N (Navy)
Project 1425 USMC MV-22 Development and Test Activities
APPN 3600 BA 05 PE 0401318F (Air Force)
Project 654103 USAF CV-22 Development and Test Activities
APPN 0400 BA 07 PE 1160404BB (DoD) Project SF200 (Sunk) 1985 Sunk (funded in prior years only) APPN 0400 BA 07 PE 1160421BB (DoD)
Project SF200 Special Operations Command Development and Test Activities
Procurement APPN 1506 BA 01 PE 0206121M (Navy)
ICN 0164 USMC MV-22 Production Aircraft and Support
Spares are separately entered. APPN 1506 BA 06 PE 0206121M (Navy)
ICN 0605 USMC MV-22 Initial Sparing Requirements
(Shared)
APPN 3010 BA 06 PE 0401318F (Air Force)
ICN 000999 USAF CV-22 Initial Requirements
(Shared) (Sunk)
APPN 3010 BA 04 PE 0401318F (Air Force)
ICN V022A0 USAF CV-22 Production Aircraft and Support -
(Sunk)
Spares are separately entered.
V-22 December 31, 2011 SAR
UNCLASSIFIED 15
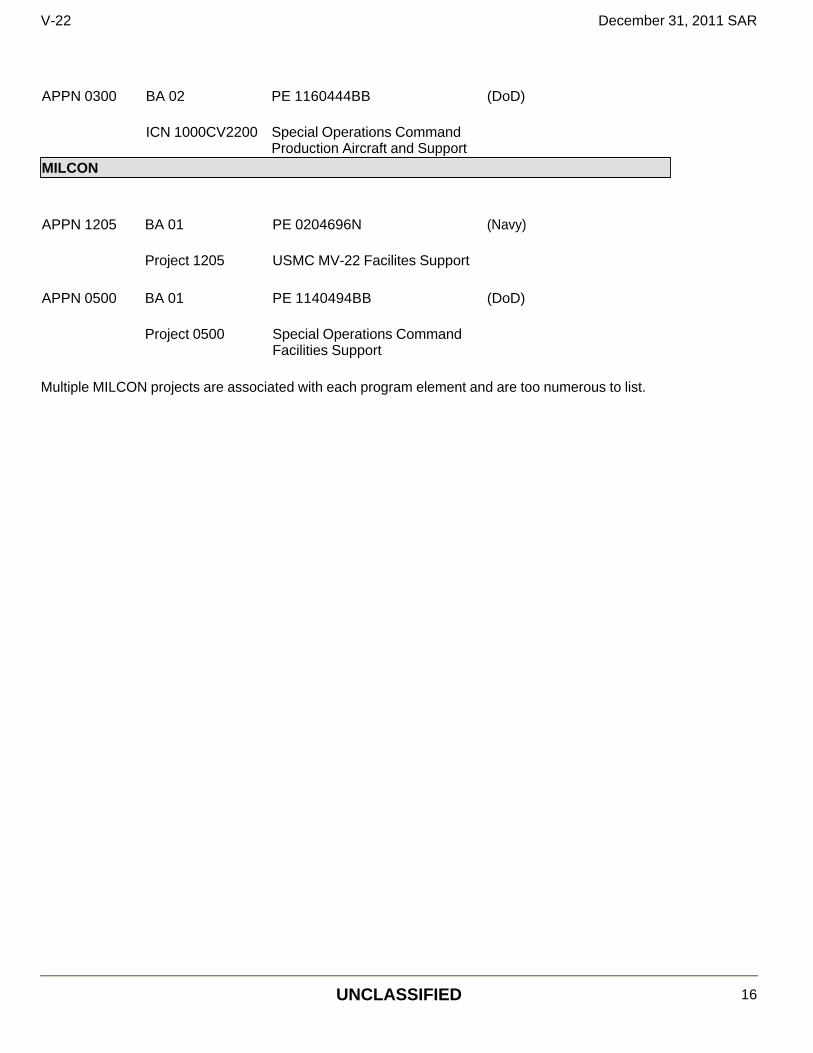
APPN 0300 BA 02 PE 1160444BB (DoD)
ICN 1000CV2200 Special Operations Command Production Aircraft and Support
MILCON APPN 1205 BA 01 PE 0204696N (Navy) Project 1205 USMC MV-22 Facilites Support APPN 0500 BA 01 PE 1140494BB (DoD)
Project 0500 Special Operations Command Facilities Support
Multiple MILCON projects are associated with each program element and are too numerous to list.
V-22 December 31, 2011 SAR
UNCLASSIFIED 16
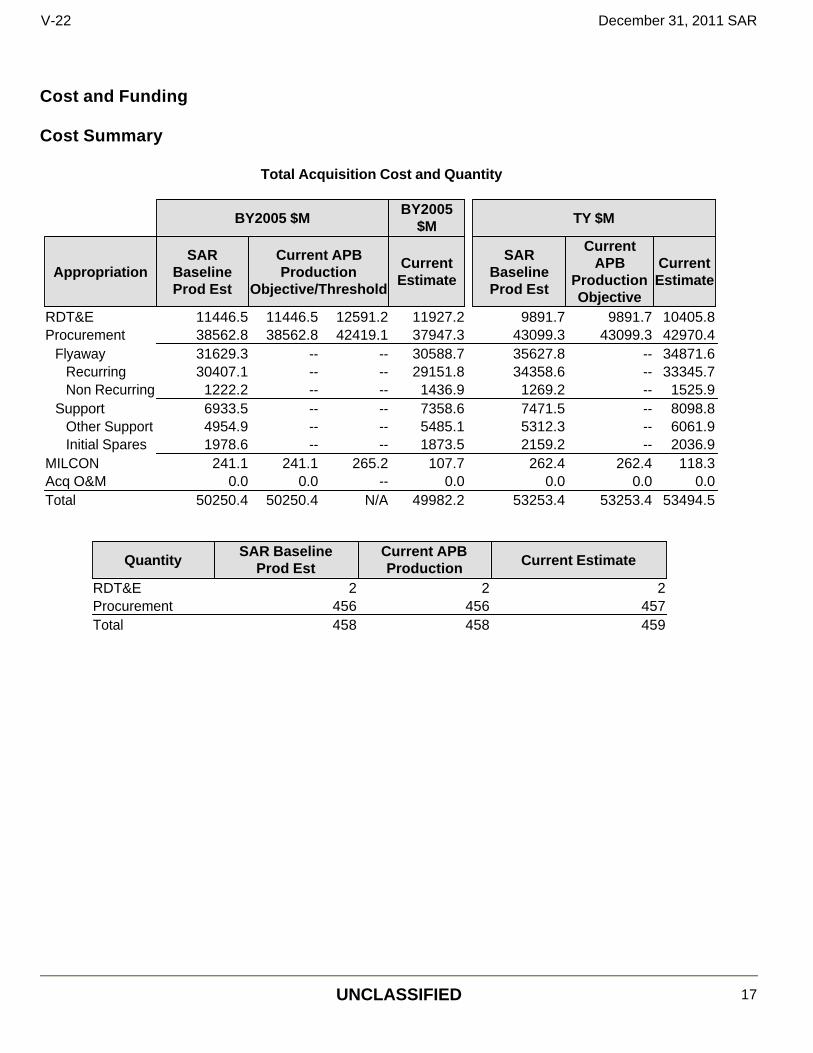
Cost and Funding Cost Summary
Total Acquisition Cost and Quantity
BY2005 $MBY2005
$M TY $M
AppropriationSAR
Baseline Prod Est
Current APB Production
Objective/Threshold
Current Estimate
SAR Baseline Prod Est
Current APB
Production Objective
Current Estimate
RDT&E 11446.5 11446.5 12591.2 11927.2 9891.7 9891.7 10405.8Procurement 38562.8 38562.8 42419.1 37947.3 43099.3 43099.3 42970.4
Flyaway 31629.3 -- -- 30588.7 35627.8 -- 34871.6Recurring 30407.1 -- -- 29151.8 34358.6 -- 33345.7Non Recurring 1222.2 -- -- 1436.9 1269.2 -- 1525.9
Support 6933.5 -- -- 7358.6 7471.5 -- 8098.8Other Support 4954.9 -- -- 5485.1 5312.3 -- 6061.9Initial Spares 1978.6 -- -- 1873.5 2159.2 -- 2036.9
MILCON 241.1 241.1 265.2 107.7 262.4 262.4 118.3Acq O&M 0.0 0.0 -- 0.0 0.0 0.0 0.0Total 50250.4 50250.4 N/A 49982.2 53253.4 53253.4 53494.5
QuantitySAR Baseline
Prod EstCurrent APB Production Current Estimate
RDT&E 2 2 2Procurement 456 456 457Total 458 458 459
V-22 December 31, 2011 SAR
UNCLASSIFIED 17
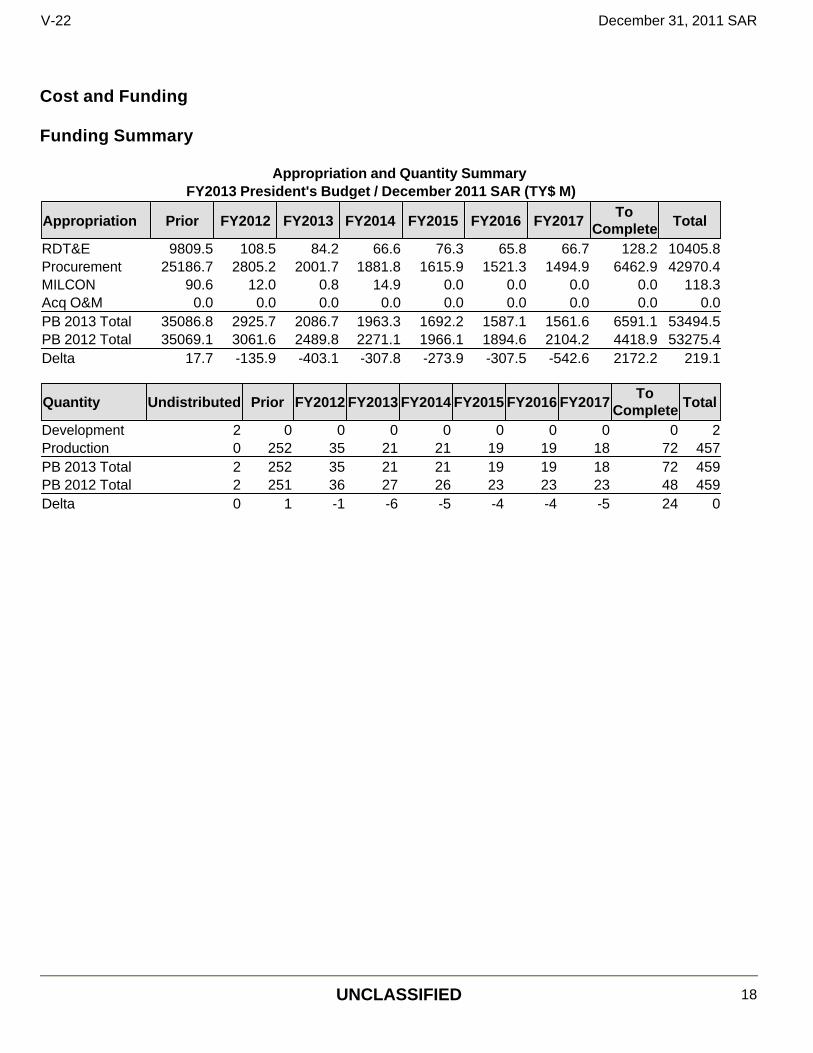
Cost and Funding Funding Summary
Appropriation and Quantity Summary FY2013 President's Budget / December 2011 SAR (TY$ M)
Appropriation Prior FY2012 FY2013 FY2014 FY2015 FY2016 FY2017To
Complete Total
RDT&E 9809.5 108.5 84.2 66.6 76.3 65.8 66.7 128.2 10405.8Procurement 25186.7 2805.2 2001.7 1881.8 1615.9 1521.3 1494.9 6462.9 42970.4MILCON 90.6 12.0 0.8 14.9 0.0 0.0 0.0 0.0 118.3Acq O&M 0.0 0.0 0.0 0.0 0.0 0.0 0.0 0.0 0.0PB 2013 Total 35086.8 2925.7 2086.7 1963.3 1692.2 1587.1 1561.6 6591.1 53494.5PB 2012 Total 35069.1 3061.6 2489.8 2271.1 1966.1 1894.6 2104.2 4418.9 53275.4Delta 17.7 -135.9 -403.1 -307.8 -273.9 -307.5 -542.6 2172.2 219.1
Quantity Undistributed Prior FY2012 FY2013 FY2014 FY2015 FY2016 FY2017To
Complete Total
Development 2 0 0 0 0 0 0 0 0 2Production 0 252 35 21 21 19 19 18 72 457PB 2013 Total 2 252 35 21 21 19 19 18 72 459PB 2012 Total 2 251 36 27 26 23 23 23 48 459Delta 0 1 -1 -6 -5 -4 -4 -5 24 0
V-22 December 31, 2011 SAR
UNCLASSIFIED 18

Cost and Funding Annual Funding By Appropriation Annual Funding TY$ 1319 | RDT&E | Research, Development, Test, and Evaluation, Navy
Fiscal Year
Quantity
End Item Recurring Flyaway
TY $M
Non End Item
Recurring Flyaway
TY $M
Non Recurring Flyaway TY $M
Total Flyaway TY $M
Total Support TY $M
Total Program
TY $M
1982 -- -- -- -- -- -- 0.71983 -- -- -- -- -- -- 34.41984 -- -- -- -- -- -- 83.11985 -- -- -- -- -- -- 169.51986 -- -- -- -- -- -- 525.11987 -- -- -- -- -- -- 421.71988 -- -- -- -- -- -- 404.81989 -- -- -- -- -- -- 269.91990 -- -- -- -- -- -- 204.21991 -- -- -- -- -- -- 212.21992 -- -- -- -- -- -- 758.01993 -- -- -- -- -- -- 713.31994 -- -- -- -- -- -- 8.71995 -- -- -- -- -- -- 451.81996 -- -- -- -- -- -- 716.41997 -- -- -- -- -- -- 605.51998 -- -- -- -- -- -- 487.51999 -- -- -- -- -- -- 335.82000 -- -- -- -- -- -- 175.92001 -- -- -- -- -- -- 217.92002 -- -- -- -- -- -- 391.62003 -- -- -- -- -- -- 387.42004 -- -- -- -- -- -- 357.22005 -- -- -- -- -- -- 248.22006 -- -- -- -- -- -- 192.32007 -- -- -- -- -- -- 251.62008 -- -- -- -- -- -- 125.22009 -- -- -- -- -- -- 66.02010 -- -- -- -- -- -- 78.92011 -- -- -- -- -- -- 42.72012 -- -- -- -- -- -- 84.52013 -- -- -- -- -- -- 54.42014 -- -- -- -- -- -- 40.32015 -- -- -- -- -- -- 54.92016 -- -- -- -- -- -- 51.12017 -- -- -- -- -- -- 52.2
V-22 December 31, 2011 SAR
UNCLASSIFIED 19

2018 -- -- -- -- -- -- 39.32019 -- -- -- -- -- -- 27.52020 -- -- -- -- -- -- 18.02021 -- -- -- -- -- -- 10.82022 -- -- -- -- -- -- 6.72023 -- -- -- -- -- -- 4.62024 -- -- -- -- -- -- 0.9
Subtotal -- -- -- -- -- -- 9382.7
V-22 December 31, 2011 SAR
UNCLASSIFIED 20

Annual Funding BY$ 1319 | RDT&E | Research, Development, Test, and Evaluation, Navy
Fiscal Year
Quantity
End Item Recurring Flyaway
BY 2005 $M
Non End Item
Recurring Flyaway
BY 2005 $M
Non Recurring Flyaway
BY 2005 $M
Total Flyaway
BY 2005 $M
Total Support
BY 2005 $M
Total Program
BY 2005 $M
1982 -- -- -- -- -- -- 1.21983 -- -- -- -- -- -- 56.71984 -- -- -- -- -- -- 132.11985 -- -- -- -- -- -- 261.31986 -- -- -- -- -- -- 786.91987 -- -- -- -- -- -- 613.81988 -- -- -- -- -- -- 570.11989 -- -- -- -- -- -- 364.71990 -- -- -- -- -- -- 265.11991 -- -- -- -- -- -- 266.01992 -- -- -- -- -- -- 923.21993 -- -- -- -- -- -- 849.11994 -- -- -- -- -- -- 10.21995 -- -- -- -- -- -- 517.91996 -- -- -- -- -- -- 807.61997 -- -- -- -- -- -- 674.31998 -- -- -- -- -- -- 538.51999 -- -- -- -- -- -- 366.62000 -- -- -- -- -- -- 189.32001 -- -- -- -- -- -- 231.32002 -- -- -- -- -- -- 411.52003 -- -- -- -- -- -- 401.22004 -- -- -- -- -- -- 359.92005 -- -- -- -- -- -- 243.72006 -- -- -- -- -- -- 183.12007 -- -- -- -- -- -- 233.82008 -- -- -- -- -- -- 114.32009 -- -- -- -- -- -- 59.52010 -- -- -- -- -- -- 70.02011 -- -- -- -- -- -- 37.22012 -- -- -- -- -- -- 72.32013 -- -- -- -- -- -- 45.82014 -- -- -- -- -- -- 33.42015 -- -- -- -- -- -- 44.62016 -- -- -- -- -- -- 40.82017 -- -- -- -- -- -- 40.92018 -- -- -- -- -- -- 30.32019 -- -- -- -- -- -- 20.82020 -- -- -- -- -- -- 13.42021 -- -- -- -- -- -- 7.92022 -- -- -- -- -- -- 4.8
V-22 December 31, 2011 SAR
UNCLASSIFIED 21
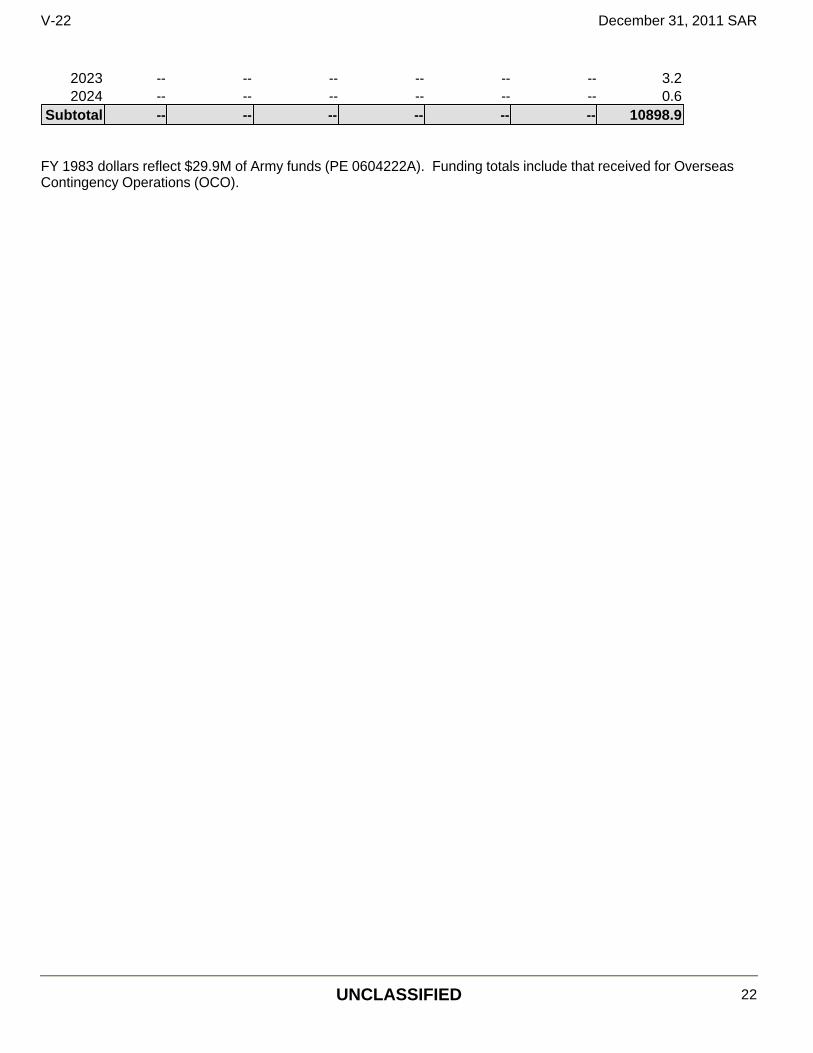
FY 1983 dollars reflect $29.9M of Army funds (PE 0604222A). Funding totals include that received for Overseas Contingency Operations (OCO).
2023 -- -- -- -- -- -- 3.22024 -- -- -- -- -- -- 0.6
Subtotal -- -- -- -- -- -- 10898.9
V-22 December 31, 2011 SAR
UNCLASSIFIED 22
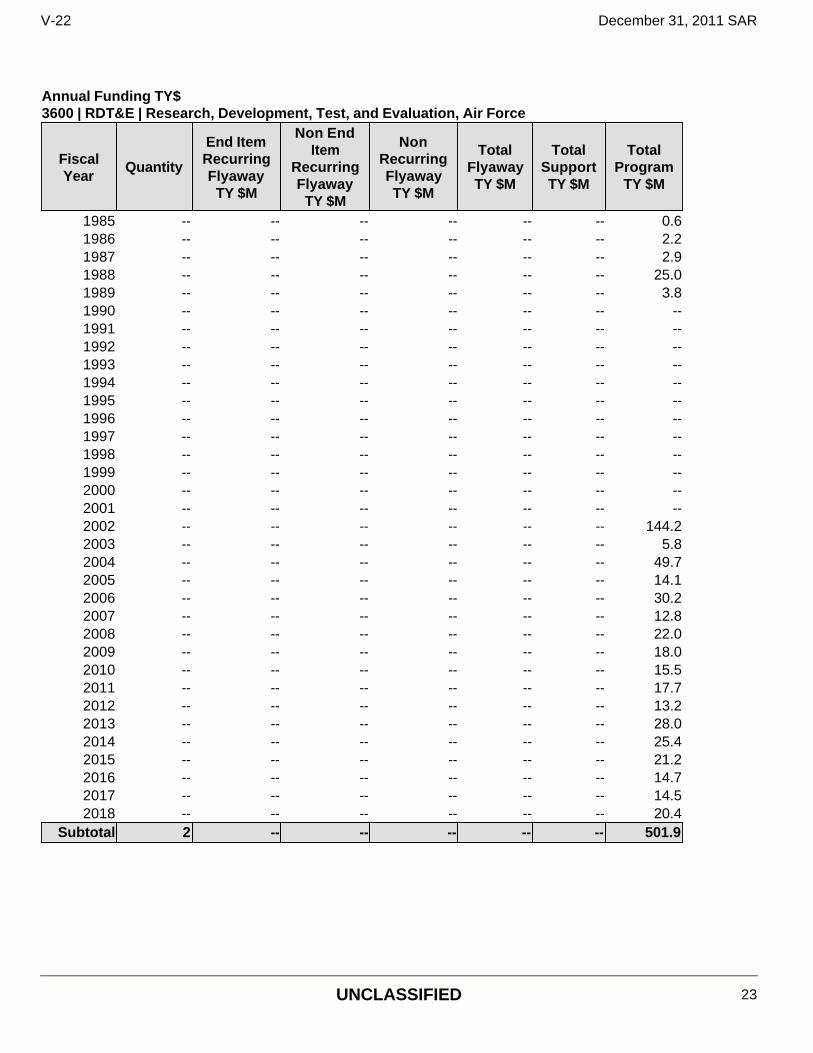
Annual Funding TY$ 3600 | RDT&E | Research, Development, Test, and Evaluation, Air Force
Fiscal Year
Quantity
End Item Recurring Flyaway
TY $M
Non End Item
Recurring Flyaway
TY $M
Non Recurring Flyaway TY $M
Total Flyaway TY $M
Total Support TY $M
Total Program
TY $M
1985 -- -- -- -- -- -- 0.61986 -- -- -- -- -- -- 2.21987 -- -- -- -- -- -- 2.91988 -- -- -- -- -- -- 25.01989 -- -- -- -- -- -- 3.81990 -- -- -- -- -- -- --1991 -- -- -- -- -- -- --1992 -- -- -- -- -- -- --1993 -- -- -- -- -- -- --1994 -- -- -- -- -- -- --1995 -- -- -- -- -- -- --1996 -- -- -- -- -- -- --1997 -- -- -- -- -- -- --1998 -- -- -- -- -- -- --1999 -- -- -- -- -- -- --2000 -- -- -- -- -- -- --2001 -- -- -- -- -- -- --2002 -- -- -- -- -- -- 144.22003 -- -- -- -- -- -- 5.82004 -- -- -- -- -- -- 49.72005 -- -- -- -- -- -- 14.12006 -- -- -- -- -- -- 30.22007 -- -- -- -- -- -- 12.82008 -- -- -- -- -- -- 22.02009 -- -- -- -- -- -- 18.02010 -- -- -- -- -- -- 15.52011 -- -- -- -- -- -- 17.72012 -- -- -- -- -- -- 13.22013 -- -- -- -- -- -- 28.02014 -- -- -- -- -- -- 25.42015 -- -- -- -- -- -- 21.22016 -- -- -- -- -- -- 14.72017 -- -- -- -- -- -- 14.52018 -- -- -- -- -- -- 20.4
Subtotal 2 -- -- -- -- -- 501.9
V-22 December 31, 2011 SAR
UNCLASSIFIED 23

The FY 2002 Appropriations Act provided funding for two CV Production Representative Test Vehicles.
Annual Funding BY$ 3600 | RDT&E | Research, Development, Test, and Evaluation, Air Force
Fiscal Year
Quantity
End Item Recurring Flyaway
BY 2005 $M
Non End Item
Recurring Flyaway
BY 2005 $M
Non Recurring Flyaway
BY 2005 $M
Total Flyaway
BY 2005 $M
Total Support
BY 2005 $M
Total Program
BY 2005 $M
1985 -- -- -- -- -- -- 0.91986 -- -- -- -- -- -- 3.31987 -- -- -- -- -- -- 4.21988 -- -- -- -- -- -- 35.01989 -- -- -- -- -- -- 5.11990 -- -- -- -- -- -- --1991 -- -- -- -- -- -- --1992 -- -- -- -- -- -- --1993 -- -- -- -- -- -- --1994 -- -- -- -- -- -- --1995 -- -- -- -- -- -- --1996 -- -- -- -- -- -- --1997 -- -- -- -- -- -- --1998 -- -- -- -- -- -- --1999 -- -- -- -- -- -- --2000 -- -- -- -- -- -- --2001 -- -- -- -- -- -- --2002 -- -- -- -- -- -- 151.62003 -- -- -- -- -- -- 6.02004 -- -- -- -- -- -- 50.32005 -- -- -- -- -- -- 13.92006 -- -- -- -- -- -- 28.92007 -- -- -- -- -- -- 11.92008 -- -- -- -- -- -- 20.12009 -- -- -- -- -- -- 16.22010 -- -- -- -- -- -- 13.82011 -- -- -- -- -- -- 15.52012 -- -- -- -- -- -- 11.32013 -- -- -- -- -- -- 23.62014 -- -- -- -- -- -- 21.12015 -- -- -- -- -- -- 17.32016 -- -- -- -- -- -- 11.82017 -- -- -- -- -- -- 11.42018 -- -- -- -- -- -- 15.8
Subtotal 2 -- -- -- -- -- 489.0
V-22 December 31, 2011 SAR
UNCLASSIFIED 24

Annual Funding TY$ 0400 | RDT&E | Research, Development, Test, and Evaluation, Defense-Wide
Fiscal Year
Quantity
End Item Recurring Flyaway
TY $M
Non End Item
Recurring Flyaway
TY $M
Non Recurring Flyaway TY $M
Total Flyaway TY $M
Total Support TY $M
Total Program
TY $M
1990 -- -- -- -- -- -- 36.11991 -- -- -- -- -- -- 8.01992 -- -- -- -- -- -- 15.01993 -- -- -- -- -- -- --1994 -- -- -- -- -- -- 14.71995 -- -- -- -- -- -- --1996 -- -- -- -- -- -- --1997 -- -- -- -- -- -- --1998 -- -- -- -- -- -- --1999 -- -- -- -- -- -- --2000 -- -- -- -- -- -- 33.52001 -- -- -- -- -- -- 40.12002 -- -- -- -- -- -- 104.12003 -- -- -- -- -- -- 32.22004 -- -- -- -- -- -- 68.42005 -- -- -- -- -- -- 53.12006 -- -- -- -- -- -- 23.72007 -- -- -- -- -- -- --2008 -- -- -- -- -- -- 21.92009 -- -- -- -- -- -- 30.52010 -- -- -- -- -- -- 12.22011 -- -- -- -- -- -- 14.02012 -- -- -- -- -- -- 10.82013 -- -- -- -- -- -- 1.82014 -- -- -- -- -- -- 0.92015 -- -- -- -- -- -- 0.2
Subtotal -- -- -- -- -- -- 521.2
V-22 December 31, 2011 SAR
UNCLASSIFIED 25

Annual Funding BY$ 0400 | RDT&E | Research, Development, Test, and Evaluation, Defense-Wide
Fiscal Year
Quantity
End Item Recurring Flyaway
BY 2005 $M
Non End Item
Recurring Flyaway
BY 2005 $M
Non Recurring Flyaway
BY 2005 $M
Total Flyaway
BY 2005 $M
Total Support
BY 2005 $M
Total Program
BY 2005 $M
1990 -- -- -- -- -- -- 46.91991 -- -- -- -- -- -- 10.01992 -- -- -- -- -- -- 18.21993 -- -- -- -- -- -- --1994 -- -- -- -- -- -- 17.21995 -- -- -- -- -- -- --1996 -- -- -- -- -- -- --1997 -- -- -- -- -- -- --1998 -- -- -- -- -- -- --1999 -- -- -- -- -- -- --2000 -- -- -- -- -- -- 36.02001 -- -- -- -- -- -- 42.52002 -- -- -- -- -- -- 109.32003 -- -- -- -- -- -- 33.32004 -- -- -- -- -- -- 69.12005 -- -- -- -- -- -- 52.12006 -- -- -- -- -- -- 22.62007 -- -- -- -- -- -- --2008 -- -- -- -- -- -- 20.02009 -- -- -- -- -- -- 27.52010 -- -- -- -- -- -- 10.82011 -- -- -- -- -- -- 12.22012 -- -- -- -- -- -- 9.22013 -- -- -- -- -- -- 1.52014 -- -- -- -- -- -- 0.72015 -- -- -- -- -- -- 0.2
Subtotal -- -- -- -- -- -- 539.3
V-22 December 31, 2011 SAR
UNCLASSIFIED 26

Annual Funding TY$ 1506 | Procurement | Aircraft Procurement, Navy
Fiscal Year
Quantity
End Item Recurring Flyaway
TY $M
Non End Item
Recurring Flyaway
TY $M
Non Recurring Flyaway TY $M
Total Flyaway TY $M
Total Support TY $M
Total Program
TY $M
1989 -- -- -- -- -- 231.4 231.41990 -- -- -- -- -- -- --1991 -- -- -- -- -- -- --1992 -- -- -- -- -- -- --1993 -- -- -- -- -- -- --1994 -- -- -- -- -- -- --1995 -- -- -- -- -- -- --1996 -- 41.1 -- -- 41.1 -- 41.11997 5 541.8 -- 55.7 597.5 111.9 709.41998 7 604.9 -- 21.9 626.8 81.9 708.71999 7 560.6 -- 23.4 584.0 99.5 683.52000 11 769.9 -- 29.3 799.2 188.1 987.32001 9 719.7 -- 89.7 809.4 200.8 1010.22002 9 569.7 -- 51.7 621.4 265.4 886.82003 11 807.0 -- 111.6 918.6 148.5 1067.12004 9 662.2 -- 44.6 706.8 174.6 881.42005 8 605.6 -- 111.4 717.0 314.5 1031.52006 12 863.7 -- 144.3 1008.0 373.7 1381.72007 14 1092.1 -- 222.8 1314.9 281.9 1596.82008 23 1654.6 -- 150.2 1804.8 310.1 2114.92009 30 1895.6 -- 37.8 1933.4 300.5 2233.92010 30 1924.6 -- 21.4 1946.0 353.4 2299.42011 30 1926.2 -- 11.0 1937.2 253.7 2190.92012 30 1927.7 -- 74.6 2002.3 272.1 2274.42013 17 1293.6 -- 15.8 1309.4 163.9 1473.32014 18 1270.7 -- 19.7 1290.4 224.8 1515.22015 19 1337.8 -- 22.3 1360.1 241.1 1601.22016 19 1351.2 -- 17.5 1368.7 152.6 1521.32017 18 1310.1 -- 17.4 1327.5 167.4 1494.92018 38 3148.3 -- 29.9 3178.2 516.3 3694.52019 34 2376.1 -- 15.4 2391.5 376.9 2768.4
Subtotal 408 29254.8 -- 1339.4 30594.2 5805.0 36399.2
V-22 December 31, 2011 SAR
UNCLASSIFIED 27
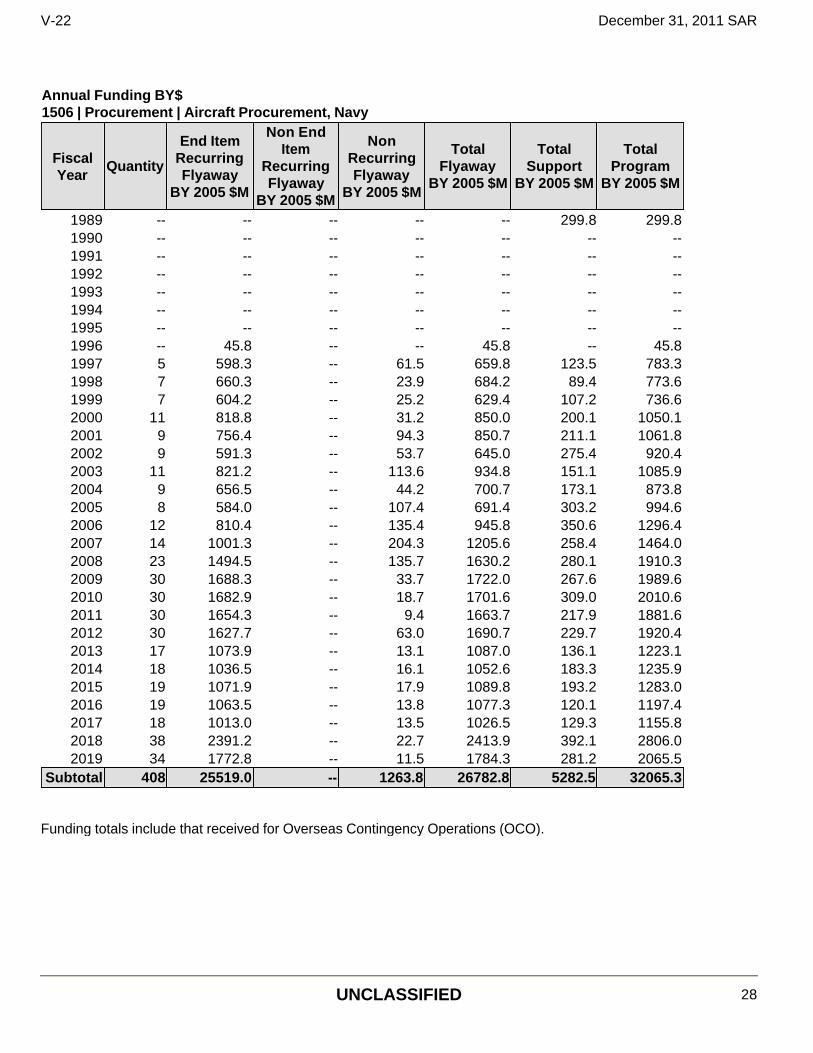
Funding totals include that received for Overseas Contingency Operations (OCO).
Annual Funding BY$ 1506 | Procurement | Aircraft Procurement, Navy
Fiscal Year
Quantity
End Item Recurring Flyaway
BY 2005 $M
Non End Item
Recurring Flyaway
BY 2005 $M
Non Recurring Flyaway
BY 2005 $M
Total Flyaway
BY 2005 $M
Total Support
BY 2005 $M
Total Program
BY 2005 $M
1989 -- -- -- -- -- 299.8 299.81990 -- -- -- -- -- -- --1991 -- -- -- -- -- -- --1992 -- -- -- -- -- -- --1993 -- -- -- -- -- -- --1994 -- -- -- -- -- -- --1995 -- -- -- -- -- -- --1996 -- 45.8 -- -- 45.8 -- 45.81997 5 598.3 -- 61.5 659.8 123.5 783.31998 7 660.3 -- 23.9 684.2 89.4 773.61999 7 604.2 -- 25.2 629.4 107.2 736.62000 11 818.8 -- 31.2 850.0 200.1 1050.12001 9 756.4 -- 94.3 850.7 211.1 1061.82002 9 591.3 -- 53.7 645.0 275.4 920.42003 11 821.2 -- 113.6 934.8 151.1 1085.92004 9 656.5 -- 44.2 700.7 173.1 873.82005 8 584.0 -- 107.4 691.4 303.2 994.62006 12 810.4 -- 135.4 945.8 350.6 1296.42007 14 1001.3 -- 204.3 1205.6 258.4 1464.02008 23 1494.5 -- 135.7 1630.2 280.1 1910.32009 30 1688.3 -- 33.7 1722.0 267.6 1989.62010 30 1682.9 -- 18.7 1701.6 309.0 2010.62011 30 1654.3 -- 9.4 1663.7 217.9 1881.62012 30 1627.7 -- 63.0 1690.7 229.7 1920.42013 17 1073.9 -- 13.1 1087.0 136.1 1223.12014 18 1036.5 -- 16.1 1052.6 183.3 1235.92015 19 1071.9 -- 17.9 1089.8 193.2 1283.02016 19 1063.5 -- 13.8 1077.3 120.1 1197.42017 18 1013.0 -- 13.5 1026.5 129.3 1155.82018 38 2391.2 -- 22.7 2413.9 392.1 2806.02019 34 1772.8 -- 11.5 1784.3 281.2 2065.5
Subtotal 408 25519.0 -- 1263.8 26782.8 5282.5 32065.3
V-22 December 31, 2011 SAR
UNCLASSIFIED 28

Cost Quantity Information 1506 | Procurement | Aircraft Procurement, Navy
Fiscal Year Quantity
End Item Recurring Flyaway (Aligned
with Quantity) BY 2005
$M1989 -- --1990 -- --1991 -- --1992 -- --1993 -- --1994 -- --1995 -- --1996 -- --1997 5 589.01998 7 649.91999 7 612.72000 11 801.52001 9 756.02002 9 628.52003 11 817.12004 9 660.22005 8 569.12006 12 800.72007 14 886.52008 23 1491.72009 30 1798.42010 30 1679.22011 30 1657.92012 30 1643.72013 17 999.82014 18 1119.52015 19 1083.12016 19 1059.52017 18 1000.52018 38 2247.72019 34 1966.8
Subtotal 408 25519.0
V-22 December 31, 2011 SAR
UNCLASSIFIED 29

Annual Funding TY$ 3010 | Procurement | Aircraft Procurement, Air Force
Fiscal Year
Quantity
End Item Recurring Flyaway
TY $M
Non End Item
Recurring Flyaway
TY $M
Non Recurring Flyaway TY $M
Total Flyaway TY $M
Total Support TY $M
Total Program
TY $M
1999 -- -- -- -- -- 21.9 21.92000 -- -- -- 19.5 19.5 21.3 40.82001 -- -- -- 26.7 26.7 22.6 49.32002 -- -- -- -- -- -- --2003 -- 9.8 -- -- 9.8 79.1 88.92004 2 147.6 -- -- 147.6 42.0 189.62005 3 209.1 -- 7.2 216.3 113.9 330.22006 2 136.6 -- 18.6 155.2 94.1 249.32007 3 219.6 -- 9.3 228.9 156.2 385.12008 10 659.4 -- 7.0 666.4 272.4 938.82009 6 352.5 -- 16.4 368.9 103.4 472.32010 5 314.3 -- 18.8 333.1 233.0 566.12011 6 392.5 -- 8.5 401.0 181.4 582.42012 5 325.7 -- 5.6 331.3 85.4 416.72013 4 280.0 -- 3.4 283.4 116.2 399.62014 3 200.9 -- 2.5 203.4 74.4 277.82015 -- -- -- -- -- 3.1 3.1
Subtotal 49 3248.0 -- 143.5 3391.5 1620.4 5011.9
V-22 December 31, 2011 SAR
UNCLASSIFIED 30
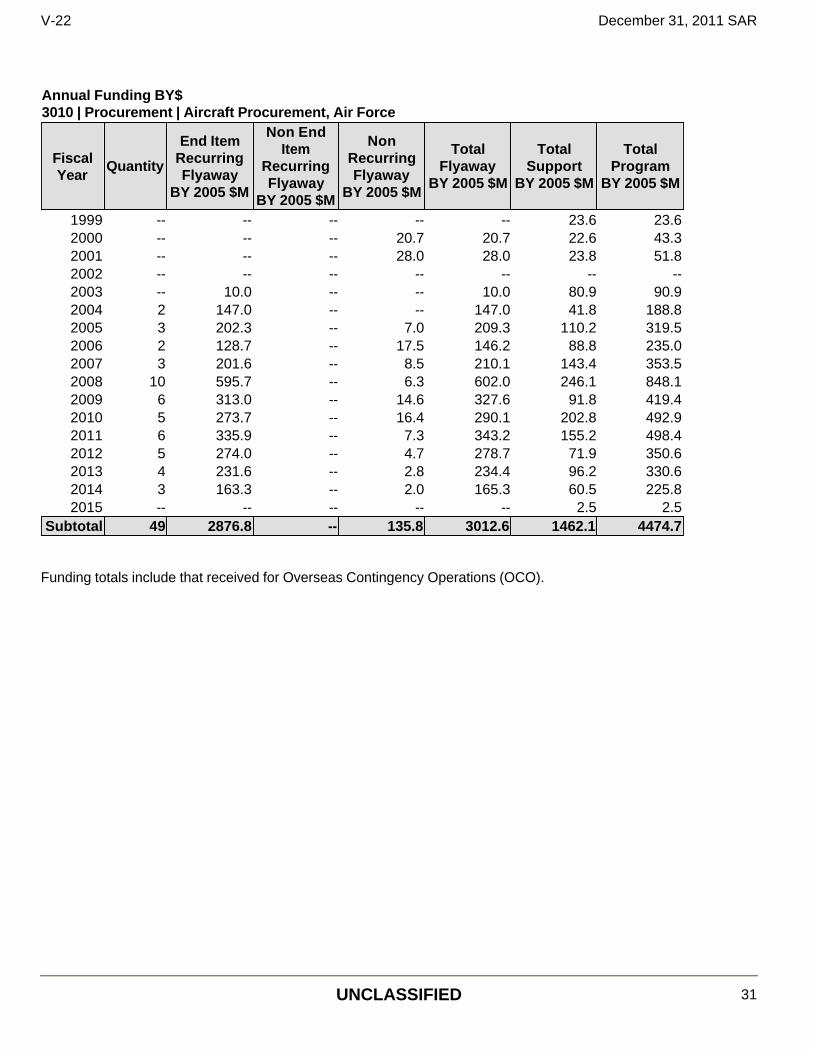
Funding totals include that received for Overseas Contingency Operations (OCO).
Annual Funding BY$ 3010 | Procurement | Aircraft Procurement, Air Force
Fiscal Year
Quantity
End Item Recurring Flyaway
BY 2005 $M
Non End Item
Recurring Flyaway
BY 2005 $M
Non Recurring Flyaway
BY 2005 $M
Total Flyaway
BY 2005 $M
Total Support
BY 2005 $M
Total Program
BY 2005 $M
1999 -- -- -- -- -- 23.6 23.62000 -- -- -- 20.7 20.7 22.6 43.32001 -- -- -- 28.0 28.0 23.8 51.82002 -- -- -- -- -- -- --2003 -- 10.0 -- -- 10.0 80.9 90.92004 2 147.0 -- -- 147.0 41.8 188.82005 3 202.3 -- 7.0 209.3 110.2 319.52006 2 128.7 -- 17.5 146.2 88.8 235.02007 3 201.6 -- 8.5 210.1 143.4 353.52008 10 595.7 -- 6.3 602.0 246.1 848.12009 6 313.0 -- 14.6 327.6 91.8 419.42010 5 273.7 -- 16.4 290.1 202.8 492.92011 6 335.9 -- 7.3 343.2 155.2 498.42012 5 274.0 -- 4.7 278.7 71.9 350.62013 4 231.6 -- 2.8 234.4 96.2 330.62014 3 163.3 -- 2.0 165.3 60.5 225.82015 -- -- -- -- -- 2.5 2.5
Subtotal 49 2876.8 -- 135.8 3012.6 1462.1 4474.7
V-22 December 31, 2011 SAR
UNCLASSIFIED 31

Cost Quantity Information 3010 | Procurement | Aircraft Procurement, Air Force
Fiscal Year Quantity
End Item Recurring Flyaway (Aligned
with Quantity) BY 2005
$M1999 -- --2000 -- --2001 -- --2002 -- --2003 -- --2004 2 142.02005 3 206.82006 2 130.22007 3 185.22008 10 584.22009 6 337.32010 5 274.32011 6 336.32012 5 268.82013 4 236.02014 3 175.72015 -- --
Subtotal 49 2876.8
V-22 December 31, 2011 SAR
UNCLASSIFIED 32

Annual Funding TY$ 0300 | Procurement | Procurement, Defense-Wide
Fiscal Year
Quantity
End Item Recurring Flyaway
TY $M
Non End Item
Recurring Flyaway
TY $M
Non Recurring Flyaway TY $M
Total Flyaway TY $M
Total Support TY $M
Total Program
TY $M
1999 -- -- -- -- -- 4.0 4.02000 -- -- -- -- -- 2.0 2.02001 -- -- -- -- -- 6.8 6.82002 -- -- -- -- -- 15.9 15.92003 -- 5.0 -- -- 5.0 36.9 41.92004 -- 41.9 -- -- 41.9 35.5 77.42005 -- 54.5 -- 0.2 54.7 58.6 113.32006 -- 40.7 -- 1.9 42.6 55.0 97.62007 -- 113.9 -- -- 113.9 79.9 193.82008 -- 190.5 -- 2.3 192.8 125.6 318.42009 -- 90.2 -- 6.7 96.9 29.8 126.72010 -- 57.1 -- 6.2 63.3 35.2 98.52011 -- 80.2 -- 10.0 90.2 29.5 119.72012 -- 59.2 -- 4.3 63.5 50.6 114.12013 -- 63.0 -- 4.7 67.7 61.1 128.82014 -- 46.7 -- 6.7 53.4 35.4 88.82015 -- -- -- -- -- 11.6 11.6
Subtotal -- 842.9 -- 43.0 885.9 673.4 1559.3
V-22 December 31, 2011 SAR
UNCLASSIFIED 33
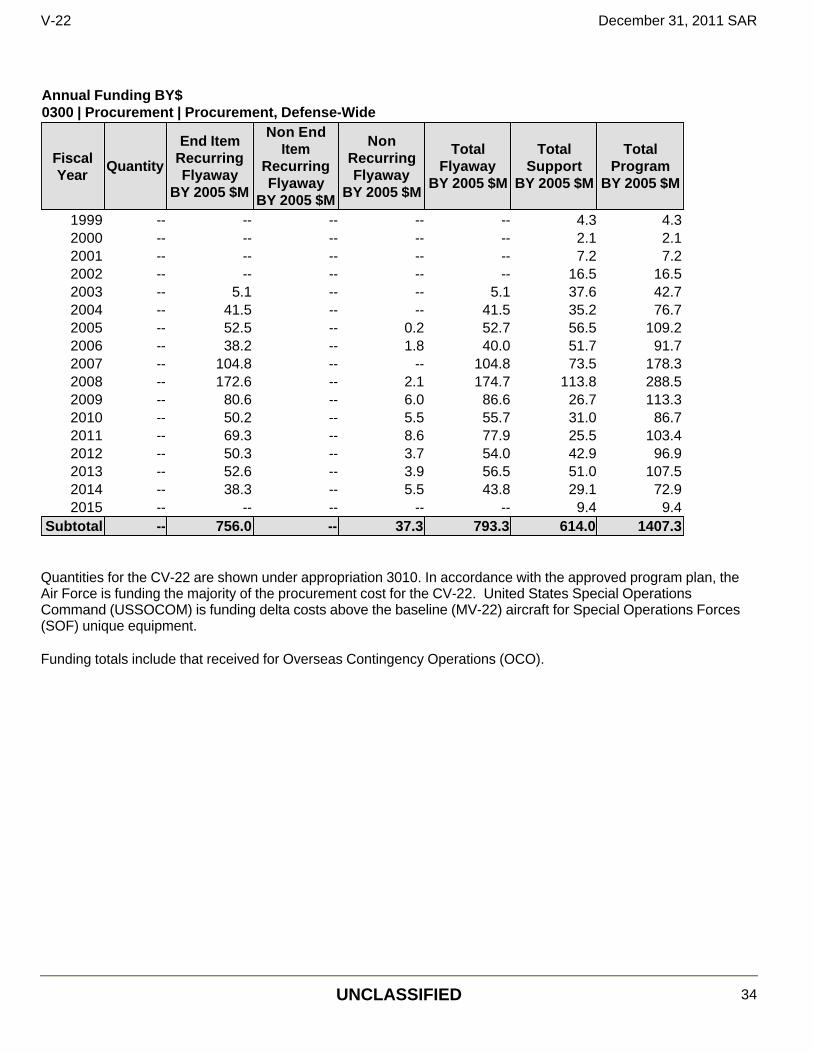
Quantities for the CV-22 are shown under appropriation 3010. In accordance with the approved program plan, the Air Force is funding the majority of the procurement cost for the CV-22. United States Special Operations Command (USSOCOM) is funding delta costs above the baseline (MV-22) aircraft for Special Operations Forces (SOF) unique equipment. Funding totals include that received for Overseas Contingency Operations (OCO).
Annual Funding BY$ 0300 | Procurement | Procurement, Defense-Wide
Fiscal Year
Quantity
End Item Recurring Flyaway
BY 2005 $M
Non End Item
Recurring Flyaway
BY 2005 $M
Non Recurring Flyaway
BY 2005 $M
Total Flyaway
BY 2005 $M
Total Support
BY 2005 $M
Total Program
BY 2005 $M
1999 -- -- -- -- -- 4.3 4.32000 -- -- -- -- -- 2.1 2.12001 -- -- -- -- -- 7.2 7.22002 -- -- -- -- -- 16.5 16.52003 -- 5.1 -- -- 5.1 37.6 42.72004 -- 41.5 -- -- 41.5 35.2 76.72005 -- 52.5 -- 0.2 52.7 56.5 109.22006 -- 38.2 -- 1.8 40.0 51.7 91.72007 -- 104.8 -- -- 104.8 73.5 178.32008 -- 172.6 -- 2.1 174.7 113.8 288.52009 -- 80.6 -- 6.0 86.6 26.7 113.32010 -- 50.2 -- 5.5 55.7 31.0 86.72011 -- 69.3 -- 8.6 77.9 25.5 103.42012 -- 50.3 -- 3.7 54.0 42.9 96.92013 -- 52.6 -- 3.9 56.5 51.0 107.52014 -- 38.3 -- 5.5 43.8 29.1 72.92015 -- -- -- -- -- 9.4 9.4
Subtotal -- 756.0 -- 37.3 793.3 614.0 1407.3
V-22 December 31, 2011 SAR
UNCLASSIFIED 34

Cost Quantity Information 0300 | Procurement | Procurement, Defense-Wide
Fiscal Year Quantity
End Item Recurring Flyaway (Aligned
with Quantity) BY 2005
$M1999 -- --2000 -- --2001 -- --2002 -- --2003 -- --2004 -- 40.02005 -- 56.42006 -- 38.22007 -- 46.22008 -- 226.72009 -- 83.92010 -- 50.22011 -- 69.42012 -- 51.62013 -- 53.22014 -- 40.22015 -- --
Subtotal -- 756.0
V-22 December 31, 2011 SAR
UNCLASSIFIED 35

Annual Funding TY$ 1205 | MILCON | Military Construction, Navy and Marine Corps
Fiscal Year
Total Program
TY $M2003 0.82004 10.92005 14.52006 22.42007 --2008 --2009 --2010 7.22011 --2012 12.02013 --2014 6.1
Subtotal 73.9
V-22 December 31, 2011 SAR
UNCLASSIFIED 36

Annual Funding BY$ 1205 | MILCON | Military Construction, Navy and Marine Corps
Fiscal Year
Total Program
BY 2005 $M2003 0.82004 10.82005 13.92006 21.02007 --2008 --2009 --2010 6.22011 --2012 10.12013 --2014 4.9
Subtotal 67.7
V-22 December 31, 2011 SAR
UNCLASSIFIED 37
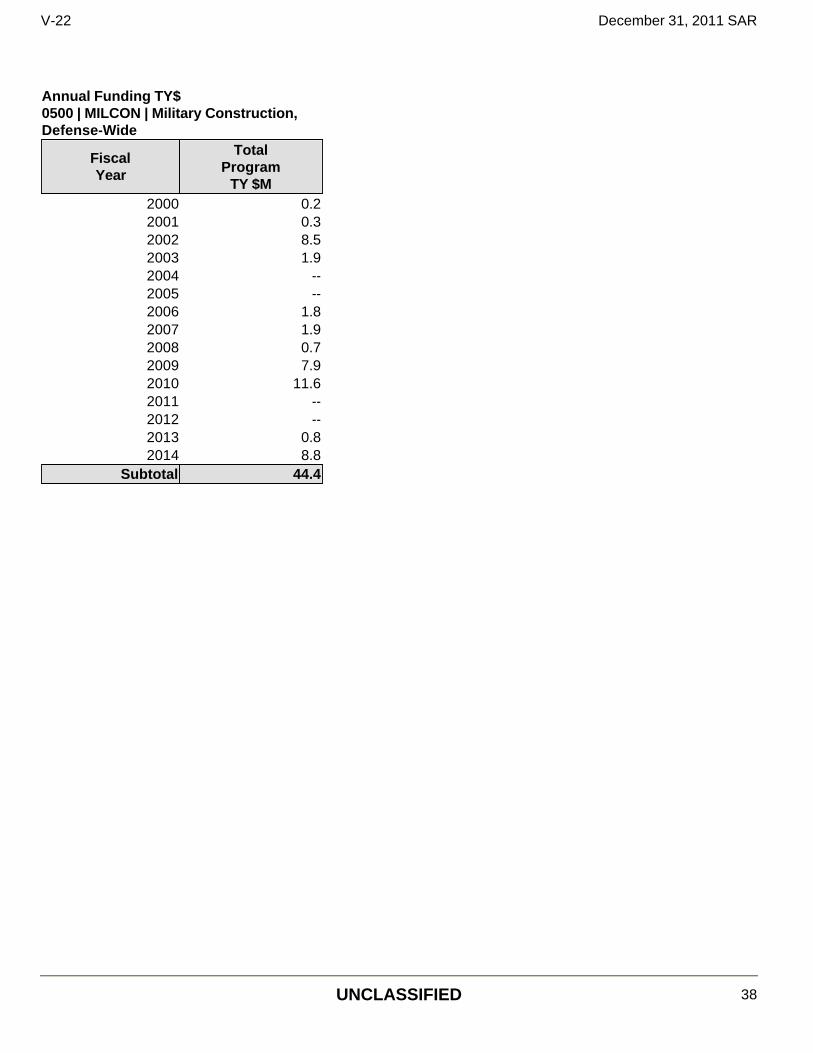
Annual Funding TY$ 0500 | MILCON | Military Construction, Defense-Wide
Fiscal Year
Total Program
TY $M2000 0.22001 0.32002 8.52003 1.92004 --2005 --2006 1.82007 1.92008 0.72009 7.92010 11.62011 --2012 --2013 0.82014 8.8
Subtotal 44.4
V-22 December 31, 2011 SAR
UNCLASSIFIED 38

Low Rate Initial Production
The current total Low Rate Initial Production (LRIP) quantity is more than 10% of the total production quantity due to the Milestone (MS) III slip and program restructure. MS III was achieved on September 28, 2005.
Annual Funding BY$ 0500 | MILCON | Military Construction, Defense-Wide
Fiscal Year
Total Program
BY 2005 $M2000 0.22001 0.32002 8.82003 1.92004 --2005 --2006 1.72007 1.72008 0.62009 7.02010 10.02011 --2012 --2013 0.72014 7.1
Subtotal 40.0
Initial LRIP Decision Current Total LRIP Approval Date 4/25/1997 4/25/2002 Approved Quantity 25 58 Reference ADM dated April 25, 1997
DAB review on April 25, 2002. USD approved APB which reflects restructured program.
Start Year 1997 1997 End Year 2001 2009
V-22 December 31, 2011 SAR
UNCLASSIFIED 39

Nuclear Cost
Foreign Military Sales
None
None
V-22 December 31, 2011 SAR
UNCLASSIFIED 40

Unit Cost Unit Cost Report
BY2005 $M BY2005 $M
Unit Cost Current UCR
Baseline (OCT 2011 APB)
Current Estimate (DEC 2011 SAR)
BY % Change
Program Acquisition Unit Cost (PAUC) Cost 50250.4 49982.2Quantity 458 459Unit Cost 109.717 108.894 -0.75
Average Procurement Unit Cost (APUC) Cost 38562.8 37947.3Quantity 456 457Unit Cost 84.568 83.036 -1.81
BY2005 $M BY2005 $M
Unit Cost
Revised Original UCR
Baseline (SEP 2005 APB)
Current Estimate (DEC 2011 SAR)
BY % Change
Program Acquisition Unit Cost (PAUC) Cost 50250.4 49982.2Quantity 458 459Unit Cost 109.717 108.894 -0.75
Average Procurement Unit Cost (APUC) Cost 38562.8 37947.3Quantity 456 457Unit Cost 84.568 83.036 -1.81
V-22 December 31, 2011 SAR
UNCLASSIFIED 41
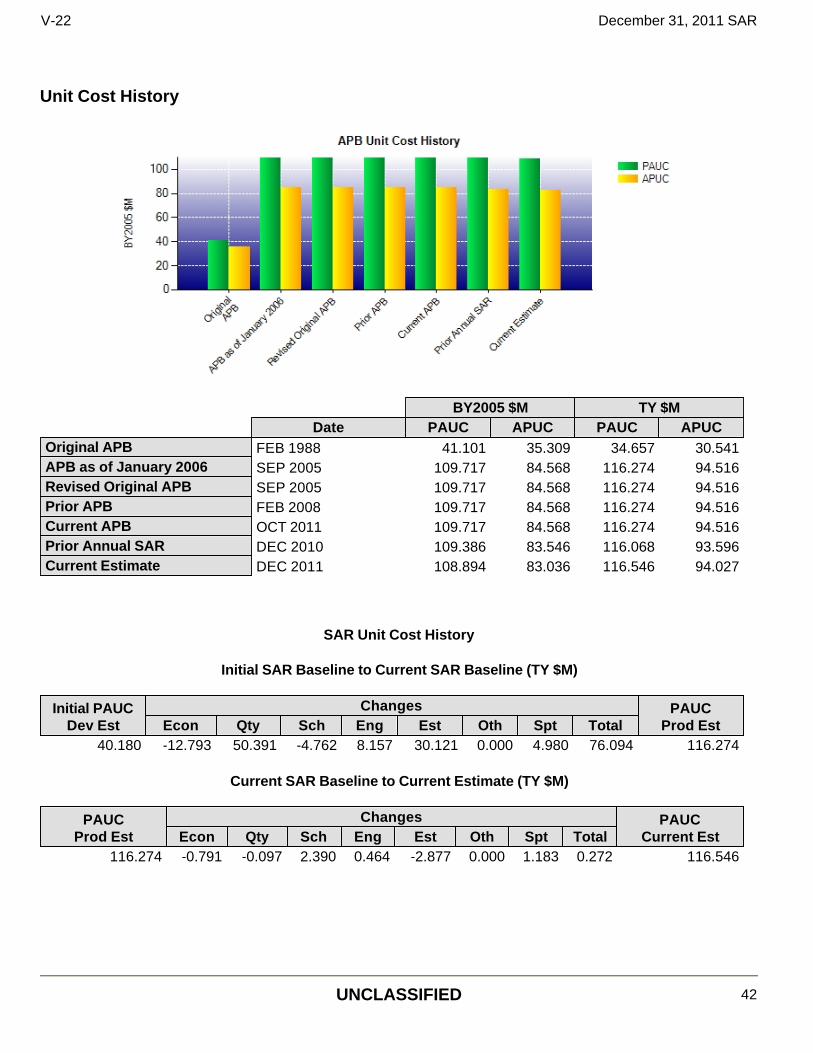
Unit Cost History
BY2005 $M TY $MDate PAUC APUC PAUC APUC
Original APB FEB 1988 41.101 35.309 34.657 30.541APB as of January 2006 SEP 2005 109.717 84.568 116.274 94.516Revised Original APB SEP 2005 109.717 84.568 116.274 94.516Prior APB FEB 2008 109.717 84.568 116.274 94.516Current APB OCT 2011 109.717 84.568 116.274 94.516Prior Annual SAR DEC 2010 109.386 83.546 116.068 93.596Current Estimate DEC 2011 108.894 83.036 116.546 94.027
SAR Unit Cost History
Initial SAR Baseline to Current SAR Baseline (TY $M)
Initial PAUC Dev Est
Changes PAUC Prod Est Econ Qty Sch Eng Est Oth Spt Total
40.180 -12.793 50.391 -4.762 8.157 30.121 0.000 4.980 76.094 116.274
Current SAR Baseline to Current Estimate (TY $M)
PAUC Prod Est
Changes PAUC Current Est Econ Qty Sch Eng Est Oth Spt Total
116.274 -0.791 -0.097 2.390 0.464 -2.877 0.000 1.183 0.272 116.546
V-22 December 31, 2011 SAR
UNCLASSIFIED 42
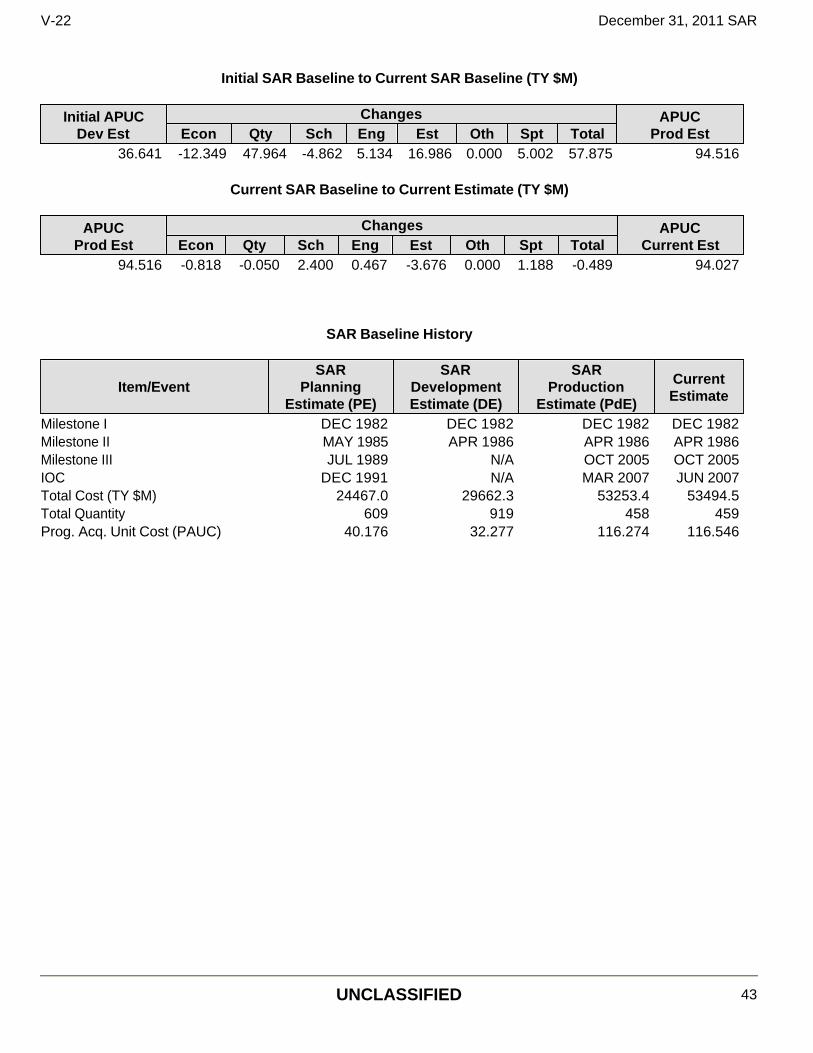
Initial SAR Baseline to Current SAR Baseline (TY $M)
Initial APUC Dev Est
Changes APUC Prod Est Econ Qty Sch Eng Est Oth Spt Total
36.641 -12.349 47.964 -4.862 5.134 16.986 0.000 5.002 57.875 94.516
Current SAR Baseline to Current Estimate (TY $M)
APUC Prod Est
Changes APUC Current Est Econ Qty Sch Eng Est Oth Spt Total
94.516 -0.818 -0.050 2.400 0.467 -3.676 0.000 1.188 -0.489 94.027
SAR Baseline History
Item/Event SAR
Planning Estimate (PE)
SAR Development Estimate (DE)
SAR Production
Estimate (PdE)
Current Estimate
Milestone I DEC 1982 DEC 1982 DEC 1982 DEC 1982Milestone II MAY 1985 APR 1986 APR 1986 APR 1986Milestone III JUL 1989 N/A OCT 2005 OCT 2005IOC DEC 1991 N/A MAR 2007 JUN 2007Total Cost (TY $M) 24467.0 29662.3 53253.4 53494.5Total Quantity 609 919 458 459Prog. Acq. Unit Cost (PAUC) 40.176 32.277 116.274 116.546
V-22 December 31, 2011 SAR
UNCLASSIFIED 43
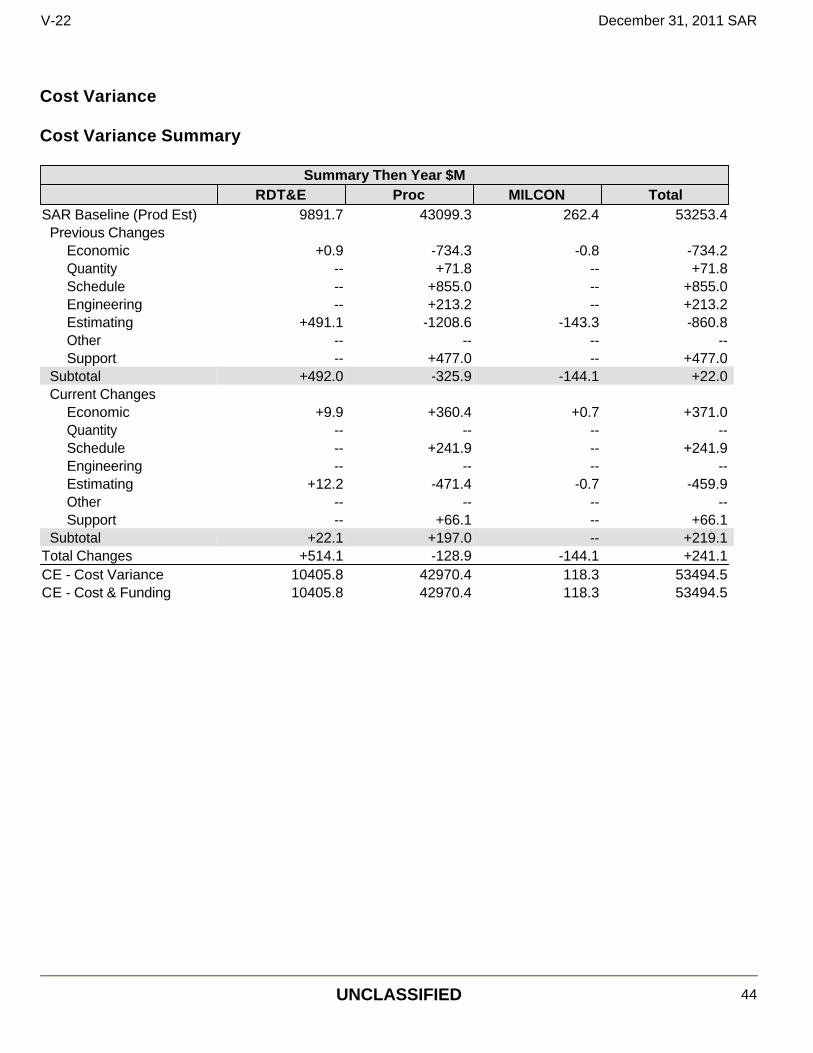
Cost Variance Cost Variance Summary
Summary Then Year $MRDT&E Proc MILCON Total
SAR Baseline (Prod Est) 9891.7 43099.3 262.4 53253.4Previous Changes
Economic +0.9 -734.3 -0.8 -734.2Quantity -- +71.8 -- +71.8Schedule -- +855.0 -- +855.0Engineering -- +213.2 -- +213.2Estimating +491.1 -1208.6 -143.3 -860.8Other -- -- -- --Support -- +477.0 -- +477.0
Subtotal +492.0 -325.9 -144.1 +22.0Current Changes
Economic +9.9 +360.4 +0.7 +371.0Quantity -- -- -- --Schedule -- +241.9 -- +241.9Engineering -- -- -- --Estimating +12.2 -471.4 -0.7 -459.9Other -- -- -- --Support -- +66.1 -- +66.1
Subtotal +22.1 +197.0 -- +219.1Total Changes +514.1 -128.9 -144.1 +241.1CE - Cost Variance 10405.8 42970.4 118.3 53494.5CE - Cost & Funding 10405.8 42970.4 118.3 53494.5
V-22 December 31, 2011 SAR
UNCLASSIFIED 44
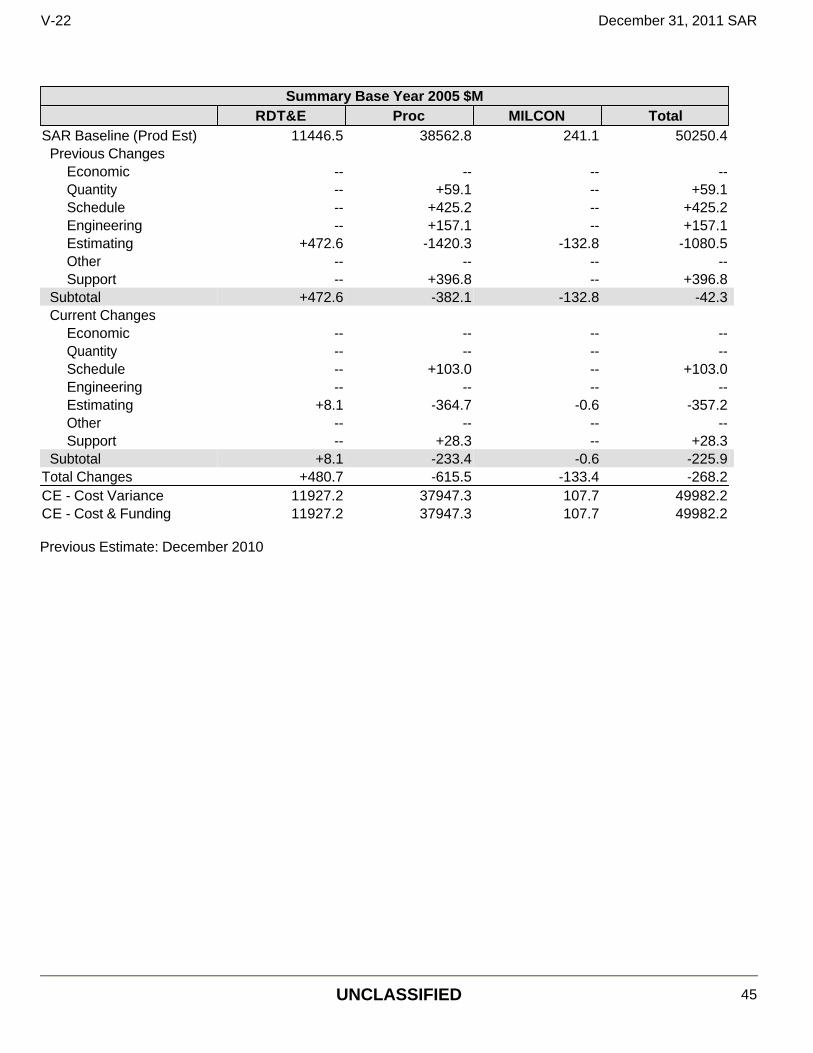
Previous Estimate: December 2010
Summary Base Year 2005 $MRDT&E Proc MILCON Total
SAR Baseline (Prod Est) 11446.5 38562.8 241.1 50250.4Previous Changes
Economic -- -- -- --Quantity -- +59.1 -- +59.1Schedule -- +425.2 -- +425.2Engineering -- +157.1 -- +157.1Estimating +472.6 -1420.3 -132.8 -1080.5Other -- -- -- --Support -- +396.8 -- +396.8
Subtotal +472.6 -382.1 -132.8 -42.3Current Changes
Economic -- -- -- --Quantity -- -- -- --Schedule -- +103.0 -- +103.0Engineering -- -- -- --Estimating +8.1 -364.7 -0.6 -357.2Other -- -- -- --Support -- +28.3 -- +28.3
Subtotal +8.1 -233.4 -0.6 -225.9Total Changes +480.7 -615.5 -133.4 -268.2CE - Cost Variance 11927.2 37947.3 107.7 49982.2CE - Cost & Funding 11927.2 37947.3 107.7 49982.2
V-22 December 31, 2011 SAR
UNCLASSIFIED 45
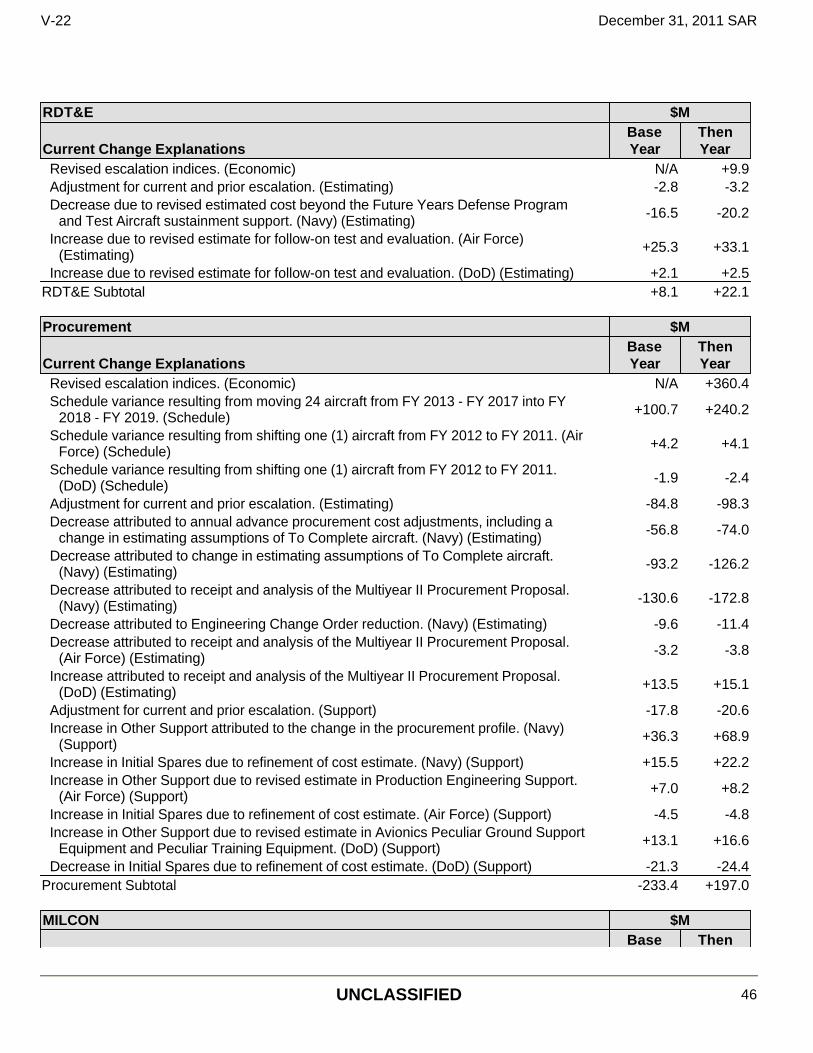
RDT&E $M
Current Change ExplanationsBase Year
Then Year
Revised escalation indices. (Economic) N/A +9.9Adjustment for current and prior escalation. (Estimating) -2.8 -3.2Decrease due to revised estimated cost beyond the Future Years Defense Program
and Test Aircraft sustainment support. (Navy) (Estimating) -16.5 -20.2
Increase due to revised estimate for follow-on test and evaluation. (Air Force) (Estimating) +25.3 +33.1
Increase due to revised estimate for follow-on test and evaluation. (DoD) (Estimating) +2.1 +2.5RDT&E Subtotal +8.1 +22.1
Procurement $M
Current Change ExplanationsBase Year
Then Year
Revised escalation indices. (Economic) N/A +360.4Schedule variance resulting from moving 24 aircraft from FY 2013 - FY 2017 into FY
2018 - FY 2019. (Schedule) +100.7 +240.2
Schedule variance resulting from shifting one (1) aircraft from FY 2012 to FY 2011. (Air Force) (Schedule) +4.2 +4.1
Schedule variance resulting from shifting one (1) aircraft from FY 2012 to FY 2011. (DoD) (Schedule) -1.9 -2.4
Adjustment for current and prior escalation. (Estimating) -84.8 -98.3Decrease attributed to annual advance procurement cost adjustments, including a
change in estimating assumptions of To Complete aircraft. (Navy) (Estimating) -56.8 -74.0
Decrease attributed to change in estimating assumptions of To Complete aircraft. (Navy) (Estimating) -93.2 -126.2
Decrease attributed to receipt and analysis of the Multiyear II Procurement Proposal. (Navy) (Estimating) -130.6 -172.8
Decrease attributed to Engineering Change Order reduction. (Navy) (Estimating) -9.6 -11.4Decrease attributed to receipt and analysis of the Multiyear II Procurement Proposal.
(Air Force) (Estimating) -3.2 -3.8
Increase attributed to receipt and analysis of the Multiyear II Procurement Proposal. (DoD) (Estimating) +13.5 +15.1
Adjustment for current and prior escalation. (Support) -17.8 -20.6Increase in Other Support attributed to the change in the procurement profile. (Navy)
(Support) +36.3 +68.9
Increase in Initial Spares due to refinement of cost estimate. (Navy) (Support) +15.5 +22.2Increase in Other Support due to revised estimate in Production Engineering Support.
(Air Force) (Support) +7.0 +8.2
Increase in Initial Spares due to refinement of cost estimate. (Air Force) (Support) -4.5 -4.8Increase in Other Support due to revised estimate in Avionics Peculiar Ground Support
Equipment and Peculiar Training Equipment. (DoD) (Support) +13.1 +16.6
Decrease in Initial Spares due to refinement of cost estimate. (DoD) (Support) -21.3 -24.4Procurement Subtotal -233.4 +197.0
MILCON $MBase Then
V-22 December 31, 2011 SAR
UNCLASSIFIED 46

Current Change Explanations Year YearRevised escalation indices. (Economic) N/A +0.7Adjustment for current and prior escalation. (Estimating) -0.4 -0.4Decrease due to revised cost estimate. (Navy) (Estimating) -0.1 -0.1Decrease due to revised cost estimate. (DoD) (Estimating) -0.1 -0.2
MILCON Subtotal -0.6 0.0
V-22 December 31, 2011 SAR
UNCLASSIFIED 47
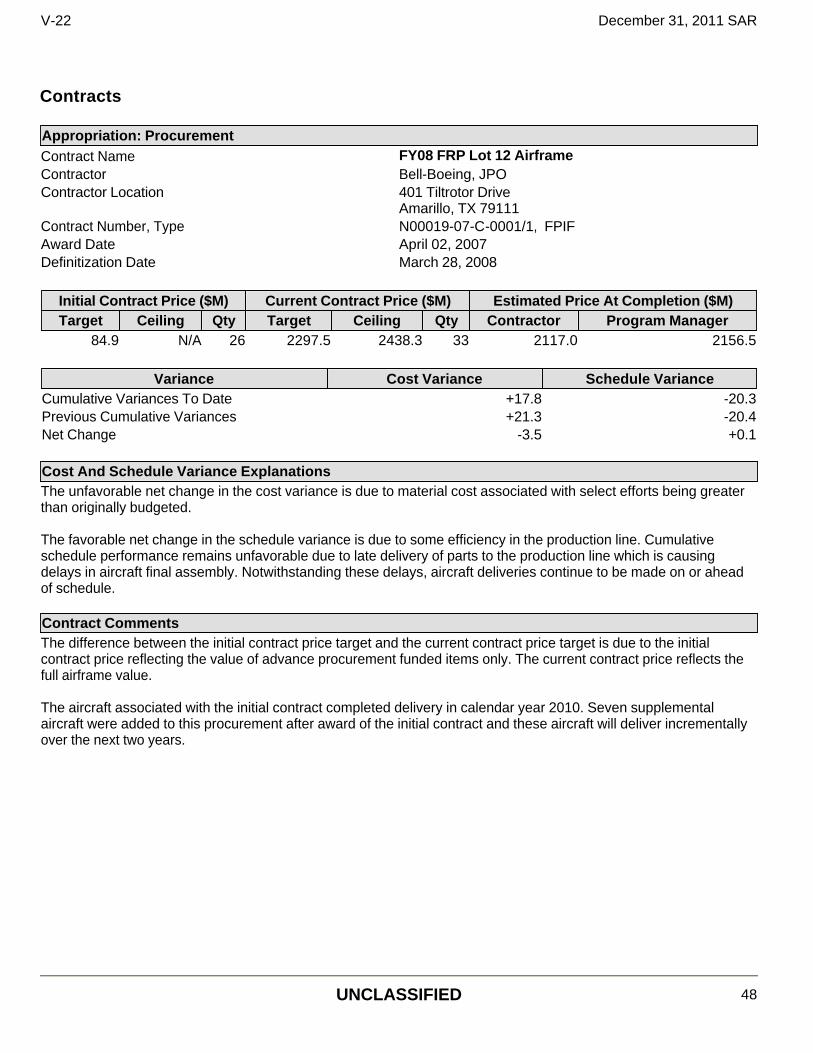
Contracts
Appropriation: Procurement Contract Name FY08 FRP Lot 12 Airframe Contractor Bell-Boeing, JPO Contractor Location 401 Tiltrotor Drive
Amarillo, TX 79111 Contract Number, Type N00019-07-C-0001/1, FPIF Award Date April 02, 2007 Definitization Date March 28, 2008
Initial Contract Price ($M) Current Contract Price ($M) Estimated Price At Completion ($M) Target Ceiling Qty Target Ceiling Qty Contractor Program Manager
84.9 N/A 26 2297.5 2438.3 33 2117.0 2156.5
Variance Cost Variance Schedule Variance Cumulative Variances To Date +17.8 -20.3 Previous Cumulative Variances +21.3 -20.4 Net Change -3.5 +0.1
Cost And Schedule Variance Explanations The unfavorable net change in the cost variance is due to material cost associated with select efforts being greater than originally budgeted. The favorable net change in the schedule variance is due to some efficiency in the production line. Cumulative schedule performance remains unfavorable due to late delivery of parts to the production line which is causing delays in aircraft final assembly. Notwithstanding these delays, aircraft deliveries continue to be made on or ahead of schedule.
Contract Comments The difference between the initial contract price target and the current contract price target is due to the initial contract price reflecting the value of advance procurement funded items only. The current contract price reflects the full airframe value. The aircraft associated with the initial contract completed delivery in calendar year 2010. Seven supplemental aircraft were added to this procurement after award of the initial contract and these aircraft will deliver incrementally over the next two years.
V-22 December 31, 2011 SAR
UNCLASSIFIED 48
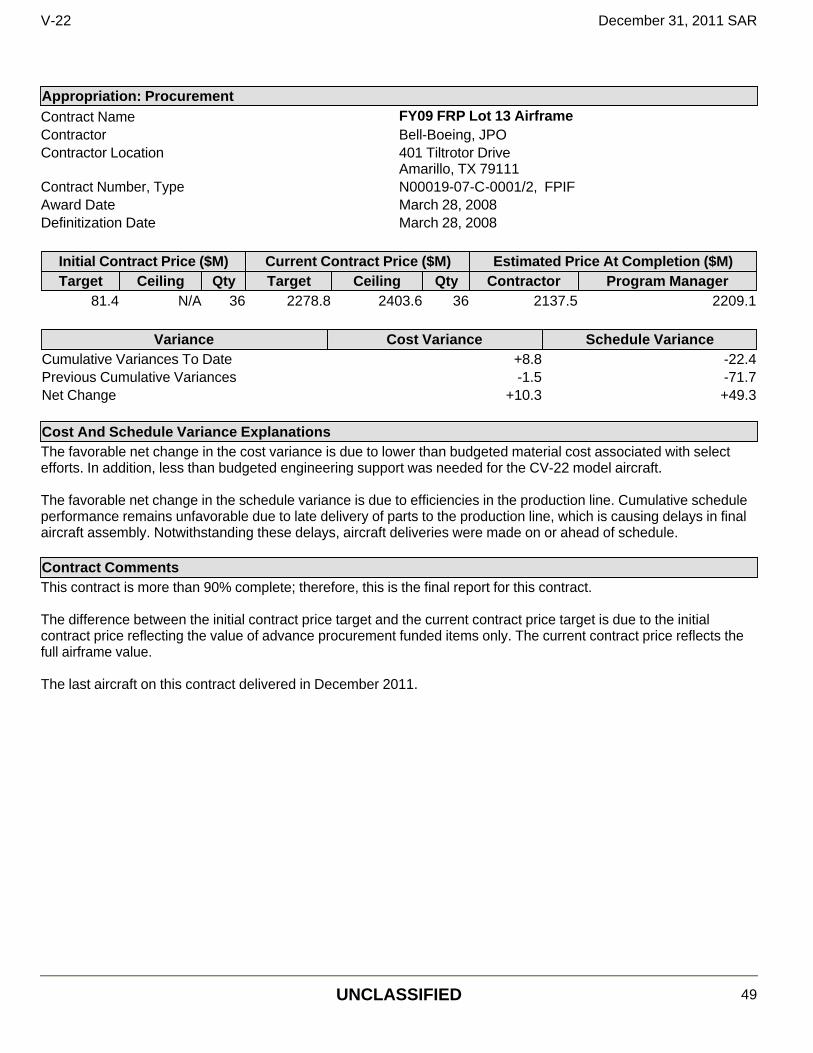
Appropriation: Procurement Contract Name FY09 FRP Lot 13 Airframe Contractor Bell-Boeing, JPO Contractor Location 401 Tiltrotor Drive
Amarillo, TX 79111 Contract Number, Type N00019-07-C-0001/2, FPIF Award Date March 28, 2008 Definitization Date March 28, 2008
Initial Contract Price ($M) Current Contract Price ($M) Estimated Price At Completion ($M) Target Ceiling Qty Target Ceiling Qty Contractor Program Manager
81.4 N/A 36 2278.8 2403.6 36 2137.5 2209.1
Variance Cost Variance Schedule Variance Cumulative Variances To Date +8.8 -22.4 Previous Cumulative Variances -1.5 -71.7 Net Change +10.3 +49.3
Cost And Schedule Variance Explanations The favorable net change in the cost variance is due to lower than budgeted material cost associated with select efforts. In addition, less than budgeted engineering support was needed for the CV-22 model aircraft. The favorable net change in the schedule variance is due to efficiencies in the production line. Cumulative schedule performance remains unfavorable due to late delivery of parts to the production line, which is causing delays in final aircraft assembly. Notwithstanding these delays, aircraft deliveries were made on or ahead of schedule.
Contract Comments This contract is more than 90% complete; therefore, this is the final report for this contract. The difference between the initial contract price target and the current contract price target is due to the initial contract price reflecting the value of advance procurement funded items only. The current contract price reflects the full airframe value. The last aircraft on this contract delivered in December 2011.
V-22 December 31, 2011 SAR
UNCLASSIFIED 49

Appropriation: Procurement Contract Name FY10 FRP Lot 14 Airframe Contractor Bell-Boeing, JPO Contractor Location 401 Tiltrotor Drive
Amarillo, TX 79111 Contract Number, Type N00019-07-C-0001/3, FPIF Award Date March 28, 2008 Definitization Date March 28, 2008
Initial Contract Price ($M) Current Contract Price ($M) Estimated Price At Completion ($M) Target Ceiling Qty Target Ceiling Qty Contractor Program Manager
81.5 N/A 35 2120.6 2237.6 35 2068.4 2119.7
Variance Cost Variance Schedule Variance Cumulative Variances To Date +14.9 -96.3 Previous Cumulative Variances -3.8 -35.4 Net Change +18.7 -60.9
Cost And Schedule Variance Explanations The favorable net change in the cost variance is due to lower than budgeted material cost associated with select efforts. The unfavorable net change in the schedule variance is due to late delivery of parts to the production line, which is causing delays in aircraft final assembly. Notwithstanding these delays, deliveries are projected to be made on or ahead of schedule.
Contract Comments The difference between the initial contract price target and the current contract price target is due to the initial contract price reflecting the value of advance procurement funded items only. The current contract price reflects the full airframe value.
V-22 December 31, 2011 SAR
UNCLASSIFIED 50
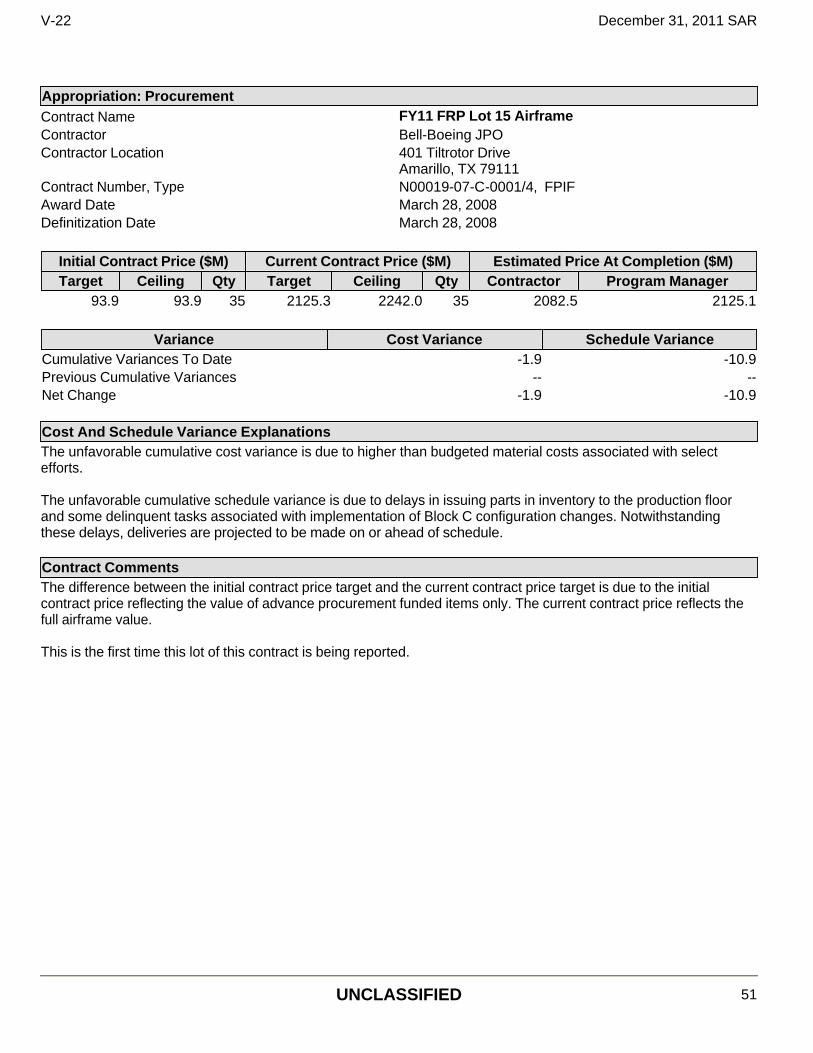
Appropriation: Procurement Contract Name FY11 FRP Lot 15 Airframe Contractor Bell-Boeing JPO Contractor Location 401 Tiltrotor Drive
Amarillo, TX 79111 Contract Number, Type N00019-07-C-0001/4, FPIF Award Date March 28, 2008 Definitization Date March 28, 2008
Initial Contract Price ($M) Current Contract Price ($M) Estimated Price At Completion ($M) Target Ceiling Qty Target Ceiling Qty Contractor Program Manager
93.9 93.9 35 2125.3 2242.0 35 2082.5 2125.1
Variance Cost Variance Schedule Variance Cumulative Variances To Date -1.9 -10.9 Previous Cumulative Variances -- -- Net Change -1.9 -10.9
Cost And Schedule Variance Explanations The unfavorable cumulative cost variance is due to higher than budgeted material costs associated with select efforts. The unfavorable cumulative schedule variance is due to delays in issuing parts in inventory to the production floor and some delinquent tasks associated with implementation of Block C configuration changes. Notwithstanding these delays, deliveries are projected to be made on or ahead of schedule.
Contract Comments The difference between the initial contract price target and the current contract price target is due to the initial contract price reflecting the value of advance procurement funded items only. The current contract price reflects the full airframe value. This is the first time this lot of this contract is being reported.
V-22 December 31, 2011 SAR
UNCLASSIFIED 51
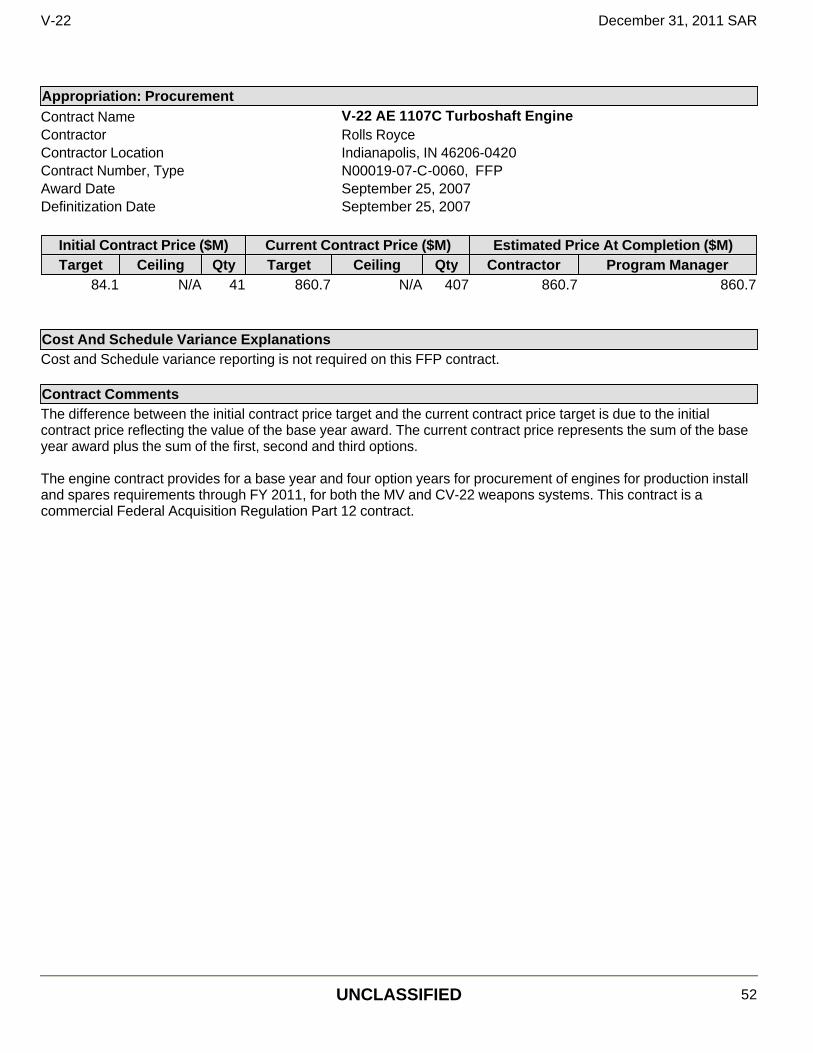
Appropriation: Procurement Contract Name V-22 AE 1107C Turboshaft Engine Contractor Rolls Royce Contractor Location Indianapolis, IN 46206-0420 Contract Number, Type N00019-07-C-0060, FFP Award Date September 25, 2007 Definitization Date September 25, 2007
Initial Contract Price ($M) Current Contract Price ($M) Estimated Price At Completion ($M) Target Ceiling Qty Target Ceiling Qty Contractor Program Manager
84.1 N/A 41 860.7 N/A 407 860.7 860.7
Cost And Schedule Variance Explanations Cost and Schedule variance reporting is not required on this FFP contract.
Contract Comments The difference between the initial contract price target and the current contract price target is due to the initial contract price reflecting the value of the base year award. The current contract price represents the sum of the base year award plus the sum of the first, second and third options. The engine contract provides for a base year and four option years for procurement of engines for production install and spares requirements through FY 2011, for both the MV and CV-22 weapons systems. This contract is a commercial Federal Acquisition Regulation Part 12 contract.
V-22 December 31, 2011 SAR
UNCLASSIFIED 52

Appropriation: RDT&E Contract Name CV-22 Block 20 Contractor Bell-Boeing, JPO Contractor Location Amarillo, TX 79111 Contract Number, Type N00019-08-C-0025, CPFF Award Date December 21, 2007 Definitization Date December 21, 2007
Initial Contract Price ($M) Current Contract Price ($M) Estimated Price At Completion ($M) Target Ceiling Qty Target Ceiling Qty Contractor Program Manager
8.5 N/A N/A 175.9 N/A N/A 148.5 175.8
Variance Cost Variance Schedule Variance Cumulative Variances To Date +5.3 -2.7 Previous Cumulative Variances +6.5 -3.5 Net Change -1.2 +0.8
Cost And Schedule Variance Explanations The unfavorable net change in the cost variance is due to more effort needed than originally planned for select efforts. In addition, obsolescence issues with test lab equipment adversely impacted some testing efforts. Overall, cost performance continues to be positive. The favorable net change in the schedule variance is due to a mitigation plan put in place to "burn down" select delinquent tasks.
Contract Comments The difference between the initial contract price target and the current contract price target is due to the initial contract price reflecting the value of Block 20 Increment I. The current contract price reflects the value of Block 20 Increments I & II.
V-22 December 31, 2011 SAR
UNCLASSIFIED 53

Appropriation: Acq O&M Contract Name PBL Phase 1/1.5 Contractor Bell-Boeing, JPO Contractor Location Amarillo, TX 79111 Contract Number, Type N00019-09-D-0008, CPIF Award Date January 22, 2009 Definitization Date January 22, 2009
Initial Contract Price ($M) Current Contract Price ($M) Estimated Price At Completion ($M) Target Ceiling Qty Target Ceiling Qty Contractor Program Manager
581.4 N/A N/A 463.2 N/A N/A 445.9 445.9
Variance Cost Variance Schedule Variance Cumulative Variances To Date +7.3 0.0 Previous Cumulative Variances +0.4 -1.4 Net Change +6.9 +1.4
Cost And Schedule Variance Explanations The favorable net change in the cost variance is due to travel and relocation being less than originally planned due to cost savings initiatives to hire locally rather than relocate personnel. The favorable net change in the schedule variance is due to completion of select suppliers services ahead of schedule.
Contract Comments The difference between the initial contract price target and the current contract price target is due to the initial contract price reflecting the cumulative total value of orders that can be placed for Integrated Logistics Support (ILS) efforts only, while the current contract price represents the value of ILS efforts ordered to date.
V-22 December 31, 2011 SAR
UNCLASSIFIED 54
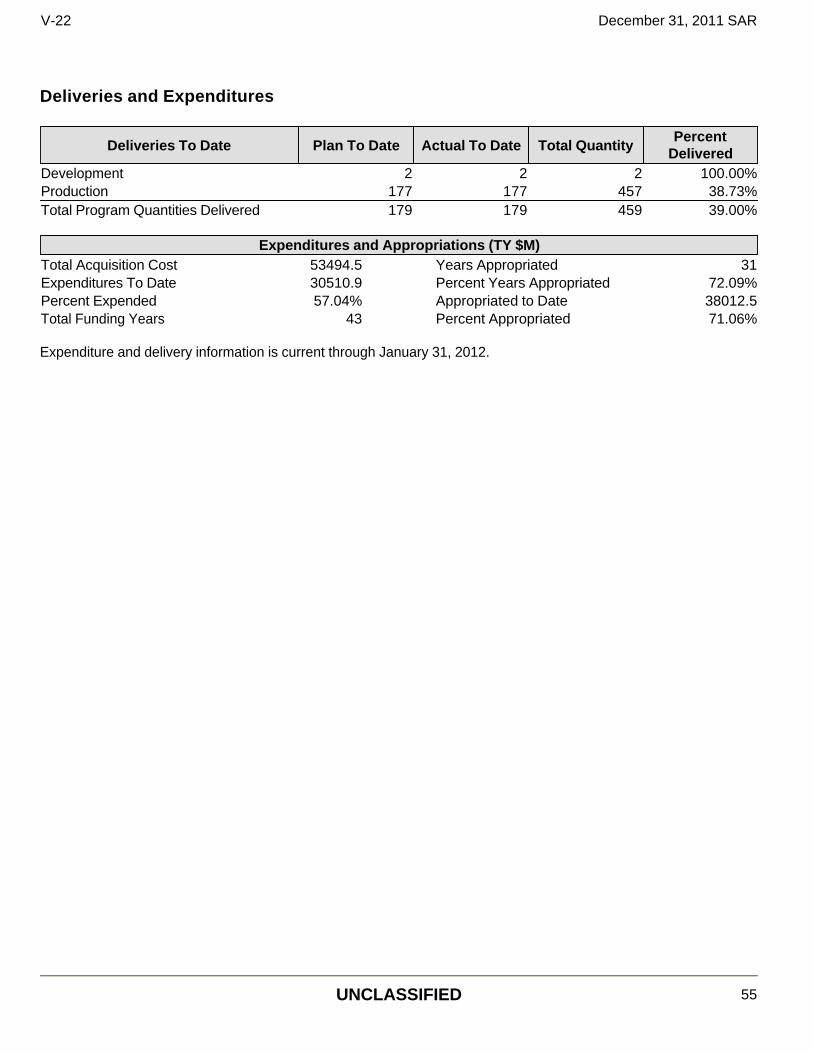
Deliveries and Expenditures
Expenditure and delivery information is current through January 31, 2012.
Deliveries To Date Plan To Date Actual To Date Total Quantity Percent
Delivered Development 2 2 2 100.00% Production 177 177 457 38.73% Total Program Quantities Delivered 179 179 459 39.00%
Expenditures and Appropriations (TY $M) Total Acquisition Cost 53494.5 Years Appropriated 31 Expenditures To Date 30510.9 Percent Years Appropriated 72.09% Percent Expended 57.04% Appropriated to Date 38012.5 Total Funding Years 43 Percent Appropriated 71.06%
V-22 December 31, 2011 SAR
UNCLASSIFIED 55
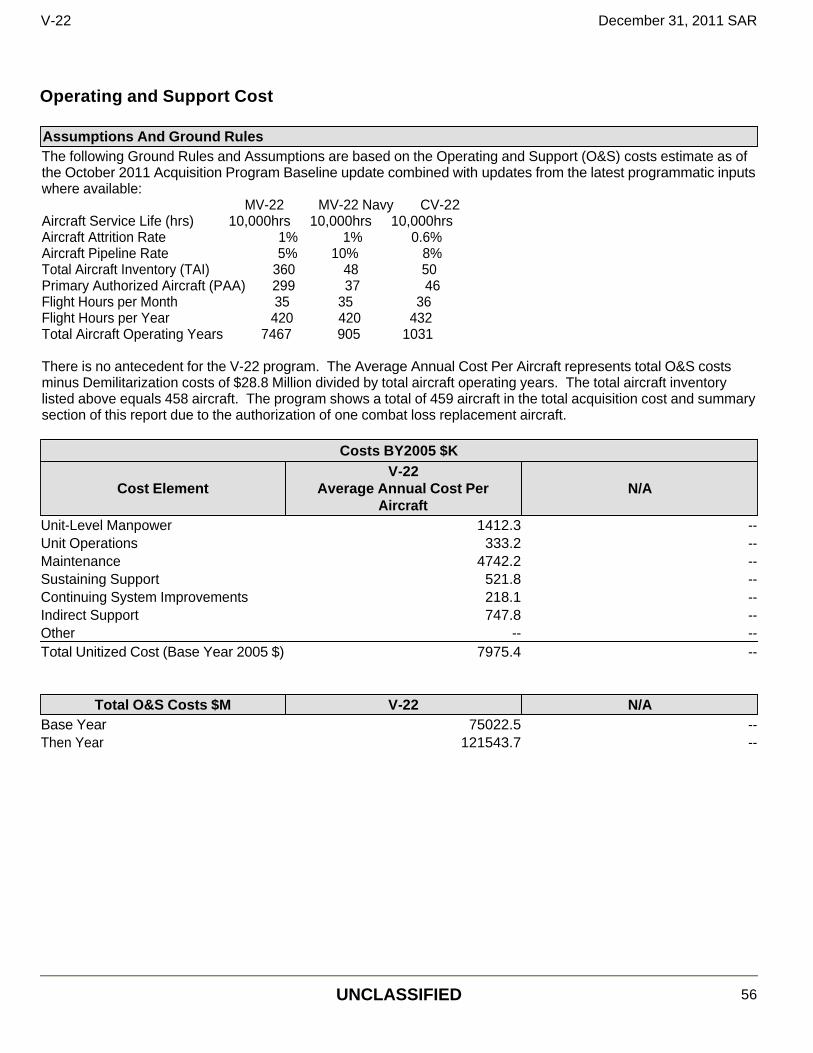
Operating and Support Cost
Assumptions And Ground Rules The following Ground Rules and Assumptions are based on the Operating and Support (O&S) costs estimate as of the October 2011 Acquisition Program Baseline update combined with updates from the latest programmatic inputs where available: MV-22 MV-22 Navy CV-22 Aircraft Service Life (hrs) 10,000hrs 10,000hrs 10,000hrs Aircraft Attrition Rate 1% 1% 0.6% Aircraft Pipeline Rate 5% 10% 8% Total Aircraft Inventory (TAI) 360 48 50 Primary Authorized Aircraft (PAA) 299 37 46 Flight Hours per Month 35 35 36 Flight Hours per Year 420 420 432 Total Aircraft Operating Years 7467 905 1031 There is no antecedent for the V-22 program. The Average Annual Cost Per Aircraft represents total O&S costs minus Demilitarization costs of $28.8 Million divided by total aircraft operating years. The total aircraft inventory listed above equals 458 aircraft. The program shows a total of 459 aircraft in the total acquisition cost and summary section of this report due to the authorization of one combat loss replacement aircraft.
Costs BY2005 $K
Cost ElementV-22
Average Annual Cost Per Aircraft
N/A
Unit-Level Manpower 1412.3 --Unit Operations 333.2 --Maintenance 4742.2 --Sustaining Support 521.8 --Continuing System Improvements 218.1 --Indirect Support 747.8 --Other -- --Total Unitized Cost (Base Year 2005 $) 7975.4 --
Total O&S Costs $M V-22 N/ABase Year 75022.5 --Then Year 121543.7 --
V-22 December 31, 2011 SAR
UNCLASSIFIED 56
Top Related