


Languages
Pages
Legal


1
Seismic Design Implications for Low-to-moderate Seismicity Regions from Earthquake Simulation Tests
on RC Building Structures in Korea
*Han Seon Lee1)
1) School of Civil, Environmental, and Architectural Engineering,
Korea University, Seoul, 136-713, Korea 1)
ABSTRACT
This paper briefly introduces the state of practice in seismic design and construction in Korea. Then, the experimental researches through the earthquake simulation tests to identify the seismic weakness of reinforced concrete (RC) nonseismic building structures designed only for gravity loads and also to observe seismic performance of RC residential building structures designed per the recent Korean seismic code are presented. Based on all these observations, some important seismic design implications are summarized for code writers or engineers in low-to-moderate seismicity regions.
1. INTRODUCTION OF SEISMIC CODES AND DESIGN PRACTICE IN KOREA
Seismic design requirements in the building design code was introduced for the first time in 1988 by the Architectural Institute of Korea(AIK) since the damages and loss of lives by 1985 Mexico City earthquake exceeded the level tolerable to any government such as the Korean government that was then preparing for the 1988 Summer Olympic Game in Seoul. The change in the equations for the design base shear of building structures is shown in Table 1.
Design peak ground acceleration (PGA) defined as zone factor was 0.12g or 0.08g in 1988 version. In 1997 Earthquake Engineering Society of Korea (EESK) set forth the equation of design base shear for all type of facilities as shown in Equation (2) with the modification of zone factor to 0.11g or 0.07g. This formula is actually the same as the corresponding equation in UBC 97 (Uniform Building Code 1997). In the same report, EESK also defined seismic hazard factors for the relative intensity of design earthquakes which have different return periods as shown in Table 2. According to modification of zone factor by EESK 1997, AIK changed the corresponding factor, from
1)
Professor
Invited Paper

2
0.12g and 0.08g to 0.11g and 0.07g in the earthquake load equation in 2000 (AIK 2000). Architectural Institute of Korea substantially revised this code (AIK 2000) to Korea Building Code (KBC) in 2005. KBC 2005 follows the framework of International Building Code (IBC) in 2000. The maximum considered earthquake (MCE) having the return period of 2500 year, was defined with PGA = 0.22g or 0.14g. The design earthquake (KBC 2005) has been changed from the earthquake with the return period of 500 years to two third of the intensity of the MCE. With a calibration of the values of SDS and SD1 for this level of PGA’s for several soil conditions, the values are defined as the design values for the Equation (4) in Table 1. As shown in Fig. 1, which compares the elastic design spectra of AIK 2000 and KBC 2005, the design base shear in KBC 2005 has increased remarkably due to the considerations of high amplification of soft soil and the change in the definition of design earthquake. KBC 2009 has maintained the frame work of KBC 2005, but expanded the classification of structures and modified some factors.
Table 1. History of base shear in seismic building design codes in Korea
Design code Base shear
AIK 1988 (allowable
stress design)
WR
AIW
RT
AISV
75.1
2.1= ≤ or
5.1= W
R
AISV (1)
A: zone factor (0.12, 0.08), I: importance factor, S: soil factor (3 groups), R: response modification factor, T: fundamental period Design earthquake (EQ): EQ with return period of 500 years
EESK 97* (strength design)
WR
ICW
RT
ICV
av 5.2 = ≤ (2)
Ca, Cv: seismic coefficient (0.11, 0.07), I: importance factor, R: response modification factor, T: fundamental period, Soil factor: 6 groups (SA, SB, SC, SD, SE, SF) Design earthquake (EQ): EQ with return period of 500 years
AIK 2000 (allowable
stress design)
WR
AIW
RT
AISV
75.1
2.1= ≤ (3)
A: zone factor (0.11, 0.07), I: importance factor, S: soil factor (4 groups), R: response modification factor, T: fundamental period Design earthquake (EQ): EQ with return period of 500 years
KBC 2005 (strength design)
WIR
SW
TIR
SV
E
DS
E
D
/
)/(=
1≤ (4)
SD1, SDS: spectral accelerations at period 1sec and 0.2sec, respectively, , I: importance factor, R: response modification factor, T: fundamental period, Soil factor: 5 groups (SA, SB, SC, SD, SE) Design earthquake = (2/3)×MCE (return period of 2500 years)
* EESK 97 is a research report which was not implemented into the design code.

3
0
0.1
0.2
0.3
0.4
0.5
0.6
0.7
0.8
0 1 2 3 4 5Period (sec)
Sa
(g
)
S1
S2
S3
S4
A=0.11
I=1.0, R=1.0
0
0.1
0.2
0.3
0.4
0.5
0.6
0.7
0.8
0 1 2 3 4 5Period (sec)
Sa
(g
)
SA
SB
SC
SD
SE
A=0.11
I=1.0, R=1.0
(a) AIK 2000 (b) KBC 2005
Fig. 1 Elastic design spectrum (strength design level)
7.9
13.4
22.6
37.5
47.752.5
58.4
0
10
20
30
40
50
60
70
1980 1985 1990 1995 2000 2005 2010
Rati
o o
f A
part
men
ts / T
ota
l (%
)
Year
Year 2010
Total No. of housing units: 14,577,419
Total No. of apartment units: 8,576,013
National Census (a) The number of apartment units in Korea (b) A bird eye view to a district of Seoul
Fig. 2 RC residential buildings in Korea
Table 2. Scale factor of the design PGA for the EQ. with return period (EESK 1997)
Return period (year) 50 100 200 500 1000 2400
Scale factor 0.40 057 0.73 1.0 1.4 2.0
The intensity of design earthquake defined in KBC 2009 is introduced in Fig. 3(a)
in several forms of spectrum. And the case of soil condition SC are compared between Seoul in Korea and Melbourne in Australia, where the design intensity in Seoul appears much higher than that in Melbourne (Fig. 3(b)). Also, design spectrum in KBC 2009 is compared with the response spectrum of El Centro (1949) and Taft (1952) earthquake recorded accelerograms, where soil condition of El Centro corresponds to SD with that of Taft to SC in Fig. 3(c). It can be seen that the design spectrum in KBC 2009 is comparable those of magnitude 6.9 and 7.3 earthquake ground motions, which means that the intensity of Korean design earthquake may be overly high since Korean peninsula is generally known to be a low-seismicity zone.
Lateral-force resisting building system are classified as shown in Table 4. There are some difference between KBC 2009 and IBC 2006. Generally, Korean Code follows the classification of US codes. Some important difference are the height limit for high-rise building structure, but KBC 2009 requires the special seismic details for the building structures with the height exceeding 60m and belonging to the design category D. Most of the residential buildings as shown in Fig. 2(b) do not belong to this category but more residential buildings recently constructed exceed this height limit, therefore become subject to special detailing requirement as shown in Fig. 4, where the congestion of reinforcement due to this requirement cause difficulty in construction.

4
0
10
20
30
40
50
60
0 1 2 3 4
Sd
(cm
)
T (sec)
Design spectrumSa
Sb
Sc
Sd
Se
0.0
0.2
0.4
0.6
0.8
0 5 10 15
Sa
(g
)
Sd (cm)
ADRS Sa
Sb
Sc
Sd
Se
Sa(g) Sd(cm), T=3.0s
Sa 0.293 8.7
Sb 0.367 10.9
Sc 0.433 17.3
Sd 0.499 21.4
Se 0.653 34.1
0.0
0.2
0.4
0.6
0.8
0 1 2 3 4
Sa
(g
)
T (sec)
Design spectrum Sa
Sb
Sc
Sd
Se
0
20
40
60
80
100
0 1 2 3 4
Sv
(cm
/s)
T (sec)
Design spectrum Sa
Sb
Sc
Sd
Se
Ts(sec) Sv(cm/s)
Sa 0.4 18.3
Sb 0.4 22.9
Sc 0.536 36.2
Sd 0.576 44.9
Se 0.701 71.6
(a) Design spectrum of KBC2009 (Seismic zone 1 (S = 0.22g))
0.0
0.1
0.2
0.3
0.4
0.5
0 5 10 15 20
Sa
(g
)
Sd (cm)
ADRSSeoul (Sc)
Melbourne (Sc)
0.0
0.1
0.2
0.3
0.4
0.5
0 1 2 3 4
Sa
(g
)
T (sec)
Design spectrum
Seoul (Sc)
Melbourne (Sc)
0
10
20
30
40
50
60
0 1 2 3 4
Sv
(cm
/s)
T (sec)
Design spectrum Seoul (Sc)
Melbourne (Sc)
Seoul Zone factor, S=0.22g
(Return period of Zone 1 : 2400yr)
T0= 0.107, Ts=0.536
Soil factor: Sc (Vs.30=360~800m/s)
0
5
10
15
20
25
30
0 1 2 3 4S
d (cm
)
T (sec)
Design spectrum
Seoul (Sc)
Melbourne (Sc)
Melbourne Hazard factor, a=0.144g (z=0.08g)
Probability factor, kp=1.8 (2500yr)
T1= 0.35, T2=1.5
Soil factor: Be (Vs.30=360m/s ~)
(b) Design spectra for Seoul and Melbourne: low-to-moderate seismicity regions (Lam, 2014)
Taft earthquake
Magnitude, M=7.3
Rupture distance, R=43.49km
Soil factor, Sc (VS.30=385.4m/s)
El Centro earthquake
Magnitude, M=6.9
Rupture distance, R=12.99km
Soil factor, Sd (VS.30=213.4m/s)
0.0
0.2
0.4
0.6
0.8
0 1 2 3 4
Sa
(g
)
T (sec)
Design spectrum KBC 2009_Sc
KBC 2009_Sd
El centro (Sd)
taft (Sc)
0
20
40
60
80
100
120
0 1 2 3 4
Sv
(cm
/s)
T (sec)
Design spectrumKBC 2009_Sc
KBC 2009_Sd
El centro (Sd)
taft (Sc)
0
10
20
30
40
50
60
0 1 2 3 4
Sd
(cm
)
T (sec)
Design spectrum KBC 2009_Sc
KBC 2009_Sd
El centro (Sd)
taft (Sc)
0.0
0.2
0.4
0.6
0.8
0 10 20 30 40
Sa
(g
)
Sd (cm)
ADRS KBC 2009_Sc
KBC 2009_Sd
El centro (Sd)
taft (Sc)
(c) Comparison among KBC2009, El Centro, and Taft Spectra
Fig. 3 Design spectra

5
Table 3. Classification of facilities to “seismic design categories” in KBC2009 (Fardis, 2014)
EPA on rock under MCE Special facilities* High
consequences** Ordinary facilities
Temporary, not for people
EPA < 0.045g A A A A
0.045g < EPA < 0.05g B A A A
0.05g < EPA < 0.06g B B A A
0.06g < EPA < 0.075g B B B A
0.075g < EPA < 0.085g B B B B
0.085g < EPA < 0.1g D B B B
0.1g < EPA < 0.12g D D B B
0.12g < EPA < 0.15g D D D B
0.15g < EPA D D D D
* Special facilities: essential in post-disaster emergency, or with hazardous contents. ** High consequences: large occupancy, congregation areas, etc.
Table 4. Design factors for RC lateral force-resisting systems (Fardis, 2014)
Code KBC 2009 IBC 2006 (ASCE 7-05)
Seismic Force- Resisting System
Design factors
Height limit
Design factors
Height limit
Design Category
Design Category
R Ω0 Cd C D R Ω0 Cd C D
Bearing wall systems
Special RC walls 5 2.5 5 - - 5 2.5 5 - 50m Ordinary RC walls 4 2.5 4 - 60m 4 2.5 4 - X
Building frame systems
Special RC walls 6 2.5 5 - - 6 2.5 5 - 50m Ordinary RC walls 5 2.5 4 - 60m 5 2.5 4.5 - X
Moment resisting frame (MRF)
Special MRF 8 3 5.5 - - 8 3 5.5 - - Intermediate MRF 5 3 4.5 - - 5 3 4.5 - -
Ordinary MRF 3 3 2.5 - X 3 3 2.5 X X
Dual systems with special MRF
Special RC walls 7 2.5 5.5 - - 7 2.5 5.5 - - Ordinary RC walls 6 2.5 5 - X 6 2.5 5 - X
Dual systems with intermediate MRF
Special RC walls 6.5 2.5 5 - - 6.5 2.5 5 - 50m Ordinary RC walls 5.5 2.5 4.5 - 60m 5.5 2.5 4.5 - X
(a) Special details of shear walls (b) Mock-up test of special shear wall
(30-story residential bldg. in Daegu, Korea) Fig. 4 Problems of special details required for category SD

6
2. EARTHQUAKE SIMULATION TESTS IN KOREA
2.1 1:5-scale 3-story RC Ordinary Moment-Resisting Frame with Nonseismic Detailing The objectives of the research (Lee and Woo, 2002a) are to investigate the
seismic performance of a 3-story reinforced concrete (RC) ordinary moment-resisting frame, which has not been engineered to resist earthquake excitations.
The prototype of this test model was adopted from a building structure for the police office, actually built and in use in Korea. The plan and elevation of the 1:5 scale model are shown in Fig. 5(a). The compressive strength of concrete, fc’, in the prototype structure is assumed to be 20.6 MPa and the nominal yield strength of reinforcement, 294.2 MPa. The typical sections of members and the details regarding transverse steel, anchorage and splice are shown in Fig. 5(d). The important characteristics in the Korean detailing practice are as follows: (1) the splice is located at the bottom of the column, (2) the spacing of hoops is relatively large, (3) seismic hooks are not used, (4) confinement reinforcements are not used in beam-column joints, and (5) the special style of anchorage in the joints. That is, the length of tension and compression anchorage are usually 40db and 25db respectively, from the critical section, where db means the nominal diameter of reinforcement. Moreover, the length of the tail in the hook is included in this anchorage length and the tails of the anchorage of the bottom bars in beams usually direct downward into the exterior columns.
Considering the capacity of the shaking table to be used, the reduction scale for the model was determined as 1:5. Using the techniques for manufacturing the model according to the similitude requirements developed through other researches, a 1:5 scale 2-bay 3-story RC frame model (bare frame (BF) model) was constructed. This model was, then, subjected to the shaking table motions simulating Taft N21E component earthquake ground motions (Fig. 6(a)), whose magnitude of peak ground acceleration (PGA) was modified to approximately 0.12g, 0.2g, 0.3g, and 0.4g in Table 5. The used shaking table in the laboratory at Hyundai Institute of Construction Technology is 3m×5m with one degree of freedom. Displacement transducers, accelerometers and load cells were used to measure the lateral displacement and the angular rotations in some ends of beams and columns, acceleration at each story, and shear forces on the columns of the first story. Before and after each earthquake simulation test, free vibration tests were performed to determine the change in the natural period and the damping ratio of the model. Due to the limitation in the capacity of the used shaking table, a pushover test was performed to observe the ultimate capacity of the structure after earthquake simulation tests.
Though the model structure in this study was designed only for the gravity loads in zones of low seismicity, the structure could resist not only the design earthquake, which it would be supposed to resist if it were to be designed against earthquake, but also the higher levels of the earthquake excitations. The main components of its resistance to the high level of earthquakes appear to be (1) the high overstrength (Fig. 6(b)), (2) the elongation of the fundamental period (Table 6), (3) the minor energy dissipation by inelastic deformations (Fig. 6(c)), and (4) the increase of the damping ratio (Table 6).

7
3110
12601260 480
840
420
420
1680
6050
Frame A
(Instrumented frame)
Frame B
3110
2220600
660
600
3600
3001260300 1740
600
LOAD CELL
300
H300x300x10x15
LOAD CELL
H100x100x6x8
SHAKING TABLE
120
120
120
300
B1
B1'
C2'C2
*See (h) for detail
C1 C1' C3 C3'
25
B2'
B2
(b) Shaking table tests
(a) Plan and elevation (c) Pushover test
Section C1-C1’ Section C2-C2’ Section C3-C3’
(d) detais of column Fig. 5 1:5-scale 3-story RC moment-resisting frame model (Lee and Woo, 2002a)
Table 5. Test program of BF model
Identification of Test PGA (g) Remarks (Return Period)
Earthquake Simulation
Test
TFT_012 0.12 Design earthquake (EQ.) in Korea (500 years) TFT_02 0.2 Max. EQ. in Korea (1000 years) TFT_03 0.3 Max. considered EQ. in Korea (2000 years) TFT_04 0.4 Severe EQ. in high seismic regions of the world
Pushover Static Test
PUSH - Ultimate capacity of the structure
Table 6. Natural period and damping ratio by free-vibration test of BF model
Identification of Test Before
TFT_012 After
TFT_012 After
TFT_02 After
TFT_03 After
TFT_04
Natural period (sec) 0.266 0.229 0.265 0.265 0.317 Damping ratio (%) 4.1 4.6 4.4 5.8 7.9

8
0
0.05
0.1
0.15
0.2
0.25
0.3
0.35
0.4
0 0.5 1 1.5 2
Period(sec)
V/W
Output
Input
Korea(Elastic)
UBC(Elastic)
Korea(R=3.5)
UBC(Rw=5.0)
R=3.5 Rw=5.0
UBC(Elastic)
KOREA(Elastic)
0.226 0.317
Range of model
(a) Response spectrum for input and output table motions and design spectra
-60
-40
-20
0
20
40
60
-60 -40 -20 0 20 40 60
Roof Drift(mm)
Base S
hear(
kN
)
TFT_012 (Experiment)TFT_02 (Experiment)TFT_03 (Experiment)TFT_04 (Experiment)Pushover (Experiment)PUSH-I (Analysis)PUSH-II (Analysis)TFT_012(Analysis)TFT_04(Analysis)
y=20.0 u=47.2
crushing of concrete at column
first significant yield
10.82
24.33 Push-IPush-II
0
500
1000
1500
2000
2500
3000
3500
4000
4500
0 5 10 15 20 25 30
Time(sec)
Ab
so
rbed
En
erg
y(k
N*m
m) TFT_012
TFT_04
1st story 2nd story
3rd story 1st story
2nd story
3rd story
(b) Base shear versus roof drift in tests
and analyses (c) Time histories of absorbed energy in
earthquake simulation test
(d) Development of cracks in pushover test
(e) Typical global structural response idealized
as linearly elastic-perfectly plastic curve (f) Effective earthquake load factor for first significant yield at critical member ends
Fig. 6 Test results of BF model (Lee and Woo, 2002a)

9
The overstrength factor, Ω, of the model structure can be demonstrated by calculating both Ωs=Cs/Cω and Ωy=Cy/Cs with respect to the flexural moment capacity as follows: First, the coefficient, Ωs, can be calculated through the linear elastic analysis of the model structure up to the occurrence of the first plastic hinge. It was found through linear elastic analyses that the model structure can meet the flexural moment demands under the load cases of 1.4D+1.7L and 0.75(1.4D+1.7L±1.87E), with the minimum margin of safety being 25% and 34%, respectively. However, since the gravity load condition during the earthquake simulation tests can be described as 1.0D, the ratios of the demanded flexural moment to the capacity for the load case, 1.0D, are recalculated. Then, by comparing the demanded flexural moment for the load case of earthquake (1.0E) to the reserved flexural capacity (Capacity -1.0D), we can obtain the coefficient, Ωs, which is the least value as shown in Fig. 6(f). This value, Ωs, appears to be 5.06 and this is similar to the ratio Ωs=Cs/Cω derived from pushover analysis, (24.33 kN) / (4.61 kN) = 5.28. Secondly, Ωy=Cy/Cs can be calculated in case of the experiment (with strain aging) Cy/Cs = (51.35 kN) / (24.33 kN) = 2.11 and, in case of the analysis (without strain aging) Cy/Cs = (40.00 kN) / (24.33 kN) = 1.64. Therefore, the overstrength coefficient, Ω, can be obtained by multiplying these two coefficients as 11.1 (with strain aging) or 8.7 (without strain aging). These large values of the overstrength coefficient account for the reason why the low-rise RC building structures have the large reserved strength for severe earthquakes even though they were designed only for the gravity loads in the lower seismic zones.
The design base shear derived from the linear elastic base shear of the structure divided by the response modification factor, R=3.5, seems to be completely fictitious or misleading because the high overstrength factor, Ω=8.7, implicit in the structure due to the pre-existing overstrength of the materials and section properties and the reduction in the dead and live loads with regards to the reactive weight caused the model structure behave entirely linear elastically under the design earthquake. Therefore, as far as this study alone is concerned, it is more reasonable that the concept of the reduction of the design base shear considering the energy dissipation by the inelastic response under the design earthquake be waived for the low-rise building structures in the low-seismicity regions. However, considering the possibility of unexpected large earthquakes, the structures in low-to-moderate seismicity regions should retain the ductility to some extent, which can be achieved through the implementation of the requirements on the detailing of reinforcement and structural layout of important lateral-load-resisting elements.
2.2 1:5-scale 3-story Masonry-Infilled RC Frame with Nonseismic Detailing
Lee and Woo (2002b) investigated the actual responses of masonry-infilled RC
frame with nonseismic detailing under the simulated earthquake ground motions. After earthquake simulation tests, the monotonically-increasing lateral-load test or the pushover test was performed to find out the ultimate capacities of the model. By comparing the results of these tests with those in the case of the bare frame (Lee and Woo, 2002a), the significance or the effect of masonry infills are evaluated.
Two layouts of masonry infills in Figs. 7(a) and (b) were used for earthquake simulation tests: that is, fully infilled frame (FIF) and partially infilled frame (PIF). The

10
experimental setups for the shaking table tests are shown in Figs. 7(c). Two displacement transducers and accelerometers were installed at each floor to measure the effect of torsion due to accidental asymmetry of two frames. A load cell was installed in the mid-height of the column at the first story to measure the shear force of each column. To measure the local responses such as the end angular rotations in the possible plastic hinge regions, 16 displacement transducers were used. And also, to measure the strains at the center of the masonry infills, strain gauges were diagonally attached in the plane of masonry infills. After the series of earthquake simulation tests have been conducted on the FIF model, there appeared to be only minor cracks on the masonry infills with the frame itself remaining intact. Therefore, a portion of masonry infills were removed as shown in Fig. 7(d) and then this model, defined as PIF, was again subjected to the same series of earthquake simulation tests as the FIF. The experimental setup for the pushover test is shown in Fig. 7(d). The adopted input ground accelerogram is the Taft N21E component and the peak ground acceleration (PGA) was modified to 0.12g, 0.2g, 0.3g, and 0.4g as shown in Table 5, which is the same as BF model, while the time scale has been compressed according to the similitude law.
Frame B
Frame A: Instrumented frame
Infill wall
Frame B
Frame A: Instrumented frame
Infill wall
(a) Plan of FIF (b) Plan of PIF
LOAD CELLLOAD CELL
D4 D5
D6 D7
A4 A5
A6 A7
D2 D3 A2 A3
LOAD CELL
REFERENCE FRAME
1740
A1-1 A1-2
D1
300 1260 300
3600
STRAIN GAGE 300
120
600
120
660
120
600
R3
2520R4
R5
R1
R2
R6
R8
R9
R7
SHAKING TABLE
(c) Shaking table test of FIF (Fully Infilled Frame)
D1
REFERENCE FRAME
D2
D3
LOAD CELL
WHIFFLE TREE
D4 D5 D6
ACTUATOR
Strain Gage
LOAD CELL
(d) Pushover test of PIF (Partially Infilled Frame) Fig.7 1:5-scale 3-story masonry-infilled RC frame model (Lee and Woo, 2002b)

11
The natural periods of FIF and PIF models are compared with those of the bare frame (BF) model in Fig. 8(a). The period of FIF model (0.06 sec) was found to be the shortest while the PIF model (0.17 sec) shows shorter period than the BF model (0.23 sec). The natural period of the FIF model did not change significantly except the small increase after TFT_03 test whereas that of the PIF model was found to increase gradually as the applied peak ground acceleration (PGA) increased. In Fig. 8(b), maximum interstory drift indices (I. D. I.) in the FIF and PIF models under the varying peak input accelerations are shown and compared with those measured in the case of BF. The drifts of the PIF are greater than those of the FIF under the same level of input ground motions. However, I. D. I. of neither FIF nor PIF exceeds the maximum value of 1.5% allowed in the Korean seismic code even under TFT_04.
Fig. 8(c) show the hysteretic relations between the base shear and the interstory drift at the first story of FIF, PIF, and BF, respectively. It can be seen that FIF, PIF, and BF all behave linear elastically under TFT_012 which is assumed to represent the design earthquake in Korea. The stiffness of FIF:PIF:BF turns out to be 147kN/mm: 33.3kN/mm:7.94kN/mm. The FIF model had more energy absorption through the friction within the infills or between the infills and the bounding frame with the stiffness remaining almost constant as the intensity of earthquake ground motions became higher. On the other hand, the PIF model revealed the phenomenon of varying drift with almost constant base shear. The reason for this phenomenon is conceived due to the prior occurrence of the bed-joint sliding cracks at the second-story infill masonry. The amount of energy absorption in PIF is found to be the smallest in Fig. 8(d). Finally, the BF model reveals clear yielding under TFT_04 and therefore a large amount of input energy could be dissipated by this yielding. The maximum base shear of FIF, PIF, and BF under TFT_012 were 32.0 kN, 37.3 kN, and 17.6 kN, respectively. These are 2.5 to 5.3 times the design base shear, 7.03 kN, according to the Korean seismic code, which will be shown later.
There appeared neither significant damage on the masonry infills, nor any damage on the frame itself even under the severe earthquake ground motions in Fig. 8(e). The contribution of masonry infills to the global capacity of the structure turns in PIF model out to be 80% in strength and 85% in stiffness from the results of pushover test as shown in Fig. 9(c). However, the failure mode of the masonry-infilled frame in Fig. 9(b) was that of shear failure due to the bed-joint sliding of the masonry infills while that of the bare frame appeared to be the soft-story plastic mechanism at the first story and the deformation capacity of the global structure remains almost same regardless of the presence of the masonry infills. Therefore, it is essential to consider the effect of masonry infills for the practical evaluation of the seismic safety of moment-resisting RC frame buildings.
Masonry infills behave beneficially on buildings as far as this experimental study alone is concerned. The reason for their beneficial behaviors is that the amount of increase in earthquake inertia force appears to be relatively small, when compared with the increase in the strength by masonry infills as shown in Fig. 9(a). Above all, masonry infills appear to have a great effect on the reduction of the global lateral displacement. The quality of masonry infills, however, depends on the workmanship of masons and also the credibility of the structural system depends in turn on the quality of masonry. In case that there are openings in masonry infills, or that panels are partially infilled with masonry, a more complicated mode of failure can occur with the interaction to the bounding frame, as already seen in many instances of earthquake damages.
12
0.063 0.062 0.058 0.07 0.071
0.165 0.160.179 0.184 0.196
0.226 0.229
0.265 0.265
0.317
0
0.1
0.2
0.3
0.4
TFT_012 TFT_02 TFT_03 TFT_04
Natu
ral
Peri
od
(sec)
FIFPIFBF
1.08
0.1880.1110.1060.042
0.51
0.30.28
0.24
1.68
0.77
0.26
0
0.4
0.8
1.2
1.6
2
TFT_012 TFT_02 TFT_03 TFT_04
Inte
rsto
ry d
rift
in
de
x(%
)
FIF
PIF
BF
the maximum allowable under design earthquake: 1.5%
(a) Change of natural periods (b) Change of maximum interstory drift indices
-120
-80
-40
0
40
80
120
-16 -12 -8 -4 0 4 8 12 16
First Story Drift(mm)
Ba
se
Sh
ea
r(k
N) k=7.94 kN/mm
-120
-80
-40
0
40
80
120
-16 -12 -8 -4 0 4 8 12 16
First Story Drift(mm)
Ba
se
Sh
ea
r(k
N)
k1=4.21 kN/mm
k=3.43 kN/mm
TFT_012
TFT_04
BF model
BF model
-120
-80
-40
0
40
80
120
-16 -12 -8 -4 0 4 8 12 16First Story Drift(mm)
Ba
se
Sh
ea
r(k
N)
k=147 kN/mm
-120
-80
-40
0
40
80
120
-16 -12 -8 -4 0 4 8 12 16Interstory drift(mm)
Ba
se
sh
ea
r(k
N)
k=117.6 kN/mm
TFT_012
TFT_04
FIF model
FIF model
-120
-80
-40
0
40
80
120
-16 -12 -8 -4 0 4 8 12 16
First Story Drift(mm)
Ba
se
Sh
ea
r(k
N)
k=33.3 kN/mm
-120
-80
-40
0
40
80
120
-16 -12 -8 -4 0 4 8 12 16
First Story Drift(mm)
Ba
se
Sh
ea
r(k
N)
k=31.4 kN/mm
TFT_012
TFT_04
PIF model
PIF model
(c) Relation between base shear and interstory drift at first story of BF, FIF, and PIF
0
500
1000
1500
2000
2500
3000
3500
4000
4500
0 5 10 15 20 25 30
Time(sec)
Ab
so
rbed
En
erg
y(k
N*m
m)
1st story
2nd story
3rd story
FIF model
0
500
1000
1500
2000
2500
3000
3500
4000
4500
0 5 10 15 20 25 30
Time(sec)
Ab
so
rbed
En
erg
y(k
N*m
m)
1st story
2nd story
3rd story
PIF model
(d) Time histories of absorbed energy in earthquake simulation test (TFT_04)
(e) Crack Pattern in earthquake simulation test
Fig. 8 Shake-table test results of FIF and PIF models (Lee and Woo, 002b)

13
-120
-100
-80
-60
-40
-20
0
20
40
60
80
100
120
-60 -50 -40 -30 -20 -10 0 10 20 30 40 50 60Roof Drift(mm)
Lo
ad
(kN
)
FIF
PIF
BF
(10.2, 98.0) (43.1, 98.0)
(20.0, 40.0)
(47.2, 40.0)
BF-Experiment
PIF-Experiment
BF-Analysis
TFT_012
TFT_02
TFT_03
TFT_04
(a) Base shear versus roof drift in tests
Photo A
Photo B
(b) Development of cracks in pushover test of PIF model
0
20
40
60
80
100
120
0 5 10 15 20 25 30First Story Drift(mm)
Sto
ry S
he
ar(
kN
)
Experiment
Analysis
Actuator
Col.(1)
Col.(2)
Col.(3)
4.80 kN/mm
BF
0
20
40
60
80
100
120
0 5 10 15 20 25 30
First Story Drift(mm)
Sto
ry S
he
ar(
kN
)
Col.(1)
Col.(3)
Col.(2)
Actuator(Infill wall+Frame)
Infill wall
Frame
A
k=34.6 kN/mm
k=5.9 kN/mm
Col.(1) Col.(2) Col.(3)
PIF
(c) Column and total shears at first story in pushover test
Fig. 9 Pushover test results of BF and PIF models (Lee and Woo, 2002b)
2.3 1:12-scale 17-story RC Piloti-Type Building Model Three 1:12 scale 17-story RC wall building models having different types of
irregularity at the bottom two stories were subjected to the same series of simulated earthquake excitations to observe their seismic response characteristics (Lee and Ko, 2002; Ko and Lee 2006; Lee and Ko, 2007). From an inventory study of piloti-type buildings commonly constructed in Korea, three types of a 17-story reinforced concrete structure were selected as prototypes in Fig. 10(a). These building structures were designed according to Korean codes, AIK 2000. The first type has a symmetrical moment-resisting frame (Model 1), the second has an infilled shear wall in the central

14
frame (Model 2), and the third has an infilled shear wall in only one of the exterior frames (Model 3) at the bottom two stories.
9,700
40,5006,000
13,800
6,000
6,000
6,000
12,000
6,000
6,000
12,000
13,800
6,000 6,000
B B'
A A'
A-A'
B-B'
1,800
800
800
800
800
28-D25
Corner column
Wall
800
800 D13 @400400
6,800
16-D25
28-D25 16-D25
D13 @200 D13 @200
D13 @200
All columns except corner columns
(a) Plan, elevation, and details of prototype model
3,2
55
7
and displacement transducerLocation of accelerometer
Lo
wer
po
rtio
n
+0
+890
+450
5fl.
2nd fl.
Transfer
2,617
Up
pe
r p
ort
ion
8
1,1
00
Shaking Table
+-
Steel blocks
A
6
LoadcellA'
ReferenceFrame
+4,343 Roof
1
Accelerometer
Displacement transducer
2
A-A' sectionModel 1
Model 2
Model 3
S
A,S
S S
S A,S
A,SA,S S
A,S A,S A,S
S S S
A,SA,S S
A,S A,S A,S
A,SA,S S
A,SA,SS
A: Axial forceS: Shear force
(b) Front view, side view, and plan of 1:12 scale specimens (Models 1, 2, and 3)
150
D10 @150
D16 @150
D10
150
150
150
Steel plate (t=30)
Steel plate (t=20)
Steel plate (t=10)
Model concrete
Upperstructure
Lowerframe
Normal concrete
16 Bolt
(c) Details of connection of upper structure and lower frame
(d) Shaking table test (Model 3)
Fig. 10 1:12-scale 17-story RC building model (Ko and Lee, 2006; Lee and Ko, 2007) The reduction scale of the models was determined as 1:12 accounting for the
capacity of the available shaking table and the total mass of these models was set to half of the weight required for the true replica model in the similitude law (Fig. 10(b)). Since the rigidity of the upper bearing-wall system was considered to be much higher than that of the lower frame system, the upper system was constructed separately from

15
the lower frame system as a rigid concrete box with steel plates attached as artificial mass. The upper concrete box with a 30mm steel plate at the bottom was attached by bolting to the thick transfer floor of the lower frame, as shown in Fig. 10(c). Earthquake simulation tests were performed by using the shaking table at the Korea Institute of Machinery and Materials (KIMM). The table is 4m 4m in size and has 6 degrees of freedom, as shown in Fig. 10(d). The program of earthquake simulation tests is shown in Table 7. The adopted accelerogram was that recorded as the N21E component in the 1952 Taft earthquake. The time axis was compressed by applying the scale factor of 1/√24, and PGA was adjusted to 0.11g, 0.22g, 0.30g, 0.40g, 0.60g, 0.80g, and 1.20g corresponding to PGA’s, 0.055g, 0.11g, 0.15g, 0.2g, 0.30g, 0.40g, and 0.60g in the prototype, respectively. Because the upper portion of a model is expected to behave almost as a rigid body due to its relatively high rigidity, the global response of the models can be characterized by three kinds of global deformations in the lower frame: shear deformation (θ1), overturning deformation (θ2), and torsional deformation (θ3), whose definitions are shown in Fig. 11(a).
Elastic design spectra (R=1.0) for AIK 2000 and UBC 97 (zone 2A) adjusted by the similitude requirement are compared with the elastic response spectra of the actual shake table motions, Taft030 and Taft080 for Model 1, in Fig. 11(b). Though Taft030 is assumed to represent a design earthquake, AIK 2000 elastic design spectral values are quite different from the elastic response spectrum for Taft030. AIK 2000 elastic design spectrum tends to underestimate the spectral acceleration in the short natural period range, T < 0.2sec, and overestimate in the long natural period, T > 0.2sec. The elastic design spectrum from UBC 97matches well the elastic response spectrum derived from the table accelerograms of Taft030 of Model 1.
Table 7 Test program of 17-story RC piloti-type building models
Test PGA (g)
Remark Prototype Model
Taft011 0.055 0.11 Taft022 0.11 0.22 Taft030 0.15 0.3 Design earthquake in Korea (IE=1.5) Taft040 0.2 0.4 Taft060 0.3 0.6 Taft080 0.4 0.8 Design earthquake in a highly seismic region
Taft120 0.6 1.2 Maximum considered earthquake in a highly seismic region
The test results of 17-story RC piloti-type building models are as follows: The estimations of the fundamental periods specified for other structures than
moment frames and bearing wall structures according to the seismic codes, AIK 2000 and UBC 97, were reasonable regardless of the existence and location of the infilled shear wall in the lower stories. In Fig. 11 (c), before the earthquake simulation test, the natural period of the model structure is 0.193 second. After the first run at the University of Seoul, the natural period increased abruptly to the value of 0.266 second. The natural period of the model increased continuously for the

16
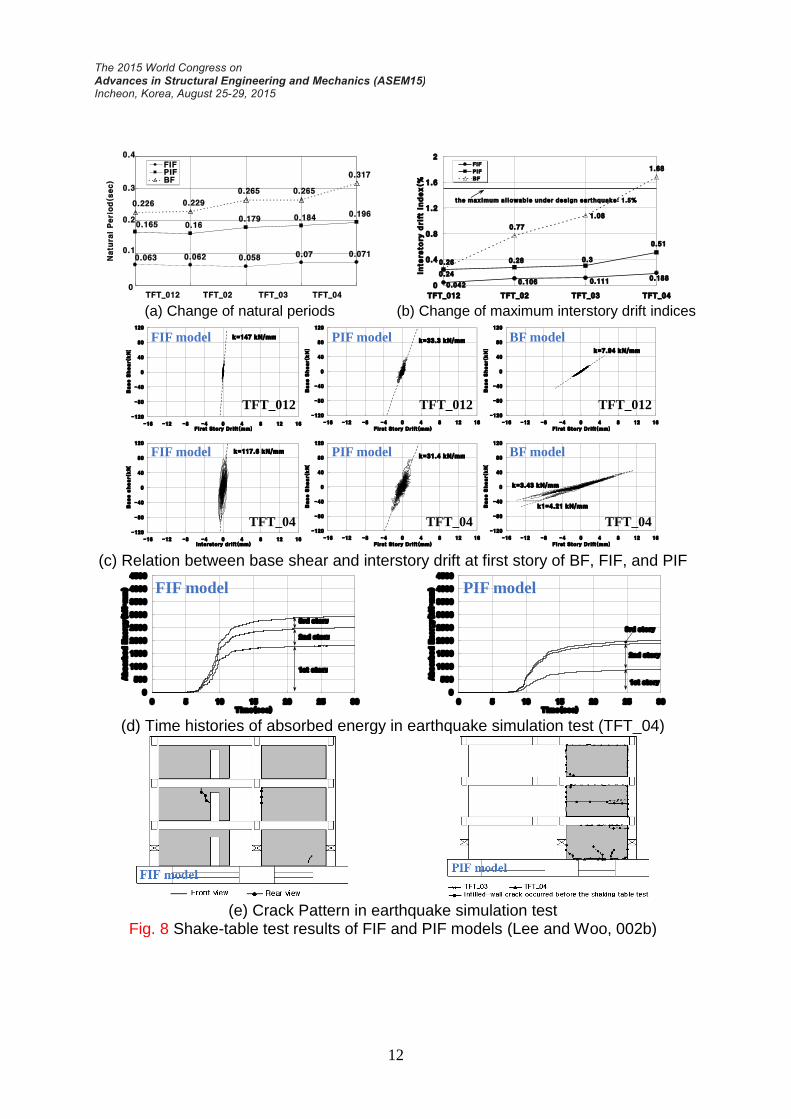
subsequent series of earthquake simulation tests. The seismic response coefficients measured under the design earthquake (Taft030) were 2.8 to 3.1 times the design coefficient, 0.048 for Models 1 and 2 and Model 3, respectively (Fig. 11 (d)). This result shows that the overstrength factor for the columns supporting the discontinuous walls given in UBC 97 or IBC 2000 is reasonable.
Model 1 having no shear wall showed a sway plastic mechanism in the lower stories during a severe earthquake (Taft080). The story drift ratio (1.57%) was much larger than the overturning deformation (0.39%). Though the sway mechanism was the governing collapse mode, the general pattern of the cracks was horizontal in the columns due to the large overturning moment. The shear wall in the central frame in Model 2 caused the reduction of shear deformation to 0.48%, which is about one third of that in the case of Model 1, while the overturning deformation was almost of a similar level (Figs. 11 (e), (f), and (g)).
The maximum values of base shear and OTM appear to be similar among all three models regardless of the existence and location of the shear wall in the lower soft frame. Shear force resisted by the shear wall amounts to approximately 78% of the total base shear in Model 2, but only 48% in Model 3. Shear wall in Model 2 showed mainly a single curvature throughout the post elastic behavior in the first story whereas the shear wall in Model 3 revealed a mixed behavior of single and double curvatures depending on the governing mode of vibration in the elastic range.
The total absorbed energy represents the damage due to earthquake input energy. In Fig. 11(j), the amounts of the total absorbed energy were almost similar for the three models. However, Model 3 was damaged by overturning, shear, and torsional deformation, whereas Model 1 and Model 2 were damaged mainly by shear and overturning deformation. Though Model 3 had a large torsional deformation in the lower stories in Fig. 11(g), the maximum shear deformation of the flexible frame in Model 3 was similar to that measured in Model 1. As shown in Figs. 11(k) and (l), the sudden change of the dynamic mode from the translation-and-torsion coupled mode (Instant 3.05s) to the torsional mode (Instant 5.05s) after the large degradation of stiffness in the flexible side due to severe shake motions caused, on the contrary, the increase of the torsional stiffness, of about 4 times that of the previous mode in Fig. 11(m). Therefore, the large torsional eccentricity did not necessarily induce a larger deformation in the flexible side in Model 3 when compared with the case of Model 1. The BST diagram in Fig. 11(n) was useful for observing the mode of vibration leading to the collapse of the system. The hysteretic curves of Model 3 under Taft080 showed that the base shear and torque were in phase during the translation/torsion coupled mode, but became out of phase during the torsional mode after the structure sustained large inelastic deformation in the flexible side. The hysteretic response and the BST diagram indicated that the most probable mode of vibration leading to the collapse of the system would be when the structure was experiencing the coupled mode, and that the three-dimensional collapse mode and its bent base shears could be easily predicted by using BST diagram.

17
0
0.5
1
1.5
2
0 0.1 0.2 0.3 0.4 0.5 0.6Period (sec)
CS (
V/W
)
AIK 2000
UBC 97
Taft030 (Model 1)
Taft080 (Model 1)
0.201(AIK 2000)
0.249
0.496
T=0.188
(R=1.0, IE=1.5)
(R=1.0, IE=1.25)
(a) Definition of deformations (b) Elastic design and table response spectra
0
0.1
0.2
0.3
0.4
Test
Natu
ral p
eri
od
(sec)
0.11g 0.22g 0.30g 0.40g 0.60g 0.80g 1.20g
T*=0.188sec
0
0.1
0.2
0.3
0.4
Test
Cs
0.22g 0.30g 0.40g 0.60g 0.80g 1.20g
Design Cs = 0.048
Design earthquake
0.11g
(c) Natural period (d) Seismic response coefficient (Cs)
-0.015
-0.01
-0.005
0
0.005
0.01
0.015
0.02
2 3 4 5 6 7 8
Time (sec)
Sh
ear
defo
rmati
on
(ra
d)
Side 1
Side 2Side 1
Side 2
Model 1
0.0157
-0.015
-0.01
-0.005
0
0.005
0.01
0.015
0.02
2 3 4 5 6 7 8
Time (sec)
Sh
ear
defo
rmati
on
(ra
d)
Side 1
Side 2Side 1
Side 2
Model 2
0.0051
-0.015
-0.01
-0.005
0
0.005
0.01
0.015
0.02
2 3 4 5 6 7 8
Time (sec)
Sh
ea
r d
efo
rma
tio
n (
rad
)
Stiff side
Flexible sideStiff side
Flexible side
Model 3
0.0148
0.0017
-0.003
-0.002
-0.001
0
0.001
0.002
0.003
0.004
0.005
2 3 4 5 6 7 8
Time (sec)
Ov
ert
urn
ing
de
f. (
rad
)
Side 1
Side 2Side 1
Side 2
Model 1
0.0039
-0.003
-0.002
-0.001
0
0.001
0.002
0.003
0.004
0.005
2 3 4 5 6 7 8
Time (sec)
Ov
ert
urn
ing
de
f. (
rad
)
Side 1
Side 2Side 1
Side 2
Model 2
0.0048
-0.003
-0.002
-0.001
0
0.001
0.002
0.003
0.004
0.005
2 3 4 5 6 7 8
Time (sec)
Ov
ert
urn
ing
de
f. (
rad
)
Stiff side
Flexible sideStiff side
Flexible side
Model 3
0.0017
(e) Shear deformation, θ1 (Taft080) (f) Overturning deformation, θ2 (Taft080)
-0.01
-0.005
0
0.005
0.01
2 3 4 5 6 7 8
Time (sec)
To
rsio
na
l d
ef.
(ra
d)
Roof
Transfer fl.Model 1
-0.01
-0.005
0
0.005
0.01
2 3 4 5 6 7 8
Time (sec)
To
rsio
na
l d
ef.
(ra
d)
Roof
Transfer fl.Model 2
-0.01
-0.005
0
0.005
0.01
2 3 4 5 6 7 8
Time (sec)
To
rsio
na
l d
ef.
(ra
d)
Roof
Transfer fl.Model 3
(g) Torsional deformation, θ3 (Taft080) (h) Final crack patterns Fig.11 Shake-table test results of 1:12-scale 17-story RC building model
(Lee and Ko, 2002; Ko and Lee, 2006; Lee and Ko, 2007)

18
-50
-40
-30
-20
-10
0
10
20
30
40
50
-10 -8 -6 -4 -2 0 2 4 6 8 10
Displacement of transfer floor (mm)
Sh
ea
r fo
rce
(k
N)
2.85kN/m
4.18kN/m
T
(+)
Model 1
-10 -8 -6 -4 -2 0 2 4 6 8 10Displacement of transfer floor (mm)
9.89kN/mm
T
(+)
Model 2
-10 -8 -6 -4 -2 0 2 4 6 8 10
Displacement of transfer floor(mm)
5.48kN/mmT
(+)
`
Model 3
(i) Relation between base shear and drift at the center of transfer floor (Taft080)
0
400
800
1200
1600
0 2 4 6 8 10 12 14 16Time (sec)
Ab
so
rbe
d e
ne
rgy
(k
N-m
m)
Esh
EOTM
ETOR
426
1160
1175
0
400
800
1200
1600
0 2 4 6 8 10 12 14 16Time (sec)
Ab
so
rbe
d e
ne
rgy
(k
N-m
m)
Esh
EOTM
ETOR
379
1454
1455
0
400
800
1200
1600
0 2 4 6 8 10 12 14 16Time (sec)
Ab
so
rbed
en
erg
y (
kN
-mm
)
Esh
EOTM
ETOR
526
1039
1243Model 1 Model 2 Model 3
(j) Time histories of absorbed energy (Taft080)
-0.002
-0.001
0
0.001
0.002
2 3 4 5 6 7 8
Time (s)
Ro
tati
on
(ra
d) UP
Wall
2
t = 3.05 s t = 5.05 s
(a)
-0.015
-0.01
-0.005
0
0.005
0.01
0.015
2 3 4 5 6 7 8
Time (s)
Ro
tati
on
& E
lon
gati
on
3
(rad)
t = 3.05 s t = 5.05 s
mmCol 1001
(b)
-1
-0.5
0
0.5
1
2 3 4 5 6 7 8
Time (s)
Elo
ng
ati
on
(m
m)
t = 3.05 s t = 5.05 s
1Col2Col
(c)
Elongation1Col
Elongation2Col
(k) Time histories of wall behaviour and global behaviour of Model 3 (Taft080)
(l) Snap shots of Model 3 (Instants 3.05s and 5.05s )
-30
-20
-10
0
10
20
30
-0.01 -0.005 0 0.005 0.01Torsional deformation (rad)
To
rsio
nal m
om
en
t (k
N m
)
1,200 kN m/rad
(a) 3-4 s
-30
-20
-10
0
10
20
30
-0.01 -0.005 0 0.005 0.01Torsional deformation (rad)
To
rsio
nal m
om
en
t (k
N m
)
4,500 kN m/rad
(b) 4-6 s
-30
-20
-10
0
10
20
30
-0.01 -0.005 0 0.005 0.01Torsional deformation (rad)
To
rsio
nal m
om
en
t (k
N m
)
1,100 kN m/rad
(c) 6-8 s
(m) Relation between torsional moment and torsional deformation of Model 3 (Taft080)
-75
-50
-25
0
25
50
75
-100 -75 -50 -25 0 25 50 75 100Base shear (kN)
To
rqu
e (
kN
m)
4
5
6
1
2
3
78
+
+
-50
-25
0
25
50
-100 -50 0 50 100
Base shear (kN)
To
rqu
e (
kN
m)
3.15 s
3.04 s
17.5 kN
4.2 kN
13.0 kN
8.4 kN
11.7 kN
11.2 kN
Taft030, 0-15s
Model 3 Model 3
Taft080
3-4s
-50
-25
0
25
50
-100 -50 0 50 100
Base shear (kN)
To
rqu
e (
kN
m)
5.27 s
13.0 kN
6.4 kN
11.4 kN
Model 3
Taft080
4-6s
(n) Relation between base shear and torsional moment of Model 3
Fig. 11 (Continued)

19
The general failure mode was the plastic sway mechanism in the lower frame while a large overturning moment caused many horizontal cracks at the top of the exterior column. Horizontal cracks occurred at the construction joint in the shear wall, which was made for installation of the load cell in the first story (Fig. 11(h)). Very high compressive forces in the exterior columns caused the spalling of concrete and buckling of the longitudinal bars just beneath the load cell in each model. The flexible bent frame revealed a severe damage such as cracks in the beams at the face of columns and in the interior beam-column joint.
2.4 1:5-scale 5-story RC piloti-type building model
Many low-rise residential apartment buildings have recently been constructed in the densely populated areas of Korea. As a result of the lack of available sites, the ground floor is used for a parking lot and a piloti story is adopted. This type of buildings as shown in Fig. 11(a), commonly has a high irregularity of soft story, weak story, and torsion simultaneously at the ground story. The test research (Lee et al., 2011) aims at the investigation of realistic seismic responses of a low-rise RC building structure having high degrees of irregularity in weak/soft story and torsion at the ground story through shake-table earthquake simulation tests both in one direction and in two orthogonal directions. The validity of KBC 2005 (IBC 2000) for the seismic design and evaluation of this highly irregular building structure will be evaluated. For this purpose, a 1:5 scale five-story RC building model was constructed and tested firstly by uni-directional and secondly by bi-directional shaking table excitations sequentially with increasing intensity. The prototype was determined based on the inventory study, and designed by considering the gravity loads only. The reinforcement details are non-seismic, according to construction practice in Korea. Dimensions and details of the 5-story RC original prototype are shown in Fig. 12(a). The lowest two stories of the 1:5 scale structure model were designed and constructed to strictly satisfy the similitude requirements, while the upper three stories were replaced with concrete blocks of similar volume (Fig. 12(b)).
The earthquake simulation tests of the model were conducted up to the level of design earthquake (DE) in Korea, in 2009, at the Korea Institute of Machinery and Materials (KIMM), in Fig. 12(c). The experimental set-up and instrumentation to measure the displacements, accelerations, and forces are shown in Fig. 12(b). The program of earthquake simulation tests is summarized in Table 8. The target or input accelerogram of the table was based on the recorded 1952 Taft N21E (X dir.) and Taft S69E(Y dir.) components, and was formulated by compressing the time axis with the scale factor of 1/√5 and by adjusting the PGA to match the corresponding (KBC2005) elastic design spectrum. (Fig. 12(d)) The measured shake table output was much higher in the Y direction than the intended input as given in Table 8. As a result, since the output of 0.154XY appear to be similar to the input of 0.187XY originally intended for the design earthquake and the response spectra of these output in Fig. 13(a) generally simulate the design spectrum, the response of the model under test 0.154XY is assumed to represent the response of the model to the design earthquake. The response spectrum to this output appears to be almost two times larger than the design spectrum in the short period range. The model survived the design earthquake simulation with the PGA of 0.187g, as specified in KBC 2005 without severe damage, even though it was not designed against earthquakes. (Fig. 13(a) and (b))

20
13200
2700
2700
2700
2700
2900
Y1 Y2 Y3 Y4
X3
X2
X1
300
400
5000
4500
9500
6450 645012900
27005100 5100
200
200
UP
X
Y
3350 3250 3250 3350
13200
200
200
200
4700
1600
2500
1100
9900
2700 2600 2600 2600 2700
UP
40
0
160 7070
70
13
01
30
70
40
40
6-D19
D10@200
300
3000
D10@300x7=2100150300 150 300
200
Hor. and Ver. Rebar : D10@300
400
(a) Prototype structure (unit: mm): elevation; plan (ground floor and 2~5 floor); and
details of column and wall
View B
DR
AL AR
DL
AL
AR
DL
DR
LC7LC6LC5 LC8
LC11LC10LC9
LC4LC3LC2
+X
+Y●
Ref.
Frame
Ref.
Frame
LC1
View A
2580
1900
1000
900
1290 1290
80 x 60
40
5401020 1020
Y1 Y2 Y3 Y4
Ref
. Fra
me
Ref. Frame
(b) Instrumentation
0.0
0.2
0.4
0.6
0.8
1.0
1.2
0.0 0.5 1.0 1.5 2.0
Period (sec)
Sa
Elastic, Sc (KBC2005)input (X-dir.)Output (X-dir.)input (Y-dir.)Output (Y-dir.)
R=1, IE=1.0
(c) Overview of shaking table test setup (d) Elastic design and table response spectra
Fig. 12 1:5-scale 5-story RC building model (original model) (Lee et al. 2011)
Table 8. Test program (X-dir.: Taft N21E, Y-dir.: Taft S69E)
Test Designation
Intended PGA(g) Measured PGA(g) Remark (Earthquake in Korea) X-dir. Y-dir. X-dir. Y-dir.
0.035 X 0.035 - - - -
0.035 XY 0.035 0.040 - -
0.070 X 0.070 - 0.076 - Return period (50yr)
0.070 XY 0.070 0.080 0.075 0.145
0.154 X 0.154 - 0.185 - Return period (500yr)
0.154 XY 0.154 0.177 0.210 0.289
0.187 X 0.187 - 0.209 - Design earthquake in Korea
0.187 XY 0.187 0.215 0.268 0.284

21
Under the uni-directional excitations, the transverse frames and walls played the role of restraining the torsion induced by the excitations, and, therefore, the base shears in the transverse direction was small in comparison with those in the excited direction. Most of the base shear in the transverse direction under bi-directional excitations was resisted by the core walls, while the torsion was distributed between the frames and core walls by the approximate ratio of 1:1 in the transverse direction as shown in Fig. 13(c). Under the bi-directional excitations, the two orthogonal translational modes acted independently. That is, there was no correlation between the two orthogonal translational modes. Nevertheless, the correlation of the torsion mode with one of the translational modes appears to be clear when the responses are within the elastic range and one of the translational modes is predominant over the other such as with the case of uni-directional excitations or with the case where the excitations in the Y direction are significantly more intense than those in the X direction. However, as the intensity of the bi-directional excitations increased, thereby causing large excursions into the inelastic range, this correlation disappeared. The maximum torsion moment and torsion deformation remained almost constant regardless of the excursions into the inelastic region in the X and/or Y directions.
Under the bi-directional excitations, a high degree of rocking phenomena and the bi-directional overturning moments induced large variations in the axial forces in the corner columns and walls. The lateral resistance and stiffness of columns were greatly affected by the variation of axial forces acting on these columns (Fig. 13(d)). That is, the high compressive axial force caused high lateral resistance and stiffness whereas the low compressive or tensile force significantly reduced the lateral resistance and stiffness. The same phenomena were found in the walls (Fig. 13(d)).
Design Code and Experient
0.0
0.1
0.2
0.3
0.4
0.5
0.6
0.0 0.5 1.0 1.5 2.0Period (sec)
Cs
0.154X X-dir.
0.154XY Y-dir.
0.154XY X-dir.
R=1, IE=1.0
0.154X Y-dir.
R=3, IE=1.0
0.156 sec
0.000580.00107
0.00180
0.00310
0.001050.00027
0.002410.00306
0
0.001
0.002
0.003
0.004
0.005
0.006
0.035 0.070 0.154 0.187
X XY
(test)
0.000910.000730.00038
0.00038
0.00480
0.00362
0.001080.00177
0
0.001
0.002
0.003
0.004
0.005
0.006
0.035 0.070 0.154 0.187
X XY
(test)
Y-dir.
X-dir.
(a) Test results with the design spectra (b) IDR (rad)
(c) Torsion contribution of Y1+Y4 frames and shear walls Y2+Y3 (2~4sec), 0.154XY
Fig. 13 Shake-table test results of 1:5-scale 5-story RC building model (Lee et al. 2011)

22
1
2
3
4
5
6
7
Others Trace from 1 to 7 1 2 3 4 5 6 7
(a)
0
P(k
N)
-20
20
40
60
80
0 2 4-2-4δx(mm)
Others
Trace from 1 to 7
1
2
3
4
5
6
7
Others Trace from 1 to 7 1 2 3 4 5 6 7
(b)
0
P(k
N)
20
40
60
80
0 2 4-2δy(mm)
-20
-4
Others
Trace from 1 to 7
1
2
3
4
5
6
7
Others Trace from 1 to 7 1 2 3 4 5 6 7
(c)
0 2 4-2-4δx(mm)
δy(m
m)
-4
-2
0
2
4Others
Trace from 1 to 7
1
2
3
4
5
6
7
Others Trace from 1 to 7 1 2 3 4 5 6 7
(d)
0 2 4-2-4δx(mm)
Vx(k
N)
0
2
-2
-4
Others
Trace from 1 to 7
12
3
4
5
6
7
Others Trace from 1 to 7 1 2 3 4 5 6 7
(e)
0 2 4-2δy(mm)
-4
Vy(k
N)
0
2
-2
-4
Others
Trace from 1 to 7
2
13
4
5
6
7
Others Trace from 1 to 7 1 2 3 4 5 6 7
(f)
Vy(k
N)
0
2
-2
-4
Vx(kN)0 2-2-4
Others
Trace from 1 to 7
P - δxP - δy δx - δy
Vx - δx Vy - δyVx - Vy
(d) Behavior of column C9 under 0.154 XY
(e) Behavior of wall (C6-C7)
Fig. 13 (continued)
The seismic evaluation of the building model according to KBC 2005 (IBC 2000)
suggests that this model would fail under the design earthquake, thus contradicting the test results. The main reason for this contradiction is attributed to the overly high over-strength factor of 3. It would be reasonable to reduce the over-strength factor from 3 to 2 and to apply this factor only to the axial force with the exception of the shear and flexural moments.

23
2.5 1:5-scale 5-story RC building model strengthened with BRBs at ground story
In a 1:5 scale model of a low-rise RC apartment building having a high degree of irregularity regarding the weak/soft story and torsion at the ground story, the ground-story columns were strengthened with FRP sheets, to avoid brittle collapse due to shear failure followed by axial compression failure, and the outer frames at the ground story were infilled with BRB’s, to increase the stiffness, strength, and energy dissipation capacity within the allowed range of lateral drift. To verify the effectiveness of this strengthening, a series of earthquake simulation tests were conducted before and after the strengthening, and these test results are compared and analyzed, to check the effectiveness of the strengthening. (Lee et al. 2013)
12900
5100 2700 5100
50
00
45
00
95
00
e
UP
esX
Y
CM
CS=52.3mm
(0.551%)
X1
X2
X3
Y1 Y2 Y3 Y4 12900
5100 2700 5100
50
00
45
00
95
00 es
UP
es
X
Y
CM
CS
=1,550mm
(16.3%)
X1
X2
X3
Y1 Y2 Y3 Y4
BRB
BRBBRB
FRP sheet
(a) Plan of the ground story in original (left) and strengthened prototypes (right)
(b) Instrumentation
0
0.3
0.6
0.9
1.2
0 0.4 0.8 1.2 1.6 2
Sp
ectr
al A
ccel
. (S
a)
Period (sec)
KBC2005 (DE)R0.187XY, X-dir.R0.187XY, Y-dir.KBC2005 (MCE)R0.3XY, X-dir.R0.3XY, Y-dir.
DE(R=1, IE=1)
MCE(R=1, IE=1)
(c) Overview of shaking table test setup (d) Elastic design and table response spectra Fig. 14 1:5-scale 5-story RC building model strengthened with BRBs at ground story
(strengthened model) (Lee et al. 2013; Lee and Hwang, 2014)

24
The earthquake simulation tests of the strengthened model were carried out at the Seismic Simulation Test Center at Pusan National University, Korea, in 2010 (Fig. 14(c)). The experimental set-up and instrumentation to measure the displacements, accelerations, and forces for the second series of tests are similar to those of the first series of tests, and are shown in Fig. 14(b).
The target or input accelerogram of the table was based on the recorded 1952 Taft N21E (X direction) and Taft S69E (Y direction) components, and was formulated by compressing the time axis with a scale factor of 1/√5, and by adjusting the peak ground acceleration (PGA), to match the corresponding elastic design spectrum in KBC 2005. First, the test was performed with the table excitations in only one direction (X direction), and the consecutive test was conducted in the two orthogonal directions (X and Y directions), for each level of earthquake intensity. The strengthened model was tested not only up to the levels of maximum considered earthquake (MCE) in Korea, but also to the level of the design earthquake in San Francisco, USA. Because the shake-table test of the original model was carried out up to the level of the design earthquake in Korea, and the original model did not reach the maximum yield strength, this study dealt with only the seismic responses of the strengthened model. The program of earthquake simulation tests on the strengthened model is summarized in Table 9. The designation and significance of each earthquake simulation test is provided in the table. Elastic response spectra are given in Fig. 14(d) for DE, MCE, and shake-table output. Generally, the shake-table outputs simulated the DE and MCE well, except for the output of the X directional acceleration under R0.187XY.
Table 9. Test program (X-Taft N21E, Y-Taft S69E)
Test designation Intended PGA(g) Measured PGA(g) Return period in Korea
(year) X-dir. Y-dir. X-dir. Y-dir.
R0.070X 0.07 - 0.083 - 50
R0.070XY 0.07 0.08 0.072 0.097 R0.154X 0.154 - 0.132 -
500 R0.154XY 0.154 0.177 0.123 0.186 R0.187X 0.187 - 0.174 -
Design earthquake (DE) R0.187XY 0.187 0.215 0.147 0.220
R0.3 X 0.3 - 0.261 - 2400 (MCE)
R0.3 XY 0.3 0.345 0.250 0.374 R0.4 X 0.4 - 0.329 -
DE in San Francisco, USA R0.4 XY 0.4 0.46 0.442 0.509
The concept of Buckling Restrained Braces (BRB’s) is to use an inner core
artificially designed to yield prematurely in compression and tension, enclosed by strong buckling restraining braces, thereby to dissipate large seismic input energy, within the allowed range of displacement. This concept has attracted wide interest, and has been applied to many new constructions and the seismic retrofitting of existing steel structures. However, despite this advantage in concept, there have been many problems to be solve d in the detailed design, such as joints with connected members. The study conducted herein again revealed the detail problems in adoption of BRB’s into the existing RC frames: The BRB’s showed significant slippage at the joint with the existing RC beam, up-lift of columns from RC foundations, foundation deformation due to the flexibility of the foundation itself, all of which finally led to failure, due to the

25
buckling of base joint angles. Because of these factors, the value of lateral stiffness of the RC frame strengthened with BRB’s and FRP sheets appeared to be as low as one seventh of the intended value. This low stiffness led to a large yield displacement, and therefore the BRB’s could not dissipate seismic input energy as desired within the range of anticipated displacement. The rigidity of connections between the existing concrete member and the BRB’s, and the rigidity of columns in tension and the foundation should be investigated systematically in the future to ensure the successful application of BRB’s to the existing RC building structures.
Although, the strengthened model did not behave as desired, it showed great enhancement in earthquake resistance, not only under the maximum considered earthquake in a low-to-moderate seismicity region, such as Korea, but also under the intensity level of design earthquake in a strong seismic region, such as San Francisco (Fig. 15(a)). The followings are some important seismic behaviors of the strengthened model, which have contributed to this enhanced earthquake resistance: The strengthened model revealed the tendency of bias towards axial compression in
the wall, regardless of the uni- or bi- directional excitation. The reason is considered to be elongation of the wall caused by lateral drift, and the constraint to this elongation provided by the peripheral BRB frames, which were absent in the original model. This increase of the axial compressive force in the walls means an increase of the bending moment capacity, which leads to a significant (approximately 50%) increase in the lateral resistance of the wall (Fig. 15(b)). In Fig. 15(c) the strengthened model had the curve of base shear versus story drift at the first story that showed the first significant yielding under design earthquake (R0.187XY), and inelastic behavior with large energy dissipation under the maximum considered earthquake (R0.3XY). However, the maximum IDR’s for R0.187XY and R0.3XY in the X direction were 0.296% and 0.854%, respectively, which were within the allowable limit of 1.5% for the limit state of life safety.
Base torsion was resisted by both the inner core wall, and the peripheral frames in the original model in Fig. 13(c), up to the design earthquake in Korea (0.154XY). In contrast, the strengthened model resisted most of the base torsion with the peripheral frames, after yielding of the inner core walls. In Fig. 15(d), the model represented dual values of stiffness, of 50MN/rad when the core walls did not yield, and 30MN/rad when the core wall did yield.
The eccentricity varied from zero to infinity, with the variation of the torsional moment and the two orthogonal base shears (Fig. 15(e)). As the intensity of table excitations increased, representing earthquakes with return periods from 50 to 2500 years in Korea, the range of the eccentricities at the time instants of peak values in the time histories of drift and base shear decreased from approximately ±30% to within ±10% of the transverse dimension of the model (Fig. 15(f)). The inertial torque was resisted by both longitudinal and transverse frames, in proportion to their instantaneous rigidity. In particular, when the longitudinal frames had yielded, over 90% of the inertial torsion was resisted by the transverse frames, which manifests the reason for the tendency to the lower eccentricity with the increase of intensity of excitations (Fig. 15(g)).
Under severe table excitations representing MCE in Korea, the inertial torque varied from –23.1kNm (instant (a)) to +27.9kNm (instant (2)) and the eccentricity varied from 3.7% to

26
0.01% with the yielding base shear, 106kN, being almost constant for a short duration from 3.04s to 3.11s. The small eccentricity of 0.01% did not necessarily translate into a small but significantly large rotation (0.00173rad) leading to the maximum drift (6.2mm) at the edge frame due to a high level of inertial torque (27.9kNm) and a significantly degraded torsional stiffness caused by yielding of the longitudinal frames. It is clear that the eccentricity in itself cannot represent the critical torsional behaviors. To overcome this problem, the demand in torque shall be determined in a direct relationship with the base or story shear, given as an ellipse constructed with the maximum points in its principal axes located by the two adjacent torsion-dominant modal spectral values as shown in Fig. 15(h). This approach provides a simple, but transparent design tool by enabling comparison between demand and supply in shear force-torque diagrams.
X
Y
X1
X2
X3
Y1 Y2 Y3 Y4
C9 C10 C11
C5 C6 C8C7
C1 C2 C4C3
(b) (d)
(c)
C2-C6 Wall (Y-dir)C6-C7 Wall (X-dir)
(a) Crack patterns after R0.4XY
-40
0
40
80
120
160
200
240
280
320
-80 -60 -40 -20 0 20 40 60 80
Moment(kNm)
Ax
ial
forc
e(k
N)
-40
0
40
80
120
160
200
240
280
320
-80 -60 -40 -20 0 20 40 60 80
Moment(kNm)
Ax
ial
forc
e(k
N)
-40
0
40
80
120
160
200
240
280
320
-80 -60 -40 -20 0 20 40 60 80
Moment(kNm)
Ax
ial
forc
e(k
N)
-40
0
40
80
120
160
200
240
280
320
-80 -60 -40 -20 0 20 40 60 80
Moment(kNm)
Ax
ial
forc
e(k
N)
-200
-150
-100
-50
0
50
100
150
200
-15 -10 -5 0 5 10 15
-200
-150
-100
-50
0
50
100
150
200
-15 -10 -5 0 5 10 15
-200
-150
-100
-50
0
50
100
150
200
-15 -10 -5 0 5 10 15
-200
-150
-100
-50
0
50
100
150
200
-15 -10 -5 0 5 10 15Inter-stroy drift(mm)Inter-stroy drift(mm)Inter-stroy drift(mm)Inter-stroy drift(mm)
Bas
e sh
ear(
kN
)
Bas
e sh
ear(
kN
)
Bas
e sh
ear(
kN
)
Bas
e sh
ear(
kN
)
0.154XY
0.154XY
R0.187XY
R0.187XY
R0.3XY
R0.3XY
R0.4XY
R0.4XY
Max. Axial force
Min. Axial force
5
3
35
33.2kN
165.3kN159.2kN
38.7kN7.4kN
285.4kN
-22.5kN
2
2
92.8kN
77.1kN
P=180.8kN
M=39.5kNm P=159.8kN
M=55.9kNm
(b) P-M interaction diagram and relation of base shear versus drift in wall C6-C7 (Wall X2)
(c) Response histories of interstory drift ratio versus base shear
Fig.15 Shake-table test results of 1:5-scale 5-story strengthened model (Lee et al. 2013 and Lee and Hwang 2014)

27
-75
-50
-25
0
25
50
75
-0.003 -0.0015 0 0.0015 0.003
Tors
ional
M (
kN
m)
Torsional deformation (rad)
R0.07XY
50 MNm/rad
-75
-50
-25
0
25
50
75
-0.003 -0.0015 0 0.0015 0.003
To
rsio
nal
M (
kN
m)
Torsional deformation (rad)
Total2.5s to 3.5sa to (2)
R0.3XY
50 MNm/rad
30 MNm/rad
a (4)(2)
(d) Dual values of torsional stiffness
-150
-100
-50
0
50
100
150
-300 -150 0 150 300
To
rsio
nal
mo
men
t(k
Nm
)
X-dir. Base shear, Vx (kN)
Ttotal, Vx
Tx, Vx R0.3XY
B
CD
E
F
G H
Ab
Vx×estatic
Vx×(estatic±10%)
ElasticYield
-150
-100
-50
0
50
100
150
-300 -200 -100 0 100 200 300
To
rsio
nal
mo
men
t(k
Nm
)
Y-dir. Base shear, Vy (kN)
Ttotal, Vy
Ty, Vy R0.3XY
B
C
D
E
F
I
J
A
H
G
b
Vx×estatic
Vx×(estatic±10%)
ElasticYield
(e) BST yield surface versus V-T response histories
-30%
-15%
0%
15%
30%
-200 -100 0 100 200
X-dir. Base shear (kN)
ey
R0.3XY
±50kN
Average: 5.6%
A±10%: 100%
A±5%: 88%
-30%
-15%
0%
15%
30%
-200 -100 0 100 200
X-dir. Base shear (kN)
ey
R0.187XY
±30kN
Average: 5.6%
A±10%: 100%
A±5%: 68%
-30%
-15%
0%
15%
30%
-200 -100 0 100 200
X-dir. Base shear (kN)
ey
R0.070XY
Average: 7.2%
A±10%: 72%
A±5%: 56%
±15kN
Ecc
entr
icit
y, e
y
MCEDESLE
(f) Distribution of eccentricities (ey=Tx/Vx) at instants of peak base shear
(1)
(2)
(3)
(4)
(5)
(6)
a
b
-130
-65
0
65
130
-6 -3 0 3 6
Vx
(kN
)
δx (mm)
R0.3XY
-40
-20
0
20
40
-6 -3 0 3 6
Vx
(kN
)
δx (mm)
(1)
(2)
(3)(4)
(5)
(6)
ab
-60
-30
0
30
60
-60 -30 0 30 60
Ty
(kN
m)
Tx (kNm)
MCE
-60
-30
0
30
60
-60 -30 0 30 60
Ty
(kN
m)
Tx (kNm)
R0.187XY
DE
R0.3XY-0.004
-0.002
0
0.002
0.004
-8 -4 0 4 8
θ T(r
ad)
δx1 (mm)
δx1-θt
R0.3XY
-0.002
-0.001
0
0.001
0.002
-2 -1 0 1 2
θ T(r
ad)
δx (mm)
δx1-θt
R0.070XY
R0.070XY
-60
-30
0
30
60
-60 -30 0 30 60
Ty
(kN
m)
Tx (kNm)
R0.070XY
SLE
(g) Relation of torsional moments contributed by X- and Y-directional frames
Fig. 15 (continued)

28
-30
-15
0
15
30
-40 -20 0 20 40
To
rsio
nal
mo
men
t (k
Nm
)
Base shear (kN)
Mode 1
Ty-Vy
-30
-15
0
15
30
-40 -20 0 20 40
To
rsio
nal
mo
men
t (k
Nm
)
Base shear (kN)
Mode 1
Ttotal-Vy
-30
-15
0
15
30
-40 -20 0 20 40
To
rsio
nal
mo
men
t (k
Nm
)
Base shear (kN)
ey = - 7.8 %
Tx-Vx
Mode 1-30
-15
0
15
30
-40 -20 0 20 40
TM
(k
Nm
)
Base shear (kN)
Mode 1
Ttotal-Vx
-30
-15
0
15
30
-40 -20 0 20 40
Tors
ional
mom
ent
(kN
m)
Base shear (kN)
Mode 2
Ty-Vy
-30
-15
0
15
30
-40 -20 0 20 40
Tors
ional
mom
ent
(kN
m)
Base shear (kN)
Mode 2
Ttotal-Vy
-30
-15
0
15
30
-40 -20 0 20 40
Tors
ional
mom
ent
(kN
m)
Base shear (kN)
Tx-Vx
Mode 2
ey = 21.5 %
-30
-15
0
15
30
-40 -20 0 20 40
TM
(k
Nm
)
Base shear (kN)
Mode 2
Ttotal-Vx
-30
-15
0
15
30
-40 -20 0 20 40
Tors
ion
al m
om
ent
(kN
m)
Base shear (kN)
Mode 1+2
Ty-Vy
-30
-15
0
15
30
-40 -20 0 20 40
Tors
ion
al m
om
ent
(kN
m)
Base shear (kN)
Mode 1+2
Ttotal-Vy
-30
-15
0
15
30
-40 -20 0 20 40
Tors
ional
mom
ent
(kN
m)
Base shear (kN)
Tx-Vx
16.41 s16.70 s
Mode 1+2
ey = 0 ~ ∞
-30
-15
0
15
30
-40 -20 0 20 40
TM
(k
Nm
)
Base shear (kN)
Mode 1+2
Ttotal-Vx
-40
-20
0
20
40
-40 -20 0 20 40
To
rsio
nal
mo
men
t (k
Nm
)
Base shear (kN)
EXP. (LC)
ANAL.All modes
Ty-Vy
-40
-20
0
20
40
-40 -20 0 20 40
To
rsio
nal
mo
men
t (k
Nm
)
Base shear (kN)
EXP. (LC)
ANAL.All modes
Ttotal-Vy
-40
-20
0
20
40
-40 -20 0 20 40
To
rsio
nal
mo
men
t (k
Nm
)
Base shear (kN)
EXP. (LC)
ANAL.All modes
Tx-Vx
-40
-20
0
20
40
-40 -20 0 20 40
TM
(k
Nm
)
Base shear (kN)
EXP. (LC)
ANAL.All modes
Ttotal-Vx
Capacity
(Supply)‐ BST or SST
yield surfaces
Story
shear force
Story torque DemandEllipse
with two adjacent
torsion-dominant
modal spectral
values.
First modal
spectral valuesSecond modal
spectral values
(h) Demand and supply in shear force-torque diagrams Fig. 15 (continued)
2.6 1:5-scale 10-story RC Box-type Wall Building Structure Model
The number of apartment housing units is more than 58% of the total number of
housing units in Korea (KNSO 2010). These residential apartment buildings such as shown in Fig. 2(b) generally consist of high-rise reinforced concrete (RC) wall structures, and should be designed and constructed to resist the earthquake according to Korea Building Code (AIK 2005), and existing buildings not satisfying these codes should be evaluated and retrofitted. These high-rise wall-type or box-type structural systems are defined as a bearing wall system in the code, but the style of these RC structures is unique around the world and the seismic performance of these structures has been investigated with due interest, neither in Korea nor abroad, except a few studies. A 1:5 scale 10-story RC wall-type building model representative of these residential buildings was constructed (Hwang el al. 2011) considering the capacity of the largest shaking table available in Korea. Then, the seismic performance of the high-rise residential building model is evaluated based on the results of earthquake simulation tests (Lee et al., 2012).
The prototype for the experiment was chosen to represent the most typical design in Korea. The floor area of one dwelling unit is 89m2 and one story accommodates two family units, while the number of stories is 10 as shown in Fig. 16(a). The prototype was designed according to the old design code of Korea, AIK2000. The thickness of walls is 180mm or 160mm with that of slabs being 200mm. The ratio of wall cross sectional area to building floor plan area, Aw/Af, are 2.67% and 4.71% in the X and Y directions, respectively. Considering the capacity of the available shaking table and the feasibility of model reinforcements, a 1:5 scale 10–story building model was chosen. Fig. 17(a) compares design spectra as per KBC 2005 and response spectra obtained using the output accelerograms of shaking table excitations. The response spectra for the shake table output corresponding to the Design Earthquake (DE) and the Maximum Considered Earthquake (MCE) simulate well the design spectra.

29
2.7m
2.7m
2.7m
2.7m
2.7m
2.7m
2.7m
2.7m
2.7m
2.7m
27 m(10-story)
G.L.
2F
3F
4F
5F
6F
7F
8F
9F
10F
Roof
(a) Plan and elevation of prototype building
(b) Plan and elevation of 1:5 scale model
Splice
Splice
Slab
FootingSection B-B’
Slab
Section A-A’
(c) Details of the wall in 1:5 scale model (sections A-A’ and B-B’ in (b))
Shaking Table
Steel blocks
Reference Frame
LVDTs
Accelerometer
A2A1
A4A3
A6A5
A8A7
A10A9
A12A11
D15,D16,D29
D17,D18
D19,D20
D21,D22,D27
D23,D24
D25,D26
D28
D30
Independent Post
Shaking Table
Reference Frame
Independent Post
D1, D2
D3, D4
D5, D6
D7, D8
D9, D10
D11, D12
D14
D13
A13 A14
A15 A16
A17 A18
A19 A20
A21 A22
A23 A24
LVDTsSteel blocks
View A View B
Loadcell
(d) Instrumentations and overview of shaking table test setup
Fig.16 1:5-scale 10-story RC Box-type Wall Building Structure model (Lee et al, 2012)
30
Table 10. Test program a 1:5-scale 10-story wall-type building model
Test
Intended PGA (g) (True replica model)
Input PGA (g) (Distorted model)
Output PGA (g) (Distorted model)
Return Periods in Korea (years)
X-dir. Y-dir. X-dir. Y-dir. X-dir. Y-dir.
0.07X 0.07 – 0.140 – 0.172 – 50 (Serviceability Level EQ.,
SLE) 0.07Y – 0.0805 – 0.161 – 0.152
0.07XY 0.07 0.0805 0.140 0.161 0.137 0.142
0.187X 0.187 – 0.374 – 0.292 – Design EQ. (DE)
0.187XY 0.187 0.216 0.374 0.431 0.316 0.450
0.3X 0.3 – 0.60 – 0.523 – 2400 (Maximum Considered EQ., MCE) 0.3XY 0.3 0.346 0.60 0.691 0.525 0.643
The experimental and analytical results of a 1:5 scale 10–story building model are as follows: The experimental and analytical models possessed a large overstrength (Fig. 17(c)). Under
the maximum considered earthquake (MCE) in Korea, the maximum base shear coefficients of the experiment and the analysis are 0.206 and 0.17 in the X direction, respectively, and 0.272 and 0.30 in the Y direction, respectively, which are 2.5~3.0 times larger than the design seismic coefficients, Cs, respectively. In the results of the static pushover analyses, the overstrength of the model with slabs, Ω, which is defined as the ratio of the maximum strength of the fully-yielded system to the design seismic coefficients, is 3.22 in the X direction and 4.2 in the Y direction. In the capacity curves, the lateral strength dropped suddenly after the point of the peak resistance due to the shear failure in the Y-directional outer walls. The overstrength of the model is larger than the value of the overstrength factor, 2.5, given in KBC 2005 and IBC 2000. In Fig. 17(d), under the DE in Korea, the maximum interstory drift ratio (IDR) in the analytical results is 0.331% in the 6th story in the X direction and 0.195% in the 7th story in the Y direction. It is comparable to that of test results, 0.307% in the 5th to 6th stories in the X direction and 0.252% in the 9th to 10th stories in the Y direction, which satisfy the allowable interstory drift ratio of 1.5% imposed by KBC 2005 (IBC 2000).
0
0.2
0.4
0.6
0.8
1
1.2
0 0.2 0.4 0.6 0.8
Spec
tra
acce
lera
tion
(S
a)
Period (sec)
KBC2005 (DE)Output (Taft 0.187g X-dir.)Output (Taft 0.187g Y-dir.)KBC2005 (MCE)Output (Taft 0.3g X-dir.)Output (Taft 0.3g Y-dir.)
MCE
DE (R=1.0, IE=1.0)
Distorted model
0
0.1
0.2
0.3
0.4
0.5
0 0.1 0.2 0.3 0.4 0.5
Bas
e sh
ear
coef
fici
ent
(Cs)
Period (sec)
0.035
0.07
0.154 0.187
0.3
0.035
0.070.1540.187
0.3
Y-dir.
X-dir.
DE (R=1.0, IE=1.0)
DE (R=4.5, IE=1.2)
Ta,y-dir. = 0.184s
Ta,x-dir. = 0.273s
Csx = 0.072Csy = 0.108
(Design values)
(a) Design and shake-table response spectra (b) Test results with the design spectra
0
0.05
0.1
0.15
0.2
0.25
0.3
0.35
0 0.005 0.01 0.015 0.02 0.025
Bas
e sh
ear
/ B
uil
din
g w
eig
ht
Roof drift (ratio)
SB, flexible-baseSB, fixed-baseNS, flexible-baseNS, fixed-base
X-dir. (+)
Cs, design = 0.072
Ω = 3.22
Ω = 2.4
0
0.1
0.2
0.3
0.4
0.5
0.6
0 0.0025 0.005 0.0075 0.01 0.0125 0.015
Bas
e sh
ear
/ B
uil
din
g w
eig
ht
Roof drift (ratio)
SB, flexible-baseSB, fixed-baseNS, flexible-baseNS, fixed-base
Y-dir. (+)
Cs, design = 0.108
Ω = 4.2 Ω = 3.36 Steel, ε = 0.002m/m
Shear stress degradation
in wall, ε = 0.01m/m
Concrete, ε = 0.002m/m
Concrete, εc,ult = 0.006m/m
Experiment under MCE
Analysis under MCE
Analysis under
Concepcion EQ.
(c) Capacity curves
Fig. 17 Shake-table test results of 1:5-scale 10-story RC Box-type Wall Building Structure model (Lee et al. 2012)

31
1
3
5
7
9
11
-0.6 -0.3 0 0.3 0.6
Flo
or
Drift (%)
Flexible-
baseFixed-
baseExp.
RoofDE
in Korea
(X-dir.)
Roof
1
3
5
7
9
11
-0.6 -0.3 0 0.3 0.6F
loo
r
Drift (%)
Flexible-
baseFixed-
baseExp.
RoofDE
in Korea
(Y-dir.)
Roof
Model SB, Flexible-base
Instant: 2.31s (max. roof drift (-X))
under MCE in Korea
Y1 Y2Y3 Y4Y5 Y6Y7 Y8Y9 Y10
Model SB, Fixed-base
Instant: 2.28s (max. roof drift (-X))
under MCE in Korea
Y1 Y2Y3 Y4Y5 Y6 Y7 Y8Y9 Y10 (d) Envelope of interstory drift under DE
0.10 -0.13
1
3
5
7
9
11
-0.6 -0.3 0 0.3 0.6
Flo
or
Drift (%)
Flexible-
base
Fixed-
base
Footing
Rotation
Roof
DE
in Korea
(X-dir.)
Roof
0.10 -0.13
1
3
5
7
9
11
-0.6 -0.3 0 0.3 0.6
Flo
or
Drift (%)
Flexible-
base
Fixed-
base
Footing
Rotation
Roof
DE
in Korea
(X-dir.)
Roof
-0.00119 0.00215
1
2
3
4
5
-0.003 -0.0015 0 0.0015 0.003F
loo
r
Axial Strain (m/m)
Y2
Y4
Y7
Y9
Flexible-base
MCE
in Korea
(2.31s)
0.00211 -0.00089
1
2
3
4
5
-0.003 -0.0015 0 0.0015 0.003
Flo
or
Axial Strain (m/m)
Y2
Y4
Y7
Y9
Fixed-base
MCE
in Korea
(2.28s)
(e) Lateral drift ratio with respect to the base at
the time instant of maximum roof drift (f) Distribution of plastic hinges and axial strain
of inner walls in Frame X4 under MCE
-561 kNm (A: 1.63 sec)
467 kNm (B: 1.80sec)
-700
-350
0
350
700
0 2 4 6 8 10
OT
M (
kN
m)
Time (sec)
Total OTM (Inertia)
OTM due to T/C coupling
-380 kNm (1.67 sec)
335 kNm (2.0 sec)
-700
-350
0
350
700
0 2 4 6 8 10
OT
M (
kN
m)
Time (sec)
Total OTM (Inertia)
OTM due to T/C coupling
Model SB243kNm
(52.0%)
-278kNm
(49.6%)
Model NS65.5kNm
(19.6%)
-75.5kNm
(19.9%)
(g) Relations of hysteretic curves between base
shear and roof drift under DE and MCE (h) Time history of overturning moment
Roof
Third
Floor
upper
side
(i) Crack patterns in slabs and exterior walls
Fig. 17 (continued)

32
The model with slabs is governed by the membrane action due to the coupling effect of the web wall to the flange wall, which is one reason for a large overstrength. In the model with slabs, the coupling behavior of walls covers approximately 40~50% of the total overturning moment (Fig. 17(h)). The test results show that outer walls have many horizontal cracks at the lower stories subjected to a large membrane force (Fig. 17(i)). In the analytical model, the axial strains of wall boundaries at various locations are measured. Under the maximum considered earthquake (MCE) in Korea, the maximum axial strain demands of the wall boundaries in the lower part of the first story are within 0.006m/m in tension and 0.0012m/m in compression (Fig. 17(h)). The tensile strains in the outer walls are larger than the value of steel yield strain, 0.002m/m, which are consistent with the horizontal cracks in the experiment. The probability of the damage due to the concrete crushing and rebar buckling is very low under the MCE in Korea.
The analytical models ignoring the flexibility of foundation and the flexural rigidity of the slab have been widely used by engineers in practice for the analysis of the building structure. In this study, it was shown that the fixed-base condition significantly increases the initial stiffness with the shortened fundamental period, and decreases the lateral drift (Fig. 17(e)). When inelastic behavior occurs, the ratio of the amounts of dissipated energy in the wall, slab, and coupling beam in the flexible-base model is approximately 7:2:1, whereas that in the fixed-base model is about 8:1.2:0.8 showing that the fixed-base model increases the dissipated inelastic energy in the wall with decreasing those in the slab and coupling beam. In the model without the slab which do not participate in the lateral resistance, the initial stiffness and maximum strength representing the global responses are reduced to approximately half of the model with slab. The slab increases the tension and compression coupling actions resulting in a large membrane force of the wall, and the strength of the model with slab are 25~35% larger than that without slabs. For the design, therefore, the analytical model of the RC box-type wall building structure, which neglect the flexibility of foundation and the flexural rigidity of the slab, should be avoided for reliable seismic design.
2.7 1:5-scale 9-story Piloti-Type RC Residential Building Structure Model
Since the beginning of the industrialization, many multi-purpose buildings have been
constructed to solve the housing problem in the densely populated areas in Korea. As a representative multi-purpose building, there is the piloti-type apartment building using the bearing-wall system for the upper apartments and the frame system for the lower open spaces. This type of structure is usually designed with transfer beam or transfer plate since many of the upper bearing walls discontinue at the lower stories. Moreover, core walls or additional lateral- force-resisting vertical element such as shear walls would be placed on the plan of the piloti story. The principal drawback in this type of structure is the abrupt change in the lateral stiffness and strength at the piloti story. This creates a soft story and torsional eccentricity. The structural irregularity can become a major source of damage during the extreme earthquake. Furthermore, overturning moment due to the lateral forces at the upper bearing wall induces critical axial force leading to collapse of the supporting members. However, these mechanisms of the piloti-type building structures under the

33
extreme earthquake are not fully investigated up to the present. Therefore, a 1:5 scale 9-story piloti-type RC residential building model was constructed considering the capacity of the largest shaking table available in Korea. Then, the seismic response of the piloti-type residential building model is investigated based on the results of earthquake simulation tests. (Lee et al. 2013) It is a 9-story piloti-type RC building, and the floor area of one dwelling unit is 89m2 and one story accommodates two dwelling units. The ground story consists of core walls and exterior frames with columns and infilled walls, and the 2nd to 9th story have box-type wall structures. The height of the ground story is 3.9m with those of upper stories being 2.7m, and the thickness of the transfer plate is 1.5m.
ii. Underpinning of transfer plate
iii. Removal of exterior walls
i. 10-story residential model
iv. Foundation v. Rebars for columns and infilled walls
vi. Completed 9-story model
(a) Remodeling of a damaged 10-story model to a 9-story piloti-type model
(b) Typical plan (c) Piloti plan
Bed
room
Bathroom
Bed
room
kitchen
Living
room
Column
Shear wall
Column
Elevator
Stair case
Column
Shear wall
Column
Elevator
Stair case
(a) Elevation (d) Detail of column and infilled wall (detail of single column is equal to the column with infilled wall.)
E/V
(b) Detail of a 1:5 scale piloti-type model (unit: mm)
view A
view B
view E
view C
view D
Column view A view B
Steel blocks AccelerometerLVDTs
Reference Frame
Independent post
A1 A2
A3 A4
A5 A6
A7 A8
A9 A10
A11
A12
A14
A16
A18
A20
A13
A15
A17
A19
A21
A22
D1,D2
D3,D4
D5,D6
D7,D8
D9,D10
D11,D12,D13
D14,D15
D16,D17
D18,D19,D20
D21,D22D23
D24
D25
D26Load Cell
Shaking Table Shaking Table
Elevator Hall
Stair Case
Column 1
Column 3
Column + Shear Wall
1~30 : No. Load Cell
①~④: No. Portion
①
②
③
④
Column 2
Transfer plate
Column
Column
a a
a – a section
RC1
RC2 RC4
RC3
DA4 DA5
DS5 DS6
PH9 PH10 PH12
DA8
Column-wall exterior Column-wall interior
E/V wall
Column
Transfer plate
Column- wall Stair wall Column
Column
E/V wall
Stair wall Column
DA1DA2DA3
DA4 DA5 DA6 DA7
DA8
DA10 DA11 DA14 DA15
DA21 DA22
PH1PH2PH3PH4PH5PH6PH7PH8
PH12PH9PH10
RC1
RC3
RC2 RC4
DS1 DS2 DS3 DS4
DS13 DS14
DS5 DS6 DS9 DS10
Column-wall exterior Column-wall interior
E/V wall
Column
Transfer plate
Column- wall Stair wall Column
Column
E/V wall
Stair wall Column
DA1DA2DA3
DA4 DA5 DA6 DA7
DA8
DA10 DA11 DA14 DA15
DA21 DA22
PH1PH2PH3PH4PH5PH6PH7PH8
PH12PH9PH10
RC1
RC3
RC2 RC4
DS1 DS2 DS3 DS4
DS13 DS14
DS5 DS6 DS9 DS10
DA4 DA5 DA6 DA6
DS1 DS2 DS3 DS4
DS13 DS14DA21 DA22
DA1DA2DA3
PH1
PH2
PH3PH4
PH5
PH6
PH7
PH8
(a) Lateral displacement and accelerometer
(b) Load cell (c) Rotational deformation of column
View C View D View E
View A View B
(d) Shear, flexural, plastic hinge deformation
1 2 3 4 5 6 7 8
9 10
11 12
13 14 15 1617 18
19 20
21 22
23 2425 26
27 28
29 30
Elevator Hall
Stair Case
Column 3
Column 2
Column 1
Column +
Shear Wall
1~30: No. Load Cell
Portion A Portion B Portion C
(c) Instrumentations
Fig. 18 1:5-scale 9-story piloti-type RC residential building structure model (Lee et al, 2013) Table 11. Test programs of a 1:5-scale 9-story piloti-type building model
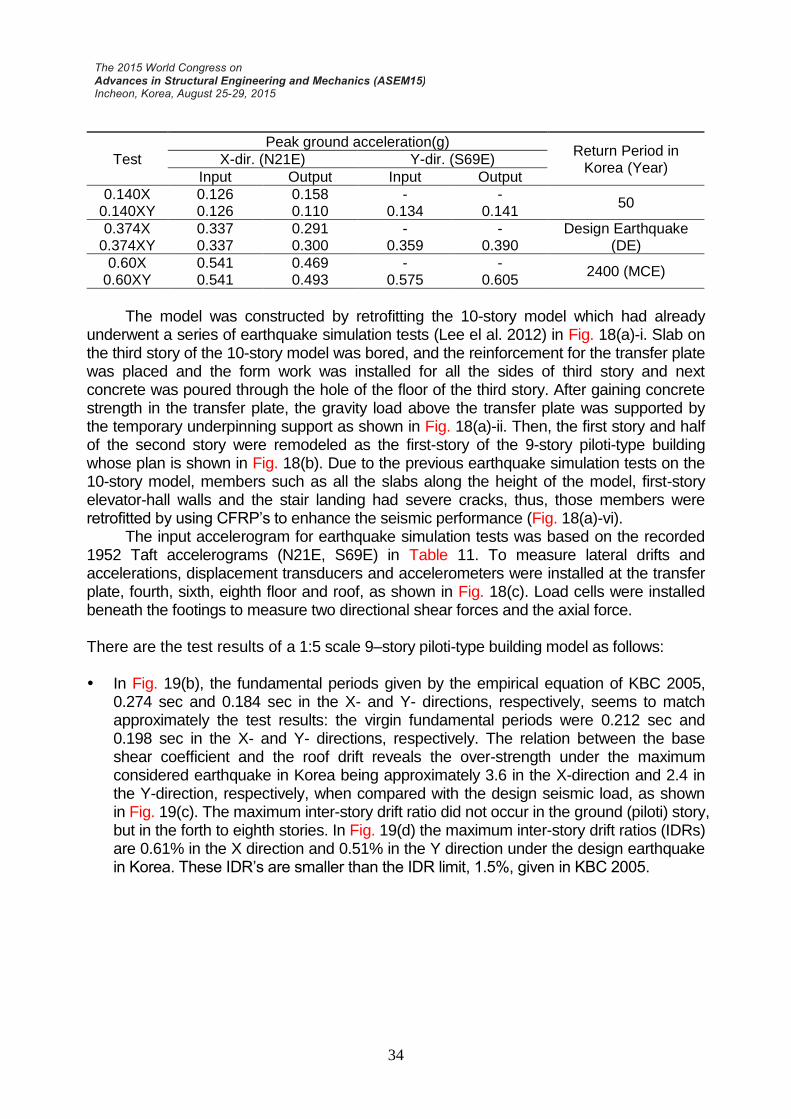
34
Test
Peak ground acceleration(g) Return Period in
Korea (Year) X-dir. (N21E) Y-dir. (S69E)
Input Output Input Output
0.140X 0.126 0.158 - - 50
0.140XY 0.126 0.110 0.134 0.141
0.374X 0.337 0.291 - - Design Earthquake (DE) 0.374XY 0.337 0.300 0.359 0.390
0.60X 0.541 0.469 - - 2400 (MCE)
0.60XY 0.541 0.493 0.575 0.605
The model was constructed by retrofitting the 10-story model which had already
underwent a series of earthquake simulation tests (Lee el al. 2012) in Fig. 18(a)-i. Slab on the third story of the 10-story model was bored, and the reinforcement for the transfer plate was placed and the form work was installed for all the sides of third story and next concrete was poured through the hole of the floor of the third story. After gaining concrete strength in the transfer plate, the gravity load above the transfer plate was supported by the temporary underpinning support as shown in Fig. 18(a)-ii. Then, the first story and half of the second story were remodeled as the first-story of the 9-story piloti-type building whose plan is shown in Fig. 18(b). Due to the previous earthquake simulation tests on the 10-story model, members such as all the slabs along the height of the model, first-story elevator-hall walls and the stair landing had severe cracks, thus, those members were retrofitted by using CFRP’s to enhance the seismic performance (Fig. 18(a)-vi).
The input accelerogram for earthquake simulation tests was based on the recorded 1952 Taft accelerograms (N21E, S69E) in Table 11. To measure lateral drifts and accelerations, displacement transducers and accelerometers were installed at the transfer plate, fourth, sixth, eighth floor and roof, as shown in Fig. 18(c). Load cells were installed beneath the footings to measure two directional shear forces and the axial force. There are the test results of a 1:5 scale 9–story piloti-type building model as follows: In Fig. 19(b), the fundamental periods given by the empirical equation of KBC 2005,
0.274 sec and 0.184 sec in the X- and Y- directions, respectively, seems to match approximately the test results: the virgin fundamental periods were 0.212 sec and 0.198 sec in the X- and Y- directions, respectively. The relation between the base shear coefficient and the roof drift reveals the over-strength under the maximum considered earthquake in Korea being approximately 3.6 in the X-direction and 2.4 in the Y-direction, respectively, when compared with the design seismic load, as shown in Fig. 19(c). The maximum inter-story drift ratio did not occur in the ground (piloti) story, but in the forth to eighth stories. In Fig. 19(d) the maximum inter-story drift ratios (IDRs) are 0.61% in the X direction and 0.51% in the Y direction under the design earthquake in Korea. These IDR’s are smaller than the IDR limit, 1.5%, given in KBC 2005.

35
0.0
0.4
0.8
1.2
0.0 0.2 0.4 0.6 0.8 1.0
Sp
ectr
al a
ccel
erat
ion
, S
a (g
)
Period (sec)
Elastic, Sc, DE (KBC 2005)Elastic, Sc, MCE (KBC 2005)Output (Taft 0.374g X-dir.)Output (Taft 0.374g Y-dir.)Output (Taft 0.60g X-dir.)Output (Taft 0.60g Y-dir.)
MCE (R=1.0, IE=1.0)
DE (R=1.0, IE=1.0)
0.0
0.1
0.2
0.3
0.4
0.5
0.0 0.1 0.2 0.3 0.4 0.5
Base
shear
coeff
icie
nt,
Cs
Period (sec)
0.374g
0.374g
0.60g 0.60g0.80g0.80g
Y-dir. X-dir.
MCE (R=1.0, IE=1.0)
DE (R=1.0, IE=1.0)
Ta, y-dir.=0.184s (Other str.)
Ta, x-dir.=0.273s
(MRF)
(a) Design and response spectra (b) Test results with the design spectra
-0.8
-0.4
0
0.4
0.8
-32 -16 0 16 32
Bas
e sh
ear
coef
fici
ent,
Cs
Roof drift (mm)
Max. base shear (X)
Max. roof drift (X)
KBC2005 (RC MRF)
X-dir.
CS,Design= 0.140.374g
0.6g0.8g
Ω=3.63
Ω=3.11
-0.8
-0.4
0
0.4
0.8
-32 -16 0 16 32
Base
sh
ear
co
eff
icie
nt,
Cs
Roof drift (mm)
Max. base shear (X)
Max. roof drift (X)
KBC2005 (Other structures)
Y-dir.
CS,Design= 0.220.374g
0.6g
0.8g
Ω=2.42
Ω=2.07
(c) Relations between maximum Cs and roof drift
-0.016 -0.008 0 0.008 0.016
Interstory drift ratio (mm/mm)
0.87%
1.5%-1.5%
-0.75%
Sto
ry
2
4
6
8
Roof
0.61%
X-dir.
0.140XY0.374XY0.60XY
-0.016 -0.008 0 0.008 0.016
0.81%
1.5%-1.5%
-0.67%
0.51%
Interstory drift ratio (mm/mm)
Sto
ry
4
6
8
Roof
Y-dir.
0.140XY0.374XY0.60XY
2
(a) Upperside of 3rd floor slab cracks of residential building model
(b) Downside of 3rd floor slab cracks of piloti-type building model
(c) Slab cracks (d) Attachment of cracks between
coupling lintel beams
(d) Envelope of Interstory drift ratio (e) Cracks of slab
52%
60%
51%40%
60%
80%
100%
120%
Sti
ffn
ess
deg
rad
atio
n Total Piloti 2nd story
0.14XY 0.374XY 0.6XY 0.8XY
X-dir.
59%56%
83%
40%
60%
80%
100%
120%
Sti
ffnes
s deg
radat
ion Total Piloti 2nd story
0.14XY 0.374XY 0.6XY 0.8XY
Y-dir.
75%72%
48%40%
60%
80%
100%
120%
Sti
ffnes
s deg
radat
ion Total Piloti 2nd story
0.14XY 0.374XY 0.6XY 0.8XY
Torsion
(f) Crack patterns of outer wall (g) Stiffness degradation
Stiff
side
-200
-100
0
100
200
7 8 9 10 11
To
rsi
on
al M
. (k
Nm
) Total (LC) Contribution by stiff side
0.6XY -5
-2.5
0
2.5
5
0 1 2 3 4
Tra
nsfe
r p
late
sto
ry d
rift
(mm
)
Middle Left Right0.374XY, Y-dir.
(h) Contribution of torsional moment by the stiff side with infill wall (0.6XY)
Fig. 19 Shake-table test results of 1:5-scale 9-story piloti-type RC residential building structure model (Lee et al. 2013)

36
The cracks of slab in the 10-story residential model on the precedent study were concentrated across the long-span and along the slab-wall joint in the Y direction as shown in Fig. 19(e). In contrast with the 10-story model, the cracks of the slabs in the 9-story piloti model were occurred in vicinity of exterior frames and above the coupling beams. Fig. 19(f) shows the development of cracks in the Y-directional exterior frames for each test. A number of horizontal cracks were observed on these structure, not only at the piloti story but also at the stories above the transfer plate. Such results are similar to those in Li and Lam’s study (2006), in which significant cracks and damage at the stories above the transfer plate were observed. Infilled walls did not reveal horizontal cracks as observed in the upper walls, but local cracks were observed at the boundaries with the columns and the transfer plate.
Fig. 19(g) shows stiffness degradation for the three groups: the total structure, the ground (piloti) story, and the 2nd story. Assuming that the stiffness under 0.14XY showing elastic behaviour is the initial stiffness (100%), stiffnesses at test level of 0.374XY, 0.60XY, and 0.80XY are presented as a percentage to the initial stiffness. In the X-direction, the stiffness degradations for the three groups are similar to each other, and the total stiffness under 0.80XY is 52% of the initial stiffness. In the Y-direction, the stiffness for the total structure, the piloti story, and the 2nd story under 0.80XY are 45%, 56%, and 83% of the corresponding initial stiffnesses, respectively. For the degradation of the torsional stiffness, and the percentages of the stiffness for the total structure and piloti story under 0.80XY are approximately 75% while the stiffness for the second story is 48% of the initial stiffness.
Fig. 19(h) shows the contribution of the Y-directional exterior frame with infilled wall to the total torsional moment under 0.60XY obtained from load cells through the time histories. Most of the torsional moment is resisted by the exterior frame with infilled walls, and the torsional moments resisted by the core wall and exterior frame without infilled walls are very little.
2.8 1:15-scale 25-story RC Flat-Plate Core-Wall Building Model
Recently, the number of high-rise buildings (higher than 30 stories) has been increasing, for the efficient use of available housing site. For these high-rise buildings, a combined system of core shear walls: a lateral load resistance structural system, and flat-plates: a gravity load resistance structural system, has been widely used. These structural types in current seismic provisions, KBC2009 and IBC2006, are classified as dual frame or building frame system. For the shear walls in the building frame system, special shear walls, for which special seismic detailing requirements are imposed, or ordinary shear walls, which have a height restriction, have been generally used. However, in the case of the RC flat-plate structure, seismic detailing requirements for the connection with columns are given only as part of intermediate moment frames in ACI 318-05. Furthermore, in the dual frame or building frame systems, two vertical shear walls generally include regular openings, and are connected each other with coupling beams, which have a great effect on the lateral resistance behavior. Lee et al. (2014) investigated the seismic characteristics of this type of building structure through a shaking table tests on 1:15 scale 25-story RC flat-plate core-wall building mode.

37
28500
28500
8700 9600 8700 750
8100
5400
5400
8100
750
27000
27000
10200
11400
34
00
20
005
40
0
2450
35753575
Prototype building
Height : 79.5 m
Column : 900 × 900mm
Slab thickness : 300mm
Wall thickness : 600mm
f’c = 40 MPa
fy = 400 MPaY
X
1:15 scale model
Height : 5.3 m
Column : 60 × 60 mm
Slab thickness : 20 mm
Wall thickness : 40 mm
f’c = 40 MPa
fy = 400 MPaY
X
1900
1900
580 640 580 50
540
360
360
540
50
1800
1800
680
760
150
(a) Prototype (b) Plan of protype buidling and 1:15 scale model
6-D16@400
60
0
9-D29@4002-D29@400
25
-D2
9@
40
04
60
60
01
02
00
60
01
14
00
3975 2450 3975
10400
Y
X
21-D
16@
250
37-D
16@
125
9-D29@4002-D29@460
3375
250
600
3975
2000
(c) Details of core wall and rebar fabrications of the core wall in the 1:15 scale model
1197
300
View A
View B
Y
X
11
97
Displacement
(6, 10, 14, 18, 22F)Accelerometer
(6, 10, 14, 18, 22F)
shaking table
75
30
30
30
shaking table
View A View B
LVDTs
Reference
Frame
D1,D2
D3,D4
D5,D6
D7,D8
D9,D10
D13,D14
D15,D16
D17,D18
D19,D20
D21,D22
D23,D24Load Cell
A1
D11,D12
A2
A3 A4
A5 A6
A7 A8
A9 A10
A11 A12
A13 A14
A15 A16
A17 A18
A19 A20
A21 A22
A23 A24
Accelerometer
(d) Overview of the shaking
table test setup (e) Instrumentations
Fig. 20 1:15-scale 25-story RC flat-plate core-wall building model (Lee et al, 2014)
Among the RC flat-plate core-wall building structures constructed in Korea, the most typical type was chosen as a prototype: This was originally a 35-story flat-plate building (Fig. 20(a)), where each floor has four dwelling units, and each dwelling unit has the size of 188m2, as shown in Fig. 20(b). However, due to limitation in the capacity of the shake table at the earthquake simulation test center of Pusan National University

38
(size 5m x 5m, payload 600 kN) and for the convenience of construction of the model, the number of the stories of the prototype for the shaking table test was reduced to 25 (height: 79.5m), and staircases and slabs inside the core walls were all omitted. The height of the first story is 5.1m, with those of the other stories being 3.1m. In the prototype building, core walls take most of resistance to the lateral load, and peripheral frames are designed to resist only the gravity load, in accordance with the definition of the building frame system.
Table 12. Similitude law
Quantities Scale Factor True replica model Distorted model
Length Sl 1/15 1/15
Elastic modulus SE 1 1
Density Sρ 15 (total weight=1,160kN) 4.18 (total weight=323kN)
Acceleration Sa= SE / (Sρ · Sl) 1 1/(4.18 × 1/15) = 3.59
Force SE · Sl 2 1 × (1/15)2 1 × (1/15)2
Frequency la SS / 15 15×59.3=)15/1/(59.3
Time la SS //1 15/1 15×59.3/1
Table 13. Test Program (X-dir.: Taft N21E, Y-dir.: Taft S69E)
Test Designation
Intended PGA (g)
Measured PGA (g) / 3.59
Return period in Korea
Test Designation
Intended PGA (g)
Measured PGA (g) / 3.59
Return period in Korea
X-dir. Y-dir. X-dir. Y-dir. X-dir. Y-dir. X-dir. Y-dir.
White Noise (0.025 X, Y) White Noise (0.025 X, Y)
0.035X 0.035 0.0243 Elastic
Behavior
0.187X 0.187 0.137 Design Earthquake
(DE) 0.035Y 0.040 0.034 0.187Y 0.216 0.167
0.035XY 0.035 0.040 0.0243 0.034 0.187XY 0.187 0.216 0.137 0.167
White Noise (0.025 X, Y) White Noise (0.025 X, Y)
0.07X 0.070 0.052
50 years
0.3X 0.300 0.226 MCE
2400 years 0.07Y 0.080 0.065 0.3Y 0.345 0.253
0.07XY 0.070 0.080 0.052 0.065 0.3XY 0.300 0.345 0.226 0.253
White Noise (0.025 X, Y) White Noise (0.025 X, Y)
0.154X 0.154 0.127
500 years
0.4X 0.400 0.300 DE in San Francisco
USA 0.154Y 0.176 0.140 0.4Y 0.460 0.354
0.154XY 0.154 0.176 0.127 0.140 0.4XY 0.400 0.460 0.300 0.354
The size and payload of a shaking table in the Earthquake Test Center of Pusan
National University are 5m×5m and 600kN, respectively, and the model was scaled down to 1/15, taking availability of model reinforcement and constructability into consideration. Taking into account the length similitude factor, Sl of 1/15, and the weight of available steel plates for added artificial mass, the density similitude factor, Sρ, was chosen to be 4.18. Therefore, the acceleration similitude factor, Sa, was determined as 3.59. The similitude law applied to the test model is summarized in Table 12. The program of earthquake simulation tests is summarized in Table 13. The target or input accelerogram of the table was based on the recorded 1952 Taft N21E (X direction) and Taft S69E (Y-direction) components, and was formulated by compressing the time axis with the scale
factor of, 15×59.3/1 , and by amplifying the acceleration with the scale factor, 3.59. Fig.
20(d) shows an overview of the model. Displacement transducers and accelerometers were installed at the floors of the 6th, 10th, 14th, 18th, and 22nd stories, and at the roof, to measure the overall behavior of the model as shown in Fig. 20(e).

39
The test results of a 1:15-scale 25-story building model are as follows: The initial first-mode natural periods of the model obtained using the white noise
test were 0.413 s and 0.341 s in the X and Y directions, which are similar to the values of 0.357 s and 0.277 s obtained via modal analysis for the design of the prototype (Fig. 21(b)). The natural periods increased by approximately 1.5-fold compared to the initial natural period after the maximum considered earthquake in Korea (MCE, 0.3XY), and the damping ratio for the first mode varied from approximately 5% to 7% in the X direction and 4% to 7% in the Y direction.
In Fig. 21(c), under the design earthquake in Korea (DE, 0.187XY), the base shear coefficients were 0.0361 in the X direction and 0.0518 in the Y direction, which are 1.5- and 2-fold larger than the design base shear coefficient of 0.0253, respectively. The strength increased gradually with the significant decrease of stiffness, and a large over-strength occurred (Fig. 21(d)). Under the DE (0.187XY), the maximum inter-story drift ratio was 0.31% from the 10th to 13th stories in the X direction and 0.30% from the 18th to 21th stories in the Y direction in Fig. 21(e), which satisfy the allowable inter-story drift ratio of 1.5% imposed by KBC 2009 (IBC 2006).
The model displayed behavior in the first mode during free vibration after the termination of excitation as shown in Fig. 21(g), and the maximum values of the base shear and roof drift in this duration can be either similar to or larger than the values of the maximum responses during the table excitation. However, the design approach proposed in the current seismic design codes accounts for the seismic behavior in the time period of ground excitation and does not consider the free vibration behavior after excitation. A design approach that considers this behavior must be developed.
The higher modes were observed in both the X and Y directions in the vertical distribution of acceleration as shown in Fig. 21(h). In particular, when the roof acceleration reached a maximum, the effect of the second and third modes governed, and the largest story shear was apparent from the 14th to 21st stories instead of the first story (Fig. 21(i)). The middle stories experienced intensive cracks in the slabs surrounded the columns (Fig. 21(f)), coupling beams, and walls. Therefore, for the design of high-rise buildings (i.e., higher than 70m), where the higher-mode effect dominates, the responses when the roof acceleration reaches a maximum could be more critical to the middle stories than the responses when the base shear or roof drift reaches a maximum (Fig. 21(j)).
While cracks developed near the connections between the slab and column and between the slab and wall under the DE in Korea (0.187XY), the lateral stiffness decreased significantly and was approximately 50% and 70% of the initial values in the X and Y directions under test 0.07XY, respectively (Fig. 21(d)). After the MCE in Korea (0.3XY), the cracks propagated in not only slabs but also the walls and coupling beams, and the lateral stiffness appeared to be 34% and 49% of the initial stiffness in the X and Y directions, respectively; the maximum roof drift ratios remained within 0.7%. The effective stiffness should be appropriately adjusted in the seismic design according to the expected maximum lateral drift.

40
0.0
0.2
0.4
0.6
0.8
0.0 0.1 0.2 0.3 0.4 0.5
Sa
Period (sec)
Elastic, Sd (KBC2009)
Inelastic, Sd (KBC2009)
Output (0.187g X-dir)
Output (0.187g Y-dir)
MCE, Sd (KBC2009)
MCE
DE(R=1.0, I=1.0)
DE(R=6.0, I=1.2)
0
0.05
0.1
0.15
0.1 0.2 0.3 0.4 0.5 0.6 0.7
Bas
e sh
ear co
effi
cien
t, C
s
Period (sec)
X-dir.Y-dir.
0.035g
0.07g
0.154g
0.187g 0.3g
0.4g
Cs, design = 0.0253
DE (I = 1.0, R=1.0)
DE (I = 1.2, R=6.0)
Ty (anal.) = 0.277 s
Tx (anal.) = 0.357 s
(a) KBC 2009 design spectra and output
response spectra under design earthquake (b) Relation of the natural period and base shear coefficient with the design spectra
0
0.02
0.04
0.06
0.08
0.1
0 20 40 60
Bas
e sh
ear co
effi
cien
t, C
s
Roof displacement (mm)
XY ExcitationX Excitation
X-dir.
0.035g0.07g
0.154g 0.187g
0.3g0.4g
Ω = 1.43Cs, design = 0.0253
0
0.02
0.04
0.06
0.08
0.1
0 20 40 60
Bas
e sh
ear co
effi
cien
t, C
s
Roof displacement (mm)
XY ExcitationY Excitation
Y-dir.
0.035g
0.07g
0.154g0.187g 0.3g
0.4g
Ω = 2.05
Cs, design = 0.0253
(c) Correlation between maximum roof drift and base shear coefficient
-100
-50
0
50
100
-60 -30 0 30 60
Bas
e sh
ear
(kN
)
Roof displacement (mm)
Table
ExcitationNo
Excitation
0.07XY
Vmax = - 23.9kN
k = 4.71 kN/mm
X-dir.
-100
-50
0
50
100
-60 -30 0 30 60
Bas
e sh
ear
(kN
)
Roof displacement (mm)
Table
ExcitationNo
Excitation
0.187XY
Vmax = 41.9kN
k = 2.36 kN/mm
X-dir.
-100
-50
0
50
100
-60 -30 0 30 60
Bas
e sh
ear
(kN
)
Roof displacement (mm)
Table
ExcitationNo
Excitation
0.3XY
Vmax = - 67.9kN
k = 1.61 kN/mm
X-dir.
-100
-50
0
50
100
-60 -30 0 30 60
Bas
e sh
ear
(kN
)
Roof displacement (mm)
Table
ExcitationNo
Excitation
0.4XY
Vmax = - 70.5kN
k = 0.97 kN/mm
X-dir.
-100
-50
0
50
100
-60 -30 0 30 60
Bas
e sh
ear
(kN
)
Roof displacement (mm)
Table
Excitation
No
Excitation
0.07XY
Vmax = 26.5kN
k = 5.26 kN/mm
Y-dir.
-100
-50
0
50
100
-60 -30 0 30 60
Bas
e sh
ear
(kN
)
Roof displacement (mm)
Table
Excitation
No
Excitation
0.187XY
Vmax = 60.2kN
k = 3.67 kN/mm
Y-dir.
-100
-50
0
50
100
-60 -30 0 30 60
Bas
e sh
ear
(kN
)
Roof displacement (mm)
Table
Excitation
No
Excitation
0.3XY
Vmax = 79.9kN
k = 2.55 kN/mm
Y-dir.
-100
-50
0
50
100
-60 -30 0 30 60
Bas
e sh
ear
(kN
)
Roof displacement (mm)
Table
Excitation
No
Excitation
0.4XY
Vmax = 83.3kN
k = 1.79 kN/mm
Y-dir.
(d) Hysteretic relation of the base shear and roof displacement
02468
1012141618202224262830
-0.02 -0.01 0 0.01 0.02
Sto
ry
Interstory drift ratio (rad)
0.187XY0.3XY
0.4XYRoof
22
18
14
10
6
X-dir.
No Excitation
1.5%
02468
1012141618202224262830
-0.02 -0.01 0 0.01 0.02
Sto
ry
Interstory drift ratio (rad)
0.187XY0.3XY0.4XY
Roof
22F
18F
14F
10F
6F
Y-dir.
No Excitation
1.5%
12th floor
18th floor
(e) Envelope of interstory drift ratio (f) Crack patterns in the upper sides of the
12th and 18th floor slabs under MCE Fig. 21 Shake-table test results of a 1:15-scale 25-story RC flat-plate core-wall building
model (Lee et al, 2014)

41
62.9
-67.9
58.2
-53.4 -90
-45
0
45
90
7 8 9 10 11 12 13 14 15 16 17 18
Bas
e sh
ear
(kN
)
Time (sec)
0.3XY, X-dir.
Base shear
79.9
-76.3
53.5
-44.3 -90
-45
0
45
90
7 8 9 10 11 12 13 14 15 16 17 18
Bas
e sh
ear
(kN
)
Time (sec)
0.3XY, Y-dir.
Base shear
Table Excitation No Excitation
15.3
-23.1
34.4
-27.6 -40
-20
0
20
40
7 8 9 10 11 12 13 14 15 16 17 18
Dis
p. (m
m)
Time (sec)
0.3XY, X-dir.
Roof disp.
23.2
-23.8
18.7
-17.9 -40
-20
0
20
40
7 8 9 10 11 12 13 14 15 16 17 18
Dis
p. (m
m)
Time (sec)
0.3XY, Y-dir.
Roof disp.
Table Excitation No Excitation
(g) Time histories of the base shear and roof displacement under MCE in Korea
0.451
-0.731
02468
1012141618202224262830
-1.5 -1 -0.5 0 0.5 1 1.5
Flo
or
Acceleration (g)
0.187XY0.3XY0.4XY
Roof
22
18
14
10
6
Max. Base shear Table Excitation
X-dir.
0.308 -0.306
02468
1012141618202224262830
-1.5 -1 -0.5 0 0.5 1 1.5
Flo
or
Acceleration (g)
0.187XY0.3XY0.4XY
Roof
22F
18F
14F
10F
6F
Max. Base shear No Excitation
X-dir.
0.475 -0.443
02468
1012141618202224262830
-1.5 -1 -0.5 0 0.5 1 1.5
Flo
or
Acceleration (g)
0.187XY0.3XY0.4XY
Roof
22F
18F
14F
10F
6F
Max. Base shear Table Excitation
Y-dir.
0.285 -0.183
02468
1012141618202224262830
-1.5 -1 -0.5 0 0.5 1 1.5
Flo
or
Acceleration (g)
0.187XY0.3XY0.4XY
Roof
22F
18F
14F
10F
6F
Max. Base shear No Excitation
Y-dir.
(h) Distribution of acceleration at instants of maximum roof acceleration
38.5 -34.8
02468
1012141618202224262830
-90 -60 -30 0 30 60 90
Sto
ry
Shear force (kN)
0.187XY0.3XY0.4XY
Roof
22
18
14
10
6
Max. Roof Accel. Table Excitation
X-dir.
57.0 -37.4
02468
1012141618202224262830
-90 -60 -30 0 30 60 90
Flo
or
Shear force (kN)
0.187XY0.3XY0.4XY
Roof
22F
18F
14F
10F
6F
Max. Roof Accel. No Excitation
X-dir.
49.3 -77.5
02468
1012141618202224262830
-90 -60 -30 0 30 60 90
Flo
or
Shear force (kN)
0.187XY0.3XY0.4XY
Roof
22F
18F
14F
10F
6F
Max. Roof Accel. Table Excitation
Y-dir.
53.5
-28.6
02468
1012141618202224262830
-90 -60 -30 0 30 60 90
Flo
or
Shear force (kN)
0.187XY0.3XY0.4XY
Roof
22F
18F
14F
10F
6F
Max. Roof Accel. No Excitation
Y-dir.
(i) Distribution of story shear at instants of maximum roof acceleration
15.3 -23.1
02468
1012141618202224262830
-60 -40 -20 0 20 40 60
Flo
or
Displacement (mm)
0.187XY0.3XY0.4XY
Roof
22
18
14
10
6
Max. Roof Disp. Table Excitation
X-dir.
-1.1 -0.7 -0.4 0 0.4 0.7 1.1
Drift ratio (%)
23.2-23.8
02468
1012141618202224262830
-60 -40 -20 0 20 40 60
Displacement (mm)
0.187XY0.3XY0.4XY
Roof
22F
18F
14F
10F
6F
Max. Roof Disp. Table Excitation
Y-dir.
-1.1 -0.7 -0.4 0 0.4 0.7 1.1
Drift ratio (%)
34.4 -27.6
02468
1012141618202224262830
-60 -40 -20 0 20 40 60
Flo
or
Displacement (mm)
0.187XY0.3XY0.4XY
Roof
22
18
14
10
6
Max. Roof Disp. No Excitation
X-dir.
-1.1 -0.7 -0.4 0 0.4 0.7 1.1
Drift ratio (%)
18.7 -17.9
02468
1012141618202224262830
-60 -40 -20 0 20 40 60
Displacement (mm)
0.187XY0.3XY0.4XY
Roof
22F
18F
14F
10F
6F
Max. Roof Disp. No Excitation
Y-dir.
-1.1 -0.7 -0.4 0 0.4 0.7 1.1
Drift ratio (%)
(j) Distribution of the drift at the maximum response of roof drift
0.0014
-0.000180.0058
0.00078
0.00094
-0.00018
0.0078
0.0013
X-dir. (0.3XY)
인장변형(+)
압축변형(-)
Vx = 58.8 kN
Vy = 12.8 kN
Time = 14.04 secTension (+)
Compression (-)
X-dir.
Y-dir.φx-dir. = 0.0085rad/m
φx-dir.= 0.034rad/m(tension)
(compression)
-60
-30
0
30
60
-0.15 -0.075 0 0.075 0.15
Mom
ent
(kN
m)
Curvature (rad/m)
1.0 DLDL/3.59εy = 0.002εc = 0.003εc = 0.006
Short wall
φu = 0.041
φx-dir.=0.0085
φcl = 0.019
φx-dir. = 0.034
φy = 0.0104
εy
εc
εc
(k) Strain distribution of the core wall at the
bottom of the first story under 0.3XY (l) Relation of the moment and curvature
(M-φ) in core wall (X-dir.) Fig. 21 (Continued)

42
In accordance with the displacement-based design method proposed in ACI 318-05, special boundary details were imposed on the short wall in the first story with the expected plastic rotation of θp = 0.00537 rad (Fig. 21(k)). No significant plastic deformation was observed under the MCE in Korea. At the bottom 70 mm of the first story, the measured maximum curvature when the end of the boundary element in the short wall is in compression is φx-dir. = 0.0085 rad/m, which is approximately 21% of 0.041 rad/m, the ultimate curvature corresponding to the expected compressive strain of 0.00638 m/m (Fig. 21(l)). This result, together with the above-mentioned findings, implies that the design requirements on the boundary elements of the walls given in ACI 318-05 may be overly conservative, particularly for the wall design of high-rise RC building frames or dual-frame structures with more than 20 stories. Because the conclusions are based on the test results of only one building model with non-negligible foundation rocking, further research is required to generalize these conclusions.
3. SEISMIC DESIGN IMPLICATIONS FOR LOW-TO-MODERATE SEISMIC REGIONS (1) The 3-story frame model showed the linear elastic behavior under the Taft N21E
motion with the peak ground acceleration of 0.12g, representing the design earthquake in Korea. The model revealed fairly good resistance to the higher levels of earthquake simulation tests though it was not designed against earthquakes. The main components of its resistance to the high level of earthquakes is the high over-strength. The model structure has the overall displacement ductility ratio of 2.4 and the over-strength factor of approximately 8.7.
(2) When the bare frame was infilled with the masonry of cement bricks, the masonry infills contribute to the large increase in the stiffness and strength of the global structure whereas they also accompany the increase of earthquake inertia forces. The masonry infills can be beneficial to the seismic performance of the structure since the amount of the increase in strength appears to be greater than that in the induced earthquake inertia forces while the deformation capacity of the global structure remains almost same regardless of the presence of the masonry infills.
(3) 17-story wall building structures with a vertical irregularity at the lowest two stories having three different frame plans were subjected to a series of earthquake simulation tests. The seismic response coefficients measured under the design earthquake (Taft030) were 2.8 to 3.1 times the design coefficient, 0.048 for all models. Model 1 having no shear wall in the frame of the lowest two stories showed a sway plastic mechanism in the lower stories during a severe earthquake (Taft080). The shear wall in the central frame in Model 2 caused the reduction of shear deformation to 0.48%, which is about one third of that in the case of Model 1. The large torsional eccentricity did not necessarily induce a larger deformation in the flexible side in Model 3 having a shear wall in only edge frame parallel to the ground excitations when compared with the case of Model 1. The base-shear versus torque (BST) diagram was useful for observing the mode of vibration leading to the collapse of the system. The hysteretic curves of Model 3 under Taft080 showed that the base shear and torque were in phase during the

43
translation/torsion coupled mode, but became out of phase during the torsional mode after the structure sustained large inelastic deformation in the flexible side.
(4) A 5-story residential apartment building that has a high irregularity of weak story, soft story, and torsion simultaneously at the ground story and was designed only for gravity loads, survived the table excitations simulating the design earthquake with the PGA of 0.187g without any significant damages. The lateral resistance and stiffness of the critical columns and wall increased or decreased significantly with the large variation of acting axial forces caused by the high bi-directional overturning moments and rocking phenomena under the bi-directional excitations.
(5) The applicability of buckling restrained braces (BRB’s) and fiber reinforced polymer (FRP) sheets to the seismic strengthening of the first story in the above 5-story building appears questionable because the BRB’s revealed significant slips at the joint with the existing RC beam, up-lifts of columns from RC foundations and displacements due to the flexibility of foundations. The initial lateral stiffness appeared to be, thereby, as low as one seventh of the intended value, which led to a large yield displacement and, therefore, the BRB’s could not dissipate seismic input energy as desired within the range of anticipated drift ratio of 1%.
(6) The same strengthened 5-story model was studied regarding the torsional behavior because all the response data at the ground story for determining the base shear and torsional eccentricity were obtained for analysis. As the intensity of table excitations increased, representing earthquakes with return periods from 50 to 2500 years in Korea, the range of eccentricities at the peak values in the time histories of drift and base shear decreased from approximately ±30% to within ±10% of the transverse dimension of the model. The inertial torque was resisted by both longitudinal and transverse frames, in proportion to their instantaneous rigidity. Yielding of the longitudinal frames under severe table excitations caused a substantial loss in their instantaneous torsional resistance and thereby transferred most of the large torque to the transverse frames, resulting in a significantly degraded torsional stiffness with an enlarged torsional deformation despite almost zero eccentricity. From these observations, it is clear that the eccentricity in itself cannot represent the critical torsional behaviors. To overcome this problem, the demand in torque shall be determined in a direct relationship with the base or story shear, given as an ellipse constructed with the maximum points in its principal axes located by the two adjacent torsion-dominant modal spectral values. This approach provides a simple, but transparent design tool by enabling comparison between demand and supply in shear force-torque diagrams.
(7) A 10-story RC box-type wall building structure representing the most popular type of residential buildings in Korea was studied regarding seismic resistance. The model structure showed the over-strength factor, 2.5-3.0 under the maximum considered earthquake (MCE) in Korea. Under the DE in Korea, the maximum inter-story drift ratio (IDR) was within 0.3%. The high over-strength came from the contribution of slab by increasing the capacity of structure through coupling the tension/compression membrane action in the walls. Under the MCE in Korea, the maximum axial strain demands of the wall boundaries in the lower part of the first story are within 0.006m/m in tension and 0.0012m/m in compression, which cannot lead to concrete crushing or reinforcement buckling and fracture as shown in 2011 Conception Chile earthquake.

44
(8) The 9-story RC piloti-type residential building model showed the over-strength factor, 3.6 in the X direction and 2.4 in the Y direction, and the maximum inter-story drift ratio (IDR), 0.61% occurs not at the piloti story but at the fourth to fifth story under the MCE in Korea. In contrast to common expectation that cracks and damages would concentrate on the piloti story, a number of horizontal cracks were observed, not only at the piloti story, but also throughout several stories above the transfer plate.
(9) The 25-story RC flat-plate core-wall building model revealed the effect of the higher modes, whereas free vibration after the termination of the table excitations was governed by the first mode. The maximum values of base shear and roof drift during the free vibration are either similar to or larger than the values of the maximum responses during the table excitation. With a maximum roof drift ratio of 0.7% under the MCE in Korea, the lateral stiffness degraded to approximately 50% of the initial stiffness. Energy dissipation via inelastic deformation was predominant during free vibration after the termination of table excitation rather than during table excitation. The walls with special boundary elements in the first story did not exhibit any significant inelastic behavior, which means the inapplicability of the present methodology such as required in ACI 318 to determine the plastic deformation demand.
ACKNOWLEDGMENTS The research presented herein was supported by the government of Republic of Korea. REFERENCES ACI Committee 318 (2005) Building code requirements for structural concrete and
commentary (ACI 318-05), American Concrete Institute, Detroit. AIK (2001) AIK 2000, Architectural Institute of Korea, Seoul, Korea. (in Korean) AIK (2005) Korean Building Code, KBC 2005, Architectural Institute of Korea, Seoul,
Korea. (in Korean) AIK (2009) Korean Building Code, KBC 2009, Architectural Institute of Korea, Seoul,
Korea. (in Korean) Fardis, M.N. (2014) Comments on the seismic design provisions of the Korean Building
Code 2009. (Opinion paper) ICC (2000) International Building Code, IBC 2000, International Code Council, Country
Club Hills, IL. ICC (2006) International Building Code, IBC 2006, International Code Council, Country
Club Hills, IL. Hwang, S. J., Lee, K. B., Kang, C. B., Lee, H. S., Lee, S. H., and Oh, S. H. (2011). “Design
and Construction of a 1:5 Scale 10-Story R.C. Apartment Building Model for Earthquake Simulation Tests,” Journal of the Earthquake Engineering Society of Korea. 15(6), 67-80. (in Korean)
Ko, D. W., and Lee, H. S. (2006). “Shaking table tests on a high‐rise RC building model having torsional eccentricity in soft lower storeys”, Earthquake Engineering & Structural Dynamics, 35(11), 1425-1451.

45
Korea National Statistical Office (KNSO) (2010) Population and Housing Census. (in Korean)
Lam, N. (2014) Displacement based assessment of structures for low and moderate seismic regions (Opinion paper).
Lee, H. S., and Woo, S. W. (2002a) “Seismic performance of a 3-story RC frame in a low-seismicity region”, Engineering Structures, 24(6), 719-734.
Lee, H. S., and Woo, S. W. (2002b). “Effect of masonry infills on seismic performance of a 3‐storey R/C frame with non‐seismic detailing”, Earthquake Engineering & Structural Dynamics, 31(2), 353-378.
Lee, H. S., and Ko, D. W. (2002). “Shaking Table Tests of a High-Rise RC Bearing-Wall Structure with Bottom Piloti Stories”, Journal of Asian Architecture and Building Engineering, 1(1), 47-54.
Lee, H. S., and Ko, D. W. (2007). “Seismic response characteristics of high-rise RC wall buildings having different irregularities in lower stories”, Engineering Structures, 29(11), 3149-3167.
Lee, H. S., Jung, D. W., Lee, K. B., Kim, H. C., and Lee, K. (2011). “Shake-table responses of a low-rise RC building model having irregularities at first story”, Structural Engineering and Mechanics, 40(4), 517-539.
Lee, H. S., Hwang, S. J., Lee, K. B., Kang, C. B., Lee, S. H., and Oh, S. H. (2012). “Earthquake Simulation Tests on a 1: 5 Scale 10-Story RC Residential Building Model,” The 15th World Conference on Earthquake Engineering (15WCEE), Lisbon, Portugal.
Lee, H. S., Lee, K.B., Hwang, K.R., and Cho, C.S. (2013). “Shake table responses of an RC low-rise building model strengthened with buckling restrained braces at ground story”, Earthquakes and Structures, 5(6), 703-731.
Lee, H.S., Kang, C.B., Jeong, G.H., Lee, S.H., and Oh, S.H. (2013). “Earthquake Simulation Tests on a 1:5 Scale 9-Story Piloti-Type RC Residential Building Model”, 5th International Conference on Advances in Experimental Structural Engineering. Taipei, Taiwan.
Lee, H.S. and Hwang, K.R. (2015), “Torsion design implications from shake-table responses of an RC low-rise building model having irregularities at the ground story”, Earthquake Engineering & Structural Dynamics, 44(6), 907–927.
Lee, H. S., Hwang, K. R., & Kim, Y. H. (2015). “Seismic performance of a 1: 15‐scale 25‐story RC flat‐plate core‐wall building model,” Earthquake Engineering & Structural Dynamics, 44(6), 929-953.
Li, C. C. and Lam, S. S. E. (2006) “Shaking Table Test of a 1:20 Scale High-Rise Building with a Transfer Plate System,” Journal of Structural Engineering, Vol. 132, pp.1732-1744.
Top Related