


Languages
Pages
Legal


SEDS Review
Chris MarnayMichael Stadler Inês Lima AzevedoJudy Lai Ryoichi KomiyamaSam BorgesonBrian Coffey
May 7, 2009
SEDS Building Sector Module
LAWRENCE BERKELEY NATIONAL LABORATORY is a U.S. Department of Energy National Laboratory Operated by the University of California

Building Sector in the SEDS Context
Macroeconomics
Biomass
Coal
Natural Gas
Oil
Biofuels
Hydrogen
Liquid Fuels
Heavy Transportation
Industry
Light Vehicles
Macroeconomics Converted EnergyPrimary Energy End-Use
Buildings
Electricity
3
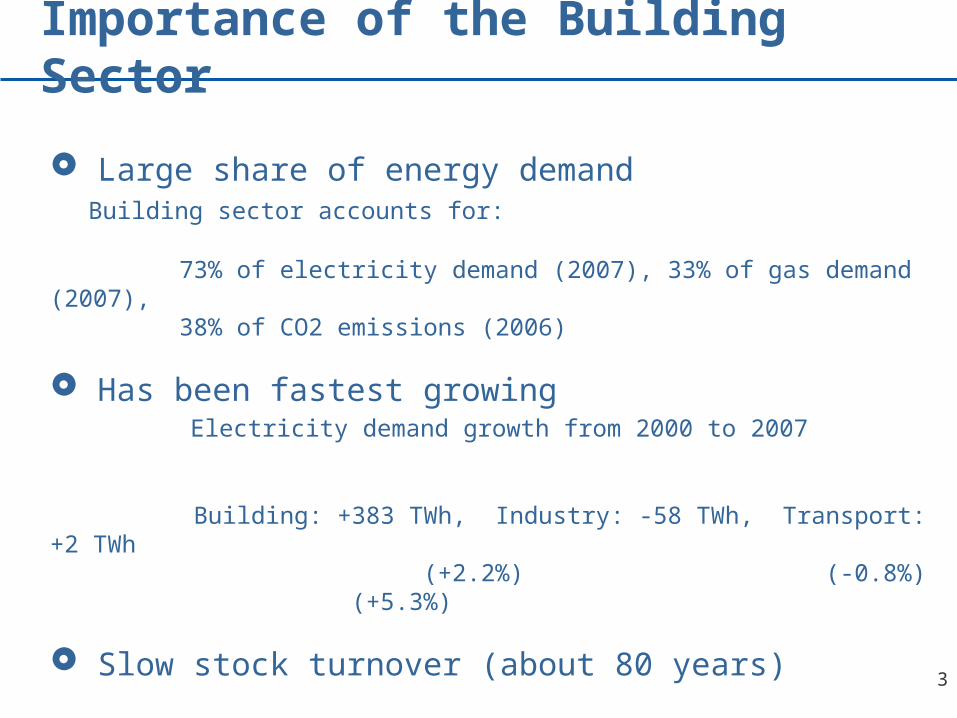
Importance of the Building Sector
Large share of energy demand Building sector accounts for: 73% of electricity demand (2007), 33% of gas demand (2007), 38% of CO2 emissions (2006)
Has been fastest growing Electricity demand growth from 2000 to 2007 Building: +383 TWh, Industry: -58 TWh, Transport: +2 TWh (+2.2%) (-0.8%) (+5.3%)
Slow stock turnover (about 80 years)
Active, passive technologies & on-site generation (ZNEB)
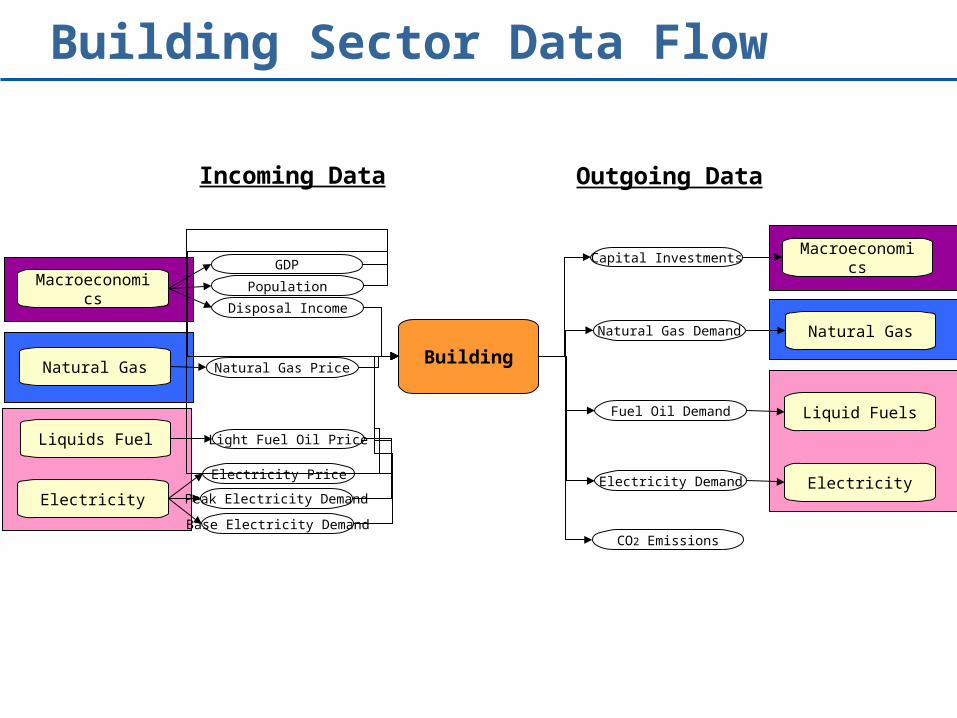
Building Sector Data Flow
Macroeconomics
Natural Gas
Building
Liquid Fuels
Liquids Fuel
Electricity
Natural Gas
Light Fuel Oil Price
Natural Gas Price
Electricity Price
GDPMacroeconomic
sCapital Investments
Natural Gas Demand
Fuel Oil Demand
CO2 Emissions
Incoming Data Outgoing Data
Population
Disposal Income
Peak Electricity Demand
Base Electricity Demand
ElectricityElectricity Demand
5
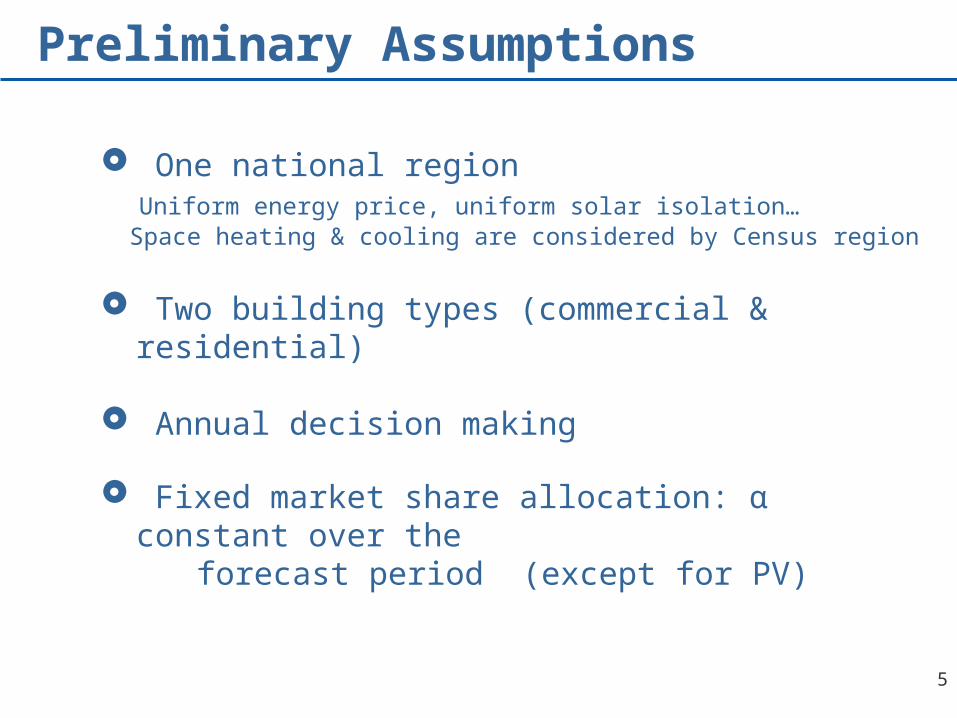
Preliminary Assumptions
One national region Uniform energy price, uniform solar isolation… Space heating & cooling are considered by Census region
Two building types (commercial & residential)
Annual decision making Fixed market share allocation: α constant over the forecast period (except for PV)

6
Buildings Lite Module
Covers both residential and commercial
Tracks building stock
Meets building services
Treats buildings systemically
Enables analysis of major technologies R&D programs
Uses expert elicitation of potential advances
Runs stand-alone or integrated

7
Buildings Module Logic Flowinputs
(GDP, population, fuel prices etc.)
floorspace forecast
service demand forecast(not energy!)
passivehigh, medium and low
efficiency buildings
on-site generation (PV)
outputs(electricity, gas, light fuel demand,CO2 emissions, PV generation)
heatingcooling
lighting, DHW, refrigeration,ventilation, etc
active
- Heating insulation- Solar gains- Daylighting- Natural Ventilation
- HDD, CDD- Lighting- Hot water- Refrigeration- Ventilation- Plug loads
R&D is considered in lighting
Policy instruments
R&D is considered in PV
8
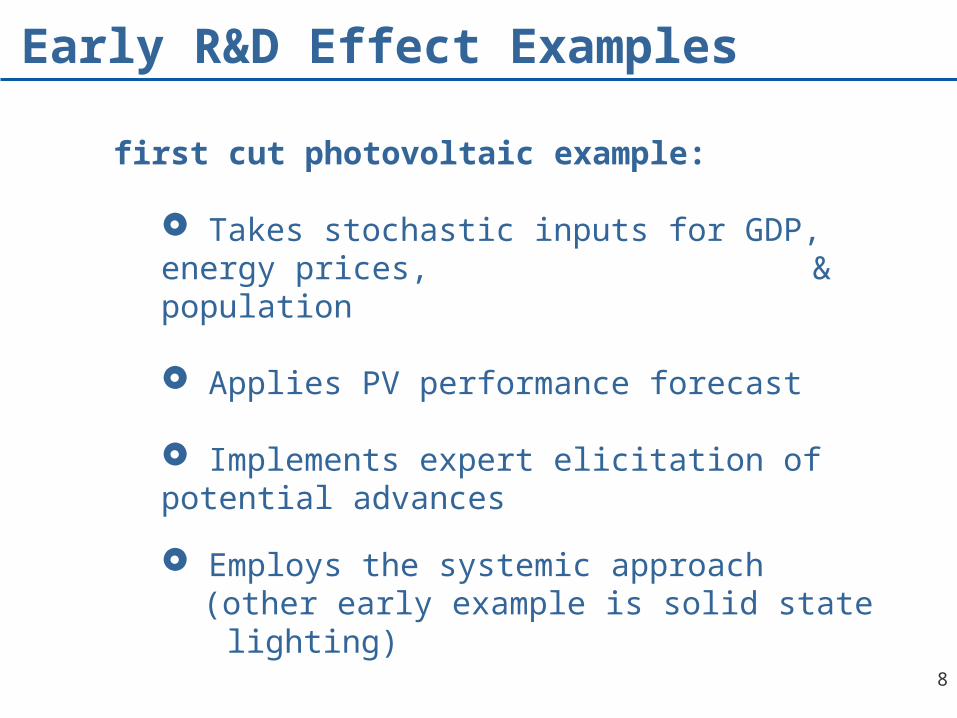
Early R&D Effect Examples
first cut photovoltaic example:
Takes stochastic inputs for GDP, energy prices, & population
Applies PV performance forecast
Implements expert elicitation of potential advances
Employs the systemic approach(other early example is solid state lighting)
9
Data Sources
Historic floorspace input data are based on commercial and residential energy intensity indicators based on Pacific Northwest National Laboratory(PNNL), Energy End-Use Flow Maps for the Buildings Sector, D.B. Belzer, September 2006
The final energy demand data, obtained from PNNL, CBECS, & RECS, as well as the Annual Energy Review (AER) for 2005, for each fuel were divided by the floorspace estimates for 2005 and used for service demand forecasting.
Equipment types were considered for refrigeration, space cooling, space heating, lighting, water heating, and ventilation. All other end-uses were categorized as plug loads. The installed equipment stock information is based on Berkeley Lab’s own calculations derived from appliance manufacturers’ shipments data, CBECS, RECS, McGraw-Hill Corporation’s Analytics and AEO-07 (Annual Energy Outlook 2007)
10
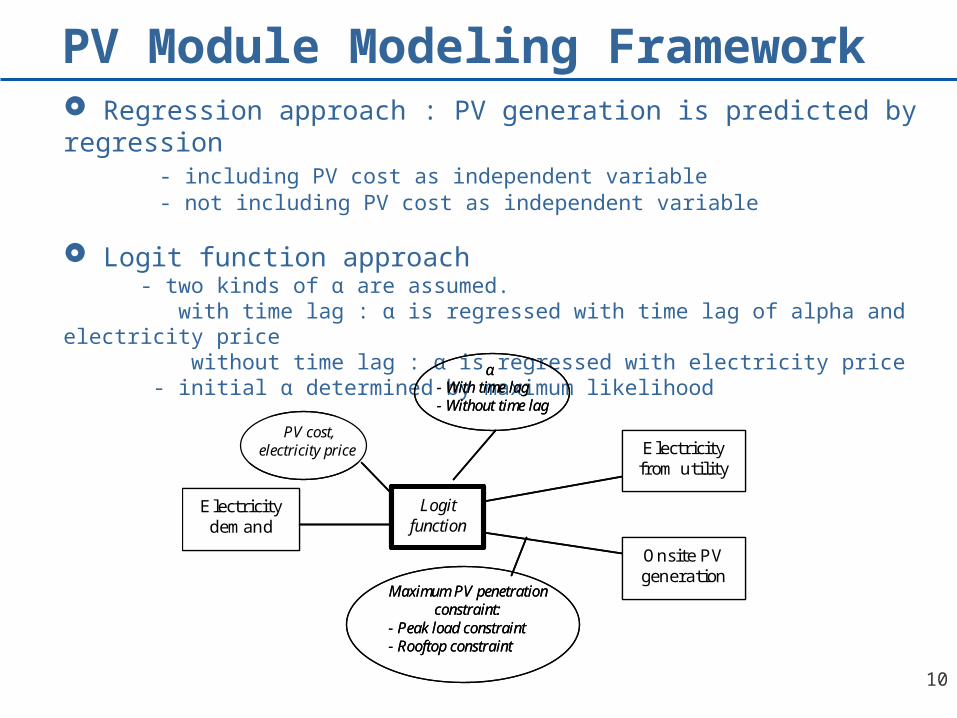
PV Module Modeling Framework Regression approach : PV generation is predicted by regression
- including PV cost as independent variable- not including PV cost as independent variable
Logit function approach - two kinds of α are assumed. with time lag : α is regressed with time lag of alpha and electricity price without time lag : α is regressed with electricity price - initial α determined by maximum likelihood
Electricity demand
Logitfunction
Electricity from utility
Onsite PV generation
PV cost,electricity price
Maximum PV penetration constraint:
- Peak load constraint- Rooftop constraint
α- With time lag- Without time lag
Electricity demand
Logitfunction
Electricity from utility
Onsite PV generation
PV cost,electricity price
Maximum PV penetration constraint:
- Peak load constraint- Rooftop constraint
α- With time lag- Without time lag

11
Expert Forecasts: PV in Commercial Sector
0
2000
4000
6000
8000
0% 20% 40% 60% 80% 100%
Percentile
PV System Cost (US$/kW)
2007
2010(No DOE Fund)
2010(DOE Program)
2020(No DOE Fund)2020(DOE Program)
0.10
0.17
0.24
0% 20% 40% 60% 80% 100%
Percentile
Module Conversion Efficiency (%)
20072010(No DOE Fund)
2010(DOE Program)
2020(No DOE Fund)
2020(DOE Program)
0
10
20
30
40
50
60
70
80
90
0% 20% 40% 60% 80% 100%
Percentile
PV O&M Cost (US$/kW)
2007
2010(No DOE Fund)
2010(DOE Program)
2020(No DOE Fund)
2020(DOE Program)
0
100
200
300
400
500
600
700
800
0% 20% 40% 60% 80% 100%
Percentile
Inverter Replacement Cost (US$/kW)
2007
2010(No DOE Fund)
2010(DOE Program)
2020(No DOE Fund)2020(DOE Program)

Effect on Demand (Commercial)
Total commercial sector electricity demand
Commercial PV generation
(No DOE Funding)
*Logit function approach (with time lag of alpha)*Results are simulated by building module, stand-alone
0
50
100
150
200
250
20
05
20
10
20
20
20
30
20
40
20
50
TWh / year
50th25th10th
75th
90th
percentile
1000
1200
1400
1600
1800
2000
2200
2400
2005
2010
2015
2020
2025
2030
2035
2040
2045
2050
TWh
Electricity Demand (Without PV)
PV (No DOE funding)
PV (With DOE funding)
0.E+00
1.E-11
2.E-11
3.E-11
0 100 200PV Generation in 2050
(TWh)
Probability
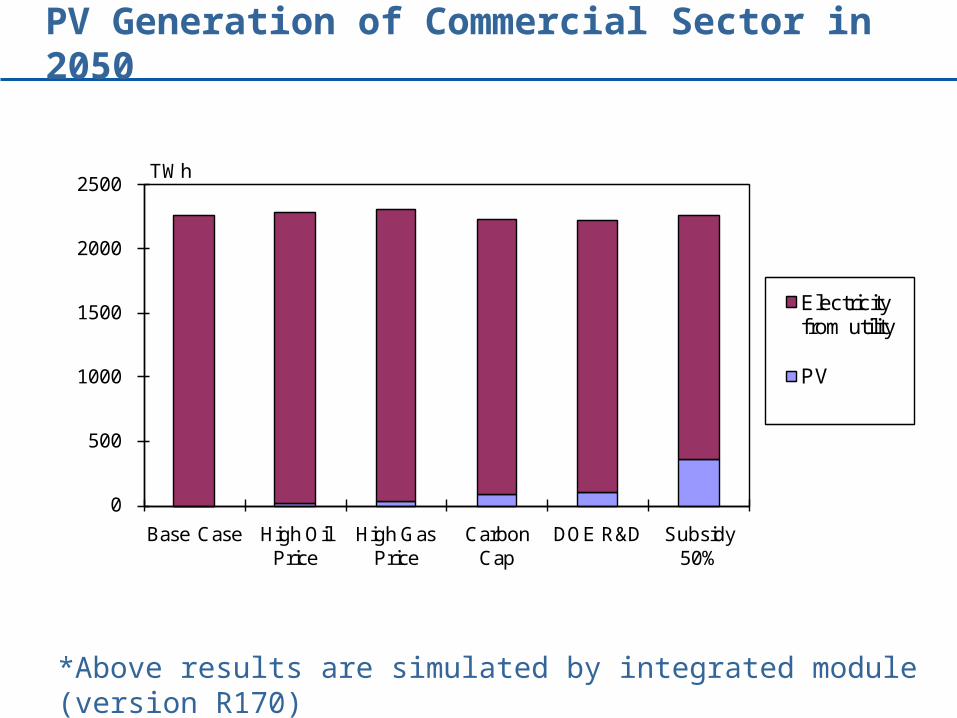
PV Generation of Commercial Sector in 2050
*Above results are simulated by integrated module (version R170)
0
500
1000
1500
2000
2500
Base Case High Oil Price
High Gas Price
Carbon Cap
DOE R&D Subsidy 50%
Electricity from utility
PV
TWh
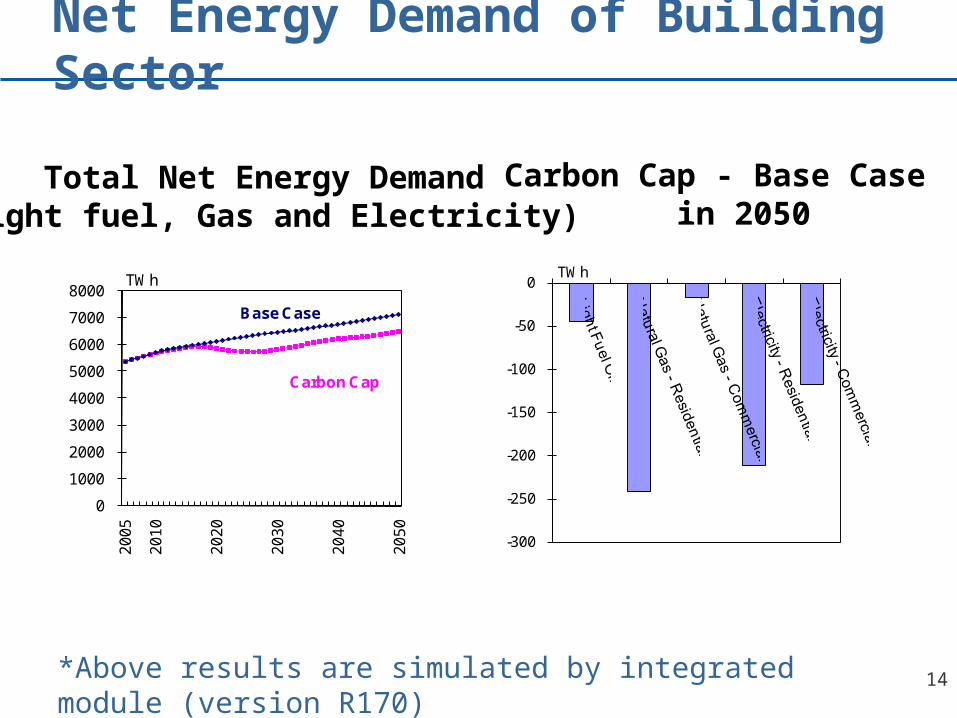
Net Energy Demand of Building Sector
Total Net Energy Demand(Light fuel, Gas and Electricity)
Carbon Cap - Base Case in 2050
*Above results are simulated by integrated module (version R170) 14
0
1000
2000
3000
4000
5000
6000
7000
8000
20
05
20
10
20
20
20
30
20
40
20
50
TWh
Carbon Cap
Base Case
-300
-250
-200
-150
-100
-50
0 TWh

CO2 Emissions of Building Sector
CO2 EmissionsCarbon Cap - Base Case
in 2050
*Above results are simulated by integrated module (version R170) 15
-1400
-1200
-1000
-800
-600
-400
-200
0 Mt-CO2
0
500
1000
1500
2000
2500
3000
3500
20
05
20
10
20
20
20
30
20
40
20
50
Mt-CO2
Carbon Cap
Base Case
16
Future Work
*Regionality
Other passive & active technologies *Windows, heat-pump water heaters, geothermal heat pump, & ……..
Building types
Other on-site generation technologies; CHP …
Logit sophistication

ON TO THE NEXT MODULE
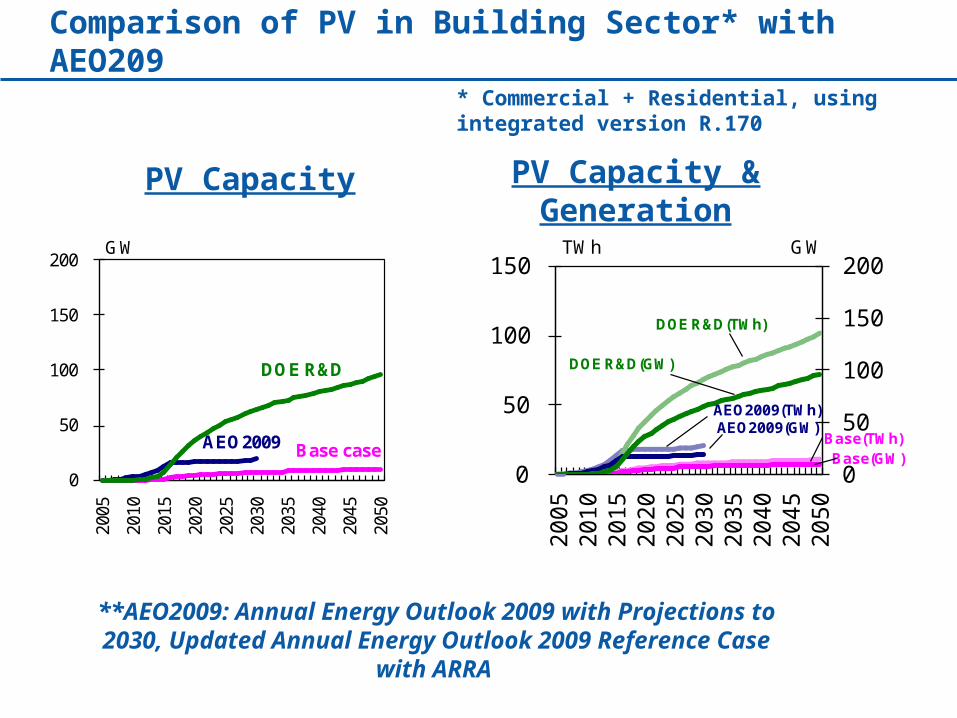
Comparison of PV in Building Sector* with AEO209
* Commercial + Residential, using integrated version R.170
PV Capacity PV Capacity & Generation
**AEO2009: Annual Energy Outlook 2009 with Projections to 2030, Updated Annual Energy Outlook 2009 Reference Case
with ARRA
0
50
100
150
200
2005
2010
2015
2020
2025
2030
2035
2040
2045
2050
GW
AEO2009
DOE R&D
Base case
0
50
100
150
200
0
50
100
150
20
05
20
10
20
15
20
20
20
25
20
30
20
35
20
40
20
45
20
50
GW
DOE R&D(GW)
DOE R&D(TWh)
TWh
AEO2009(TWh)AEO2009(GW)
Base(TWh)Base(GW)

Sensitivity Analysis
Base case: No carbon regulation, no forcing of prices, no DOE funding, R&D improvements
High oil price scenario: $100/bbl in 2005, ramps linearly to $500/bbl by 2030, and stays at $500/bbl for rest
of simulation
High natural gas price: $8/MMBtu in 2005, ramps linearly to $50/MMBtu by 2030, and stays at $50/MMBtu
for rest of simulation
Carbon cap: Starts at 5902 million metric tCO2/yr in 2010, ramps linearly down to 4000 million
metric tCO2/yr by 2035 (roughly 80% of 1990 levels), and stays at 4000 million metric tCO2/yr for rest of simulation.
DOE R&D program: Implement improvements associated with target-level funding for technologies that
have program goals.
Subsidy 50%: 50% of PV cost is subsidized.
20
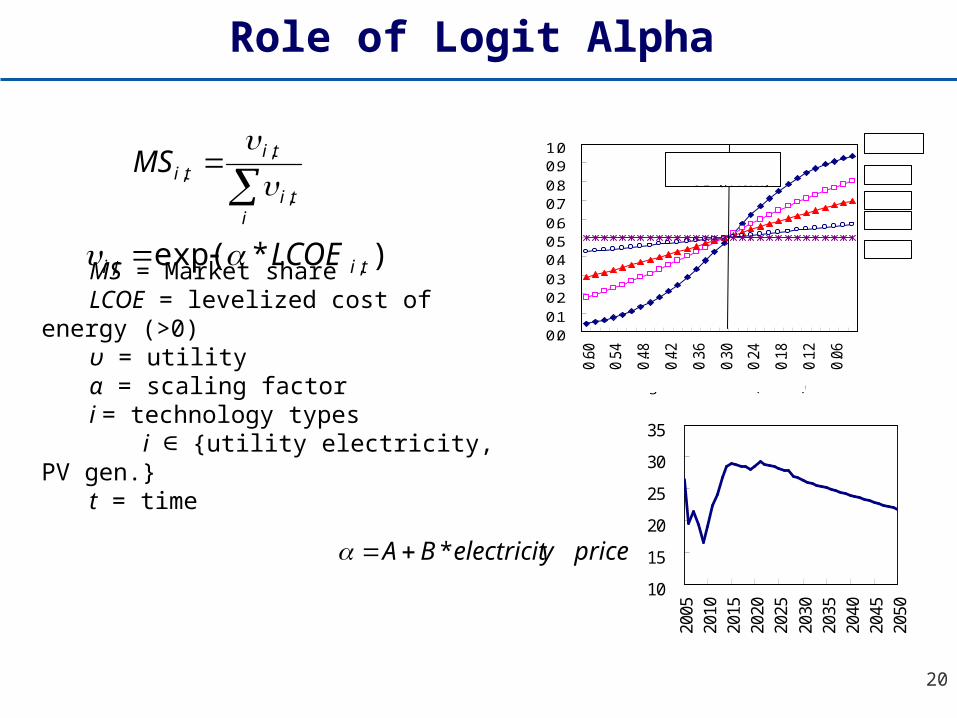
)*exp( ,, titi LCOE
iti
titiMS
,
,,
MS = Market shareLCOE = levelized cost of energy (>0)υ = utilityα = scaling factori = technology types i {utility electricity, PV gen.}∈t = time
10
15
20
25
30
35
2005
2010
2015
2020
2025
2030
2035
2040
2045
2050
0.00.10.20.30.40.50.60.70.80.91.0
0.60
0.54
0.48
0.42
0.36
0.30
0.24
0.18
0.12
0.06
PV generation cost ($/ kWh)
Shareα = 10
α = 5
α = 3
α = 1
α = 0
Electricity price= 0.3 ($/ kWh)
priceyelectricitBA *
Role of Logit Alpha
21
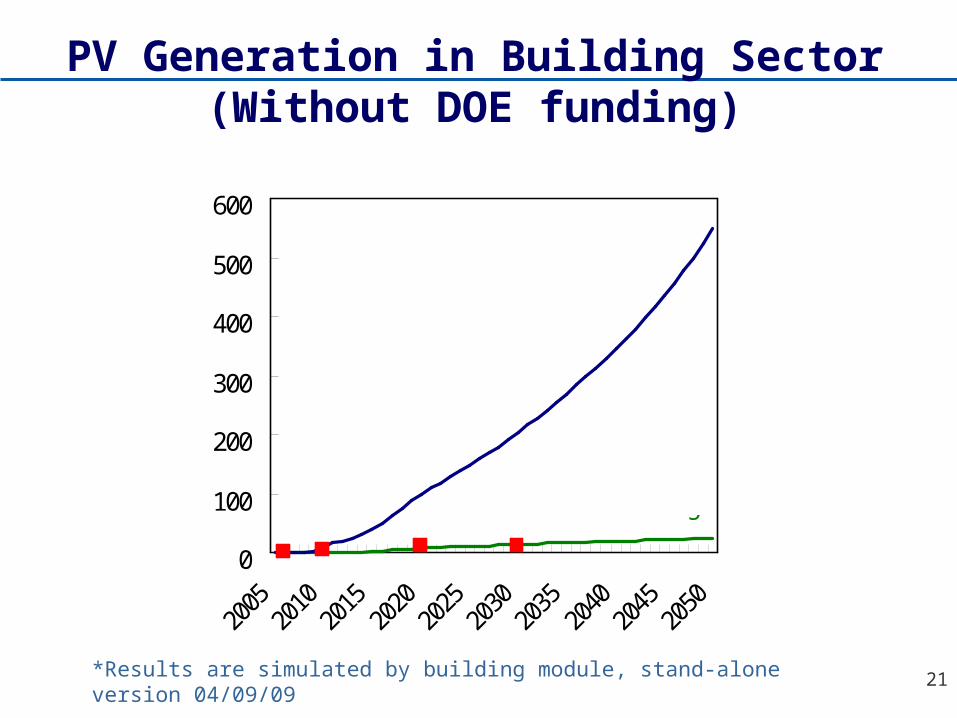
PV Generation in Building Sector(Without DOE funding)
0
100
200
300
400
500
600
2005
2010
2015
2020
2025
2030
2035
2040
2045
2050
TWh
AEO2009
"Without Time Lag"
"With Time Lag"
*Results are simulated by building module, stand-alone version 04/09/09
22
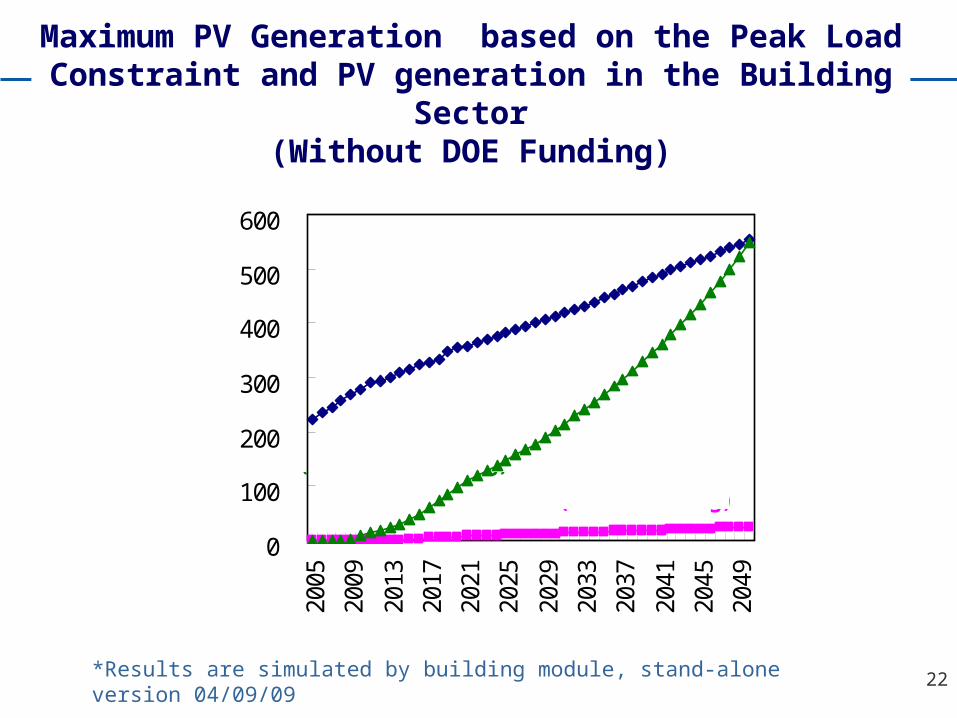
Maximum PV Generation based on the Peak Load Constraint and PV generation in the Building Sector
(Without DOE Funding)
0
100
200
300
400
500
600
2005
2009
2013
2017
2021
2025
2029
2033
2037
2041
2045
2049
TWh
Maximum PV generation based on thePeak Load Constraint
PV generation(Without Time Lag) PV generation
(With Time Lag)
*Results are simulated by building module, stand-alone version 04/09/09

23
PV Generation in the Building Sector under DOE Funding Scenario
(Alpha is Subject to “With Time Lag”)
0
100
200
300
400
500
600
2005
2010
2015
2020
2025
2030
2035
2040
2045
2050
TWh
AEO2009"Without DOEFunding"
Maximum PV Generation
"With DOEFunding"
*Results are simulated by building module, stand-alone version 04/09/09
24
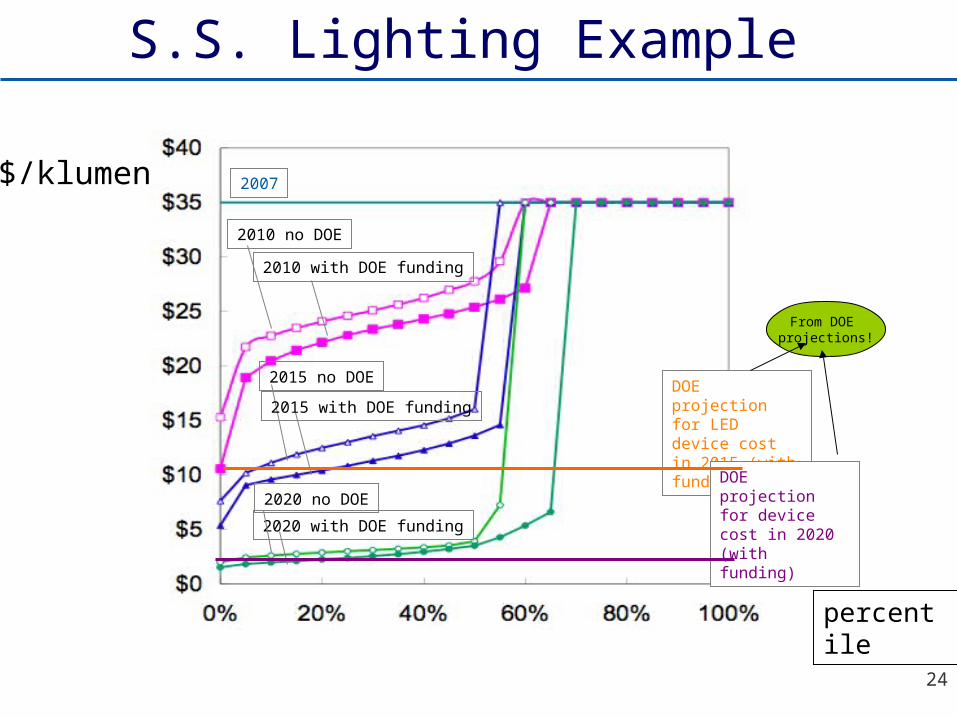
From DOE projections!
2007
2010 no DOE
2015 no DOE
2020 no DOE
2020 with DOE funding
DOE projection for LED device cost in 2015 (with funding)
DOE projection for device cost in 2020 (with funding)
$/klumen
2010 with DOE funding
2015 with DOE funding
percentile
S.S. Lighting Example

25
SSL Efficacy
2020 with DOE funding
DOE’s 2007 estimate for LED luminaire efficacy
DOE’s 2012 projection for luminaire efficacy (with funding)2020 no DOE funding
DOE’s 2010 projection for LED luminaire efficacy
DOE’s 2015 projection for luminaire efficacy (with funding)
2626
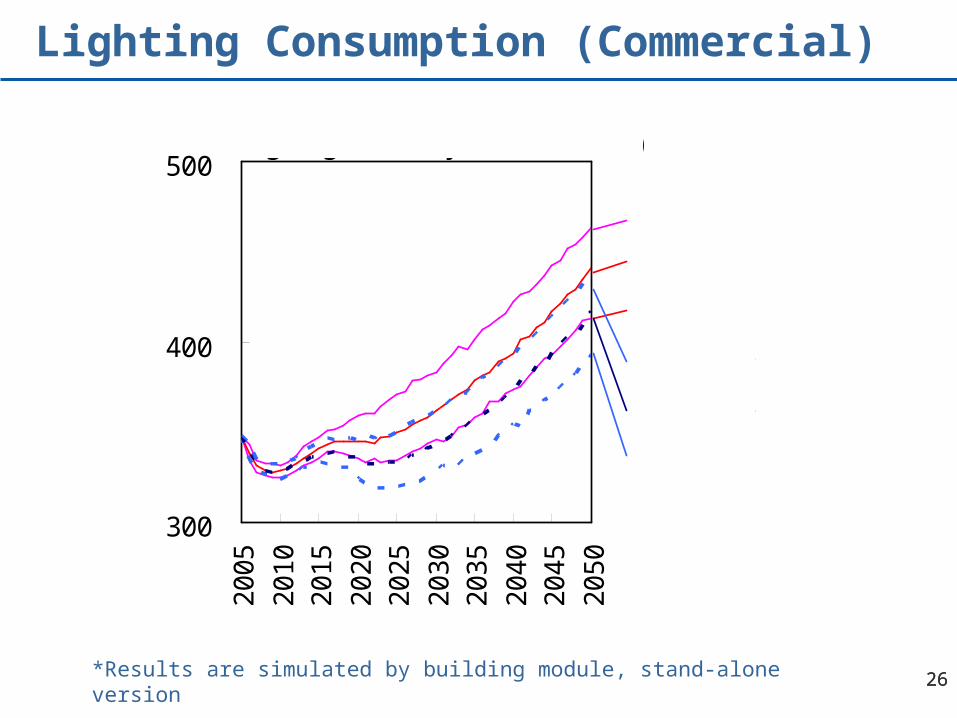
Lighting Consumption (Commercial)
300
400
500
20
05
20
10
20
15
20
20
20
25
20
30
20
35
20
40
20
45
20
50
Lighting electricity demand (TWh)
50th percentilew ithout DOE R&D
95th percentilew ithout DOE R&D
5th percentilew ithout DOE R&D
50th percentilew ith DOE R&D
95th percentilew ith DOE R&D
5th percentilew ith DOE R&D
*Results are simulated by building module, stand-alone version
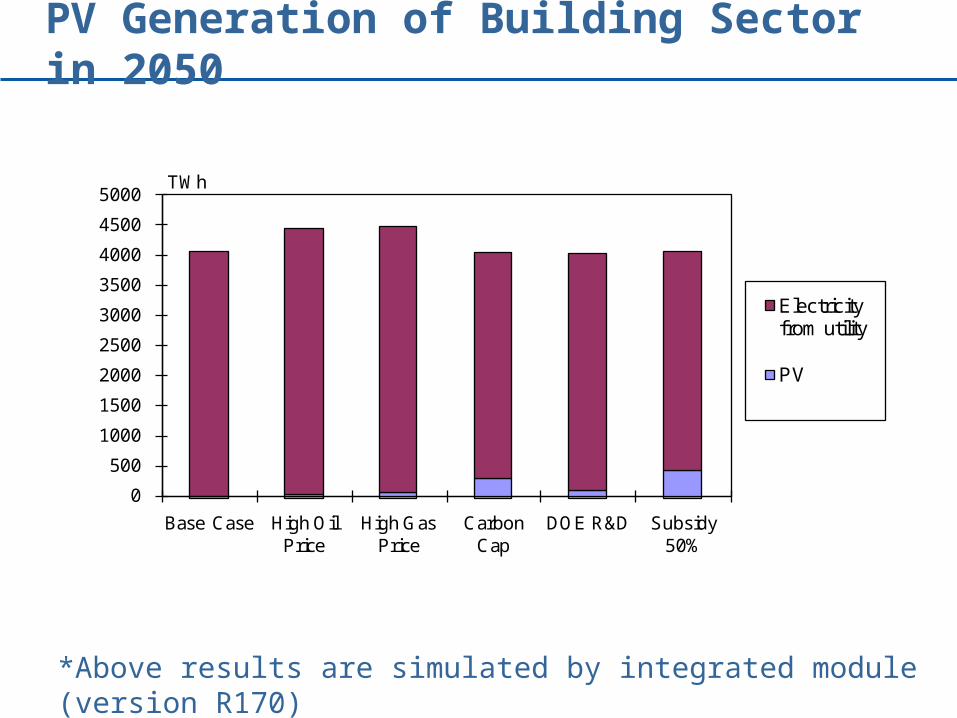
PV Generation of Building Sector in 2050
*Above results are simulated by integrated module (version R170)
0
500
1000
1500
2000
2500
3000
3500
4000
4500
5000
Base Case High Oil Price
High Gas Price
Carbon Cap
DOE R&D Subsidy 50%
Electricity from utility
PV
TWh

28
Buildings Module Logic Flowinputs
(GDP, population, fuel prices etc.)
floorspace forecast
service demand forecast(not energy!)
passivehigh, medium and low
efficiency buildings
on-site generation (PV)
outputs(electricity, gas, light fuel demand,CO2 emissions, PV generation)
heatingcooling
lighting, DHW, refrigeration,ventilation, etc
active
- Heating insulation- Solar gains- Daylighting- Natural Ventilation
- HDD, CDD- Lighting- Hot water- Refrigeration- Ventilation- Plug loads
R&D is considered in lighting
Policy instruments
R&D is considered in PV
Top Related