


Languages
Pages
Legal


6‐1
Index
6.1 Water Availability Overview ........... p. 6‐1 6.2 Methodology to Evaluate Surface
Water Supply Availability ............... p. 6‐1 6.3 Water Availability ........................... p. 6‐2
Section 6
Water Availability
6.1 Water Availability Overview Justice Gregory J. Hobbs of the Colorado Supreme Court has stated "The 21st Century is the era
of limits made applicable to water decisionmaking. Due to natural western water scarcity, we
are no longer developing a resource. Instead, we are learning how to share a developed
resource." These words of wisdom should serve as guidance for all parties interested in
Colorado water. The amount of water available for use within the state is finite.
The Statewide Water Supply Initiative (SWSI) 2010 analyzes Colorado's water availability based
on recent work by the Colorado Water Conservation Board (CWCB) and the basin roundtables.
SWSI 2010 finds that unappropriated water in the South Platte, Arkansas, and Rio Grande
Basins is extremely limited, and reliance on nonrenewable, nontributary groundwater as a
permanent water supply creates reliability and sustainability concerns, particularly along the
Front Range. It also finds that Colorado River compact entitlements are not fully utilized and
that water in the Colorado River system may be available to meet future needs. However, in
order to develop new water supplies in the Colorado River system, projects and methods will be
needed to manage the risks of additional development.
6.2 Methodology to Evaluate Surface Water Supply Availability This section provides a summary of statewide surface water and groundwater availability. This
update summarizes work to‐date completed by the CWCB and the basin roundtables through
the development of their basinwide water needs assessments. A comprehensive analysis of
water availability for each basin was completed in SWSI 1 (CWCB 2004) and is only partially
updated. Future SWSI updates will provide updated water availability analysis in each basin
based on additional Colorado Decision Support System (CDSS) modeling tools.
In addition to the analysis of water availability in SWSI 1, the SWSI 2010 update specifically
includes an updated analysis for the basins within the Colorado River system as part of the
CWCB's Colorado River Water Availability
Study (CRWAS), which is summarized here.
Updated information is also included for the
South Platte Basin based on results of analysis
directly associated with the South Platte Basin
Roundtable Task Order (CWCB 2009b).
Section 6 Water Availability
6‐2
In another effort related to water availability, statewide drought planning has occurred through the
preparation and implementation of the Colorado Drought Mitigation and Response Plan (DMRP) (CWCB
and Department of Natural Resources 2010). In 2010, the CWCB conducted a comprehensive revision of
the DMRP. The updated plan provides a blueprint for how the state will monitor, mitigate, and respond
to drought.
The potential effects of climate change are quantified in the CRWAS, and provided at various locations
throughout the Colorado River basins. Reliable climate change analyses are not yet available for the other
basins and are not included in this update.
6.3 Water Availability The purpose of this section is to summarize the available data and studies indicating the level of water
availability in each basin and the location of opportunities for further new water supply development.
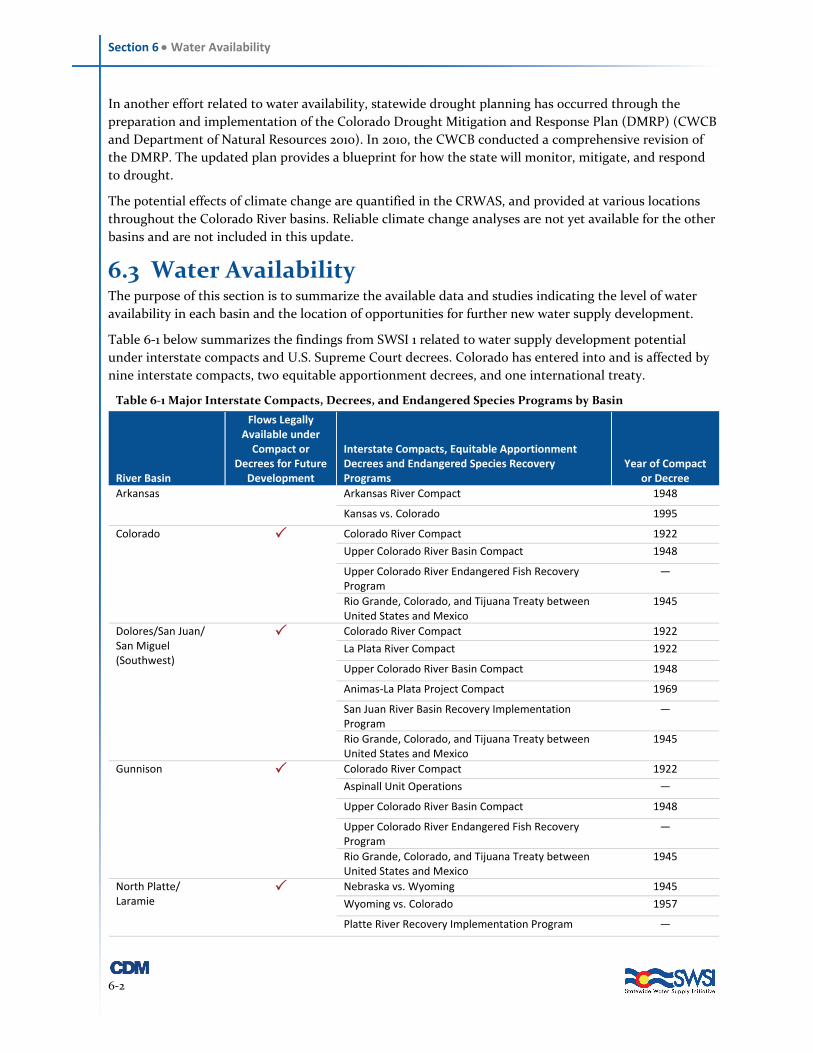
Table 6‐1 below summarizes the findings from SWSI 1 related to water supply development potential
under interstate compacts and U.S. Supreme Court decrees. Colorado has entered into and is affected by
nine interstate compacts, two equitable apportionment decrees, and one international treaty.
Table 6‐1 Major Interstate Compacts, Decrees, and Endangered Species Programs by Basin
River Basin
Flows Legally Available under Compact or
Decrees for Future Development
Interstate Compacts, Equitable Apportionment Decrees and Endangered Species Recovery Programs
Year of Compact or Decree
Arkansas Arkansas River Compact 1948
Kansas vs. Colorado 1995
Colorado Colorado River Compact 1922
Upper Colorado River Basin Compact 1948
Upper Colorado River Endangered Fish Recovery Program
—
Rio Grande, Colorado, and Tijuana Treaty between United States and Mexico
1945
Dolores/San Juan/ San Miguel (Southwest)
Colorado River Compact 1922
La Plata River Compact 1922
Upper Colorado River Basin Compact 1948
Animas‐La Plata Project Compact 1969
San Juan River Basin Recovery Implementation Program
—
Rio Grande, Colorado, and Tijuana Treaty between United States and Mexico
1945
Gunnison Colorado River Compact 1922
Aspinall Unit Operations —
Upper Colorado River Basin Compact 1948
Upper Colorado River Endangered Fish Recovery Program
—
Rio Grande, Colorado, and Tijuana Treaty between United States and Mexico
1945
North Platte/ Laramie
Nebraska vs. Wyoming 1945
Wyoming vs. Colorado 1957
Platte River Recovery Implementation Program —
Section 6 Water Availability
6‐3
Table 6‐1 Major Interstate Compacts, Decrees, and Endangered Species Programs by Basin, continued
River Basin
Flows Legally Available under Compact or
Decrees for Future Development
Interstate Compacts, Equitable Apportionment Decrees and Endangered Species Recovery Programs
Year of Compact or Decree
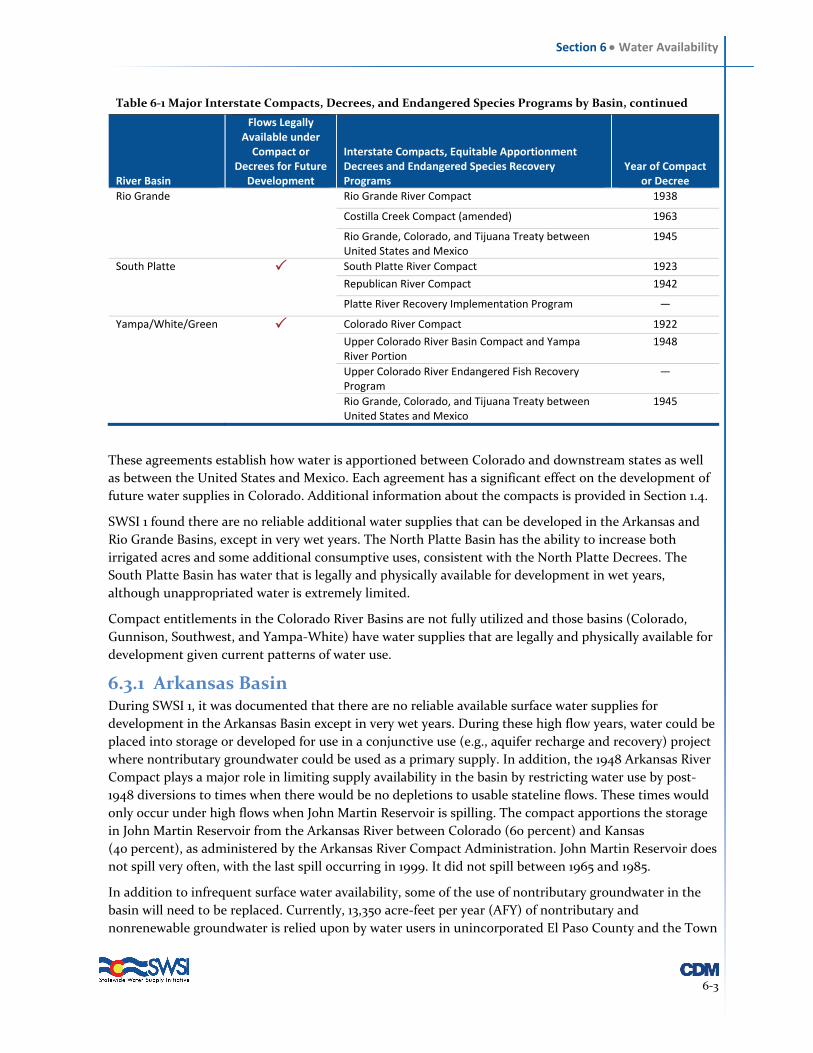
Rio Grande Rio Grande River Compact 1938
Costilla Creek Compact (amended) 1963
Rio Grande, Colorado, and Tijuana Treaty between United States and Mexico
1945
South Platte South Platte River Compact 1923
Republican River Compact 1942
Platte River Recovery Implementation Program —
Yampa/White/Green Colorado River Compact 1922
Upper Colorado River Basin Compact and Yampa River Portion
1948
Upper Colorado River Endangered Fish Recovery Program
—
Rio Grande, Colorado, and Tijuana Treaty between United States and Mexico
1945
These agreements establish how water is apportioned between Colorado and downstream states as well
as between the United States and Mexico. Each agreement has a significant effect on the development of
future water supplies in Colorado. Additional information about the compacts is provided in Section 1.4.
SWSI 1 found there are no reliable additional water supplies that can be developed in the Arkansas and
Rio Grande Basins, except in very wet years. The North Platte Basin has the ability to increase both
irrigated acres and some additional consumptive uses, consistent with the North Platte Decrees. The
South Platte Basin has water that is legally and physically available for development in wet years,
although unappropriated water is extremely limited.
Compact entitlements in the Colorado River Basins are not fully utilized and those basins (Colorado,
Gunnison, Southwest, and Yampa‐White) have water supplies that are legally and physically available for
development given current patterns of water use.
6.3.1 Arkansas Basin During SWSI 1, it was documented that there are no reliable available surface water supplies for
development in the Arkansas Basin except in very wet years. During these high flow years, water could be
placed into storage or developed for use in a conjunctive use (e.g., aquifer recharge and recovery) project
where nontributary groundwater could be used as a primary supply. In addition, the 1948 Arkansas River
Compact plays a major role in limiting supply availability in the basin by restricting water use by post‐
1948 diversions to times when there would be no depletions to usable stateline flows. These times would
only occur under high flows when John Martin Reservoir is spilling. The compact apportions the storage
in John Martin Reservoir from the Arkansas River between Colorado (60 percent) and Kansas
(40 percent), as administered by the Arkansas River Compact Administration. John Martin Reservoir does
not spill very often, with the last spill occurring in 1999. It did not spill between 1965 and 1985.
In addition to infrequent surface water availability, some of the use of nontributary groundwater in the
basin will need to be replaced. Currently, 13,350 acre‐feet per year (AFY) of nontributary and
nonrenewable groundwater is relied upon by water users in unincorporated El Paso County and the Town

Section 6 Water Availability
6‐4
of Monument (Arkansas Basin Consumptive Use Water Needs Assessment: 2030, CWCB 2008). The
Arkansas Basin Roundtable identified that this 13,350 AFY of nontributary groundwater will need to be
replaced. This replacement of nontributary groundwater was accounted for and discussed in Section 5 of
this report in the municipal and industrial (M&I) gap section.
Unappropriated water in the Arkansas Basin is extremely limited.
6.3.2 Colorado, Gunnison, Southwest, and Yampa‐White Basins CWCB's CRWAS analyzed water availability in the Colorado River Basins.
Upon completion of the CRWAS Phase 1 study, an addendum to the SWSI
2010 report will be developed summarizing the results of the study for
these basins.
The CRWAS Phase 1 Study is comprised of four interrelated components or
steps (CWCB 2010b):
1. Update and expand the state's water availability computer simulation
tools based on input solicited from water users (consumptive and nonconsumptive) through the
basin roundtables, the Interbasin Compact Committee, and other public forums.
2. Assess potential water availability using records of historical water supplies.
3. Use scientific analyses and datasets previously developed by others to estimate streamflows over the
past several hundred years, which was done using annual growth of trees (especially as an indicator
of transitions between wet and dry years and as an indicator of the potential lengths of dry and wet
periods). This extended natural flow hydrology was used to assess remaining water availability as if
today's water uses existed throughout the extended period.
4. Superimpose the effects of potential changes in precipitation and temperature from previously
developed global climate models (GCMs, also known as General Circulation Models) to reflect
hydrologic conditions that may exist in 2040 and 2070 if the greenhouse gas emissions occur as
postulated in the various scenarios ("storylines") simulated by the GCMs.
CRWAS compared future supply and current demand to determine whether there is enough water to
meet either current demands based on the "supply‐and‐demand equation:"
Future Supply – Current Demand = Water Available for Future Consumptive Use
CRWAS Phase 1 held the demand side of the water availability equation constant at current levels
(adjusted for changes in irrigation water requirements) and considered three different conditions for the
water supply side of the equation as follows.
6.3.2.1 Historical Hydrology
Traditionally, water supply agencies use recorded historical information on water supply as an indication
of likely future conditions; the premise being that history tends to
repeat itself. Many agencies in Colorado used streamflow records
dating back to at least 1950 so they could consider the impacts of the
1950s multi‐year drought on the reliability of their systems. CWCB
developed natural flow hydrology back to 1909 in the Colorado River
Basin in Colorado, but this required filling missing records or
records for discontinued stream and weather gages with
scientifically estimated values. For the purposes of CRWAS, a 56‐year study period is used to represent
historical hydrology (1950 through 2005). This period includes both very wet and very dry years, contains
Historical hydrologic conditions
are characterized by the record
of natural flows at hundreds of
points throughout the basin
Gunnison River
Section 6 Water Availability
6‐5
the most reliable historical data upon which to base comparisons of the effects of climate change, and
uses information that Colorado River stakeholders can relate to through their own experiences. Historical
hydrologic conditions are characterized by the record of natural flows at hundreds of points throughout
the basin; basin‐scale record of precipitation, temperature, and wind disaggregated to thousands of cells
in a rectangular grid covering the entire Colorado River Basin; and a record of local weather recorded at
54 weather stations within Colorado.
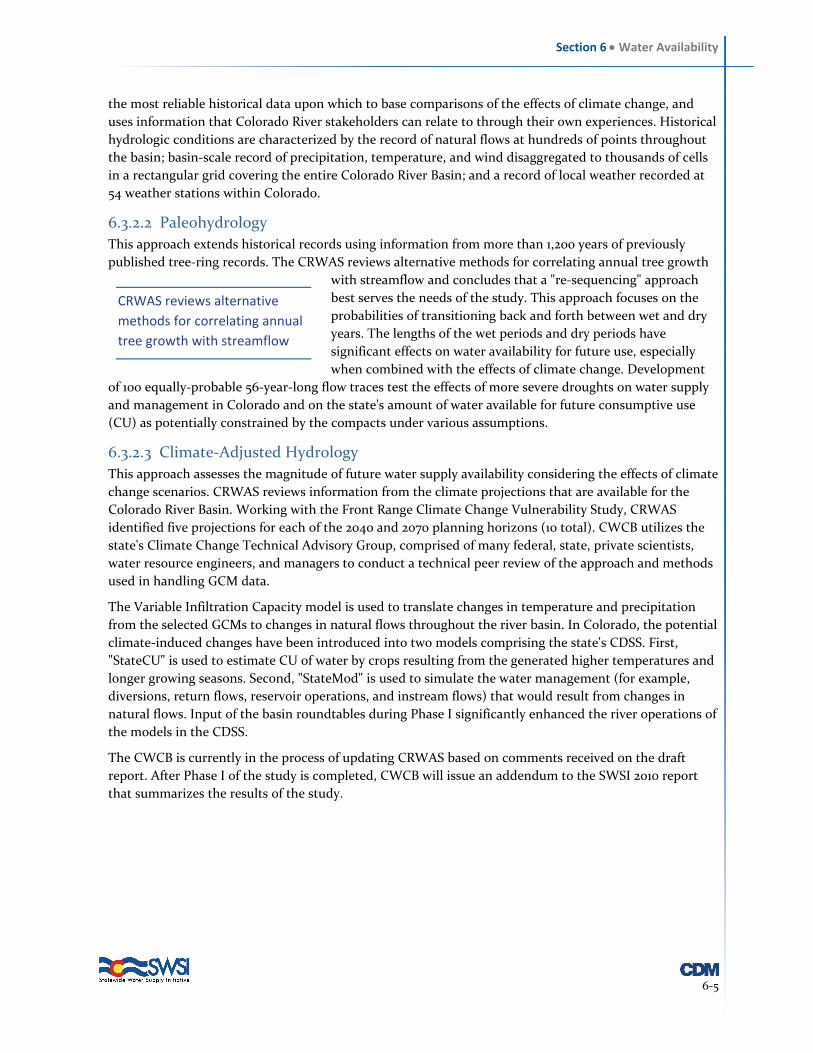
6.3.2.2 Paleohydrology This approach extends historical records using information from more than 1,200 years of previously
published tree‐ring records. The CRWAS reviews alternative methods for correlating annual tree growth
with streamflow and concludes that a "re‐sequencing" approach
best serves the needs of the study. This approach focuses on the
probabilities of transitioning back and forth between wet and dry
years. The lengths of the wet periods and dry periods have
significant effects on water availability for future use, especially
when combined with the effects of climate change. Development
of 100 equally‐probable 56‐year‐long flow traces test the effects of more severe droughts on water supply
and management in Colorado and on the state's amount of water available for future consumptive use
(CU) as potentially constrained by the compacts under various assumptions.
6.3.2.3 Climate‐Adjusted Hydrology
This approach assesses the magnitude of future water supply availability considering the effects of climate
change scenarios. CRWAS reviews information from the climate projections that are available for the
Colorado River Basin. Working with the Front Range Climate Change Vulnerability Study, CRWAS
identified five projections for each of the 2040 and 2070 planning horizons (10 total). CWCB utilizes the
state's Climate Change Technical Advisory Group, comprised of many federal, state, private scientists,
water resource engineers, and managers to conduct a technical peer review of the approach and methods
used in handling GCM data.
The Variable Infiltration Capacity model is used to translate changes in temperature and precipitation
from the selected GCMs to changes in natural flows throughout the river basin. In Colorado, the potential
climate‐induced changes have been introduced into two models comprising the state's CDSS. First,
"StateCU" is used to estimate CU of water by crops resulting from the generated higher temperatures and
longer growing seasons. Second, "StateMod" is used to simulate the water management (for example,
diversions, return flows, reservoir operations, and instream flows) that would result from changes in
natural flows. Input of the basin roundtables during Phase I significantly enhanced the river operations of
the models in the CDSS.
The CWCB is currently in the process of updating CRWAS based on comments received on the draft
report. After Phase I of the study is completed, CWCB will issue an addendum to the SWSI 2010 report
that summarizes the results of the study.
CRWAS reviews alternative
methods for correlating annual
tree growth with streamflow
Section 6 Water Availability
6‐6
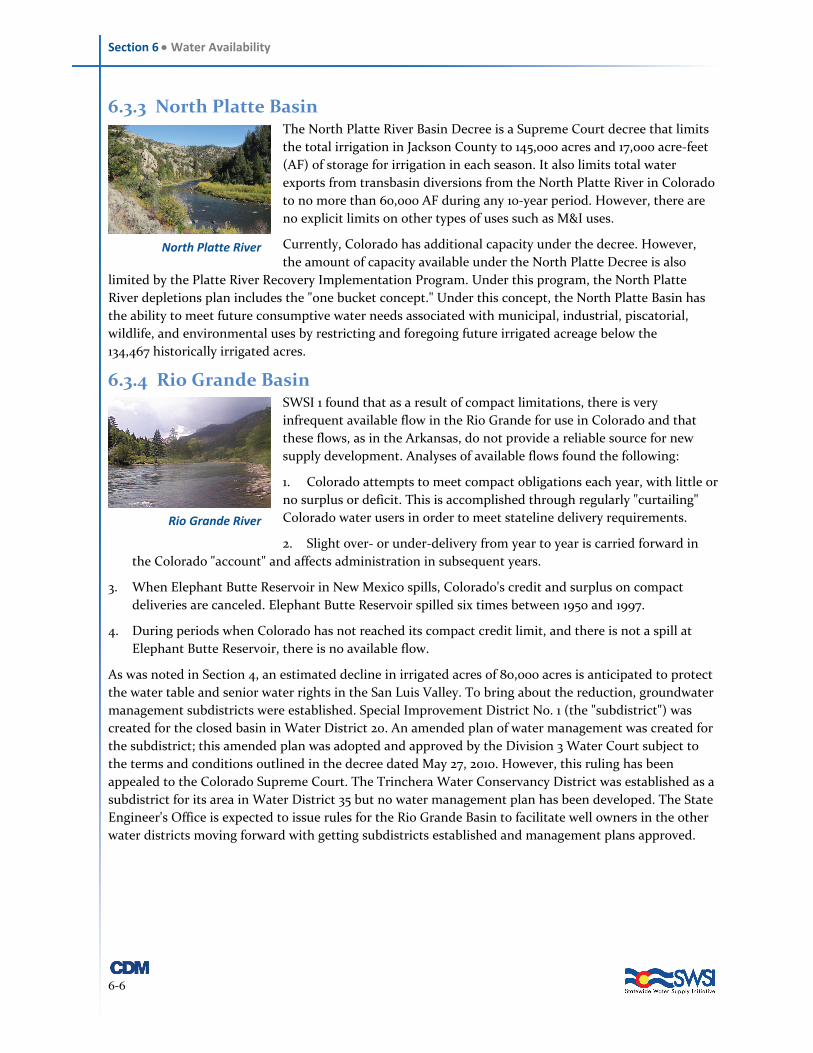
6.3.3 North Platte Basin The North Platte River Basin Decree is a Supreme Court decree that limits
the total irrigation in Jackson County to 145,000 acres and 17,000 acre‐feet
(AF) of storage for irrigation in each season. It also limits total water
exports from transbasin diversions from the North Platte River in Colorado
to no more than 60,000 AF during any 10‐year period. However, there are
no explicit limits on other types of uses such as M&I uses.
Currently, Colorado has additional capacity under the decree. However,
the amount of capacity available under the North Platte Decree is also
limited by the Platte River Recovery Implementation Program. Under this program, the North Platte
River depletions plan includes the "one bucket concept." Under this concept, the North Platte Basin has
the ability to meet future consumptive water needs associated with municipal, industrial, piscatorial,
wildlife, and environmental uses by restricting and foregoing future irrigated acreage below the
134,467 historically irrigated acres.
6.3.4 Rio Grande Basin SWSI 1 found that as a result of compact limitations, there is very
infrequent available flow in the Rio Grande for use in Colorado and that
these flows, as in the Arkansas, do not provide a reliable source for new
supply development. Analyses of available flows found the following:
1. Colorado attempts to meet compact obligations each year, with little or
no surplus or deficit. This is accomplished through regularly "curtailing"
Colorado water users in order to meet stateline delivery requirements.
2. Slight over‐ or under‐delivery from year to year is carried forward in
the Colorado "account" and affects administration in subsequent years.
3. When Elephant Butte Reservoir in New Mexico spills, Colorado's credit and surplus on compact
deliveries are canceled. Elephant Butte Reservoir spilled six times between 1950 and 1997.
4. During periods when Colorado has not reached its compact credit limit, and there is not a spill at
Elephant Butte Reservoir, there is no available flow.
As was noted in Section 4, an estimated decline in irrigated acres of 80,000 acres is anticipated to protect
the water table and senior water rights in the San Luis Valley. To bring about the reduction, groundwater
management subdistricts were established. Special Improvement District No. 1 (the "subdistrict") was
created for the closed basin in Water District 20. An amended plan of water management was created for
the subdistrict; this amended plan was adopted and approved by the Division 3 Water Court subject to
the terms and conditions outlined in the decree dated May 27, 2010. However, this ruling has been
appealed to the Colorado Supreme Court. The Trinchera Water Conservancy District was established as a
subdistrict for its area in Water District 35 but no water management plan has been developed. The State
Engineer's Office is expected to issue rules for the Rio Grande Basin to facilitate well owners in the other
water districts moving forward with getting subdistricts established and management plans approved.
North Platte River
Rio Grande River

Section 6 Water Availability
6‐7
6.3.5 South Platte Basin As part of its needs assessment, the South Platte Basin Roundtable
conducted additional water availability analysis that built upon the SWSI 1
findings. Several water allocation models have been developed to
determine legally‐available flow at various points throughout the basin.
The state of Colorado through the CWCB and the Division of Water
Resources is currently developing surface and groundwater models for the
South Platte Basin through the South Platte Decision Support System
(SPDSS). Since the SPDSS models are not yet completed, older results from
Denver Water's model, PACSM, the Northern Integrated Supply Project
(NISP) study, and the Lower South Platte River Water Management and Storage Sites Reconnaissance
Study (LSPWMSSR) were used to illustrate legally available supplies. These studies use different period of
records (PORs), have varying assumptions of the development of existing conditional storage rights, do
not reflect the recent change in river administration, and are not directly comparable. However, they are
used for illustrative purposes to show limited availability in the Metro and South Platte Basin. Table 6‐2
shows the POR, model, minimum, median, average, and maximum available flows. Figure 6‐1 shows the
location and median amount of legally‐available water based on the various models. As noted, there are
varying assumptions incorporated into these models and many may not reflect current river
administrative practices; therefore, these results should be viewed as illustrative, pending more detailed
results. Recent Denver PACSM results for availability at the Henderson and Kersey gages were not
available and are not shown in the table or graph.
Table 6‐2 South Platte Basin Water Allocation Models Summary
Gage Location Model
POR (Water Year)
Min (AF)
Median (AF)
Average (AF)
Max (AF)
Near South Platte
PACSM 1950‐1980 0 2,000 30,452 235,000
Chatfield PACSM 1950‐1980 0 2,000 36,000 289,000
Henderson1 PACSM 1950‐1980 0 155,000 196,300 559,000
Kersey1 NISP 1950‐2001 0 162,100 305,500 1,672,500
Sedgwick LSPWMSSR 1944‐1998 0 70,800 198,000 1,722,500 1 Values for Henderson and Kersey are best available estimates pending updated Denver PACSM results
South Platte River

Section 6 Water Availability
6‐8
Figure 6‐1 Estimated Median Amount of Available Flows in South Platte Basin Based on Various Models
Results from water allocation models can be used to generate firm yield to storage curves (yield curves).
The yield curve uses water availability data to determine how much storage is needed to reliably yield a
given amount of water assuming no monthly shortages. Figure 6‐2 shows the yield curve for the South
Platte River at Chatfield Reservoir. The curve shows storage to yield ratios of approximately 10:1 up to
about 4,000 AFY of firm yield. Additional firm yield would require significant additional volumes of
storage. For example, 10,000 AFY of firm yield at this location would require nearly 325,000 AF of storage.
This may not meet the needs for some users of firm supplies. However, it constitutes a valuable
opportunity for users in the southern portions of the Metro Basin that may be able to capture average
yields in greater amounts than the firm yields to offset groundwater pumping.

Section 6 Water Availability
6‐9
Based on the analyses conducted by the South Platte Basin Roundtable, it was concluded that beyond the
implementation of the basin's identified projects and processes, there is little to no unappropriated water
remaining in the Metro and South Platte Basins that can produce a firm yield in the upper and lower
portions of the South Platte River Basin. A large amount of storage would be required to obtain firm yield
from storage in extremely wet years where water may be available for appropriation. This water would
have to be carried over in storage over multiple dry years with annual evaporation and seepage losses.
In addition to limited surface water availability, some of the nontributary groundwater supplies in the
South Metro area need to be replaced. As was discussed in Section 5 of this report, the Metro Basin
Roundtable anticipates that 20,850 AFY of nontributary groundwater will need to be replaced in the
South Metro area.
Figure 6‐2 Yield Curve, South Platte River below Chatfield
0
2,000
4,000
6,000
8,000
10,000
12,000
0 50,000 100,000 150,000 200,000 250,000 300,000 350,000
Total Storage (AF)
Fir
m Y
ield
(A
FY
)
Average Annual Available Flow = 37,000 AFYMinimum Annual Available Flow = 0 AFY
Maximum Annual Available Flow = 278,000 AFY
Section 6 Water Availability
6‐10
THIS PAGE INTENTIONALLY LEFT BLANK
Top Related