


Languages
Pages
Legal


5/2/14, 10:34 PMSection 5.1 HW
Page 1 of 26http://www.webassign.net/web/Student/Assignment-Responses/last?dep=8337857
Current Score : 82 / 83 Due : Thursday, April 24 2014 11:59 PM EDT
Section 5.1 HW (Homework)Frances CoronelMAT 151 Calculus I, Spring 2014, section 01, Spring 2014Instructor: Ira Walker
WebAssign
The due date for this assignment is past. Your work can be viewed below, but no changes can be made.
Important! Before you view the answer key, decide whether or not you plan to request an extension. Your Instructor may not grant you an extensionif you have viewed the answer key. Automatic extensions are not granted if you have viewed the answer key.
View Key

5/2/14, 10:34 PMSection 5.1 HW
Page 2 of 26http://www.webassign.net/web/Student/Assignment-Responses/last?dep=8337857
1. 6/6 points | Previous Answers SCalcET7 5.1.002.
Consider the following.
(a) Use six rectangles to find estimates of each type for the area under the given graph of f from x = 0 to x = 24.
(i) Sample points are left endpoints.L6 = 343.2
(ii) Sample points are right endpoints.R6 = 279.2
(iii) Sample points are midpoints.M6 = 314
(b) Is L6 an underestimate or overestimate of the true area?
(c) Is R6 an underestimate or overestimate of the true area?
(d) Which of the numbers gives the best estimate?
overestimate
underestimate
overestimate
underestimate
M6
L6
R6

5/2/14, 10:34 PMSection 5.1 HW
Page 3 of 26http://www.webassign.net/web/Student/Assignment-Responses/last?dep=8337857
2. 6/6 points | Previous Answers SCalcET7 5.1.003.MI.
(a) Estimate the area under the graph of f(x) = 2 cos(x) from x = 0 to x = π/2 using four approximating rectangles and right endpoints.(Round your answers to four decimal places.)R4 = 1.5815
Sketch the graph and the rectangles.

5/2/14, 10:34 PMSection 5.1 HW
Page 4 of 26http://www.webassign.net/web/Student/Assignment-Responses/last?dep=8337857
Is your estimate an underestimate or an overestimate?
Master It
Estimate the area under the graph of f(x) = cos(x) from x = 0 to x = π/2 using four approximating rectangles and right endpoints. Isyour estimate an underestimate or an overestimate?Part 1 of 5
Rectangle areas are found by calculating
The width of each rectangle equals and the height of each rectangle is given by the function value at the right-hand side of therectangle.
So we must calculate where represent the right-hand endpoints of
four equal sub-intervals of
Since we wish to estimate the area over the interval using 4 rectangles of equal widths, then each rectangle will have width
(b) Repeat part (a) using left endpoints.L4 = 2.3669
Sketch the graph and the rectangles.
underestimate
overestimate
height × width.
Δx
R4 = ,4
f(xi)Δx = [f(x1) + f(x2) + f(x3) + f(x4)] Δxi = 1
x1, x2, x3, x4
0, .π2
0, π2
Δx = (No Response) .

5/2/14, 10:34 PMSection 5.1 HW
Page 5 of 26http://www.webassign.net/web/Student/Assignment-Responses/last?dep=8337857
Is your estimate an underestimate or an overestimate?

5/2/14, 10:34 PMSection 5.1 HW
Page 6 of 26http://www.webassign.net/web/Student/Assignment-Responses/last?dep=8337857
Master It
Estimate the area under the graph of f(x) = cos(x) from x = 0 to x = π/2 using four approximating rectangles and left endpoints. Is yourestimate an underestimate or an overestimate?Part 1 of 5
We must calculate where represent the left-hand endpoints of
four equal sub-intervals of
Since we wish to estimate the area over the interval using 4 rectangles of equal widths, then each rectangle will have width
3. 16/16 points | Previous Answers SCalcET7 5.1.003.MI.SA.
This question has several parts that must be completed sequentially. If you skip a part of the question, you will not receive any points forthe skipped part, and you will not be able to come back to the skipped part.
Exercise (a)
Estimate the area under the graph of f(x) = cos(x) from x = 0 to x = π/2 using four approximating rectangles and right endpoints.Is your estimate an underestimate or an overestimate?
Part 1 of 5
Rectangle areas are found by calculating
The width of each rectangle equals and the height of each rectangle is given by the function value at the right-hand side ofthe rectangle.
So we must calculate where represent the right-hand
endpoints of four equal sub-intervals of
Since we wish to estimate the area over the interval using 4 rectangles of equal widths, then each rectangle will have
width
Part 2 of 5
We wish to find
underestimate
overestimate
L4 = ,4
f(xi − 1) Δx = [f(x0) + f(x1) + f(x2) + f(x3)]Δxi = 1
x0, x1, x2, x3
0, .π2
0, π2
Δx = (No Response) .
height × width.
Δx
R4 = ,4
f(xi)Δx = [f(x1) + f(x2) + f(x3) + f(x4)] Δxi = 1
x1, x2, x3, x4
0, .π2
0, π2
Δx = .
R4 = [f(x1) + f(x2) + f(x3) + f(x4)] .π8
5/2/14, 10:34 PMSection 5.1 HW
Page 7 of 26http://www.webassign.net/web/Student/Assignment-Responses/last?dep=8337857
Since represent the right-hand endpoints of the four sub-intervals of then we must have the following.
Part 3 of 5Round your answer to four decimal places.
= .790766
Part 4 of 5We can use the above information to sketch the graph of the function and the rectangles.
x1, x2, x3, x4 0, ,π2
x1 =
x2 =
x3 =
x4 =
R4 = cos + cos + cos + cosπ8
π4
3π8
π2
π8

5/2/14, 10:34 PMSection 5.1 HW
Page 8 of 26http://www.webassign.net/web/Student/Assignment-Responses/last?dep=8337857
Part 5 of 5Is your estimate an underestimate or an overestimate?
Exercise (b)
Estimate the area under the graph of f(x) = cos(x) from x = 0 to x = π/2 using four approximating rectangles and left endpoints.Is your estimate an underestimate or an overestimate?
Part 1 of 5
We must calculate where represent the left-hand
endpoints of four equal sub-intervals of
Since we wish to estimate the area over the interval using 4 rectangles of equal widths, then each rectangle will have
underestimate
overestimate
L4 = ,4
f(xi − 1) Δx = [f(x0) + f(x1) + f(x2) + f(x3)]Δxi = 1
x0, x1, x2, x3
0, .π2
0, π2

5/2/14, 10:34 PMSection 5.1 HW
Page 9 of 26http://www.webassign.net/web/Student/Assignment-Responses/last?dep=8337857
width
Part 2 of 5
We wish to find .
Since represent the left-hand endpoints of the four sub-intervals of then we must have the following.
Part 3 of 5Round your answer to four decimal places.
= 1.183465
Part 4 of 5We can use the above information to sketch the graph of the function and the rectangles.
Δx = .
L4 = [f(x0) + f(x1) + f(x2) + f(x3)] π8
x0, x1, x2, x3 0, ,π2
x0 =
x1 =
x2 =
x3 =
L4 = cos(0) + cos + cos + cosπ8
π4
3π8
π8

5/2/14, 10:34 PMSection 5.1 HW
Page 10 of 26http://www.webassign.net/web/Student/Assignment-Responses/last?dep=8337857
Part 5 of 5Is your estimate an underestimate or an overestimate?
You have now completed the Master It.
4. 13/13 points | Previous Answers SCalcET7 5.1.005.
(a) Estimate the area under the graph of using three rectangles and right endpoints.R3 = 13
Then improve your estimate by using six rectangles.R6 = 10.75
Sketch the curve and the approximating rectangles for R3.
underestimate
overestimate
f(x) = 1 + 2x2 from x = −1 to x = 2

5/2/14, 10:34 PMSection 5.1 HW
Page 11 of 26http://www.webassign.net/web/Student/Assignment-Responses/last?dep=8337857
Sketch the curve and the approximating rectangles for R6.

5/2/14, 10:34 PMSection 5.1 HW
Page 12 of 26http://www.webassign.net/web/Student/Assignment-Responses/last?dep=8337857
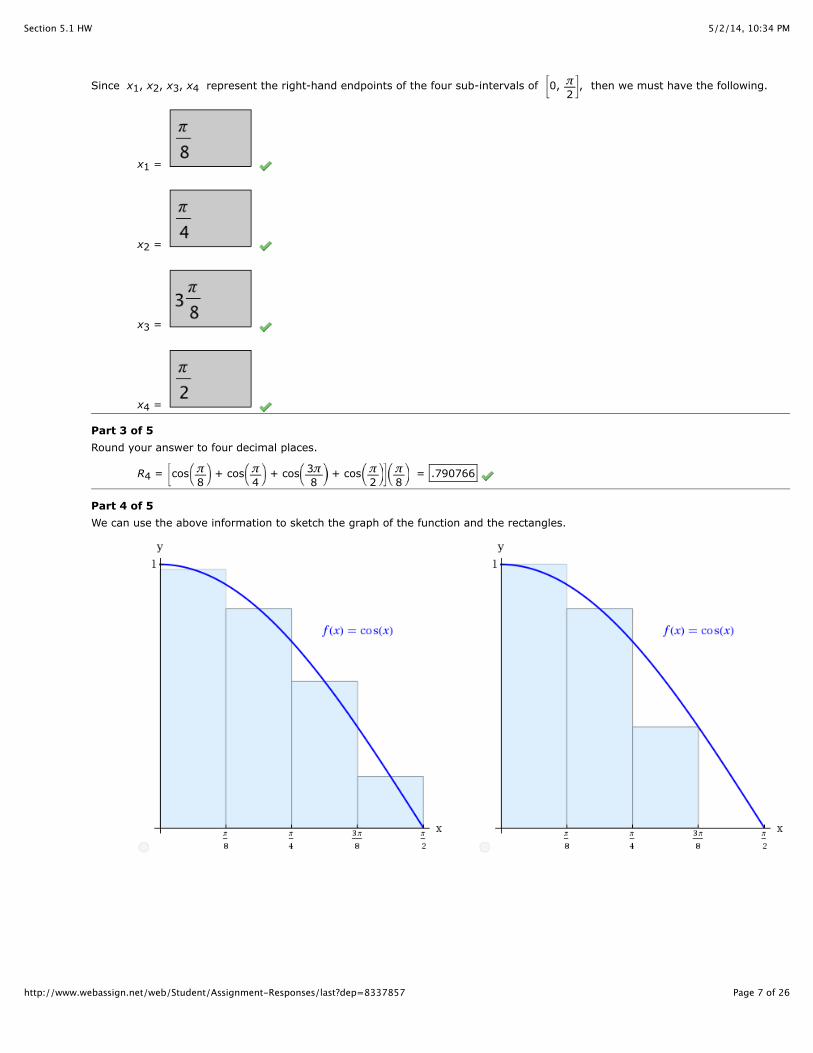
(b) Repeat part (a) using left endpoints.
L3 = 7
L6 = 7.75
Sketch the curve and the approximating rectangles for L3.
5/2/14, 10:34 PMSection 5.1 HW
Page 13 of 26http://www.webassign.net/web/Student/Assignment-Responses/last?dep=8337857

5/2/14, 10:34 PMSection 5.1 HW
Page 14 of 26http://www.webassign.net/web/Student/Assignment-Responses/last?dep=8337857
Sketch the curve and the approximating rectangles for L6.
(c) Repeat part (a) using midpoints.
M3 = 8.5
M6 = 8.875
Sketch the curve and the approximating rectangles for M3.

5/2/14, 10:34 PMSection 5.1 HW
Page 15 of 26http://www.webassign.net/web/Student/Assignment-Responses/last?dep=8337857
Sketch the curve and the approximating rectangles for M6.

5/2/14, 10:34 PMSection 5.1 HW
Page 16 of 26http://www.webassign.net/web/Student/Assignment-Responses/last?dep=8337857

5/2/14, 10:34 PMSection 5.1 HW
Page 17 of 26http://www.webassign.net/web/Student/Assignment-Responses/last?dep=8337857
(d) From your sketches in parts (a)-(c), which appears to be the best estimate?
5. 8/9 points | Previous Answers SCalcET7 5.1.007.
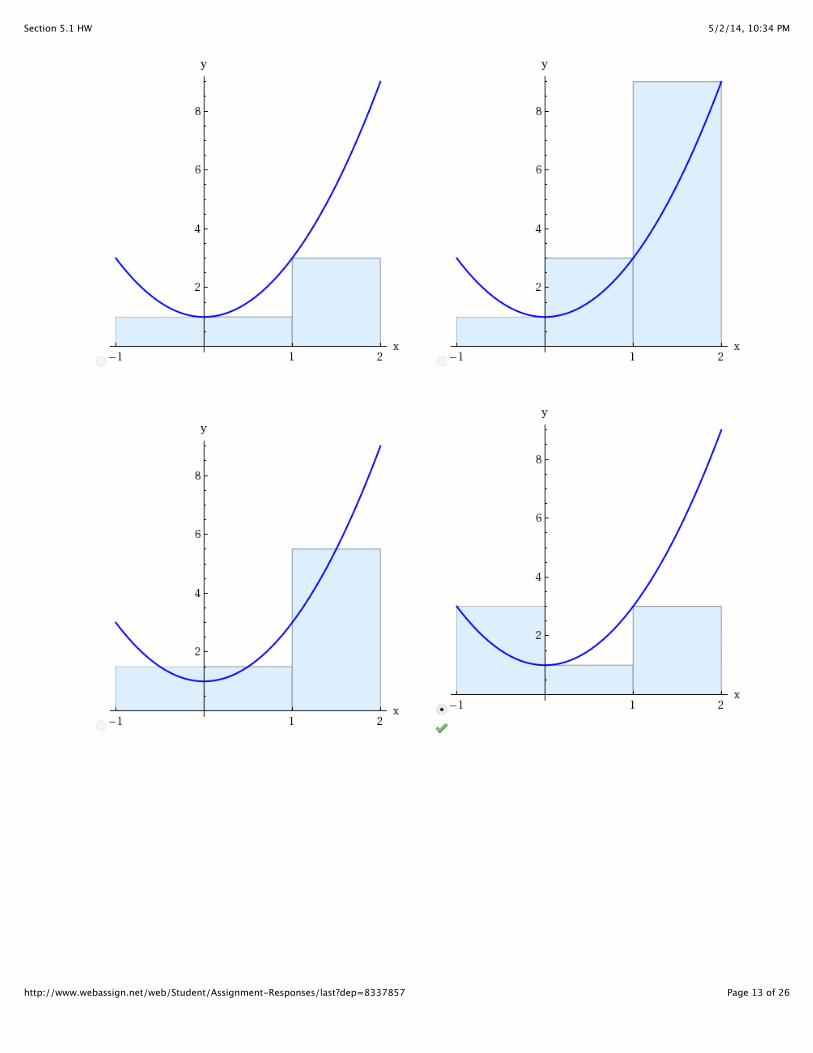
Evaluate the upper and lower sums for with Illustrate with diagrams like the figure shownbelow. (Round your answers to two decimal places.)
n = 2:
upper sum 9.424
lower sum 6.283
Illustrate.
L6
R6
M6
f(x) = 2 + sin x, 0 ≤ x ≤ π, n = 2, 4, and 8.
5/2/14, 10:34 PMSection 5.1 HW
Page 18 of 26http://www.webassign.net/web/Student/Assignment-Responses/last?dep=8337857
n = 4:
upper sum 8.9645
lower sum 7.3937
Illustrate.

5/2/14, 10:34 PMSection 5.1 HW
Page 19 of 26http://www.webassign.net/web/Student/Assignment-Responses/last?dep=8337857

5/2/14, 10:34 PMSection 5.1 HW
Page 20 of 26http://www.webassign.net/web/Student/Assignment-Responses/last?dep=8337857
n = 8:
upper sum 8.65
lower sum 6.29
Illustrate.

5/2/14, 10:34 PMSection 5.1 HW
Page 21 of 26http://www.webassign.net/web/Student/Assignment-Responses/last?dep=8337857
6. 2/2 points | Previous Answers SCalcET7 5.1.013.MI.
The speed of a runner increased steadily during the first three seconds of a race. Her speed at half-second intervals is given in the table.Find lower and upper estimates for the distance that she traveled during these three seconds.
33.65 ft (smaller value)
43.75 ft (larger value)
t (s) 0 0.5 1.0 1.5 2.0 2.5 3.0
v (ft/s) 0 6.7 9.2 14.1 17.5 19.8 20.2
Master ItThe speed of a runner increased steadily during the first three seconds of a race. Her speed at half-second intervals is given in the table.Find lower and upper estimates for the distance that she traveled during these three seconds.
t (s) 0 0.5 1.0 1.5 2.0 2.5 3.0
v (ft/s) 0 6.2 10.8 14.9 18.1 19.4 20.2
Part 1 of 5We will use either L6 or R6 for the upper and lower estimates.
Since the runner's speed is an increasing function, then (No Response) will give the lower estimate, and (No Response) will give theupper estimate.

5/2/14, 10:34 PMSection 5.1 HW
Page 22 of 26http://www.webassign.net/web/Student/Assignment-Responses/last?dep=8337857
7. 17/17 points | Previous Answers SCalcET7 5.1.013.MI.SA.
This question has several parts that must be completed sequentially. If you skip a part of the question, you will not receive any points forthe skipped part, and you will not be able to come back to the skipped part.
Tutorial ExerciseThe speed of a runner increased steadily during the first three seconds of a race. Her speed at half-second intervals is given in the table.Find lower and upper estimates for the distance that she traveled during these three seconds.
t (s) 0 0.5 1.0 1.5 2.0 2.5 3.0
v (ft/s) 0 6.2 10.8 14.9 18.1 19.4 20.2
Part 1 of 5We will use either L6 or R6 for the upper and lower estimates.
Since the runner's speed is an increasing function, then will give the lower estimate, and willgive the upper estimate.
Part 2 of 5The sub-interval widths for this situation are
Part 3 of 5The first two sub-intervals in the table are and
When calculating L6, we should use the function values and for these two sub-intervals, respectively.
Part 4 of 5Enter your answers from smallest to largest. In the last step, round your answer to one decimal place. For the lower estimate, we have thefollowing.
Part 5 of 5Enter your answers from smallest to largest. In the last step, round your answer to one decimal place. For the upper estimate, we have thefollowing.
You have now completed the Master It.
Δt Δt = .5 .
[0, 0.5] [0.5, 1.0].
v = 0 v = 6.2
L6 = (0.5)(0 + 6.2 + 10.8 + 14.9 + 18.1 + 19.4 )
= 34.7 ft
R6 = (0.5)( 6.2 + 10.8 + 14.9 + 18.1 + 19.4 + 20.2 )
= 44.8 ft

5/2/14, 10:34 PMSection 5.1 HW
Page 23 of 26http://www.webassign.net/web/Student/Assignment-Responses/last?dep=8337857
8. 3/3 points | Previous Answers SCalcET7 5.1.014.
Speedometer readings for a motorcycle at 12-second intervals are given in the table.
t (s) 0 12 24 36 48 60
v (ft/s) 30 28 25 21 25 28
(a) Estimate the distance traveled by the motorcycle during this time period using the velocities at the beginning of the timeintervals.1548 ft
(b) Give another estimate using the velocities at the end of the time periods.1524 ft
(c) Are your estimates in parts (a) and (b) upper and lower estimates? Explain.
(b) is a lower estimate and (a) is an upper estimate since v is a decreasing function of t.
(a) is a lower estimate and (b) is an upper estimate since v is an increasing function of t.
(a) and (b) are neither lower nor upper estimates since v is neither an increasing nor decreasing function of t.

5/2/14, 10:34 PMSection 5.1 HW
Page 24 of 26http://www.webassign.net/web/Student/Assignment-Responses/last?dep=8337857
9. 1/1 points | Previous Answers SCalcET7 5.1.016.MI.
When we estimate distances from velocity data, it is sometimes necessary to use times that are not equally spaced. Wecan still estimate distances using the time periods For example, a space shuttle was launched on a mission, the purposeof which was to install a new motor in a satellite. The table provided gives the velocity data for the shuttle between liftoff and thejettisoning of the solid rocket boosters. Use these data to estimate the height, h, above Earth's surface of the space shuttle, 62 secondsafter liftoff. (Give the upper approximation available from the data.)h = 51782 ft
Event Time (s) Velocity (ft/s)
Launch 0 0
Begin roll maneuver 10 180
End roll maneuver 15 319
Throttle to 89% 20 453
Throttle to 67% 32 742
Throttle to 104% 59 1217
Maximum dynamic pressure 62 1453
Solid rocket booster separation 125 4052
Master ItWhen we estimate distances from velocity data, it is sometimes necessary to use times that are not equally spaced. Wecan still estimate distances using the time periods For example, a space shuttle was launched on a mission, the purposeof which was to install a new motor in a satellite. The table provided gives the velocity data for the shuttle between liftoff and thejettisoning of the solid rocket boosters. Use these data to estimate the height, h, above Earth's surface of the space shuttle, 62 secondsafter liftoff.
Event Time (s) Velocity (ft/s)
Launch 0 0
Begin roll maneuver 10 185
End roll maneuver 15 319
Throttle to 89% 20 447
Throttle to 67% 32 742
Throttle to 104% 59 1325
Maximum dynamic pressure 62 1445
Solid rocket booster separation 125 4151
Part 1 of 4We can obtain an upper estimate for the height by using the final velocity for each time interval.
The first interval begins at t = 0 and ends at t = 10, so its width is
t0, t1, t2, t3, . . .Δti = ti − ti − 1.
t0, t1, t2, t3, . . .Δti = ti − ti − 1.
Δt1 = (No Response) .

5/2/14, 10:34 PMSection 5.1 HW
Page 25 of 26http://www.webassign.net/web/Student/Assignment-Responses/last?dep=8337857
10.9/9 points | Previous Answers SCalcET7 5.1.016.MI.SA.
This question has several parts that must be completed sequentially. If you skip a part of the question, you will not receive any points forthe skipped part, and you will not be able to come back to the skipped part.
Tutorial ExerciseWhen we estimate distances from velocity data, it is sometimes necessary to use times that are not equally spaced. Wecan still estimate distances using the time periods For example, a space shuttle was launched on a mission, the purposeof which was to install a new motor in a satellite. The table provided gives the velocity data for the shuttle between liftoff and thejettisoning of the solid rocket boosters. Use these data to estimate the height, h, above Earth's surface of the space shuttle, 62 secondsafter liftoff.
Event Time (s) Velocity (ft/s)
Launch 0 0
Begin roll maneuver 10 185
End roll maneuver 15 319
Throttle to 89% 20 447
Throttle to 67% 32 742
Throttle to 104% 59 1325
Maximum dynamic pressure 62 1445
Solid rocket booster separation 125 4151
Part 1 of 4We can obtain an upper estimate for the height by using the final velocity for each time interval.
The first interval begins at t = 0 and ends at t = 10, so its width is
Part 2 of 4The second interval begins at t = 10 and ends at t = 15, so its width is
Part 3 of 4The final velocities for the first two intervals are, respectively,
and
Part 4 of 4Now, we can calculate an upper estimate for the height.
You have now completed the Master It.
t0, t1, t2, t3, . . .Δti = ti − ti − 1.
Δt1 = 10 .
Δt2 = 5 .
v1 = 185 v2 = 319 .
h ≈ (185 × 10) + (319 × 5) + ( 447 × 5) + (742 × 12 ) + ( 1325 × 27) + (1445 × 3 )
= 54694 ft

5/2/14, 10:34 PMSection 5.1 HW
Page 26 of 26http://www.webassign.net/web/Student/Assignment-Responses/last?dep=8337857
11.1/1 points | Previous Answers SCalcET7 5.1.017.
The velocity graph of a braking car is shown. Use it to estimate the distance traveled by the car while the brakes are applied. (Use M6 to
get the most precise estimate.)120 ft
Top Related