


Languages
Pages
Legal


1
Second Quarter 2013 Earnings Release July 18, 2013 Jack Koraleski, CEO
2
2011 2012 2013
$1.59
$2.10
$2.37 All-Time
Qtrly Record
Second Quarter 2013 Record Results
+13%
Earnings Per Share Second Quarter Positives
• Best-Ever Quarter – Operating Revenue – Operating Income – Operating Ratio – Earnings
• Franchise Diversity
Challenges • Grain Volumes • International Intermodal
Volumes
3
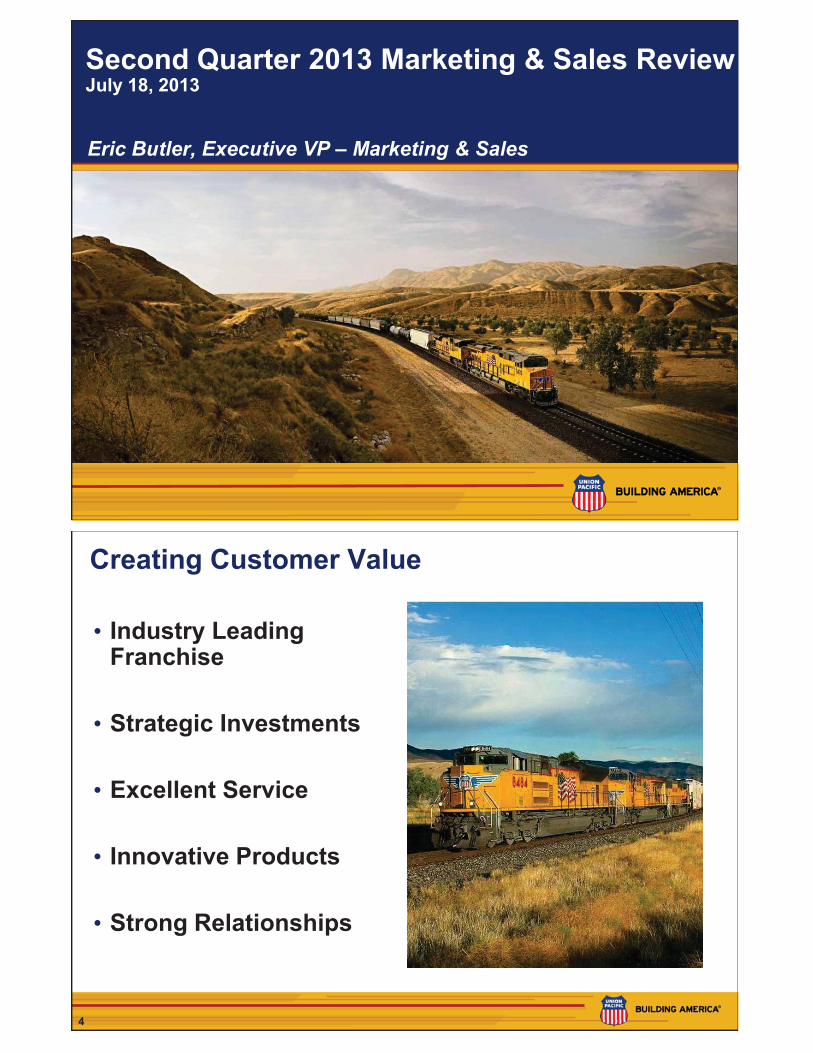
Second Quarter 2013 Marketing & Sales Review July 18, 2013 Eric Butler, Executive VP – Marketing & Sales
4
Creating Customer Value
• Industry Leading Franchise • Strategic Investments
• Excellent Service
• Innovative Products
• Strong Relationships
5
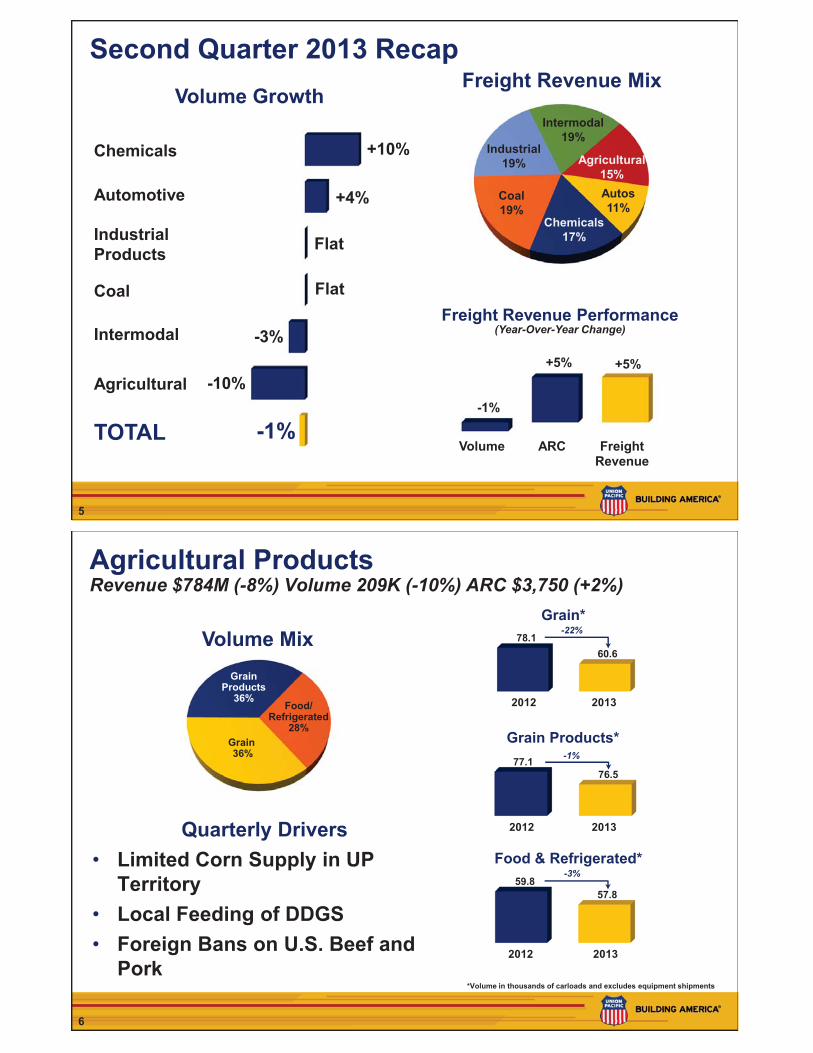
Chemicals
Automotive
Agricultural
Second Quarter 2013 Recap Volume Growth
Freight Revenue Mix
Intermodal
TOTAL
Flat
+4%
-3%
-10%
Flat
-1%
+10%
Coal
Industrial Products
Agricultural 15% Autos 11%
Chemicals 17%
Coal 19%
Industrial 19%
Intermodal 19%
Volume ARC Freight Revenue
Freight Revenue Performance (Year-Over-Year Change)
-1%
+5% +5%
6
Agricultural Products Revenue $784M (-8%) Volume 209K (-10%) ARC $3,750 (+2%)
Quarterly Drivers • Limited Corn Supply in UP
Territory • Local Feeding of DDGS • Foreign Bans on U.S. Beef and
Pork
Volume Mix
*Volume in thousands of carloads and excludes equipment shipments
77.1 76.5
Grain Products*
2012 2013
-1%
59.8 57.8
Food & Refrigerated* -3%
2012 2013
Grain Products
36%
Grain 36%
Food/ Refrigerated
28%
78.1 60.6
Grain*
2012 2013
-22%
7
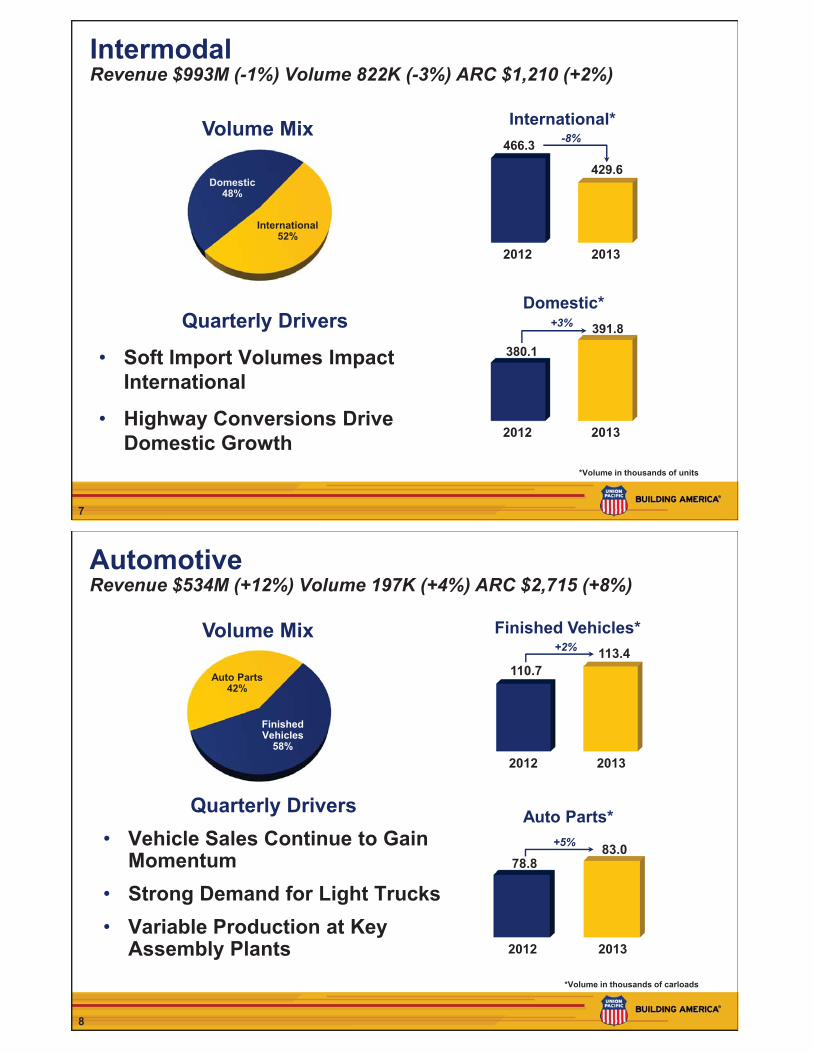
Intermodal Revenue $993M (-1%) Volume 822K (-3%) ARC $1,210 (+2%)
Quarterly Drivers
• Soft Import Volumes Impact International
• Highway Conversions Drive Domestic Growth
International 52%
Domestic 48%
Volume Mix 466.3
429.6
International*
2012 2013
380.1
391.8
Domestic*
2012 2013
*Volume in thousands of units
-8%
+3%
8
Automotive Revenue $534M (+12%) Volume 197K (+4%) ARC $2,715 (+8%)
Finished Vehicles
58%
Volume Mix
110.7 113.4
Finished Vehicles*
2012 2013
+2%
78.8 83.0
Auto Parts*
2012 2013
+5%
*Volume in thousands of carloads
Quarterly Drivers • Vehicle Sales Continue to Gain
Momentum • Strong Demand for Light Trucks • Variable Production at Key
Assembly Plants
Auto Parts 42%
9
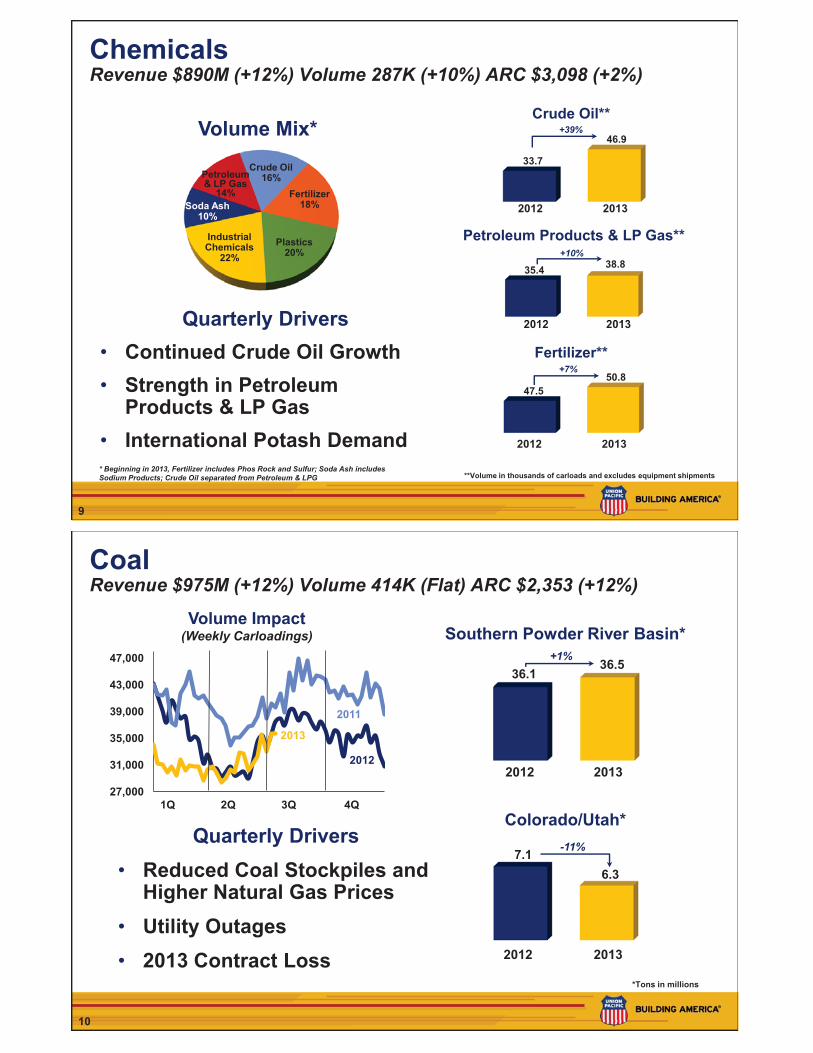
Petroleum Products & LP Gas**
Chemicals Revenue $890M (+12%) Volume 287K (+10%) ARC $3,098 (+2%)
Volume Mix*
47.5 50.8
Fertilizer** +7%
2012 2013
33.7
46.9
Crude Oil** +39%
**Volume in thousands of carloads and excludes equipment shipments
Plastics 20%
Industrial Chemicals
22%
Petroleum & LP Gas
14% Fertilizer 18% Soda Ash
10%
Crude Oil 16%
* Beginning in 2013, Fertilizer includes Phos Rock and Sulfur; Soda Ash includes Sodium Products; Crude Oil separated from Petroleum & LPG
Quarterly Drivers • Continued Crude Oil Growth • Strength in Petroleum
Products & LP Gas • International Potash Demand
2012 2013 2012 2013
35.4 38.8 +10%
2012 2013
10
Coal Revenue $975M (+12%) Volume 414K (Flat) ARC $2,353 (+12%)
36.1 36.5
Southern Powder River Basin*
2012 2013
*Tons in millions
7.1 6.3
Colorado/Utah*
2012 2013
+1%
-11%
Southern Powder River Basin
74%
Other 13%
Volume Impact (Weekly Carloadings)
1Q 4Q
River Bas74%
27,000
31,000
35,000
39,000
43,000
47,000
2011
2012
2Q 3Q
Quarterly Drivers • Reduced Coal Stockpiles and
Higher Natural Gas Prices • Utility Outages • 2013 Contract Loss
2013

11
Industrial Products Revenue $977M (+7%) Volume 317K (Flat) ARC $3,079 (+6%)
Quarterly Drivers • Shale Drilling – Frac Sand • Housing Growth • Declines in Scrap Steel, Rock,
and Military Shipments
Volume Mix
*Volume in thousands of carloads
27.0 29.9
Lumber*
2012 2013
+11%
53.3 62.9
Non-Metallic Minerals*
2012 2013
+18%
2012 2013
12.2 10.1
Ferrous Scrap* -17%
Paper 9%
Gov’t/Waste 8%
Metals 19%
Minerals/ Consumer
23%
Construction 31%
Lumber 10%
12
Second Half 2013 Outlook Agricultural Products – Diminished 2012 Crops + 2013 Crop Projections Automotive + Auto Sales Growth Chemicals + Crude Oil + Most Other Markets Remain Solid Coal – Contract Loss + Dependent on Weather Industrial Products + Shale Drilling - Frac Sand + Housing & Construction Intermodal + Domestic Growth and Improved
International Peak

13
Second Quarter 2013 Operations Review July 18, 2013
Lance Fritz, Executive VP - Operations
14
Dedicated Focus on Safety Second Quarter YTD Employee
(Reportable Personal Injury Incidents Per 200,000 Employee-Hours)
Rail Equipment (Reportable Derailment Incidents
Per Million Train Miles)
Public (Crossing Accidents Per Million Train Miles)
2008 2009 2010 2011 1H '12 1H '13
1.59 1.45 1.37
1.15 1.02 1.07
Good
2008 2009 2010 2011 1H '12 1H '13
3.68
3.17 2.98
3.28 3.11 3.07
-1%
Good
2008 2009 2010 2011 1H '12 1H '13
2.37
2.11
2.32
2.11 2.29 2.23
Good -3%
All-Time Annual Record
All-Time Annual Record
• Decrease in Severe Injuries
• Infrastructure Investments & Improved Defect Detection
• Continuing Focus on High Risk Crossings and Driver Behavior
+5%
15
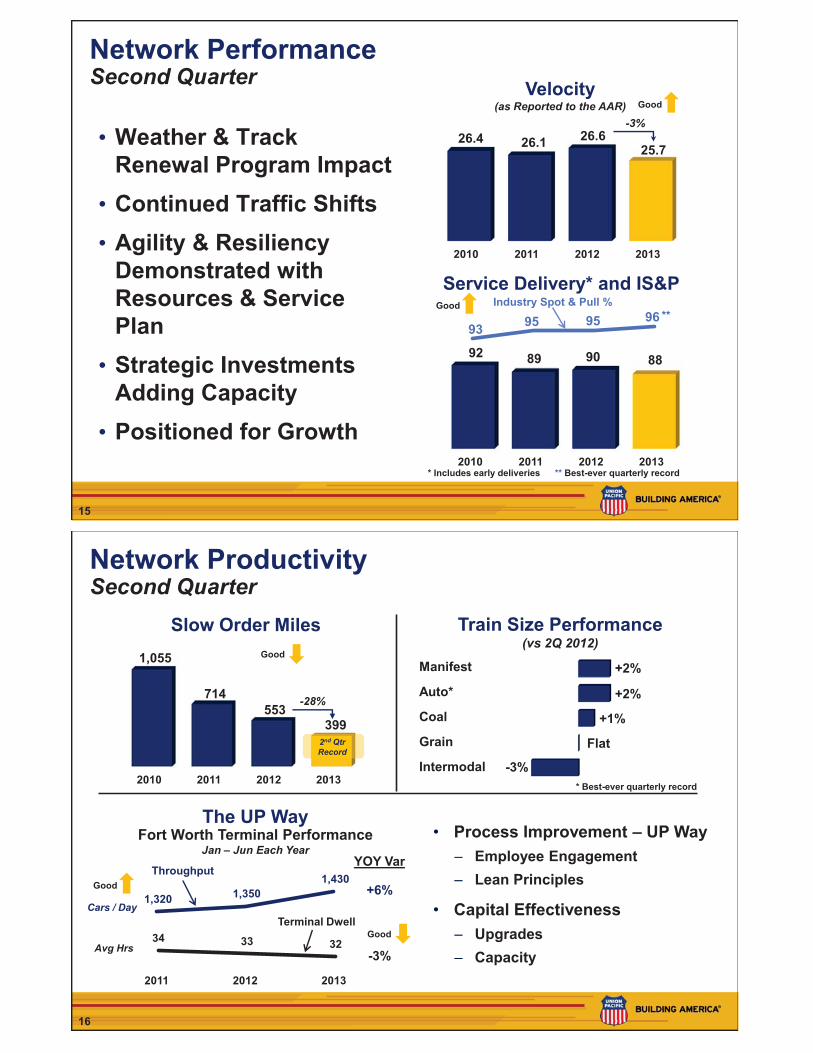
2010 2011 2012 2013
92 89 90 88
93 95 95 96
Network Performance Second Quarter • Weather & Track
Renewal Program Impact • Continued Traffic Shifts • Agility & Resiliency
Demonstrated with Resources & Service Plan • Strategic Investments
Adding Capacity • Positioned for Growth
2010 2011 2012 2013
26.4 26.1 26.6 25.7
Velocity (as Reported to the AAR)
Service Delivery* and IS&P Industry Spot & Pull % Good
* Includes early deliveries
**
** Best-ever quarterly record
-3% Good
16
Network Productivity Second Quarter
2010 2011 2012 2013
1,055
714 553
399
Slow Order Miles Good
2nd Qtr Record
-28%
• Process Improvement – UP Way – Employee Engagement – Lean Principles
• Capital Effectiveness – Upgrades – Capacity
-3%
Flat
+1%
+2%
+2% Manifest
34 33 32
1,320 1,350 1,430
2011 2012 2013
The UP Way Fort Worth Terminal Performance
Jan – Jun Each Year
Throughput
Terminal Dwell
YOY Var
+6%
-3%
Cars / Day
Avg Hrs
Train Size Performance (vs 2Q 2012)
Auto*
Coal
Intermodal
Grain
Good
Good
* Best-ever quarterly record
17
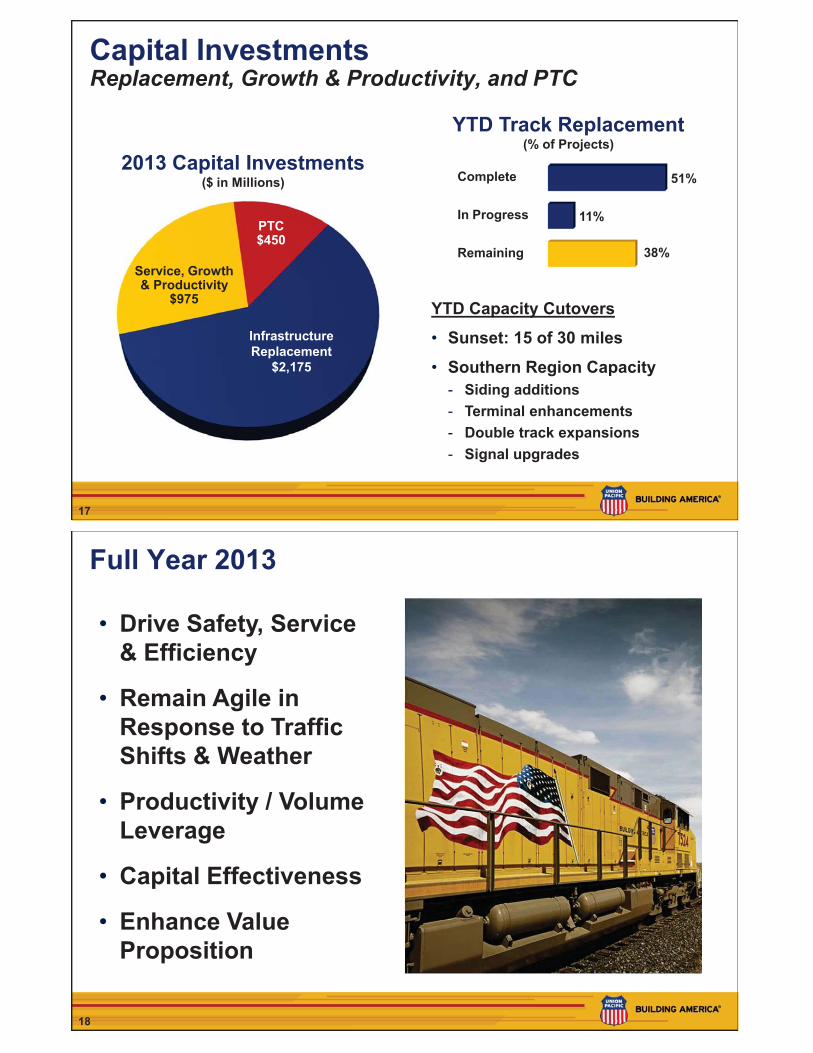
Capital Investments Replacement, Growth & Productivity, and PTC
2013 Capital Investments ($ in Millions)
Service, Growth & Productivity
$975
PTC $450
Infrastructure Replacement
$2,175
YTD Track Replacement (% of Projects)
38%
11%
51% Complete
In Progress
Remaining
YTD Capacity Cutovers
• Sunset: 15 of 30 miles
• Southern Region Capacity - Siding additions - Terminal enhancements - Double track expansions - Signal upgrades
18
Full Year 2013
• Drive Safety, Service & Efficiency
• Remain Agile in Response to Traffic Shifts & Weather
• Productivity / Volume Leverage
• Capital Effectiveness
• Enhance Value Proposition

19
Second Quarter 2013 Financial Review July 18, 2013
Rob Knight, CFO
20
Second Quarter Income Statement In Millions (except EPS)
Operating Revenues $5,470 $5,221 5 Operating Expenses 3,592 3,497 3 Operating Income 1,878 1,724 9 Other Income 23 21 10 Interest Expense (133) (135) (1) Income Taxes (662) (608) 9 Net Income $1,106 $1,002 10 Weighted Average Diluted Shares 467.6 477.2 (2)
Diluted EPS $2.37 $2.10 13
2013 2012 %

21
Freight Revenue Second Quarter (In Millions)
2012
Volume Core Price
Fuel Surcharge
2013
-0.5%
+4% $5,153
$4,913
+5%
-0.5%
Mix
+2%
22
$1,151 $1,185
Compensation & Benefits Expense Second Quarter 2013 $1,185M, +3%
2012
Compensation & Benefits (in Millions)
2013
45,797 46,787
2012
Workforce Levels (Quarterly Average)
2013
+2%
• Inflation Costs • Shift in Traffic Mix • Lower Volume
• Increased Workforce – Shift in Traffic Mix – Capital (including PTC)
+3%

23
Fuel Expense Second Quarter 2013 $863M, -2%
• Lower Average Diesel Fuel Price
• GTMs Flat compared to 2012
• 2% Consumption Rate Increase
$3.21 $3.10
Average Fuel Price (Per Gallon Consumed)
2012 2013
-3%
234,483 235,396
2012
Gross-Ton-Miles (in Millions)
2013
Flat
24
$542 $585
Second Quarter 2013 Expense Review In Millions
2012
Purchased Services & Materials
2013
• Increased Locomotive & Freight Car Repair Costs
• Joint Facility Maint. expenses • New Logistics Management
Fees
+8%
$433 $438 • Higher Depreciable Asset Base from Recent Capital Spending Levels
• New Equipment Rate Study 2012
Depreciation
2013
+1%
25
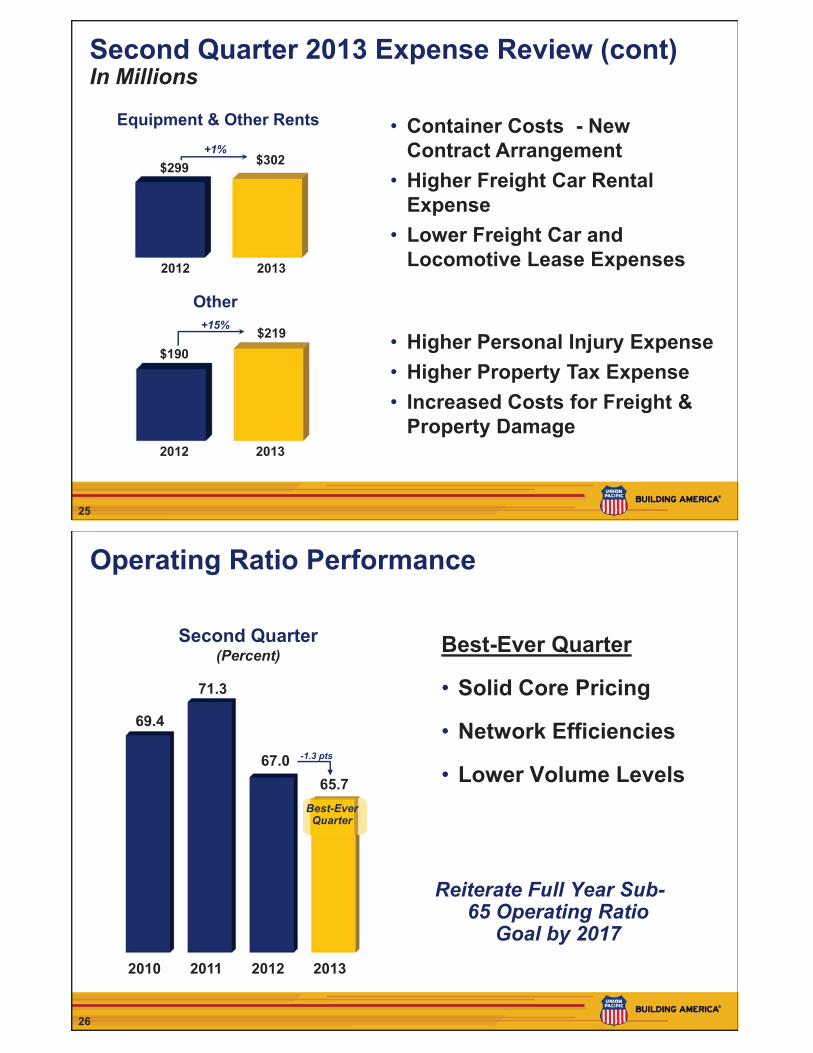
Second Quarter 2013 Expense Review (cont) In Millions
• Container Costs - New Contract Arrangement
• Higher Freight Car Rental Expense
• Lower Freight Car and Locomotive Lease Expenses
$299 $302
2012
Equipment & Other Rents
2013
+1%
• Higher Personal Injury Expense • Higher Property Tax Expense • Increased Costs for Freight &
Property Damage
$190 $219
2012
Other
2013
+15%
26
Operating Ratio Performance
2010 2011 2012 2013
69.4
71.3
67.0 65.7
Second Quarter (Percent)
-1.3 pts
Best-Ever Quarter
Best-Ever Quarter
• Solid Core Pricing
• Network Efficiencies
• Lower Volume Levels
Reiterate Full Year Sub-65 Operating Ratio
Goal by 2017
27
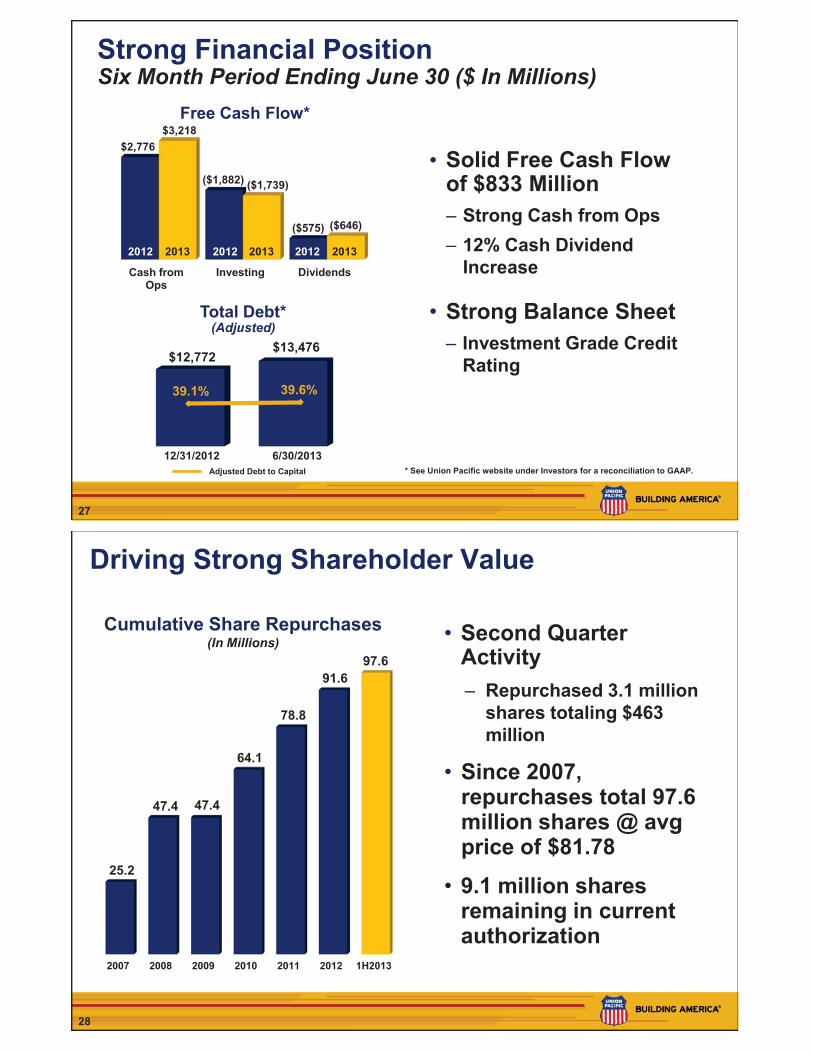
Cash from Ops
Investing Dividends
$2,776
($1,882)
($575)
$3,218
($1,739)
($646)
Strong Financial Position Six Month Period Ending June 30 ($ In Millions)
• Solid Free Cash Flow of $833 Million ‒ Strong Cash from Ops ‒ 12% Cash Dividend
Increase
• Strong Balance Sheet ‒ Investment Grade Credit
Rating
Free Cash Flow*
Total Debt* (Adjusted)
39.1% 39.6%
* See Union Pacific website under Investors for a reconciliation to GAAP. Adjusted Debt to Capital
12/31/2012 6/30/2013
$12,772 $13,476
2013 2012 2013 2012 2013 2012
28
Driving Strong Shareholder Value
Cumulative Share Repurchases (In Millions)
• Second Quarter Activity – Repurchased 3.1 million
shares totaling $463 million
• Since 2007, repurchases total 97.6 million shares @ avg price of $81.78
• 9.1 million shares remaining in current authorization
2007 2008 2009 2010 2011 2012 1H2013
25.2
47.4 47.4
64.1
78.8
91.6 97.6

29
2013 Outlook Assuming an Improving Economy
Second Half • Positive Volume Growth Full Year • Positive Volume Growth • Continued Real Core
Pricing Gains • Record Earnings • Growing Returns • Increased Shareholder
Value
30
Second Quarter 2013 Earnings Release July 18, 2013 Jack Koraleski, CEO

31
Positioned for Success
• Economic Uncertainty
• Reinvestible Pricing
• Growth Opportunities
• Growing Customer Value & Shareholder Returns
• Well Positioned for the Future
32
Cautionary Information This press release and related materials contain statements about the Corporation’s future that are not
statements of historical fact, including specifically the statements regarding the Corporation’s expectations with respect to general economic conditions, future economic improvement, and business growth and its ability to capitalize on any future economic improvement; obtain reinvestible pricing; develop new business; provide safe, efficient and reliable service; and generate value for our customers and shareholders. These statements are, or will be, forward-looking statements as defined by the Securities Act of 1933 and the Securities Exchange Act of 1934. Forward-looking statements also generally include, without limitation, information or statements regarding: projections, predictions, expectations, estimates or forecasts as to the Corporation’s and its subsidiaries’ business, financial, and operational results, and future economic performance; and management’s beliefs, expectations, goals, and objectives and other similar expressions concerning matters that are not historical facts.
Forward-looking statements should not be read as a guarantee of future performance or results, and will not necessarily be accurate indications of the times that, or by which, such performance or results will be achieved. Forward-looking information, including expectations regarding operational and financial improvements and the Corporation’s future performance or results are subject to risks and uncertainties that could cause actual performance or results to differ materially from those expressed in the statement. Important factors, including risk factors, could affect the Corporation’s and its subsidiaries’ future results and could cause those results or other outcomes to differ materially from those expressed or implied in the forward-looking statements. Information regarding risk factors and other cautionary information are available in the Corporation’s Annual Report on Form 10-K for 2012, which was filed with the SEC on February 8, 2013. The Corporation updates information regarding risk factors if circumstances require such updates in its periodic reports on Form 10-Q and its subsequent Annual Reports on Form 10-K (or such other reports that may be filed with the SEC).
Forward-looking statements speak only as of, and are based only upon information available on, the date the statements were made. The Corporation assumes no obligation to update forward-looking information to reflect actual results, changes in assumptions or changes in other factors affecting forward-looking information. If the Corporation does update one or more forward-looking statements, no inference should be drawn that the Corporation will make additional updates with respect thereto or with respect to other forward-looking statements. References to our website are provided for convenience and, therefore, information on or available through the website is not, and should not be deemed to be, incorporated by reference herein.

33
Second Quarter 2013 Earnings Release July 18, 2013 Question & Answer Session
Top Related