


Languages
Pages
Legal

Seattle Food System
Enhancement Project:
Greenhouse Gas Emissions Study

This Section Prepared by: Daniel Morgan Stephanie Renzi Richard Cook Heidi Radenovic * Please send inquiries and correspondence to: Daniel Morgan: [email protected] , (206) 543-5255 Branden Born: [email protected] SPECIAL THANKS TO: Henry Luce Foundation University of Washington Program on the Environment; Staff Faculty Mentor: Branden Born, PhD, Urban Design and Planning City of Seattle: Laura Raymond, Department of Neighborhoods Pam Emerson, Office of Sustainability and the Environment
Food Policy Interdepartmental Team (IDT) Community Partners: Joyce Cooper, University of Washington Horizon House, First Hill Neighborhood House, First Hill and New Holly Co Lam Pagoda, South Beacon Hill First Hill Improvement Association Yesler Terrace Community Council South Beacon Hill Community Council Tammy Morales, Seattle-King County Food Policy Council

TABLE OF CONTENTS
PAGE
INTRODUCTION …………………………………………………………………………….. 1
METHODS ………………………………………………………………………………….. 3
RESULTS
GUIDE …………………………………………………………………………….... 7
LOCAL AND IMPORTED PLATES……………………………………………………... 8
APPLE ........................................................................................................................ 12
ASPARAGUS ............................................................................................................... 16
POTATO ..................................................................................................................... 20
SALMON .................................................................................................................... 24
RECOMMENDATIONS .............................................................................................................. 28
APPENDIX
CROP YIELDS ............................................................................................................. 30
FERTILIZERS, HERBICIDES, INSECTICIDES .................................................................. 33
EMISSIONS FROM FARM FIELDS ................................................................................. 36
FARM FUEL USE ......................................................................................................... 37
SALMON FUEL USE .................................................................................................... 43
TRANSPORTATION ...................................................................................................... 45
LCA CALCULATION PROCEDURE ............................................................................... 47
REFERENCES .......................................................................................................................... 50
1
INTRODUCTION
The goal of this study is to compare the greenhouse gas impact of two similar plates of food by
completing a Life Cycle Assessment (LCA) for all of the individual items on each plate. The
two plates will have the same items of food on them, but the food will be sourced differently.
One plate will consist of items that are produced in Washington State and then transported to
Seattle, while the other plate will include items that are produced internationally or out of state
and then shipped to Seattle. To further consider the greenhouse gas impacts of specific farming
techniques, we examined the potential benefits of organic farming methods over conventional
farming methods.
There will be four items on each plate: a 0.5 pound apple, 0.25 pounds of asparagus, 0.5 pounds
of potato, and a 0.5 pound fillet of salmon. We chose these items to represent a typical
wholesome meal easily available in Seattle. For the local plate of food, the apple and asparagus
will come from Yakima, WA because Yakima County is the largest producing county for apples1
and asparagus in the state.2 The potato will come from Prosser because it is the county seat of
Benton County, which produces the most potatoes in the nation.3 The salmon for the local plate
will be a wild-caught Copper River salmon from south-central Alaska.
For the imported plate of food, the items will come from the highest producing region in the
country that the US imports the most of the specific item from. The apple will come from
Hawkes Bay, New Zealand,4 the asparagus will come from Ica, Peru,5 and the potato will come
from Blackfoot, Idaho because the US does not import many potatoes and Bingham County, ID
is the largest potato producing county outside of Washington State.6 The imported salmon will
be farm-raised Norwegian salmon.7
1 Anonymous, 2002. 2 Laurie Wishkoski, Washington Asparagus Commission, Personal Communication. 3 USDA, 2006c. 4 Patterson, 2006. 5 USDA, 2005. 6 USDA, 2006c. 7 Harvey, 2006.

2
The reason for carrying out this study is to quantify the greenhouse gas (GHG) impact of specific
food items that are typical of the Northwest. It is often asserted that buying locally produced
food must create fewer GHG emissions, but few studies have been done in the United States to
directly quantify this relationship. Previous studies have been done comparing conventional and
organic apples in Washington State, but they have focused on total energy requirements,8 or on
economic factors.9
The scope of this study has been defined by the members of the Seattle Food System
Enhancement Project in conjunction with the IDT and members of OSE. The LCA for all food
items will follow the food from initial production and harvest, and up through delivery for
purchase in Seattle. We assume that there will be no differences in GHG emissions between the
two plates of food after purchase as preparation and disposal will be similar for each.
Results from this study should be considered as a benchmark for examining the greenhouse gas
impact of cultivating and transporting specific items of food into the city of Seattle. Every effort
has been made to characterize “typical” or “average” farming practices, but there is a large
variety in the way that crops are managed due to the range in soils, climates, and technology
available. Furthermore, the manner in which food is transported into the city is a complex web
of options and in this study, direct shipping routes have been selected. However, the
assumptions made apply to both the locally grown plate and the imported plate equally, so the
differences seen between these plates are real and significant.
This report is intended for use by the City of Seattle, and specifically the Interdepartmental Team
and the Office of Sustainability and Environment (OSE). Another potential audience is the
Seattle-King County Acting Food Policy Council. It is hoped that the results in this report will
be used as educational material for the general public to illustrate the link between the food
system and greenhouse gas emissions.
8 e.g. Reganold, Glover, Andrews, & Hinman, 2001. 9 e.g. Mon & Holland, 2006.
3
METHODS
To quantify the greenhouse gas emissions related to producing and transporting food to Seattle,
we will use a tool called a Life Cycle Assessment (LCA) which is an internationally standardized
method of assessing environmental impacts. The general ISO 14040 defines LCA as the
“compilation and evaluation of the inputs, outputs and the environmental impacts of a product
system throughout its life cycle.” 10 An LCA allows us to identify the environmental impacts of
an item from the acquisition of raw materials, through production, and up through its use and
disposal. In this study we will use the LCA framework to cultivate the food items we selected
and transport them to Seattle. For specific details on the calculations behind the LCA
methodology, please see the Appendix.
Identification of the initial system boundaries
The system boundary defines the processes which will be modeled in this LCA. For the apple,
asparagus, and potato, farm activities that produce greenhouse gases will be included in this
study. The farm activities included in this model are the production, delivery, and application of
fertilizers, herbicides, and insecticides, as well as the fuel used in farm equipment to carry out
farm activities.
Also included in this study are the emissions associated with extracting fossil fuels from the
Earth, refining them, and transporting them to the gas station pump or to the point-of-use (POU).
These are referred to as the “Well-to-Pump” or “Well-to-POU” emissions. The difference
between these two types of emissions is that the Well-to-Pump emissions have included within
them the average distance to gas stations from oil refineries. The Well-to-POU emissions have
an additional distance included within them that is an average distance to deliver the fuel its
point of use. In general, the Well-to-POU fuel is used for engines that are either stationary (e.g.
a wind turbine at an apple farm), or do not fill up at a gas station (e.g. trains, container ships,
fishing boats).
10 ISO, 1997.

4
For the salmon, the fishing activities included in this study are the burning of diesel fuel in a
fishing boat as well as the Well-to-Pump and Well-to-POU emissions. The sources of emissions
for the farmed salmon include the production, delivery, and use of fish feed.
For the transportation of the food, the emissions for the Well-to-Pump and Well-to-POU of the
needed fuels, as well as the emissions associated with burning these fuels in various modes of
transport (light-truck, semi-truck, rail, and container ship) is included in this study.
Not included in the scope of this study are the greenhouse gas emissions associated with the
manufacturing of farm equipment, farm buildings, vehicles used for transportation, or the
distribution and retail buildings. Simply stated, we are not including the production of the
vehicles, buildings, roads, or any infrastructure in this study. Also, we are not examining
emissions related to wholesaling, retailing, packaging materials, the consumer’s food
preparation, or waste treatment. Furthermore, greenhouse gases are the only environmental
impact examined in this study. We are not looking at other environmental impacts associated
with farming, such as water use, energy use, runoff of farm effluent, land use, or the use of
human labor.
Identification of criteria for inclusion of inputs and outputs
To determine which data categories are important to this study, we studied typical farm practices
from various sources. We examined the publications from the United States Department of
Agriculture (USDA) such as the Fruit and Vegetable Agricultural Practices – 199911 and the
Agricultural Chemical Usage: 2005 Fruit Summary12 to identify chemical application and
machine use that will contribute to the emission of GHGs during apple cultivation. Various
publications from Washington State University were useful in determining the fuel use at farms.
Contacts with state commissions for apples, asparagus, and potatoes were useful in verifying
typical farm practices.
11 USDA, 2001. 12 USDA, 2006b.

5
Identification of the data categories/impact assessment methodology
Data will be collected from databases, published reports, and other sources. Information was
gathered from the United States Department of Agriculture, published journal articles, websites,
the United States Environmental Protection Agency, and from the Greenhouse Gases,
Regulated Emissions, and Energy use in Transportation (GREET). Table 1 shows the data
categories defined and collected to complete the study. A detailed description of the sources
used in this study can be found in the Appendix and the References.
Data Categories Components Units
Fertilizers (Nitrogen, Phosphate,
and Potash)
Pounds/acre
Herbicide Pounds/acre
Raw Materials
Insecticide Pounds/acre
Farm equipment Annual hours/acre
Farm equipment Fuel use/hour
Equipment
Fuel use British Thermal Units
Carbon Dioxide (CO2) Grams
Methane (CH4) Grams
Environmental
(Greenhouse Gas
Emissions) Nitrous Oxide (N20) Grams
Distance Kilogram-Kilometer Transportation
Fuel Use British Thermal Units
Table 1. Data categories used in this study.
Impact Assessment – Global Warming Potential
The three main greenhouse gases (carbon dioxide, CO2, methane, CH4, and nitrous oxide N2O)
are quantified in this study. However, these three gases possess different abilities to influence
the climate, so we have converted them to a common scale so that they are comparable. The
scale in common use is to convert all of the gases into grams of carbon dioxide equivalent.
6
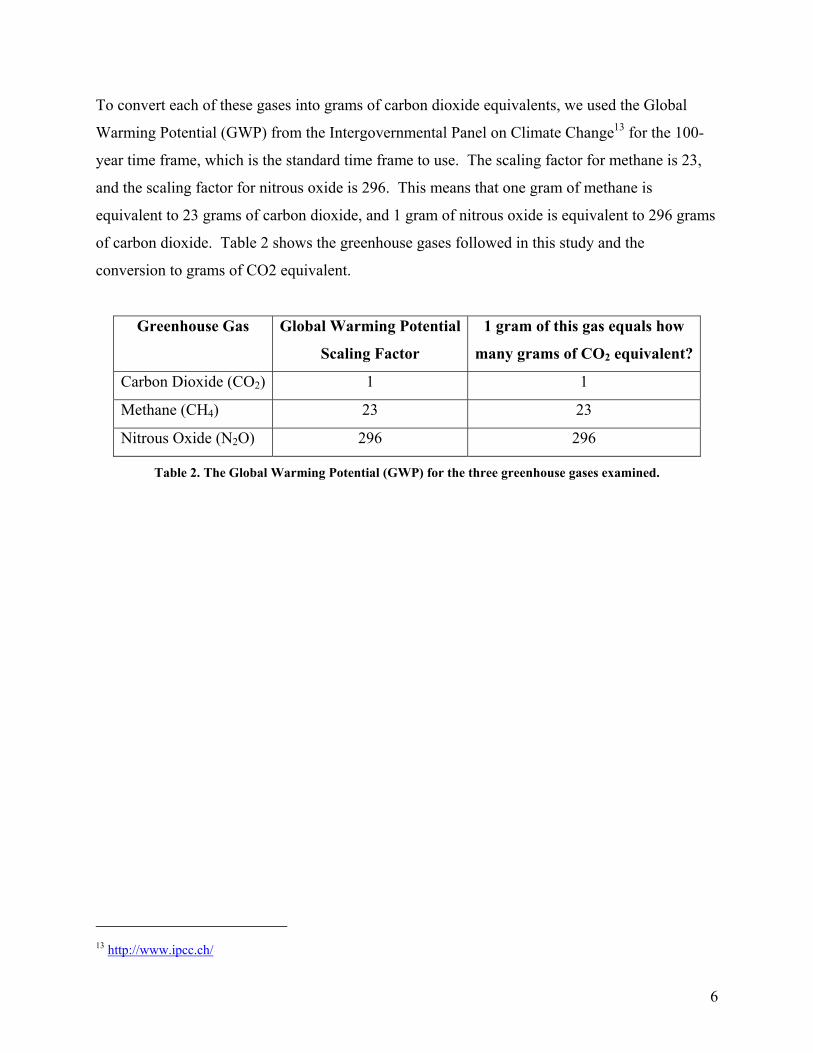
To convert each of these gases into grams of carbon dioxide equivalents, we used the Global
Warming Potential (GWP) from the Intergovernmental Panel on Climate Change13 for the 100-
year time frame, which is the standard time frame to use. The scaling factor for methane is 23,
and the scaling factor for nitrous oxide is 296. This means that one gram of methane is
equivalent to 23 grams of carbon dioxide, and 1 gram of nitrous oxide is equivalent to 296 grams
of carbon dioxide. Table 2 shows the greenhouse gases followed in this study and the
conversion to grams of CO2 equivalent.
Greenhouse Gas Global Warming Potential
Scaling Factor
1 gram of this gas equals how
many grams of CO2 equivalent?
Carbon Dioxide (CO2) 1 1
Methane (CH4) 23 23
Nitrous Oxide (N2O) 296 296
Table 2. The Global Warming Potential (GWP) for the three greenhouse gases examined.
13 http://www.ipcc.ch/

7
RESULTS
GUIDE TO RESULTS
The results of the LCA for each plate of food are shown in the following pages. First we present
the findings for the local and imported plates, and then we present the results for each individual
food item. The general format for the results is to show the findings for the local plate or food
item, then the imported plate or item, then present the findings for organic farming techniques
(when possible), and then compare all of the emissions scenarios. An attempt was made to make
these sections as independent readings, so some information contained within this section is
repeated in other sections of this paper.
In order to assess which processes emit the most greenhouse gases, the contributions from each
process was calculated. These are shown in the following pages under the “Cultivation” section.
For simplification, the sources of emissions were categorized into three sources: Chemical
Production, Fuel Used at Farm/Boat, and Fuel Used in Transportation.
“Chemical Production” includes the production and delivery of fertilizers (nitrogen, phosphate,
and potash), herbicides, and insecticides, as well as the emissions from the fields that are emitted
after these chemicals are applied. “Fuel Used at Farm/Boat” includes the burning of diesel,
gasoline, and/or propane at the farm to perform farm activities, or on the fishing boat for fishing
activities. The specific activities modeled for each farm can be found in the Appendix. Included
in this category are the emissions associated with extracting the fossil fuels, refining them,
delivering them to the gas station pump or to the point-of-use at the farm/boat. “Fuel Used in
Transportation” includes the burning of gasoline, diesel, non-road diesel (for rail transport),
and/or bunker fuel (for container ship transport) to deliver the food to Seattle. Included in this
category are the emissions attributable to extracting the fossil fuels, refining them, delivering
them to the gas station pump or to the point-of-use for the transportation vehicles.
8
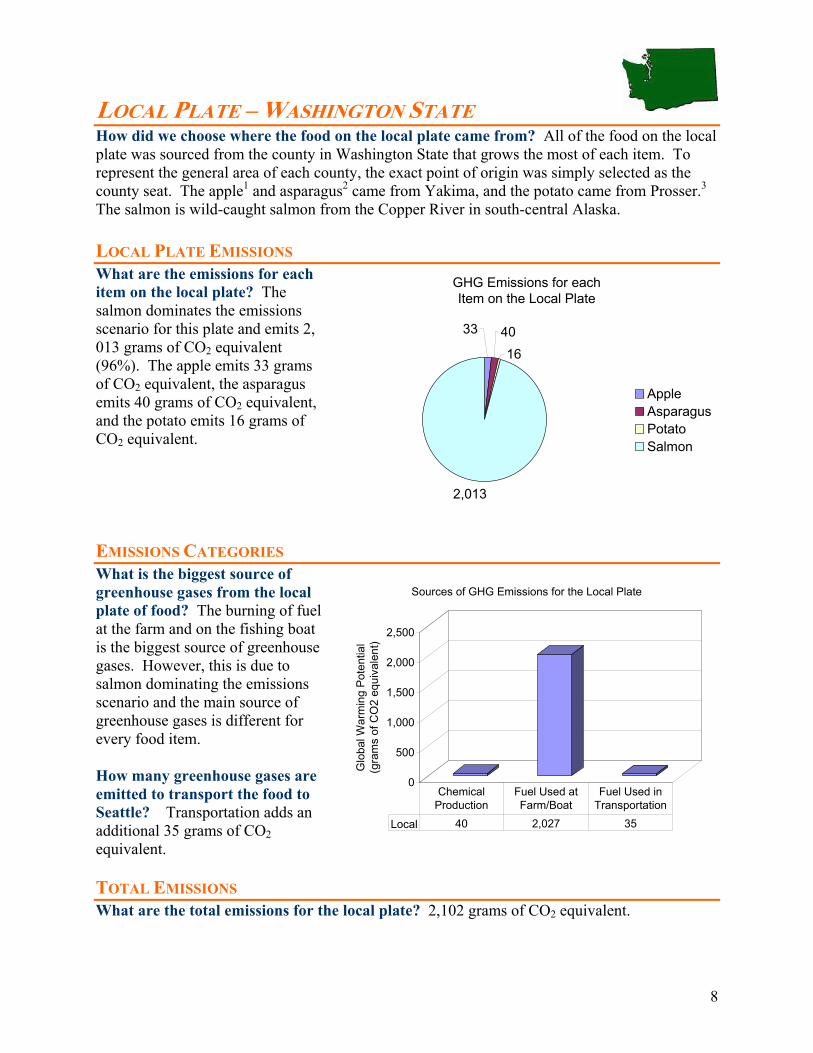
LOCAL PLATE – WASHINGTON STATE How did we choose where the food on the local plate came from? All of the food on the local plate was sourced from the county in Washington State that grows the most of each item. To represent the general area of each county, the exact point of origin was simply selected as the county seat. The apple1 and asparagus2 came from Yakima, and the potato came from Prosser.3 The salmon is wild-caught salmon from the Copper River in south-central Alaska. LOCAL PLATE EMISSIONS What are the emissions for each item on the local plate? The salmon dominates the emissions scenario for this plate and emits 2, 013 grams of CO2 equivalent (96%). The apple emits 33 grams of CO2 equivalent, the asparagus emits 40 grams of CO2 equivalent, and the potato emits 16 grams of CO2 equivalent. EMISSIONS CATEGORIES What is the biggest source of greenhouse gases from the local plate of food? The burning of fuel at the farm and on the fishing boat is the biggest source of greenhouse gases. However, this is due to salmon dominating the emissions scenario and the main source of greenhouse gases is different for every food item. How many greenhouse gases are emitted to transport the food to Seattle? Transportation adds an additional 35 grams of CO2 equivalent. TOTAL EMISSIONS What are the total emissions for the local plate? 2,102 grams of CO2 equivalent.
GHG Emissions for each Item on the Local Plate
4016
2,013
33
AppleAsparagusPotatoSalmon
0
500
1,000
1,500
2,000
2,500
Glo
bal W
arm
ing
Pote
ntia
l (g
ram
s of
CO
2 eq
uiva
lent
)
Sources of GHG Emissions for the Local Plate
Local 40 2,027 35
Chemical Production
Fuel Used at Farm/Boat
Fuel Used in Transportation

9
IMPORTED PLATE – NEW ZEALAND, PERU, IDAHO, NORWAY How did we choose where the food on the local plate came from? Most of the food on the imported plate was sourced from the country that the US imports the most from. The apple came from Hawkes Bay, New Zealand,4 the asparagus will come from Ica, Peru,5 and the potato will come from Blackfoot, Idaho because the US does not import many potatoes and Bingham County, ID is the largest potato producing county outside of Washington State.6 The imported salmon will be farm-raised Norwegian salmon.7 LOCAL PLATE EMISSIONS What are the emissions for each item on the local plate? The salmon also dominates the emissions scenario for this plate and emits 2, 927 grams of CO2 equivalent (95%). The apple emits 70 grams of CO2 equivalent, the asparagus emits 49 grams of CO2 equivalent, and the potato emits 40 grams of CO2 equivalent. EMISSIONS CATEGORIES What is the biggest source of greenhouse gases from the imported plate of food? The burning of fuel at the farm and on the fishing boat is the biggest source of greenhouse gases. However, this is due to salmon dominating the emissions scenario and the main source of greenhouse gases is different for every food item. How many greenhouse gases are emitted to transport the food to Seattle? Transportation adds an additional 213 grams of CO2 equivalent. TOTAL EMISSIONS What are the total emissions for the imported plate? 3,083 grams of CO2 equivalent.
0
500
1,000
1,500
2,000
2,500
3,000
Glo
bal W
arm
ing
Pote
ntia
l (g
ram
s of
CO
2 eq
uiva
lent
)
Sources of GHG Emissions for the Imported Plate
Imported 31 2,841 210
Chemical Production
Fuel Used at Farm/Boat
Fuel Used in Transportation
GHG Emissions for each Item on the Imported Plate
4640
2,927
70
AppleAsparagusPotatoSalmon

10
COMPARISON OF GLOBAL WARMING POTENTIAL
Plate
2,102
3,083
0
1,000
2,000
3,000
4,000
Glo
bal W
arm
ing
Pote
ntia
l (g
ram
s of
CO
2 eq
uiva
lent
)
Total Global Warming Potential for Each Plate
LocalImported
ANALYSIS The total greenhouse gas emissions for the local plate are about 33% less than the total emissions for the imported plate. The majority of the total savings comes from the wild-caught salmon. However, every item shows a slightly different story when comparing the local and imported items. For example, the local apple and potato emits less than half of the emissions that the imported apple and potato do, while the local asparagus shows only a 20% benefit over the imported asparagus. The salmon also dominate the source of the emissions in this analysis. Fuel used on the fishing boats to catch the wild salmon and the emissions from producing, delivering, and administering the fish feed at the fish farm in Norway are between 80-90% of the total emissions for the
33 70 40 46 16 40
2,013
2,927
0
500
1000
1500
2000
2500
3000
Glo
bal W
arm
ing
Pote
ntia
l (g
ram
s of
CO
2 eq
uiva
lent
)
Apple Asparagus Potato Salmon
Global Warming Potential for Each Item
LocalImported
11
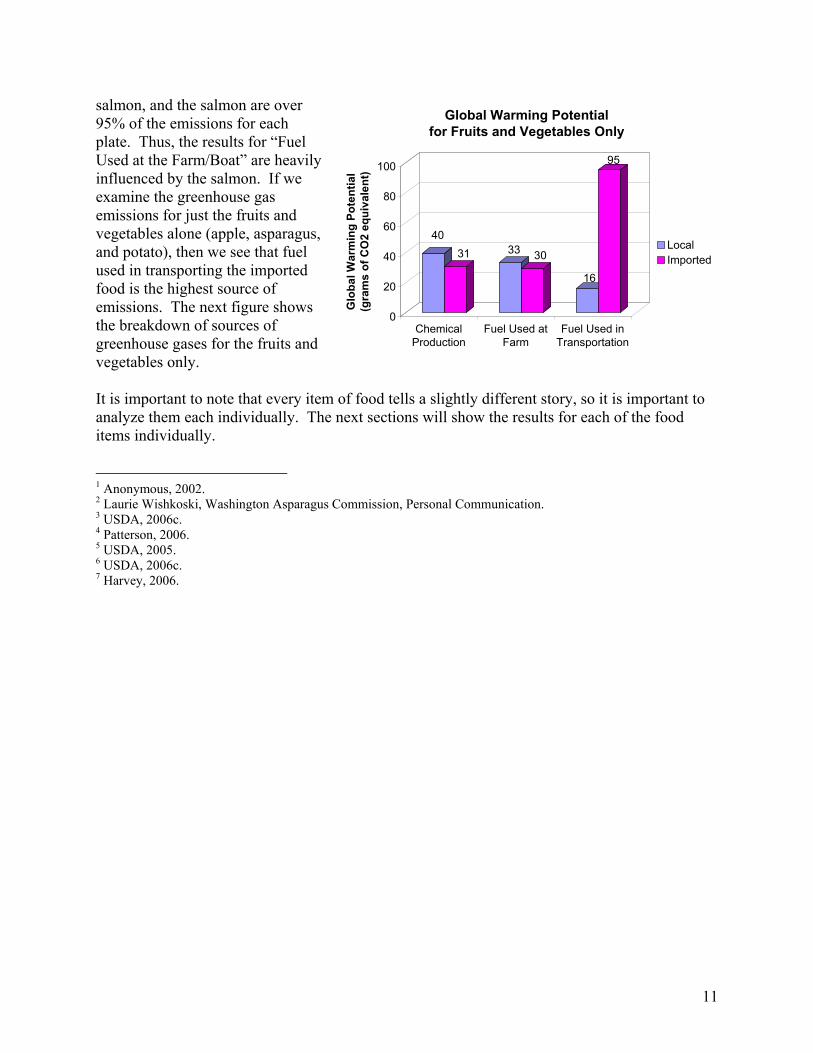
salmon, and the salmon are over 95% of the emissions for each plate. Thus, the results for “Fuel Used at the Farm/Boat” are heavily influenced by the salmon. If we examine the greenhouse gas emissions for just the fruits and vegetables alone (apple, asparagus, and potato), then we see that fuel used in transporting the imported food is the highest source of emissions. The next figure shows the breakdown of sources of greenhouse gases for the fruits and vegetables only. It is important to note that every item of food tells a slightly different story, so it is important to analyze them each individually. The next sections will show the results for each of the food items individually. 1 Anonymous, 2002. 2 Laurie Wishkoski, Washington Asparagus Commission, Personal Communication. 3 USDA, 2006c. 4 Patterson, 2006. 5 USDA, 2005. 6 USDA, 2006c. 7 Harvey, 2006.
4031 33 30
16
95
0
20
40
60
80
100
Glo
bal W
arm
ing
Pote
ntia
l (g
ram
s of
CO
2 eq
uiva
lent
)
ChemicalProduction
Fuel Used atFarm
Fuel Used inTransportation
Global Warming Potential for Fruits and Vegetables Only
LocalImported
12
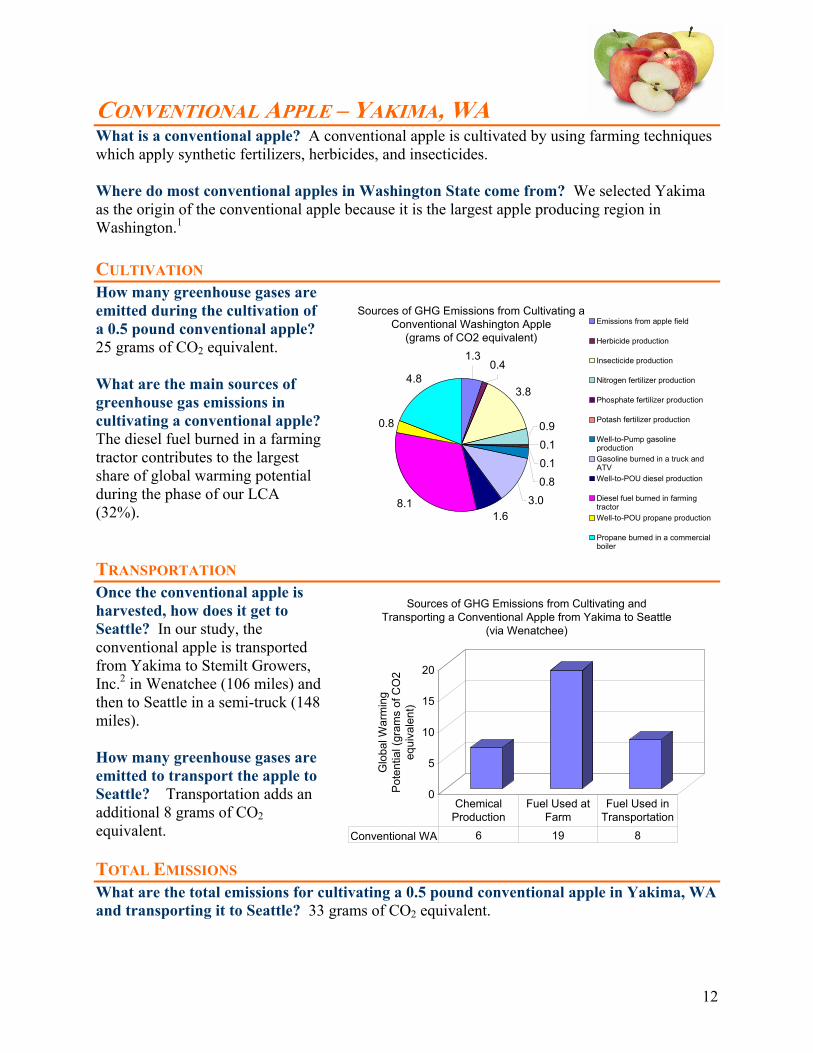
CONVENTIONAL APPLE – YAKIMA, WA What is a conventional apple? A conventional apple is cultivated by using farming techniques which apply synthetic fertilizers, herbicides, and insecticides. Where do most conventional apples in Washington State come from? We selected Yakima as the origin of the conventional apple because it is the largest apple producing region in Washington.1 CULTIVATION How many greenhouse gases are emitted during the cultivation of a 0.5 pound conventional apple? 25 grams of CO2 equivalent. What are the main sources of greenhouse gas emissions in cultivating a conventional apple? The diesel fuel burned in a farming tractor contributes to the largest share of global warming potential during the phase of our LCA (32%). TRANSPORTATION Once the conventional apple is harvested, how does it get to Seattle? In our study, the conventional apple is transported from Yakima to Stemilt Growers, Inc.2 in Wenatchee (106 miles) and then to Seattle in a semi-truck (148 miles). How many greenhouse gases are emitted to transport the apple to Seattle? Transportation adds an additional 8 grams of CO2 equivalent. TOTAL EMISSIONS What are the total emissions for cultivating a 0.5 pound conventional apple in Yakima, WA and transporting it to Seattle? 33 grams of CO2 equivalent.
Sources of GHG Emissions from Cultivating a Conventional Washington Apple
(grams of CO2 equivalent)
3.8
0.90.10.10.8
3.01.6
8.1
0.8
4.80.4
1.3
Emissions from apple field
Herbicide production
Insecticide production
Nitrogen fertilizer production
Phosphate fertilizer production
Potash fertilizer production
Well-to-Pump gasolineproductionGasoline burned in a truck andATVWell-to-POU diesel production
Diesel fuel burned in farmingtractorWell-to-POU propane production
Propane burned in a commercialboiler
0
5
10
15
20
Glo
bal W
arm
ing
Pot
entia
l (gr
ams
of C
O2
equi
vale
nt)
Sources of GHG Emissions from Cultivating and Transporting a Conventional Apple from Yakima to Seattle
(via Wenatchee)
Conventional WA 6 19 8
Chemical Production
Fuel Used at Farm
Fuel Used in Transportation

13
IMPORTED APPLE – HAWKES BAY, NEW ZEALAND Where do most imported apples into the US come from? The US imports the most apples from New Zealand, and the Hawkes Bay region on the north island is the largest apple producing region in New Zealand.3 CULTIVATION How many greenhouse gases are emitted during the cultivation of a 0.5 pound conventional apple in New Zealand? 28 grams of CO2 equivalent. How is this different from cultivating an apple in Washington State? The yield of apples harvested per acre of land in New Zealand is 33,300 pounds of apples per acre,4 while in Washington the average yield is 34,200 pounds of apples per acre.5 It is assumed that fuel use and chemical use (fertilizers, herbicides, insecticides) at an apple farm in New Zealand are the same as fuel and chemical used at an average apple farm in the US. TRANSPORTATION Once the imported apple is harvested, how does it get to Seattle? The apple is grown in Hawkes Bay, NZ and shipped on a refrigerated semi-truck to Auckland (263 miles). From Auckland, the apple is shipped on a refrigerated container ship from Auckland to Seattle (6,183 nautical miles). How many greenhouse gases are emitted to transport the apple to Seattle? Transportation adds an additional 42 grams of CO2 equivalent. TOTAL EMISSIONS What are the total emissions for cultivating a 0.5 pound conventional apple in Hawkes Bay, NZ and transporting it to Seattle? 70 grams of CO2 equivalent.
Sources of GHG Emissions from Cultivating a Conventional New Zealand Apple
(grams of CO2 equivalent)
1.20.4
4.3
1.10.20.20.8
3.1
1.8
8.3
0.9
4.9
Emissions from apple field
Herbicide production
Insecticide production
Nitrogen fertilizer production
Phosphate fertilizer production
Potash fertilizer production
Well-to-Pump gasolineproductionGasoline burned in a truck andATVWell-to-POU diesel production
Diesel fuel burned in farmingtractorWell-to-POU propane production
Propane burned in a commercialboiler
0
10
20
30
40
50
Glo
bal W
arm
ing
Pot
entia
l (gr
ams
of C
O2
equi
vale
nt)
Sources of GHG Emissions from Cultivating and Transporting a Conventional Apple from Hawkes Bay, NZ to
Seattle (via Auckland)
Conventional NZ 8 20 42
Chemical Production
Fuel Used at Farm
Fuel Used in Transportation

14
ORGANIC APPLE – YAKIMA, WA What is an organic apple? An organic apple is cultivated using farming methods which avoid the use of synthetic chemicals, but does use approved organic fertilizers, such as poultry manure. CULTIVATION How many greenhouse gases are emitted during the cultivation of a 0.5 pound organic apple? 21 grams of CO2 equivalent. How is this different from cultivating a conventional apple? It is assumed that the amount of fuel used to run the farm equipment is the same for an organic apple farm as they are for a conventional apple farm.6 It is also assumed that the yield of apples per acre at an organic farm is 90% as much as it is at a conventional farm,7 so the yield of organic apples in this study is set at 30,800 pounds per acre. TRANSPORTATION Once the organic apple is harvested, how does it get to Seattle? The organic apple is transported to Seattle for sale at a farmer’s market in a light-truck. How many greenhouse gases are emitted to transport the apple to Seattle? Transportation adds an additional 8 grams of CO2 to the atmosphere. A light-truck is not as fuel efficient as a semi-truck, so the emissions for transporting an apple to Seattle from Yakima in a light-truck are the same as they are for transporting an apple from Yakima to Wenatchee and then to Seattle in a semi-truck. TOTAL EMISSIONS What are the total emissions for cultivating a 0.5 pound organic apple in Yakima, WA and transporting it to Seattle? 29 grams of CO2 equivalent.
0
5
10
15
20
25
Glo
bal W
arm
ing
Pote
ntia
l (gr
ams
of C
O2
equi
vale
nt)
Sources of GHG Emissions from Cultivating and Transporting an Organic Apple from Yakima to Seattle
Organic WA 21 8
Fuel Used at Farm Fuel Used in Transportation
Sources of GHG Emissions from Cultivating an Organic Washington Apple (grams of CO2 equivalent)
0.8
3.3
1.8
9.0
0.9
5.3
0.6 Emissions from applefieldWell-to-Pumpgasoline productionGasoline burned in atruck and ATVWell-to-POU dieselproductionDiesel fuel burned infarming tractorWell-to-POU propaneproductionPropane burned in acommercial boiler

15
COMPARISON OF GLOBAL WARMING POTENTIAL
2933
70
0
10
20
30
40
50
60
70
Glo
bal W
arm
ing
Pot
entia
l (g
ram
s of
CO
2 eq
uiva
lent
)
Apple
Total Emissions for all Three Apple Sources
Organic WA Conventional WA Conventional NZ
ANALYSIS The locally grown apples show a significant savings of greenhouse gas emissions over the imported apple from New Zealand. The majority of these savings are a direct result of the extra cost of transporting the apple from New Zealand to Seattle, though there is some savings from the higher yield of apples per acre in Washington over New Zealand. The benefits seen from the organic apple versus the conventional apple are small because the organic yields are lower than the conventional yields, and because chicken manure is still applied to most organic apple farms and there are significant nitrous oxides from this type of manure. 1 Anonymous, 2002. 2 John Reganold, Washington State University, personal communication, 3/2/2007. 3 Patterson, 2006. 4 Ibid. 5 USDA, 2006a. 6 David Granatstein, Washington State University, personal communication, 2/26/2007. 7 Ibid.

16
CONVENTIONAL ASPARAGUS – YAKIMA, WA What is a conventional asparagus? Conventional asparagus is cultivated by using farming techniques which apply synthetic fertilizers, herbicides, and insecticides. Where does most conventional asparagus in Washington State come from? Yakima is the largest asparagus producing region in the state, so Yakima is the origin of the asparagus.1 CULTIVATION How many greenhouse gases are emitted during the cultivation of a 0.25 pound conventional asparagus? 38 grams of CO2 equivalent. What are the main sources of greenhouse gas emissions in cultivating a conventional asparagus? The emissions from the asparagus field contribute the largest share of global warming potential (33%). This is due to the nitrogen fertilizers applied to the asparagus fields, which results in the emission of nitrous oxide. TRANSPORTATION Once the conventional asparagus is harvested, how does it get to Seattle? The asparagus is brought by semi-truck directly to Seattle where it is taken to a distributor where it is washed, sorted, and packed.2 This direct shipping method emits few greenhouse gases. How many greenhouse gases are emitted to transport the asparagus to Seattle? Transportation adds an additional 2 grams of CO2 equivalent. TOTAL EMISSIONS What are the total emissions for cultivating 0.25 pounds of conventional asparagus in Yakima, WA and transporting it to Seattle? 42 grams of CO2 equivalent.
Sources of GHG Emissions from Cultivating Conventional Washington Asparagus
(grams of CO2 equivalent)
12.5
1.21.2
9.3
0.90.8
1.4
5.7
0.73.7
Emissions from asparagus field
Herbicide production
Insecticide production
Nitrogen fertilizer production
Phosphate fertilizer production
Potash fertilizer production
Well-to-Pump gasolineproductionGasoline burned in pickup truck
Well-to-POU diesel production
Diesel fuel burned in farmingtractor
0
5
10
15
20
25
30
Glo
bal W
arm
ing
Pot
entia
l (gr
ams
of C
O2
equi
vale
nt)
Sources of GHG Emissions from Cultivating and Transporting Conventional Asparagus
from Yakima to Seattle
Conventional WA 26 12 2
Chemical Production
Fuel Used at Farm
Fuel Used in Transportation

17
IMPORTED ASPARAGUS – ICA, PERU Where does the US import the most asparagus from? The US imports the most asparagus from Peru, and Ica, Peru produces the most green asparagus for fresh export in Peru.3 CULTIVATION How many greenhouse gases are emitted during the cultivation of a 0.25 pound conventional asparagus in New Zealand? 17 grams of CO2 equivalent. How is this different from cultivating an asparagus in Washington State? The yield of asparagus harvested per acre of land in Peru is 9,200 pounds of asparagus per acre because they grow asparagus year-round there.4 In Washington the average yield is only 3,900 pounds of asparagus per acre5. It is assumed that fuel use and chemical use (fertilizers, herbicides, insecticides) at an asparagus farm in Peru is the same as fuel and chemical use at an average asparagus farm in the US. This is a weak assumption given that asparagus operations are year-round in Peru. TRANSPORTATION Once the imported asparagus is harvested, how does it get to Seattle? The asparagus is grown in Ica, Peru and shipped on a refrigerated semi-truck to Lima (186 miles). The port in Lima is Callao, and from Callao the asparagus is shipped on a refrigerated container ship to Seattle (6,183 nautical miles). How many greenhouse gases are emitted to transport the asparagus to Seattle? Transportation adds an additional 32 grams of CO2 equivalent. TOTAL EMISSIONS What are the total emissions for cultivating 0.25 pounds of conventional asparagus in Ica, Peru and transporting it to Seattle? 46 grams of CO2 equivalent.
Sources of GHG Emissions from Cultivating Conventional Peruvian Asparagus (grams of CO2 equivalent)
4.5
0.9
0.7
3.70.8
0.9
0.7
2.4
0.31.6
Emissions from asparagus field
Herbicide production
Insecticide production
Nitrogen fertilizer production
Phosphate fertilizer production
Potash fertilizer production
Well-to-Pump gasolineproductionGasoline burned in pickup truck
Well-to-POU diesel production
Diesel fuel burned in farmingtractor
0
5
10
15
20
25
30
Glo
bal W
arm
ing
Pot
entia
l (gr
ams
of C
O2
equi
vale
nt)
Sources of GHG Emissions from Cultivating and Transporting Conventional Asparagus from Ica, Peru to
Seattle (via Lima, Peru)
Conventional Peru 12 5 29
Chemical Production
Fuel Used at Farm
Fuel Used in Transportation

18
ORGANIC ASPARAGUS – YAKIMA, WA What is an organic asparagus? Organic asparagus is cultivated using farming methods which avoid the use of synthetic chemicals. In this study, no fertilizers, herbicides, or insecticides are applied to the organic asparagus farm. CULTIVATION How many greenhouse gases are emitted during the cultivation of 0.25 pounds of organic asparagus? 12 grams of CO2 equivalent. How is this different from cultivating a conventional asparagus? It is assumed that the yield of asparagus per acre at an organic farm is the same as it is for a conventional farm. It is also assumed that the amount of fuel used to run the farm equipment is the same at an organic asparagus farm as it is for a conventional asparagus farm.6 TRANSPORTATION Once the organic asparagus is harvested, how does it get to Seattle? The organic asparagus is transported to Seattle for sale at a farmer’s market in a light-truck. How many greenhouse gases are emitted to transport the asparagus to Seattle? Transportation adds an additional 3 grams of CO2 equivalent to the atmosphere. A light-truck is not as fuel efficient as a semi-truck, so the emissions are higher for transporting organic asparagus directly to Seattle than they are for transporting conventional asparagus directly to Seattle. TOTAL EMISSIONS What are the total emissions for cultivating 0.25 pounds of organic asparagus in Yakima, WA and transporting it to Seattle? 15 grams of CO2 equivalent.
Sources of GHG Emissions from Cultivating Organic Asparagus (grams of CO2 equivalent)
1.4
5.70.7
3.7 Well-to-Pumpgasoline productionGasoline burned inpickup truckWell-to-POU dieselproductionDiesel fuel burned infarming tractor
0
2
4
6
8
10
12
Glo
bal W
arm
ing
Pote
ntia
l (gr
ams
of C
O2
equi
vale
nt)
Sources of GHG Emissions from Cultivating and Transporting Organic Asparagus from Yakima to Seattle
Organic WA 12 3
Fuel Used at Farm Fuel Used in Transportation
19
COMPARISON OF GLOBAL WARMING POTENTIAL
15
40
46
0
10
20
30
40
50
Glo
bal W
arm
ing
Pot
entia
l (g
ram
s of
CO
2 eq
uiva
lent
)
Asparagus
Total Emissions for all Three Asparagus Sources
Organic WA Conventional WA Conventional Peru
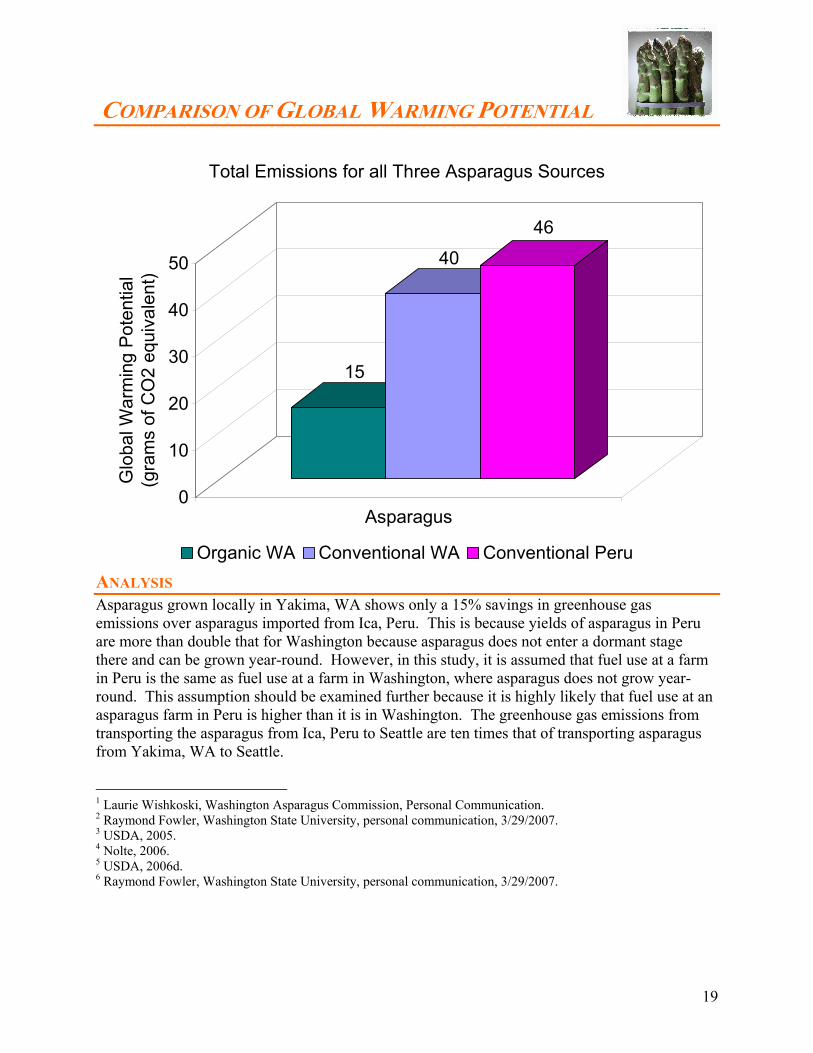
ANALYSIS Asparagus grown locally in Yakima, WA shows only a 15% savings in greenhouse gas emissions over asparagus imported from Ica, Peru. This is because yields of asparagus in Peru are more than double that for Washington because asparagus does not enter a dormant stage there and can be grown year-round. However, in this study, it is assumed that fuel use at a farm in Peru is the same as fuel use at a farm in Washington, where asparagus does not grow year-round. This assumption should be examined further because it is highly likely that fuel use at an asparagus farm in Peru is higher than it is in Washington. The greenhouse gas emissions from transporting the asparagus from Ica, Peru to Seattle are ten times that of transporting asparagus from Yakima, WA to Seattle. 1 Laurie Wishkoski, Washington Asparagus Commission, Personal Communication. 2 Raymond Fowler, Washington State University, personal communication, 3/29/2007. 3 USDA, 2005. 4 Nolte, 2006. 5 USDA, 2006d. 6 Raymond Fowler, Washington State University, personal communication, 3/29/2007.

20
CONVENTIONAL POTATO – PROSSER, WA What is a conventional potato? A conventional potato is cultivated by using farming techniques which apply synthetic fertilizers, herbicides, and insecticides. Where do most conventional potatoes in Washington State come from? Benton County is the largest potato producing county in the country1, so we selected Prosser as the origin of the conventional potato because it is the seat of Benton County. CULTIVATION How many greenhouse gases are emitted during the cultivation of a 0.5 pound conventional potato? 10 grams of CO2 equivalent. What are the main sources of greenhouse gas emissions in cultivating a conventional potato? The emissions from producing the nitrogen fertilizer and the nitrous oxide emissions from the potato field are the largest sources of greenhouse gases at a potato farm. TRANSPORTATION Once the conventional potato is harvested, how does it get to Seattle? The potato is brought by semi-truck directly to Seattle (199 miles) where it is taken to a distributor where it is washed, sorted, and packed.2 How many greenhouse gases are emitted to transport the potato to Seattle? Transportation adds an additional 6 grams of CO2 equivalent. TOTAL EMISSIONS What are the total emissions for cultivating a 0.5 pound conventional potato in Prosser, WA and transporting it to Seattle? 16 grams of CO2 equivalent.
0
2
4
6
8
Glo
bal W
arm
ing
Pot
entia
l (gr
ams
of C
O2
equi
vale
nt)
Sources of GHG Emissions from Cultivating and Transporting a Conventional Potato from Prosser, WA to
Seattle
Conventional WA 7 3 6
Chemical Production
Fuel Used at Farm
Fuel Used in Transportation
Sources of GHG Emissions from Cultivating a Conventional Washington Potato (grams of CO2 equivalent)
3.3
0.10.2
2.50.6
0.40.10.30.4
2.0
Emissions from potato field
Herbicide production
Insecticide production
Nitrogen fertilizer production
Phosphate fertilizer production
Potash fertilizer production
Well-to-Pump gasolineproductionGasoline burned in pickup truck
Well-to-POU diesel production
Diesel fuel burned in farmingtractor
21
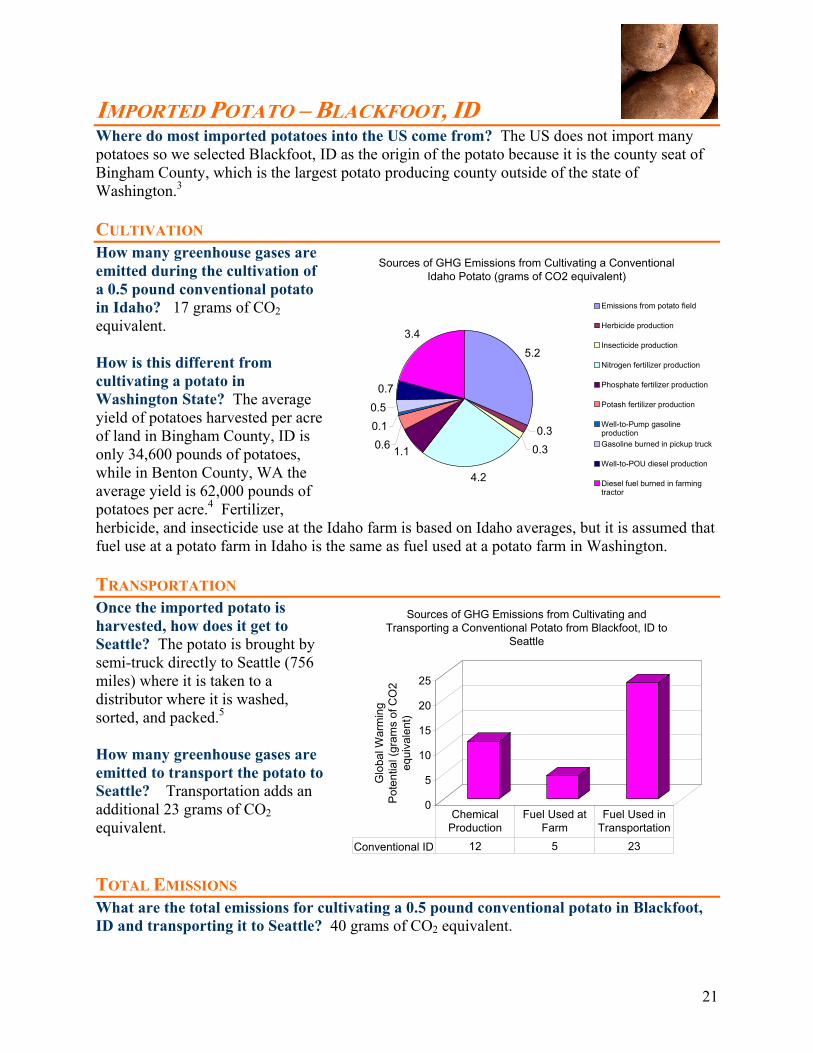
IMPORTED POTATO – BLACKFOOT, ID Where do most imported potatoes into the US come from? The US does not import many potatoes so we selected Blackfoot, ID as the origin of the potato because it is the county seat of Bingham County, which is the largest potato producing county outside of the state of Washington.3 CULTIVATION How many greenhouse gases are emitted during the cultivation of a 0.5 pound conventional potato in Idaho? 17 grams of CO2 equivalent. How is this different from cultivating a potato in Washington State? The average yield of potatoes harvested per acre of land in Bingham County, ID is only 34,600 pounds of potatoes, while in Benton County, WA the average yield is 62,000 pounds of potatoes per acre.4 Fertilizer, herbicide, and insecticide use at the Idaho farm is based on Idaho averages, but it is assumed that fuel use at a potato farm in Idaho is the same as fuel used at a potato farm in Washington. TRANSPORTATION Once the imported potato is harvested, how does it get to Seattle? The potato is brought by semi-truck directly to Seattle (756 miles) where it is taken to a distributor where it is washed, sorted, and packed.5 How many greenhouse gases are emitted to transport the potato to Seattle? Transportation adds an additional 23 grams of CO2 equivalent. TOTAL EMISSIONS What are the total emissions for cultivating a 0.5 pound conventional potato in Blackfoot, ID and transporting it to Seattle? 40 grams of CO2 equivalent.
Sources of GHG Emissions from Cultivating a Conventional Idaho Potato (grams of CO2 equivalent)
5.2
0.30.3
4.2
1.10.60.10.5
0.7
3.4
Emissions from potato field
Herbicide production
Insecticide production
Nitrogen fertilizer production
Phosphate fertilizer production
Potash fertilizer production
Well-to-Pump gasolineproductionGasoline burned in pickup truck
Well-to-POU diesel production
Diesel fuel burned in farmingtractor
0
5
10
15
20
25
Glo
bal W
arm
ing
Pot
entia
l (gr
ams
of C
O2
equi
vale
nt)
Sources of GHG Emissions from Cultivating and Transporting a Conventional Potato from Blackfoot, ID to
Seattle
Conventional ID 12 5 23
Chemical Production
Fuel Used at Farm
Fuel Used in Transportation
22
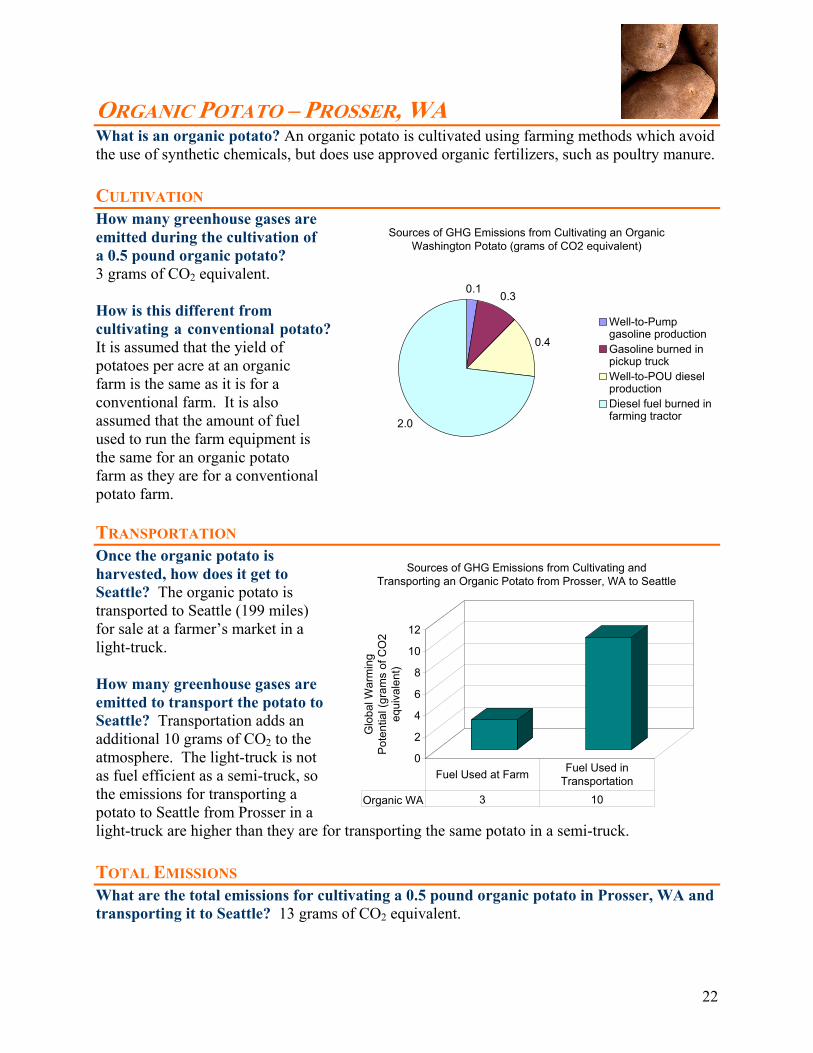
ORGANIC POTATO – PROSSER, WA What is an organic potato? An organic potato is cultivated using farming methods which avoid the use of synthetic chemicals, but does use approved organic fertilizers, such as poultry manure. CULTIVATION How many greenhouse gases are emitted during the cultivation of a 0.5 pound organic potato? 3 grams of CO2 equivalent. How is this different from cultivating a conventional potato? It is assumed that the yield of potatoes per acre at an organic farm is the same as it is for a conventional farm. It is also assumed that the amount of fuel used to run the farm equipment is the same for an organic potato farm as they are for a conventional potato farm. TRANSPORTATION Once the organic potato is harvested, how does it get to Seattle? The organic potato is transported to Seattle (199 miles) for sale at a farmer’s market in a light-truck. How many greenhouse gases are emitted to transport the potato to Seattle? Transportation adds an additional 10 grams of CO2 to the atmosphere. The light-truck is not as fuel efficient as a semi-truck, so the emissions for transporting a potato to Seattle from Prosser in a light-truck are higher than they are for transporting the same potato in a semi-truck. TOTAL EMISSIONS What are the total emissions for cultivating a 0.5 pound organic potato in Prosser, WA and transporting it to Seattle? 13 grams of CO2 equivalent.
Sources of GHG Emissions from Cultivating an Organic Washington Potato (grams of CO2 equivalent)
0.10.3
0.4
2.0
Well-to-Pumpgasoline productionGasoline burned inpickup truckWell-to-POU dieselproductionDiesel fuel burned infarming tractor
0
2
4
6
8
10
12
Glo
bal W
arm
ing
Pote
ntia
l (gr
ams
of C
O2
equi
vale
nt)
Sources of GHG Emissions from Cultivating and Transporting an Organic Potato from Prosser, WA to Seattle
Organic WA 3 10
Fuel Used at Farm Fuel Used in Transportation
23
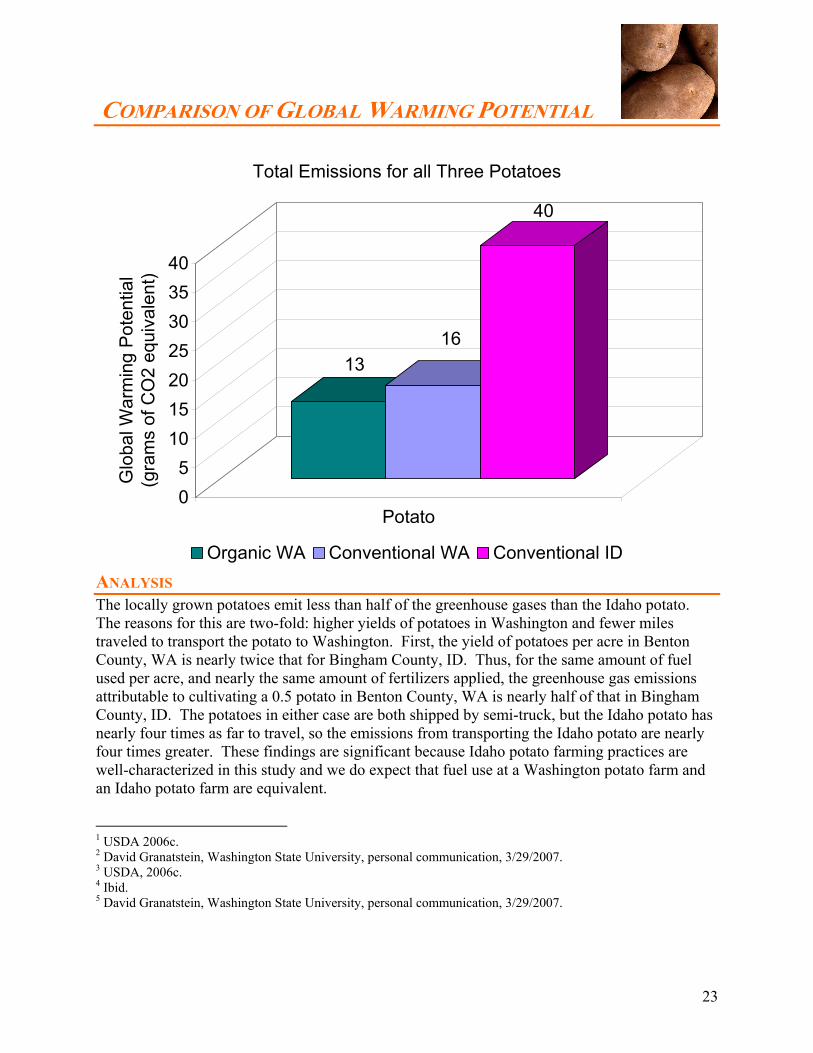
COMPARISON OF GLOBAL WARMING POTENTIAL
1316
40
05
10152025303540
Glo
bal W
arm
ing
Pot
entia
l (g
ram
s of
CO
2 eq
uiva
lent
)
Potato
Total Emissions for all Three Potatoes
Organic WA Conventional WA Conventional ID
ANALYSIS The locally grown potatoes emit less than half of the greenhouse gases than the Idaho potato. The reasons for this are two-fold: higher yields of potatoes in Washington and fewer miles traveled to transport the potato to Washington. First, the yield of potatoes per acre in Benton County, WA is nearly twice that for Bingham County, ID. Thus, for the same amount of fuel used per acre, and nearly the same amount of fertilizers applied, the greenhouse gas emissions attributable to cultivating a 0.5 potato in Benton County, WA is nearly half of that in Bingham County, ID. The potatoes in either case are both shipped by semi-truck, but the Idaho potato has nearly four times as far to travel, so the emissions from transporting the Idaho potato are nearly four times greater. These findings are significant because Idaho potato farming practices are well-characterized in this study and we do expect that fuel use at a Washington potato farm and an Idaho potato farm are equivalent. 1 USDA 2006c. 2 David Granatstein, Washington State University, personal communication, 3/29/2007. 3 USDA, 2006c. 4 Ibid. 5 David Granatstein, Washington State University, personal communication, 3/29/2007.

24
WILD-CAUGHT ALASKA SALMON How are fish caught in Alaska? There are many types of fishing boats used to catch salmon in Alaska, including purse-seiners, trollers, and gillnetters.1 Where did the salmon come from in this study? In this study, the salmon came from the Copper River in south-central Alaska. FISHING FOR WILD SALMON How much fuel is used to catch salmon? In this study, the fuel used to catch salmon is based on a study of Canadian salmon fisheries that examined multiple types of salmon fishing boats and came up with an industry average fuel use of 0.13 gallons of diesel fuel burned per pound of salmon caught.2 How much salmon do you need to make a 0.5 fillet? To make a fillet of fish you need to catch a larger piece of fish that can be cut down into a fillet. The ratio of the weight of fish caught to weight of a fillet is called the fillet factor and we used a fillet factor of 2.3.3 Thus, in order to produce a 0.5 pound fillet, 1.2 pounds of wild salmon needs to be caught. TRANSPORTATION Once the salmon is caught, how does it get to Seattle? The wild-caught salmon is shipped on a refrigerated container ship from Anchorage, AK to Seattle (1,427 nautical miles) for sale at the Pike Place Market. It is assumed that the salmon is filleted in Seattle by the retailer. How many greenhouse gases are emitted to transport the salmon to Seattle? Transportation adds an additional 19 grams of CO2 equivalent. TOTAL EMISSIONS What are the total emissions for catching a wild salmon in the Copper River, AK and transporting the 1.2 pound salmon (for a 0.5 pound fillet) to Seattle? 2,013 grams of CO2 equivalent.
0
500
1,000
1,500
2,000
Glo
bal W
arm
ing
Pote
ntia
l (gr
ams
of C
O2
equi
vale
nt)
Sources of GHG Emissions for Catching and Transporting Wild-Caught Alaska Salmon
Wild-Caught Alaska 1,994 19
Fuel Used by Fishing Boat
Fuel Used in Transportation

25
NORWEGIAN FARMED SALMON – BERGEN, NORWAY Where does the US import the most salmon from? The US imports the most frozen salmon from Norway.4 Bergen, Norway was selected as the origin for the farmed salmon. What are the salmon fed at a fish farm? The salmon in this study are fed a mixture of the four most common fish feeds available in France. The fish feed is a mixture of fish meal, wheat, corn various vegetable oils, and other supplements. A recent study assessing the environmental impacts of making fish feed5 was used to assess the greenhouse gas emissions from producing, delivering, and administering the feed to the salmon at the farm. SALMON FARMING What are the main sources of emissions from farming fish? The main sources of greenhouse gases in a salmon farming operation comes from the production, delivery, and use of the fish feed. What are the emissions from fish feed? The emissions from producing, delivery, and applying the fish feed are 611 grams of CO2 equivalent for one pound of fish feed.6 A feed factor of four was used in this study. Thus, a farmed salmon needs to eat four pounds of feed to put on one pound of weight. The fillet factor of 2.3 also applies to farmed salmon. So, to obtain a 0.5 pound fillet of salmon, we need 1.2 pounds of salmon which requires 4.8 pounds of fish feed. The emissions from producing, delivering, and applying 4.8 pounds of fish feed are 2,812 grams of CO2 equivalent. TRANSPORTATION Once the farmed salmon is harvested, how does it get to Seattle? It is assumed that the salmon is filleted at the fish farm in Norway. Then, the salmon is shipped on a refrigerated container ship from Bergen, Norway to New York City (3,365 nautical miles). From there the salmon is shipped by rail to Seattle (3,353 rail miles). How many greenhouse gases are emitted to transport the farmed salmon to Seattle? Transportation adds an additional 115 grams of CO2 equivalent. TOTAL EMISSIONS What are the total emissions for raising a 1.2 pound Norwegian farmed salmon and transporting a 0.5 pound fillet to Seattle? 2,927 grams of CO2 equivalent.
0
500
1,000
1,500
2,000
2,500
3,000
Glo
bal W
arm
ing
Pot
entia
l (gr
ams
of
CO
2 eq
uiva
lent
)
Sources of GHG Emissions for Raising and Transporting Norwegian Farmed Salmon from Bergen, Norway to Seattle
(via New York City)
Norwegian Farmed 2,812 115
Salmon Feed Production Total Transport
26
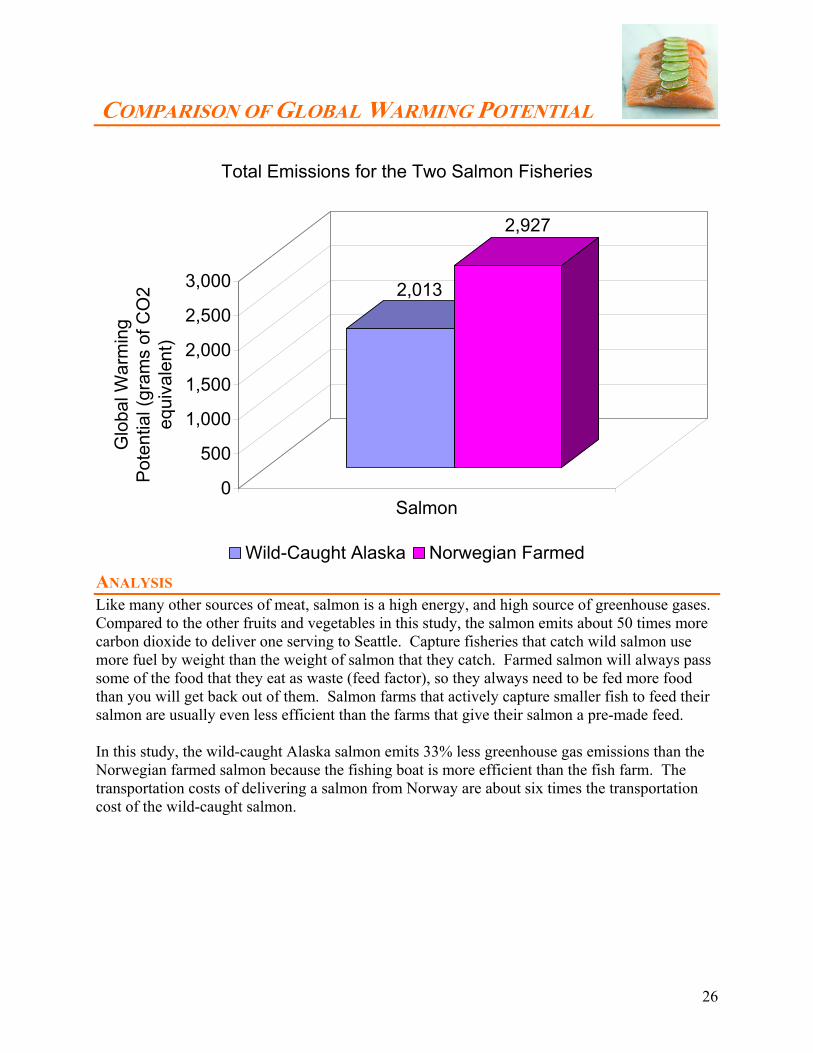
COMPARISON OF GLOBAL WARMING POTENTIAL
2,013
2,927
0
500
1,000
1,500
2,000
2,500
3,000
Glo
bal W
arm
ing
Pot
entia
l (gr
ams
of C
O2
equi
vale
nt)
Salmon
Total Emissions for the Two Salmon Fisheries
Wild-Caught Alaska Norwegian Farmed
ANALYSIS Like many other sources of meat, salmon is a high energy, and high source of greenhouse gases. Compared to the other fruits and vegetables in this study, the salmon emits about 50 times more carbon dioxide to deliver one serving to Seattle. Capture fisheries that catch wild salmon use more fuel by weight than the weight of salmon that they catch. Farmed salmon will always pass some of the food that they eat as waste (feed factor), so they always need to be fed more food than you will get back out of them. Salmon farms that actively capture smaller fish to feed their salmon are usually even less efficient than the farms that give their salmon a pre-made feed. In this study, the wild-caught Alaska salmon emits 33% less greenhouse gas emissions than the Norwegian farmed salmon because the fishing boat is more efficient than the fish farm. The transportation costs of delivering a salmon from Norway are about six times the transportation cost of the wild-caught salmon.

27
1 Alaska Department of Fish and Game, 2005. 2 Henderson & Healey, (1993). 3 Ellingsen & Aanondsend, 2006. 4 Harvey, 2006. 5 Papatryphon et al, 2004. 6 Ibid.

28
RECOMMENDATIONS
Based on the findings of our research we make the following recommendations:
1. Promote local food because it does have environmental benefits over imported food.
2. Educate the public about the environmental benefits of local food.
3. Further study should look at the greenhouse gas impact of how people transport
themselves to get their food.
1. Promote local food
The results of the LCA show in all cases that local food emits less greenhouse gases for
cultivation and delivery to Seattle. There are two main reasons for this. First, local food has to
traveled less to get to the city and secondly because Washington State is a highly productive
agricultural region.
The distance that food travels to get to the city is a main source of emissions for the food items
studied here, but differences in harvest yields and cultivation practices can play an even larger
role in the emission of greenhouse gases. Thus, the miles that food travels to get to the city are
an inadequate measure of the greenhouse gas impact of food. The LCA analysis performed here
shows that harvest yields can greatly affect the total greenhouse gas emissions. Considering the
Washington State potato and the Idaho potato, yields in Washington are almost twice that for
Idaho, and yet a similar amount of fertilizers, herbicides, and insecticides are applied to these
farms. However, for asparagus, the difference between the local and the imported food is small
because Peru is much more efficient than Washington at growing asparagus. Thus it is important
to consider every crop individually.
2. Educate about the environmental benefits of local food
One finding from the Neighborhood Study focus groups is that people are aware of the
environmental benefits of organic food, but they don’t often take into consideration the source of
their food when they select it. Also, many people expressed an interest in having more farmers’
markets, but this was mostly because they thought that the food available there was fresher, and
did not make the connection that there are environmental benefits for selecting locally grown
food. If people were more aware of the environmental benefits of local food, this could further
29
increase the demand for local food, which would also boost the community and economic
benefits that local food can bring.
3. Further study
If we look at the greenhouse gas emissions for just the fruits and vegetables alone, the emissions
are very low, especially compared to driving a car. For the fruits and vegetables alone, the total
emissions for the local plate is only 89 grams of CO2 equivalent, and the imported fruits and
vegetables total is only 159 grams of CO2 equivalent. Burning one gallon of gasoline in a
passenger car emits 9,250 grams of CO2 equivalent. Cultivating and delivering the fruits and
vegetables is only like driving a quarter to a half mile in a passenger car. Even if we look at the
entire plates of food with the salmon, the plates are similar to burning a quarter to a third of a
gallon of gas, or driving 4-8 miles in a passenger vehicle.
If we were to look at the entire food system for Seattle, it is possible that people driving to get
their food could be a larger source of greenhouse gases than the emissions created from
cultivating and delivering the food to Seattle. This might seem implausible, but the main reason
for this is that commercial vehicles (semi-trucks, rail cars, container ships) are much more
efficient at moving cargo than passenger cars are.
A few other ideas have been raised as possible avenues for further study from this project. One
way to lower the greenhouse gas emissions from burning fuel at the farm would be to use
biodiesel at the farm instead of conventional diesel. This could make the emissions from burning
fuel at some farms essentially carbon neutral. Also, many farm by-products might be readily
available for use as a bio-fuel.
Another idea for further research would be to do a full cost-benefit analysis comparing local and
imported food items. This study did not look at the economic issues surround agricultural
practices, but many of the references cited here did and it might not be too difficult to combine
these studies to examine the full economic impacts of local and imported food.

30
APPENDIX – GREENHOUSE GAS STUDY
CROP YIELDS
Data on crop yields (pounds harvested per acre) in Washington State, Idaho, New Zealand, and
Peru have been collected from various branches of the US Department of Agriculture. These
include the Washington State Field Office, the National Agricultural Statistics Service, the
Foreign Agricultural Service, and the Global Agriculture Information Network. The following is
a detailed description of the data used to determine crop yields for apples, asparagus, and
potatoes.
Apples
To determine the pounds of apples harvested per acre in Washington State, data on historical
yields were used, and a five-year average was used as a representative yield in this study. This
five-year average was used as the yield for the conventional apple farm in this study. Table 1
shows the apple yields in Washington State1 for the last five years and the average used in this
study.
Year
Apple Yield
(Pounds per acre)
2001 31,600
2002 32,900
2003 29,400
2004 39,700
2005 37,400
5-year average 34,200
Table 1. Apple yields in Washington State.
For the organic apple farm, it was assumed that the yield was 10% lower than at a conventional
apple farm,2 which gives a yield of 30,800 pounds per acre at the organic apple farm.
1 USDA, 2006a. 2 David Granatstein, Washington State University, personal communication, 2/26/2007.

31
Apple yields in New Zealand were obtained from the Foreign Agricultural Service, and the
Global Agriculture Information Network.3 The New Zealand yield used in this study came from
the 2004 revised data because the 2005 data was only estimated and the 2006 data was a forecast.
This article listed the area planted in New Zealand as 13,500 hectares, with a yield of 504,000
metric tons. This converts to a yield of 33,300 pounds per acre.
Asparagus
To determine the pounds of asparagus harvested per acre in Washington State, data on historical
yields were used, and a five-year average was used as a representative yield in this study. This
five-year average was used as the yield for the conventional and organic asparagus farm in this
study, because it was not determined if yields at organic asparagus farms is different from
conventional farms. Table 2 shows the asparagus yields in Washington State4 for the last five
years and the average used in this study.
Year Asparagus Yield
(Pounds per acre)
2001 3,600
2002 3,700
2003 3,800
2004 4,300
2005 4,100
5-year average 3,900
Table 2. Asparagus yields in Washington State.
Asparagus yields in Peru were determined from another Foreign Agricultural Service, and the
Global Agriculture Information Network.5 For the three years spanning 2003-2005, asparagus
yields in Peru were 10.3 metric tons per hectare, which converts to 9,200 pounds per acre, which
was the value used in this study. Asparagus yields in Peru are much higher than they are in
3 Patterson, 2006. 4 USDA, 2006d. 5 Nolte, 2006.

32
Washington State because the climate is conducive to growing asparagus year-round and the
asparagus does not enter a dormant stage.
Potatoes
Potato yields were determined from a report by the National Agricultural Statistics Service.6
This report listed potato yields for the year 2005 by state. In Washington State in 2005, the
average yield of potatoes per acre as 62,000 pounds per acre, and in Idaho the average yield was
only 36,600 pounds per acre. For the organic potato farm, the same yield was used as reported
for the Washington State average because it was not determined if organic potato farms yield a
different amount than conventional potato farms.
6 USDA, 2006c.

33
FERTILIZERS, HERBICIDES, INSECTICIDES
Data on fertilizer (nitrogen fertilizers, phosphate fertilizers, and potash fertilizers), herbicide, and
insecticide application have been collected from the US Department of Agriculture reports on
Agricultural Chemical Usage. The data comes from various years because all forms of data are
not reported each year, but every effort has been made to use the most recent data available that
overlap with the year from the crop yields. The only data found were for US farming practices,
and fertilizer, herbicide, and insecticide use in New Zealand and Peru was not found. For these
two countries, chemical application was assumed to be equivalent to the average for the US. For
Washington and Idaho farms, state-wide averages were used.
Emissions from the manufacturing the fertilizers, herbicides, and insecticides, and for
transporting them to the farm come from the GREET model. Table 3 shows the greenhouse gas
emissions (in grams) for manufacturing one gram (which was converted to pounds for the
analysis) of the chemicals modeled by GREET.7 GREET was used to determine the greenhouse
gas emissions from manufacturing and delivering the chemicals used at each farm.
Fertilizer (per gram of nutrient)
Greenhouse Gas Nitrogen Phosphate Potash
Herbicides: Average for Crop Type
Insecticides: Average for Crop Type
CO2 (grams) 2.44312 0.99243 0.67147 20.8524 24.3409 CH4 (grams) 0.00289 0.00177 0.00097 0.0298 0.03524 N2O (grams) 0.00163 1.8E-05 9.9E-06 0.00024 0.00031
Table 3. Greenhouse gas emissions (in grams) from the manufacturing and delivery from the manufacturing plant to the farm of one gram of fertilizers, herbicides, and insecticides.
Below, we show the fertilizers (nitrogen, phosphate, and potash), herbicides, and insecticides
applied at a farm for each crop and for each location used in this study.
7 University of Chicago, 1999.
34
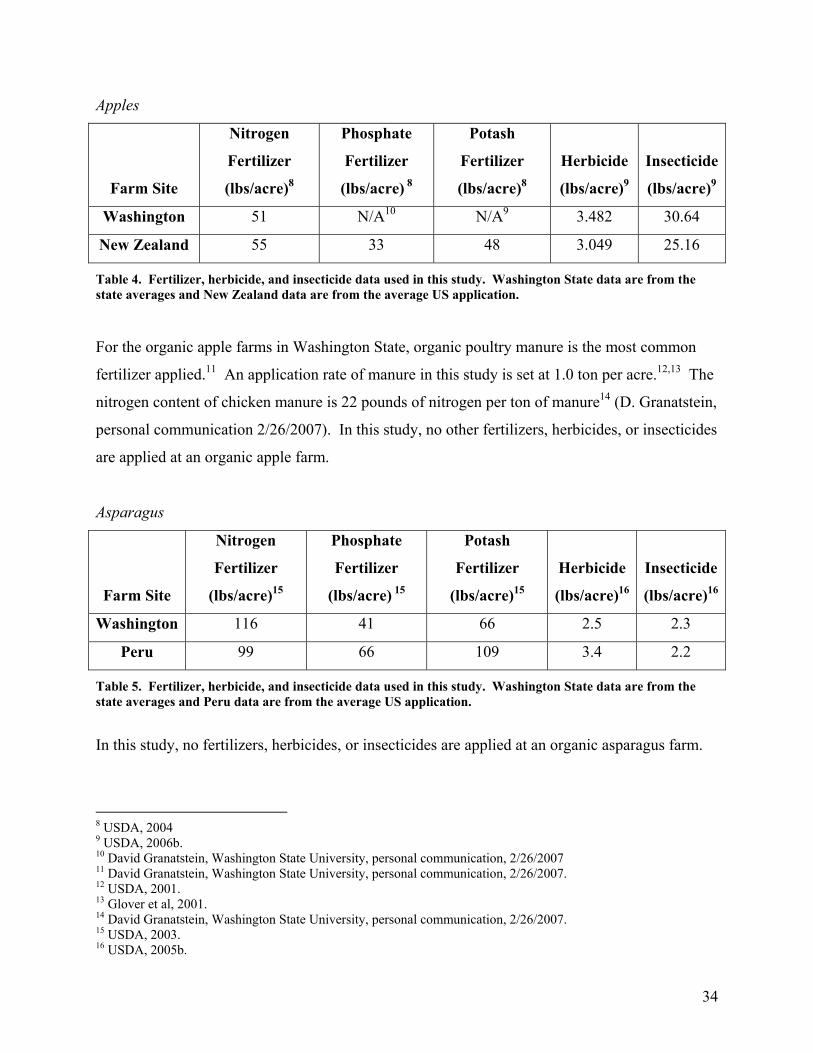
Apples
Farm Site
Nitrogen
Fertilizer
(lbs/acre)8
Phosphate
Fertilizer
(lbs/acre) 8
Potash
Fertilizer
(lbs/acre)8
Herbicide
(lbs/acre)9
Insecticide
(lbs/acre)9
Washington 51 N/A10 N/A9 3.482 30.64
New Zealand 55 33 48 3.049 25.16
Table 4. Fertilizer, herbicide, and insecticide data used in this study. Washington State data are from the state averages and New Zealand data are from the average US application.
For the organic apple farms in Washington State, organic poultry manure is the most common
fertilizer applied.11 An application rate of manure in this study is set at 1.0 ton per acre.12,13 The
nitrogen content of chicken manure is 22 pounds of nitrogen per ton of manure14 (D. Granatstein,
personal communication 2/26/2007). In this study, no other fertilizers, herbicides, or insecticides
are applied at an organic apple farm.
Asparagus
Farm Site
Nitrogen
Fertilizer
(lbs/acre)15
Phosphate
Fertilizer
(lbs/acre) 15
Potash
Fertilizer
(lbs/acre)15
Herbicide
(lbs/acre)16
Insecticide
(lbs/acre)16
Washington 116 41 66 2.5 2.3
Peru 99 66 109 3.4 2.2
Table 5. Fertilizer, herbicide, and insecticide data used in this study. Washington State data are from the state averages and Peru data are from the average US application.
In this study, no fertilizers, herbicides, or insecticides are applied at an organic asparagus farm.
8 USDA, 2004 9 USDA, 2006b. 10 David Granatstein, Washington State University, personal communication, 2/26/2007 11 David Granatstein, Washington State University, personal communication, 2/26/2007. 12 USDA, 2001. 13 Glover et al, 2001. 14 David Granatstein, Washington State University, personal communication, 2/26/2007. 15 USDA, 2003. 16 USDA, 2005b.
35
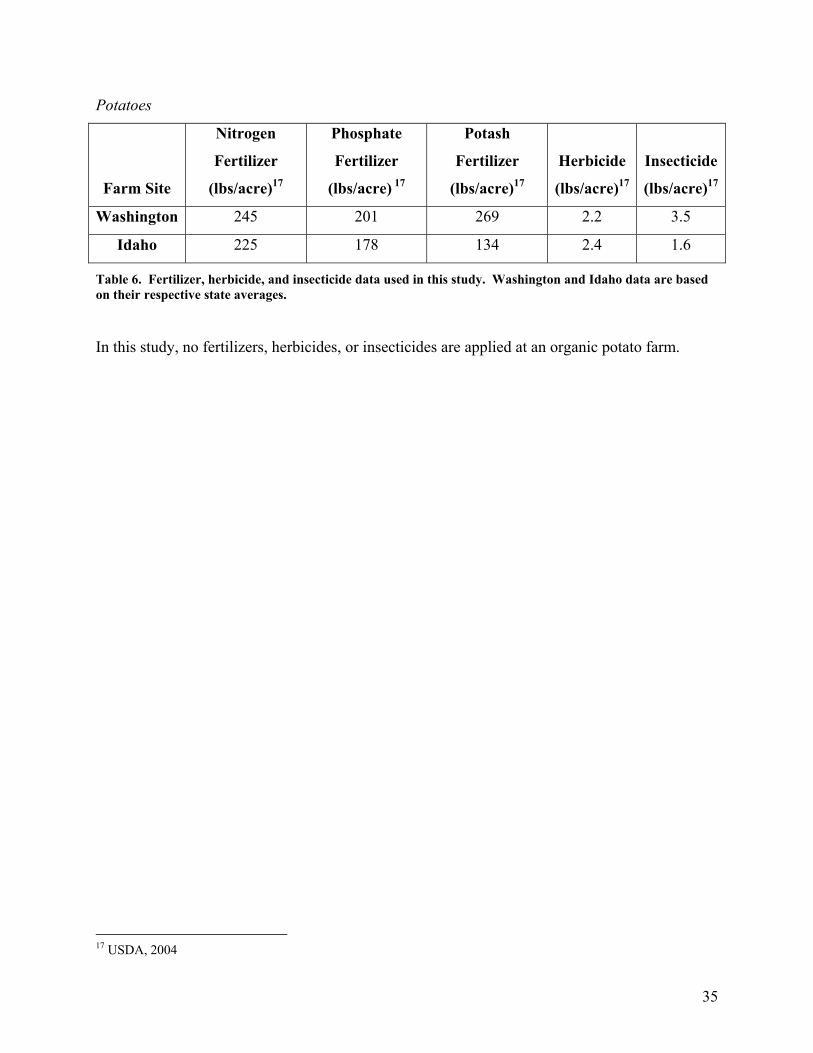
Potatoes
Farm Site
Nitrogen
Fertilizer
(lbs/acre)17
Phosphate
Fertilizer
(lbs/acre) 17
Potash
Fertilizer
(lbs/acre)17
Herbicide
(lbs/acre)17
Insecticide
(lbs/acre)17
Washington 245 201 269 2.2 3.5
Idaho 225 178 134 2.4 1.6
Table 6. Fertilizer, herbicide, and insecticide data used in this study. Washington and Idaho data are based on their respective state averages.
In this study, no fertilizers, herbicides, or insecticides are applied at an organic potato farm.
17 USDA, 2004

36
EMISSIONS FROM FARM FIELDS
The only direct greenhouse gas emission from farm fields modeled in this study is the emission
of nitrous oxide from the application of nitrogen fertilizer. The conversion rate is taken from
Brentrup, et al,18 who reviewed multiple studies of nitrous oxide emissions from nitrogen
fertilizer application which can vary greatly depending on soil type, local climate, and fertilizer
type. Brentrup et al came up with an emission factor of 0.0125, so that for every pound of
nitrogen in the fertilizer applied, there will be 0.0125 pounds of nitrous oxide emitted. In the
values for nitrogen fertilizer applied listed above, the values are given in terms of pounds of
nitrogen, so this value can be directly converted to nitrous oxide emissions from the field.
18 Brentrup et al, 2000.
37
FARM FUEL USE
To determine the farm equipment used and the related fuel use by this equipment, various studies
from Washington State University were used. These studies focused on the economic costs of
starting up and maintaining apple, asparagus, and potato farms in Washington State, so the type
of farm equipment needed and the fuel used was kept track of. The three types of fuel burned at
the farms are: gasoline (pick-up trucks and all-terrain vehicles), diesel (tractors), and propane
(wind machine).
The emissions from burning these fuels at the farm come from the Greenhouse Gases, Regulated
Emissions, and Energy Use in Transportation (GREET) Model,19 which has been modified by
Joyce Cooper at the University of Washington,20 and from the Environmental Protection
Agency.21
Below are the emissions calculations for burning gasoline in a pick-up truck and ATV used in
this study, and following that are the emissions for the three farms examined in this study. The
final values for fuel use are given in British Thermal Units (BTU) per acre. A BTU is the unit of
energy (similar to a calorie or a joule) that the GREET model uses to determine emissions.
One final assumption made throughout this study is that the fuel use at a farm in Washington is
equivalent to the fuel used at a farm in New Zealand, Peru, and Idaho. In most cases this is a fair
assumption because farming practices in all of these locales are modernized and will use similar
equipment. However, there are differences in climate, soil type, and slight variations in the
technology available that will always introduce error into this assumption.
The asparagus farm in Peru is the place where this assumption breaks down the most. In Ica,
Peru, the climate is perfectly suited to growing asparagus year-round and the asparagus does not
enter a dormant stage there22. This is significantly different from Washington State where there
is only one main growing season for asparagus.
19 University of Chicago, 1999. 20 University of Washington GREET 1.7 Data Extraction 21 EPA, 2005. 22 Nolte, 2006.

38
Emissions from burning gasoline in a pick-up truck and all-terrain vehicle
The emissions from burning gasoline at the farm (e.g. in a pick-up truck or in an ATV) was
calculated on a per gallon basis following a worksheet from the EPA.23 This worksheet follows
the stoichiometry of carbon in a gallon of gasoline that gets converted to carbon dioxide and then
determines an appropriate emission factor for methane and nitrous oxide. Chemically, there are
8788 grams of CO2 emitted from burning a gallon of gasoline, assuming a 99% efficient burn.
The total GWP of burning a gallon of gas includes a 5-6% input from methane and nitrous oxide,
so the 8788 grams are multiplied by 100/95 to get the total GWP of 9250 grams of CO2
equivalent.
To back-calculate the emission of methane and nitrous oxide necessary to increase the GWP
from 8788 to 9251 grams of CO2 equivalent, we assumed that the input from methane and
nitrous oxide was equal, so they would each need to contribute a GWP of 231 grams of CO2
equivalent. The amount of carbon dioxide, methane, and nitrous oxide emitted in grams to give
a total GWP of 9250 grams of CO2 equivalent is shown in Table 7.
Greenhouse Gas Grams g CO2 eq CO2 8788 8788 CH4 10.06 231 N2O 0.7813 231
Total GWP 9250 Table 7. The calculated emissions of the three major greenhouse gases needed to contribute a total GWP of 9250 grams of CO2 equivalent per gallon of gasoline burned.
Apples
The machine use and fuel use per machine for this study is characterized from a study of
conventional, integrated, and organic apple farms.24 In this six-year study, the four types of farm
machinery that use fuel are a tractor, an all-terrain vehicle (ATV), a pick-up truck, and a wind
machine. The activities carried out by these machines are shown in Table 8.
23 EPA, 2005. 24 Glover et al, 2001.

39
Operation Tooling Fertilize 52HP-wt Tractor, Trailer w/ Hand Labor Cover Crop Prep 52HP-wt Tractor, Rototiller Seed Cover Crop 52HP-wt Tractor, Rented Seeder Mildew Spray 52HP-wt Tractor, Blast Sprayer Apply Mulch 52HP-wt Tractor, Trailer w/ Hand Labor Irrigate Solid Set Undertree Irr. System Irrigate 4-Wheel ATV w/ Above Operation Herbicide 52HP-wt Tractor, 100 gal. Sprayer Mow Orchard 52HP-wt Tractor, 9' Rotary Mower Cover Spray 52HP-wt Tractor, Blast Sprayer Misc Use 1/2 Ton Pickup Misc Use 4-Wheel All Terrain Vehicle Frost Protection Wind Machine
Table 8. Farm operations run by machine at an apple farm. This list includes all activities that might occur at a conventional and/or an organic apple farm.25
The average hours of use per machine are shown in Table 9, and it was assumed that the average
hours of use per machine was the same on the conventional farm as it was on the organic farm.26
Since both the ATV and pick-up truck burn gasoline, it was assumed that they would have the
same emissions and the fuel use for these two machines was combined in the LCA.
Tooling Fuel Type
Machine Hours Per Acre
Gallons of Fuel Used per Hour
Gallons of Fuel Used per Acre BTU/gallon BTU/Acre
52 HP-Wheel Tractor Diesel 34.1 1.5 51.2 139,000 7,110,0004WD-ATV Gasoline 15.7 0.5 7.85 124,000 973,000Pickup Gasoline 7.14 2 14.3 124,000 1,770,000Wind Machine Propane 4 13 52 91,000 4,730,000
Table 9. Fuel use at an apple farm used in this study.27
25 Glover et al, 2001 26 David Granatstein, Washington State University, personal communication, 2/26/2007. 27 Glover et al, 2001.
40
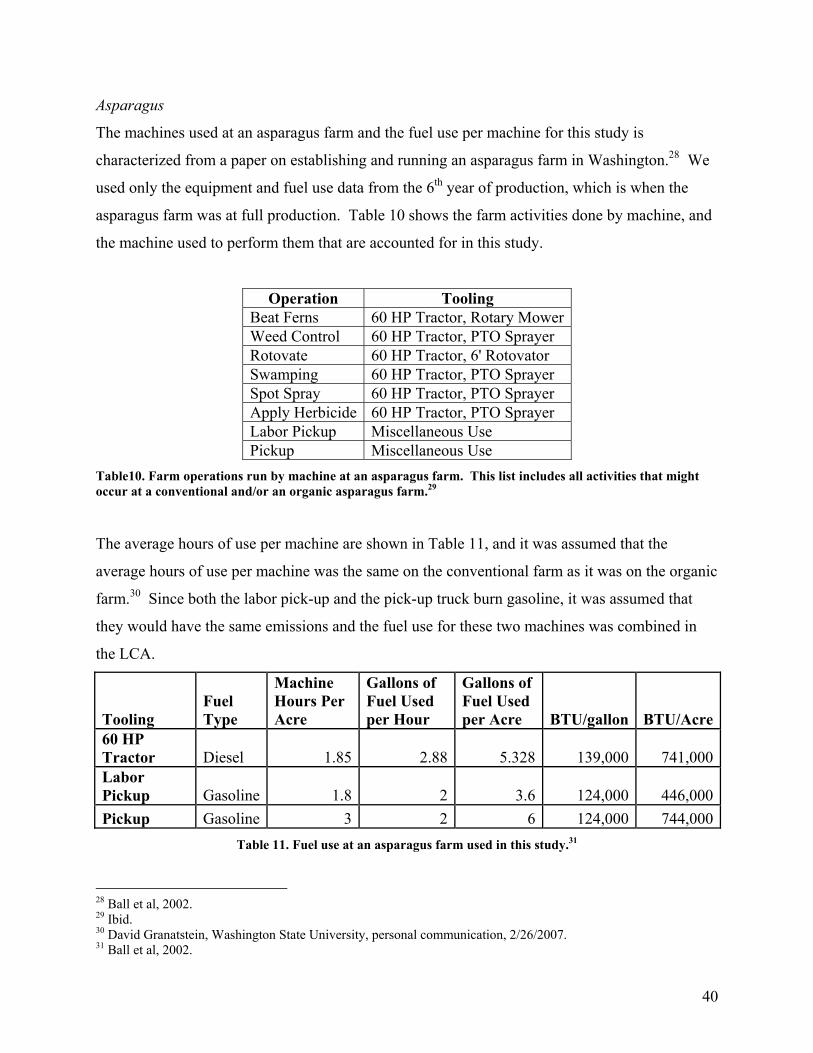
Asparagus
The machines used at an asparagus farm and the fuel use per machine for this study is
characterized from a paper on establishing and running an asparagus farm in Washington.28 We
used only the equipment and fuel use data from the 6th year of production, which is when the
asparagus farm was at full production. Table 10 shows the farm activities done by machine, and
the machine used to perform them that are accounted for in this study.
Operation Tooling Beat Ferns 60 HP Tractor, Rotary MowerWeed Control 60 HP Tractor, PTO Sprayer Rotovate 60 HP Tractor, 6' Rotovator Swamping 60 HP Tractor, PTO Sprayer Spot Spray 60 HP Tractor, PTO Sprayer Apply Herbicide 60 HP Tractor, PTO Sprayer Labor Pickup Miscellaneous Use Pickup Miscellaneous Use
Table10. Farm operations run by machine at an asparagus farm. This list includes all activities that might occur at a conventional and/or an organic asparagus farm.29
The average hours of use per machine are shown in Table 11, and it was assumed that the
average hours of use per machine was the same on the conventional farm as it was on the organic
farm.30 Since both the labor pick-up and the pick-up truck burn gasoline, it was assumed that
they would have the same emissions and the fuel use for these two machines was combined in
the LCA.
Tooling Fuel Type
Machine Hours Per Acre
Gallons of Fuel Used per Hour
Gallons of Fuel Used per Acre BTU/gallon BTU/Acre
60 HP Tractor Diesel 1.85 2.88 5.328 139,000 741,000Labor Pickup Gasoline 1.8 2 3.6 124,000 446,000Pickup Gasoline 3 2 6 124,000 744,000
Table 11. Fuel use at an asparagus farm used in this study.31
28 Ball et al, 2002. 29 Ibid. 30 David Granatstein, Washington State University, personal communication, 2/26/2007. 31 Ball et al, 2002.
41
Potatoes
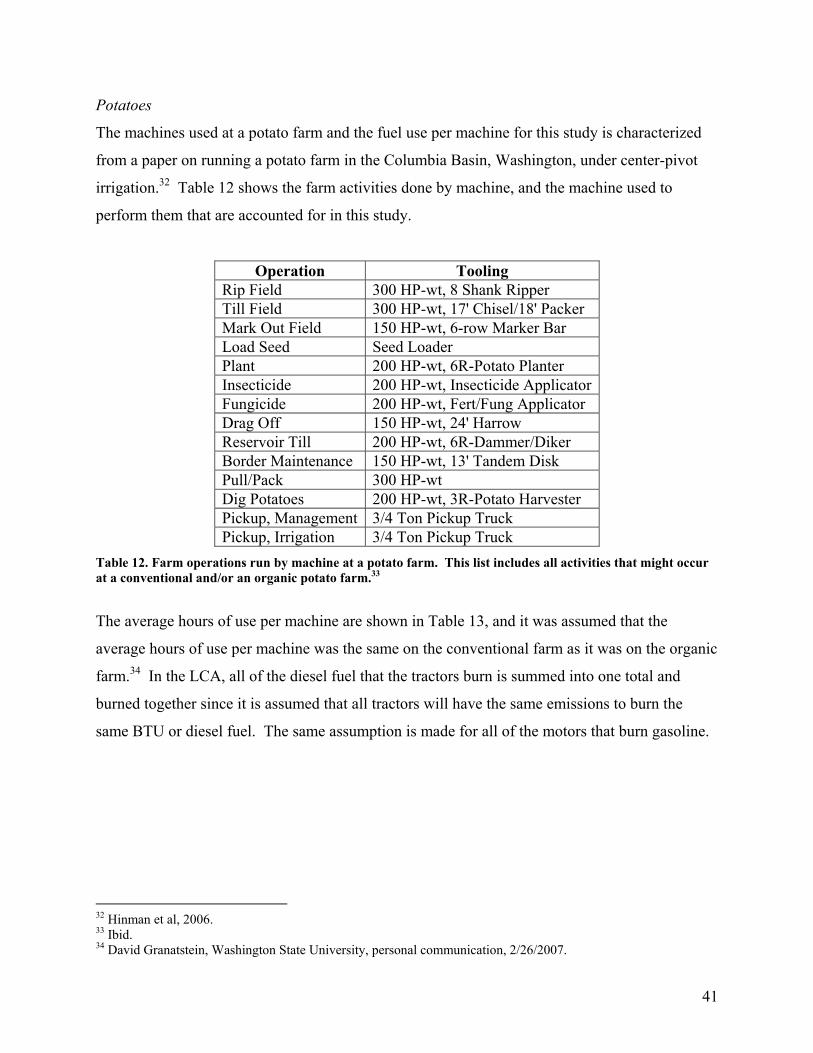
The machines used at a potato farm and the fuel use per machine for this study is characterized
from a paper on running a potato farm in the Columbia Basin, Washington, under center-pivot
irrigation.32 Table 12 shows the farm activities done by machine, and the machine used to
perform them that are accounted for in this study.
Operation Tooling Rip Field 300 HP-wt, 8 Shank Ripper Till Field 300 HP-wt, 17' Chisel/18' Packer Mark Out Field 150 HP-wt, 6-row Marker Bar Load Seed Seed Loader Plant 200 HP-wt, 6R-Potato Planter Insecticide 200 HP-wt, Insecticide Applicator Fungicide 200 HP-wt, Fert/Fung Applicator Drag Off 150 HP-wt, 24' Harrow Reservoir Till 200 HP-wt, 6R-Dammer/Diker Border Maintenance 150 HP-wt, 13' Tandem Disk Pull/Pack 300 HP-wt Dig Potatoes 200 HP-wt, 3R-Potato Harvester Pickup, Management 3/4 Ton Pickup Truck Pickup, Irrigation 3/4 Ton Pickup Truck
Table 12. Farm operations run by machine at a potato farm. This list includes all activities that might occur at a conventional and/or an organic potato farm.33
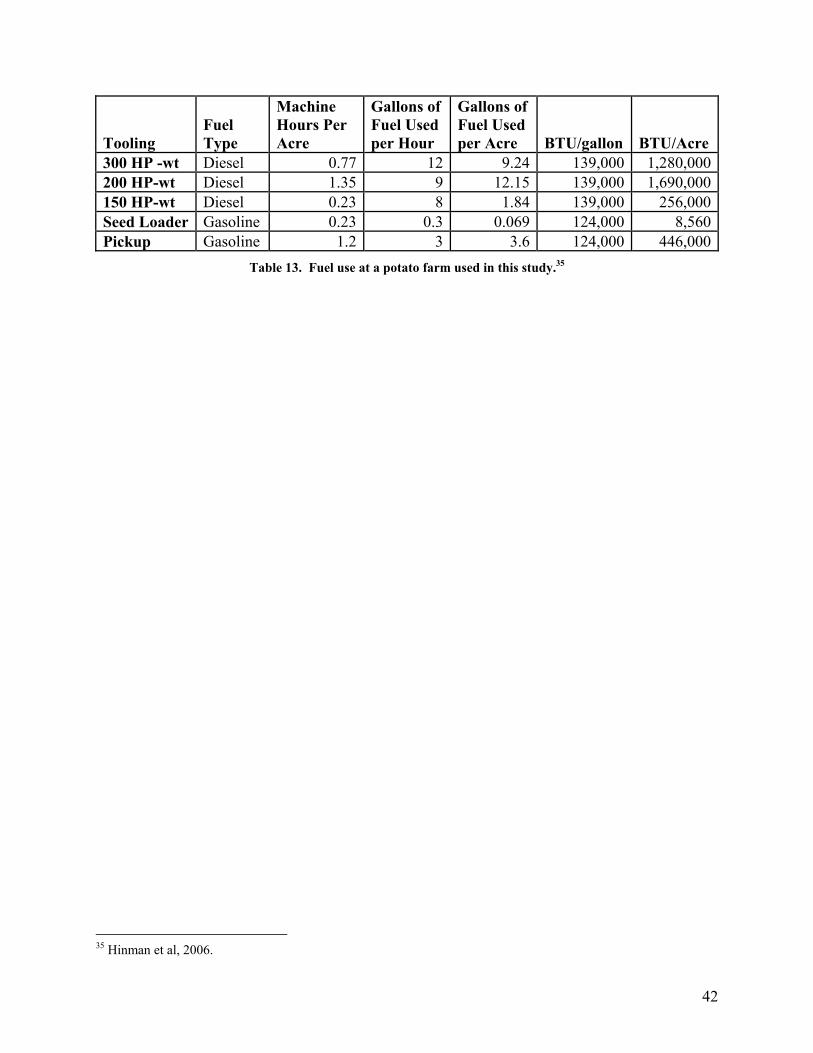
The average hours of use per machine are shown in Table 13, and it was assumed that the
average hours of use per machine was the same on the conventional farm as it was on the organic
farm.34 In the LCA, all of the diesel fuel that the tractors burn is summed into one total and
burned together since it is assumed that all tractors will have the same emissions to burn the
same BTU or diesel fuel. The same assumption is made for all of the motors that burn gasoline.
32 Hinman et al, 2006. 33 Ibid. 34 David Granatstein, Washington State University, personal communication, 2/26/2007.
42
Tooling Fuel Type
Machine Hours Per Acre
Gallons of Fuel Used per Hour
Gallons of Fuel Used per Acre BTU/gallon BTU/Acre
300 HP -wt Diesel 0.77 12 9.24 139,000 1,280,000200 HP-wt Diesel 1.35 9 12.15 139,000 1,690,000150 HP-wt Diesel 0.23 8 1.84 139,000 256,000Seed Loader Gasoline 0.23 0.3 0.069 124,000 8,560Pickup Gasoline 1.2 3 3.6 124,000 446,000
Table 13. Fuel use at a potato farm used in this study.35
35 Hinman et al, 2006.
43
SALMON FUEL USE
Wild-caught Salmon
There are many types of fishing boats used to catch salmon in Alaska, including purse-seiners,
trollers, and gillnetters.36 In this study, the fuel used to catch salmon is based on a study of
Canadian salmon fisheries that examined multiple types of salmon fishing boats and came up
with an industry average fuel use of 0.13 gallons of diesel fuel burned per pound of salmon
caught.37 Thus, the only steps required to catch and deliver a Copper River salmon to Seattle are
to burn the fuel in the fishing boat to catch the fish and keep it on ice once it is caught, and then
to deliver the salmon to Seattle. In this study the salmon is shipped from Anchorage, AK to
Seattle on a refrigerated container ship.
To make a fillet of fish you need to catch a larger piece of fish that can be cut down into a fillet.
The ratio of the weight of fish caught to weight of a fillet is called the fillet factor and we used a
fillet factor of 2.3.38 Thus, in order to produce a 0.5 pound fillet, 1.2 pounds of wild salmon
needs to be caught. So the total fuel burned to catch the fish and ship it is the amount needed to
catch and ship 1.2 pounds of salmon. It is assumed that the salmon is filleted in Seattle by the
retailer.
Norwegian Farmed Salmon
The salmon in this study are fed a mixture of the four most common fish feeds available in
France. The fish feed is a mixture of fish meal, wheat, corn various vegetable oils, and other
supplements. A recent study assessing the environmental impacts of making fish feed39 was
used to assess the greenhouse gas emissions from producing, delivering, and administering the
feed to the salmon at the farm.
The emissions from producing, delivery, and applying the fish feed are 611 grams of CO2
equivalent for one pound of fish feed.40 A feed factor of four was used in this study. Thus, a
farmed salmon needs to eat four pounds of feed to put on one pound of weight. In researching 36 Alaska Department of Fish and Game, 2005 37 Henderson & Healey, 1993. 38 Ellingsen & Aanondsend, 2006. 39 Papatryphon et al, 2004. 40 Ibid.
44
the appropriate value for the feed factor, values varying from 1 to 10 were observed. A feed
factor of four was selected as it seemed to be a median choice. The value of the feed factor can
significantly affect the results of the farmed salmon LCA.
The fillet factor of 2.3 also applies to farmed salmon. So, to obtain a 0.5 pound fillet of salmon,
we need 1.2 pounds of salmon which requires 4.8 pounds of fish feed. Unlike the wild salmon, it
is assumed that the farmed salmon is filleted on site at the farm, so only 0.5 pounds are shipped
to Seattle.
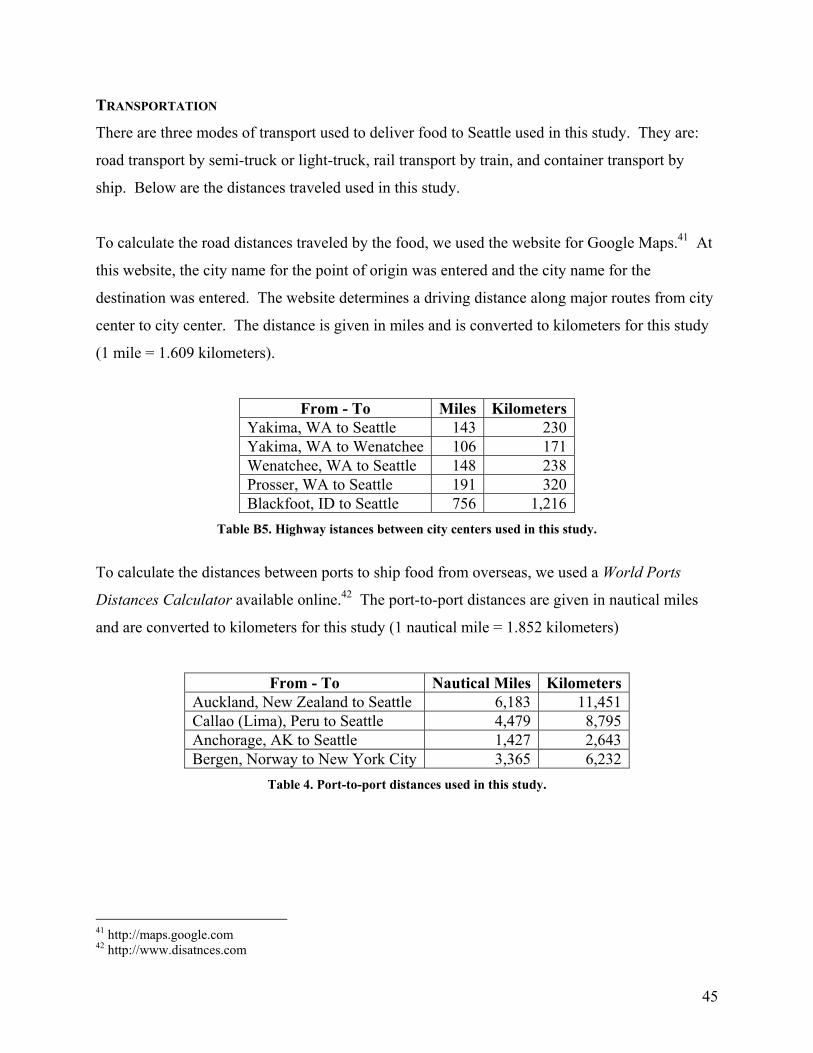
45
TRANSPORTATION
There are three modes of transport used to deliver food to Seattle used in this study. They are:
road transport by semi-truck or light-truck, rail transport by train, and container transport by
ship. Below are the distances traveled used in this study.
To calculate the road distances traveled by the food, we used the website for Google Maps.41 At
this website, the city name for the point of origin was entered and the city name for the
destination was entered. The website determines a driving distance along major routes from city
center to city center. The distance is given in miles and is converted to kilometers for this study
(1 mile = 1.609 kilometers).
From - To Miles KilometersYakima, WA to Seattle 143 230Yakima, WA to Wenatchee 106 171Wenatchee, WA to Seattle 148 238Prosser, WA to Seattle 191 320Blackfoot, ID to Seattle 756 1,216
Table B5. Highway istances between city centers used in this study.
To calculate the distances between ports to ship food from overseas, we used a World Ports
Distances Calculator available online.42 The port-to-port distances are given in nautical miles
and are converted to kilometers for this study (1 nautical mile = 1.852 kilometers)
From - To Nautical Miles Kilometers Auckland, New Zealand to Seattle 6,183 11,451 Callao (Lima), Peru to Seattle 4,479 8,795 Anchorage, AK to Seattle 1,427 2,643 Bergen, Norway to New York City 3,365 6,232
Table 4. Port-to-port distances used in this study.
41 http://maps.google.com 42 http://www.disatnces.com

46
To deliver the Norwegian farmed salmon to Seattle, it was initially shipped from Bergen to New
York city, and from New York City it traveled by train to get to Seattle. These distances come
from the rail distances that Amtrak travels between cities.43
From - To Miles Kilometers
New York City to Chicago 1,147 1,844Chicago to Seattle 2,206 3,550New York to Seattle Total 3,353 5,394
Table 5. Rail distances between cities used to transport salmon in this study.
43 http://www.amtrak.com/

47
LCA CALCULATION PROCEDURE
This section lays out the method used to calculate the greenhouse gas emissions using the Life
Cycle Assessment framework. This will work through the example for calculating the emissions
for a 0.5 pound potato.
Following the method laid out by Heijungs and Suh,44 the inventory data have been separated
into a technology matrix (A) and an intervention matrix (B). These matrices consist of process
vectors (Pi) that are partitioned into economic flows and environmental flows. The technology
matrix is made up by the economic flows and is a square matrix with the 12 included processes
that are based on the system boundaries and the cut-off criteria. The intervention matrix is made
up of the environmental flows and consists of the three major greenhouse gases: carbon dioxide
(CO2), methane (CH4), and nitrous oxide (N2O) that are produced by each of the unit processes.
An example of these matrices is shown in Figure 1. The Microsoft Excel program was used for
the calculations in this LCA.
The technology matrix consists of allof the unit processes required to cultivate and transport
potatoes to Seattle, and the intervention matrix consists of the greenhouse gases we are tracking
in this study. The data presented in the technology and intervention matrices are not scaled to
produce one 0.5 pound potato; it is scaled for various degrees of performance. To solve the
inventory problem, we follow the basic method described by Heijungs and Suh (2002), which is
briefly described below.
To scale the technology and intervention matrices to the desired level, we create a demand vector
(f) which we can use to demand the desired quantity of each of the economic flows. In Appendix
A you will see that the demand vector is set up to demand a weight of potatoes (lbs) to be
delivered a certain amount of distance (kg-km) so that we can study different delivery options for
the apples. The units of kg-km used in the distance calculation are convenient when we want to
move a certain weight a certain distance.
44 Heijungs & Suh, 2002.

48
The demand vector represents the economic flows, which correspond to the reference flows. The
demand vector “demands” the product, functional unit, of the system, in this case a 0.5 pound
potato. In order for the system to create the desired demand, we have to solve for the correct
scaling vector (s). The scaling vector is the unknown vector that can be multiplied by the
intervention matrix to give the desired demand and solved for as shown below:
fAs
fsA∗=
=∗−1
So, we solve for the scaling vector by inverting the technology matrix and multiplying it by the
demand vector. The result is that the scaling vector tells us exactly how much of each economic
flow (e.g. fertilizers, herbicides, insecticides, diesel fuel, etc.) it will take to create the 0.5 potato
that we have demanded (as well as the fuel requirements for how far we demanded it be
shipped).
The next step for solving the inventory problem is to determine the system-wide environmental
flows from the intervention matrix, which are then used for impact assessment. This solution is
called the inventory vector (g), which is determined by solving the equation:
sBg ∗= ,
where B is the intervention matrix. The concept here is that once we have the scaling vector that
tells us how much of each economic flow we need to make a 0.5 pound potato, we multiply it by
the emissions in the intervention matrix (the greenhouse gas emissions for each process) and we
get the emissions created for making the 0.5 pound potato.
To calculate the total Global Warming Potential of the 0.5 pound potato, we multiply each
greenhouse gas by its appropriate scaling factor as outlined in the Methods section and add up
the total emissions.
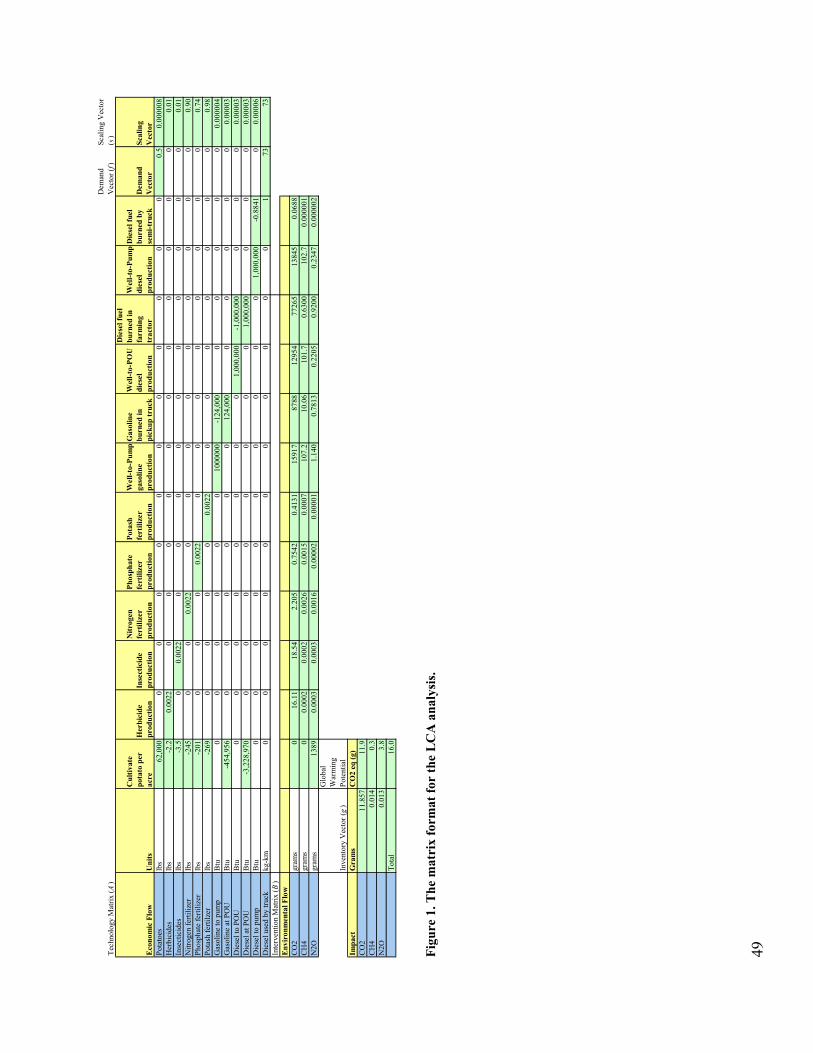
49
Tech
nolo
gy M
atrix
(A)
Dem
and
Vec
tor (f)
Scal
ing
Vec
tor
(s)
Eco
nom
ic F
low
Uni
ts
Cul
tivat
e po
tato
per
ac
reH
erbi
cide
pr
oduc
tion
Inse
ctic
ide
prod
uctio
n
Nitr
ogen
fe
rtili
zer
prod
uctio
n
Phos
phat
e fe
rtili
zer
prod
uctio
n
Pota
sh
fert
ilize
r pr
oduc
tion
Wel
l-to-
Pum
p ga
solin
e pr
oduc
tion
Gas
olin
e bu
rned
in
pick
up tr
uck
Wel
l-to-
POU
di
esel
pr
oduc
tion
Die
sel f
uel
burn
ed in
fa
rmin
g tr
acto
r
Wel
l-to-
Pum
p di
esel
pr
oduc
tion
Die
sel f
uel
burn
ed b
y se
mi-t
ruck
Dem
and
Vec
tor
Scal
ing
Vec
tor
Pota
toes
lbs
62,0
000
00
00
00
00
00
0.5
0.00
0008
Her
bici
des
lbs
-2.2
0.00
220
00
00
00
00
00
0.01
Inse
ctic
ides
lbs
-3.5
00.
0022
00
00
00
00
00
0.01
Nitr
ogen
ferti
lizer
lbs
-245
00
0.00
220
00
00
00
00
0.90
Phos
phat
e fe
rtiliz
erlb
s-2
010
00
0.00
220
00
00
00
00.
74Po
tash
ferti
lzer
lbs
-269
00
00
0.00
220
00
00
00
0.98
Gas
olin
e to
pum
pB
tu0
00
00
010
0000
0-1
24,0
000
00
00
0.00
0004
Gas
olin
e at
PO
UB
tu-4
54,9
560
00
00
012
4,00
00
00
00
0.00
003
Die
sel t
o PO
UB
tu0
00
00
00
01,
000,
000
-1,0
00,0
000
00
0.00
003
Die
sel a
t PO
UB
tu-3
,228
,970
00
00
00
00
1,00
0,00
00
00
0.00
003
Die
sel t
o pu
mp
Btu
00
00
00
00
00
1,00
0,00
0-0
.884
10
0.00
006
Die
sel u
sed
by tr
uck
kg-k
m0
00
00
00
00
00
173
73In
terv
entio
n M
atrix
( B)
Env
iron
men
tal F
low
CO
2gr
ams
016
.11
18.5
42.
205
0.75
420.
4131
1591
787
8812
954
7726
513
845
0.06
88C
H4
gram
s0
0.00
020.
0002
0.00
260.
0015
0.00
0710
7.2
10.0
610
1.7
0.63
0010
2.7
0.00
0001
N2O
gram
s13
890.
0003
0.00
030.
0016
0.00
002
0.00
001
1.14
00.
7813
0.22
050.
9200
0.23
470.
0000
02
Inve
ntor
y V
ecto
r (g
)
Glo
bal
War
min
g Po
tent
ial
Impa
ctG
ram
sC
O2
eq (g
)C
O2
11.8
5711
.9C
H4
0.01
40.
3N
2O0.
013
3.8
Tota
l16
.0
Figu
re 1
. The
mat
rix
form
at fo
r th
e L
CA
ana
lysi
s.
50
REFERENCES Alaska Department of Fish and Game, (2005). What kind of fishing boat is that?. Alaska
Department of Fish and Game, Division of Commercial Fisheries. Retrieved from http://www.cf.adfg.state.ak.us/geninfo/pubs/fv_n_ak/fv_ak1pg.pdf.
Anonymous, (2002, August). Apples in Washington State- General Production Information,
Retrieved February 24, 2007 from the Washington State University Tree Fruit Horticulture web site: http://www.ncw.wsu.edu/treefruit/aplcrop.htm
Ball, T., Folwell, R.J, & Holmes, D., (2002). Establishment and Annual Production Costs for
Washington Asparagus in 2001. Farm Business Management Reports, Washington State University Cooperative Extension, EB1779.
Brentrup, F., Küsters J., Lammel, J., & Kuhlmann, H., (2000). Methods to Estimate On-Field
Nitrogen Emissions from Crop Production as an Input to LCA Studies in the Agricultural Sector. International Journal of Life Cycle Assessment, 5(6), 349 – 357.
Ellingsen, H. and Aanondsen, A.A., (2006). Environmental Impacts of Wild Caught Cod and
Farmed Salmon – A Comparison with Chicken. International Journal of Life Cycle Assessment 1 (1), 60-65.
EPA, (2005, February). Emission Facts: Greenhouse Gas Emissions from a Typical Passenger
Vehicle. US Environmental Protection Agency, Office of Transportation and Air Quality, EPA-F-05-004.
Glover, J., Hinman, H., Reganold, J., & Andrews, P., (2001). A Cost of Production Analysis of
Conventional vs. Integrated vs. Organic apple Production Systems. Research Bulletin, Wash. State University Cooperative Extension, Pullman. XB10401.
Harvey, D.J., (2006). Aquaculture Outlook. Economic Research Service, USDA: LDP-AQS-24, October 5, 2006.
Heijungs, R. & Suh, S., (2002). The computational structure of life cycle assessment. Eco-
efficiency in industry and science, v. 11, Dordrecht ; Boston: Kluwer Academic Publishers. xi, 241.
Henderson, M.A. & Healey, M.C., (1993). Doubling Sockeye Salmon Production in the Fraser
River – Is this Sustainable Development? Environmental Management Vol. 17, No. 6, pp. 719-728.
Hinman, H., Trent, M., &Pavek, M., (2006). 2006 Cost of Producing Processing and Fresh
Potatoes under Center Pivot Irrigation Columbia Basin, Washington. Farm Business Management Reports, Washington State University Extension, School of Economic Sciences, EB2015E. http://www.farm-mgmt.wsu.edu/irr.htm.

51
ISO, (1997). Environmental management. Life cycle assessment. Principles and framework. ISO, Geneva.
Mon, P.N. & Holland, D.W., (2006). Organic apple production in Washington State: An input-
output analysis. Renewable Agriculture and Food Systems, 21(2), 134-141. Nolte, G. E., (2006,). Peru Asparagus Annual 2006. US Department of Agriculture Foreign
Agricultural Service, Global Agriculture Information Network, GAIN Report Number: PE6008
Patterson, A., (2006). New Zealand Fresh Deciduous Fruit Annual 2006. US Department of
Agriculture, Foreign Agricultural Service, Global Agriculture Information Network, GAIN Report Number NZ6026, December 19, 2006.
Papatryphon, E., Petit J., Kaushik S.J., & van der Werf, H.M.G., (2004). Environmental Impact
Assessment of Salmonid Feeds Using Life Cycle Assessment (LCA). Ambio, Vol. 33 No. 6, August 2004.
Reganold, J.P., Glover, J.D., Andrews, P.K., & Hinman, H.R., (2001, April). Sustainability of
three apple production systems. Nature, 410, 926-930. University of Chicago, (1999). Greenhouse Gases, Regulated Emissions, and Energy Use in
Transportation (GREET) Model, v. 1.7. Argonne National Lab, Energy Systems Division, Center for Transportation Research.
USDA, (2001, June). Fruit and Vegetable Agricultural Practices – 1999. US Department of
Agriculture, National Agricultural Statistics Service, Ag Ch 1 (01). USDA, (2003, July). Agricultural Chemical Usage: 2002 Vegetable Summary. US Department
of Agriculture, National Agricultural Statistics Service, Ag Ch 1 (03)b. USDA, (2004, August). Agricultural Chemical Usage: 2003 Fruit Summary. US Department
of Agriculture, National Agricultural Statistics Service, Ag Ch 1 (04). USDA, (2005a, August). World Asparagus Situation and Outlook. US Department of
Agriculture, Foreign Agricultural Service, World Horticultural Trade & U.S. Export Opportunities. http://www.fas.usda.gov/htp/Hort_Circular/2005/08-05/Asparagus%20article.pdf
USDA, (2005b, July). Agricultural Chemical Usage: 2004 Vegetable Summary. US
Department of Agriculture, National Agricultural Statistics Service, Ag Ch 1 (05). USDA, (2006a). Apples, Washington. US Department of Agriculture, National Agricultural
Statistics Service, Washington Field Office Retrieved February 22, 2007 from the NASS- Washington Historic Data web site: http://www.nass.usda.gov/Statistics_by_State/Washington/Historic_Data/fruit/apples.pdf
52
USDA, (2006b, July). Agricultural Chemical Usage: 2005 Fruit Summary. US Department of
Agriculture, National Agricultural Statistics Service, Ag Ch 1 (06)a. USDA, (2006c, November). Washington’s Potato Estimating Program. US Department of
Agriculture, National Agricultural Statistics Service. Washington Field Office. USDA, (2006d). Asparagus, Washington. US Department of Agriculture, National Agricultural
Statistics Service, Washington Field Office. USDA, (2006e, May). Agricultural Chemical Usage: 2005 Field Crops Summary. US
Department of Agriculture, National Agricultural Statistics Service, Ag Ch 1 (02)a.
Top Related