


Languages
Pages
Legal


ORIGINAL ARTICLE
Seasonal variations of fatty acid profile in differenttissues of farmed bighead carp (Aristichthys nobilis)
Hui Hong & Hongbing Fan & Hang Wang & Han Lu &
Yongkang Luo & Huixing Shen
Revised: 22 July 2013 /Accepted: 26 July 2013# Association of Food Scientists & Technologists (India) 2013
Abstract Bighead carp (Aristichthys nobilis) is one of themajor farmed species of freshwater fish in China. Byproductvolume of bighead carp is significant at up to 60 % of wholefish weight. A better understanding of the nutritional compo-sition is needed to optimize the use of these rawmaterials. Theobjective of this research was to characterize seasonal varia-tions of fatty acid profile in different tissues (heads, bones,skin, scales, viscera, muscle and fins) of farmed bighead carp.The fatty acid composition of farmed bighead carp variedsignificantly with seasons and tissues. The highest lipid con-tent was determined in viscera while the highest EPA andDHA composition were observed in muscle compared to theother tissues. Significantly higher ΣEPA+DHA (%) wasrecorded in all tissues in summer (June) when compared withthose of the other three seasons (p<0.05). The n-3/n-6 fattyacid ratios in summer ranged from 3.38 to 3.69, nearly threetimes the ratios of the other three seasons. The results indicat-ed that farmed bighead carp caught in summer could betterbalance the n-3 PUFA needs of consumers. The byproducts ofbighead carp can be utilized for the production of fish oil.
Keywords Polyunsaturated fatty acids (PUFA) . n-3/n-6 fattyacid ratio . EPA . DHA .Gas chromatography
Abbreviations
EPA Eicosapentaenoic acidDHA Docosahexaenoic acidn-3 PUFA Omega-3 polyunsaturated fatty acidsFAMEs Fatty acid methyl estersLA Linoleic acidLNA Linolenic acidSFA Saturated fatty acidsMUFA Monounsaturated fatty acidsHUFA High polyunsaturated fatty acids
Introduction
A number of previous scientific reports indicated that mostbiological wastes from fish product processing factories donot deserve to be dumped to waste (Liaset et al. 2000;Mamelona et al. 2010). They should be reclaimed, reprocessedand exploited in different area, notably to produce some value-added products. Actually, these wastes are often rich in naturalelements of nutritional importance such as advantageous fattyacid, especially the PUFA. Thus, a better understanding of thenutritional and chemical composition is needed to optimize theuse of these raw materials.
Bighead carp (Aristichthys nobilis) is one of the mainfreshwater fish species of commercial interest in inland ofChina. It was estimated that 2,668,000 t were harvested in2011 (Fishery Bureau of Ministry of Agriculture of thePeople’s Republic of China 2012). Approximately 60 % ofthe total weights of bighead carp is produced as biologicalwastes. Most of them are discarded and sent thereafter towaste disposals or at best processed for fishmeal production.However, much of the oil in byproducts of bighead carp is apotential ideal source of the PUFA. During the last decades, a
H. Hong :H. Fan :H. Wang :H. Lu :Y. Luo (*)College of Food Science and Nutritional Engineering, ChinaAgricultural University, Beijing Higher Institution EngineeringResearch Center of Animal Product, P. O. Box 112, Beijing 100083,Chinae-mail: [email protected]
Y. Luoe-mail: [email protected]
H. ShenCollege of Science, China Agricultural University, Beijing 100083,China
J Food Sci TechnolDOI 10.1007/s13197-013-1129-1

great amount of studies have been reported on the significanceof PUFA in human nutrition. The n-3 PUFA, especially EPAand DHA have been documented to prevent diseases such ascardiovascular diseases, psoriasis, bowel diseases, cancer,mental illnesses and rheumatoid arthritis, etc. (Narayan et al.2006; Rubio-Rodríguez et al. 2010). Additionally, DHA is amajor component of brain, eye retina and heart muscle. It hasbeen considered as important for brain and eye development(Whelan et al. 1993). Considering all these facts, consumingfish oil rich in n-3 PUFA can not be neglected.
Different fatty acid composition of raw fish byproduct hasbeen evaluated extensively (Swapna et al. 2010). The fattyacid profile of the oil products varies by fish species and thetypes of waste components used (heads, viscera, skin, frames,trim, etc.) (Wu et al. 2011). Further, differences in the seasonof catching alter the fatty acid composition of fish and oilmade from these materials owing to the size, reproductivecycle of the fish and external factors, such as environmentaltemperature, salinity and feed (Gökçe et al. 2004; Inhamunsand Franco 2008). In order to maximize the use of the fishprocessing by-products as advantageous oil products, thesedifferences need to be characterized.
The purpose of the present study was to characterize theseasonal difference of the fatty acid composition betweenvaried tissues of farmed bighead carp. Results are comparedto other fish species and intend to serve as a tool for decisionmaking in better utilization of those byproducts.
Materials and methods
Sample preparation
All the commercial-scale farmed bighead carps (n=12) werecollected from the same aqua farm (Miyun District) in subur-ban areas of Beijing during four seasons (March, June,September and December) in 2012. They were raised inponds, feeding on a commercial formulated feed. The proxi-mate constituents in the feed were as follows: approximately28 % protein (stemmed from fishmeal, soybean meal andrapeseed meal); 6 % lipids (mostly marine fish oil in origin);15 % ash, and 12 % fibre (rice bran). As the bighead carp is akind of filter-feeder fish, they also feed on native phytoplankton,zooplankton in the pond. After collection, the farmed bigheadcarps were immediately transported to the laboratory alive. Themean weight and length of fish during four seasons were1502±92.2 g and 43.3±1.32 cm, respectively. Fish was killedby a blow to the head. Then the heads, bones, skin, scales,viscera, muscle and fins were separated and homogenized witha high-speed tissue grinder. The remaining muscle on the bonewas removed as much as possible by scraping with a smallknife. The homogenates were stored at −18 °C prior to fatty acidanalysis.
Chemicals
The BF3:CH3OH mixture (14:86, by vol.) was obtained fromSigma–Aldrich Corporation (St. Louis, MO, USA). Standard37 component FAME mixture was purchased from SupelcoInc. (Bellefonte, PA, USA). All other reagents (chloroform,methanol, hexane, etc.) used in this study were of chemicalgrade and commercially available.
Proximate composition analysis
Moisture, ash and crude protein contents were determinedaccording to the Association of Official Analytical Chemistsprocedures (AOAC 1995). Crude fat was determined by arapid method of total lipid extraction and purification (Blighand Dyer 1959).
Fatty acid analysis
Extraction of total lipids
Total lipids were extracted by following a minor modifiedFolch’s method (Folch et al. 1957) from homogenized tissuesof bighead carp. Briefly, approximately 4 g of sample wereextracted overnight with 20 mL of chloroform/methanol(2:1, v/v). The extracts were then filtered and shake with10 mL of distilled water to get rid of non-lipid substances.The lower phase was collected and evaporated under a streamof nitrogen.
Preparation of fatty acid methyl esters (FAMEs)
Following theAOAC (1995)method, 0.1 g of oil-soluble extractwas saponified by heating in a sealedmethylating tubewith 3mlof 0.5 M NaOH/methanol in a boiling water bath for 10 min.Following the reaction with alkali, 5 mL of a boron trifluoride:methanol (BF3:CH3OH) mixture (14:86, by vol.) were added,and then heated in the boiling water bath for another 2 min.Subsequently, 5 mL of heptane was added to extract the ester-ified fatty acids. The solution was left to cool to room temper-ature, and NaCl was then added to a saturated concentration toprevent emulsion. Finally, the heptane-extracted fraction(upper phase) was dried under a stream of nitrogen.
Analysis of lipid composition (FAMEs analysis)
The FAMEs was fully dissolved in 0.1 mL of hexane, and2 μL of this dissolved solution was injected into a gas chro-matograph (GC8600; Beijing Beifen-Tianpu AnalyticalInstrument (Group) CO., Ltd, Beijing, China) for analysis.The chromatograph was equipped with a SP™-2560 capillarycolumn (100 m×0.25 mm ID.; Supelco Inc., Bellefonte, PA)and a flame ionization detector (FID). Both the injector and
J Food Sci Technol

detector temperatures were set at 250 °C. The initial columntemperature was 140 °C and held for 5 min, then it wasincreased by 4 °C/ min to a final temperature of 240 °C andheld steady for 40 min. Nitrogen was used as the carrier gas at aflow rate of 1.5 ml/min. The fatty acids were identified bycomparing their retention times to a mixture of fatty acidmethyl ester standards (37 component FAME mixture). Abackground spectra without sample injection was acquiredand then spectrum stripping was adopted to eliminate theimpact of background noise. The composition of fatty acidswas expressed in the relative percentage of the total fattyacids according to their peak areas. The relative contentof each component was determined by the area normalizationmethod and then calculated by the following equation: Area%FAX = [AX/AR]×100, where: FAX = fatty acid to be quan-tified, AX = area of the methyl esters X and AR = total area ofthe chromatogram (Memon et al. 2011).
Statistical analysis
All measurements were carried out in triplicate. Data weresubjected to one-way analysis of variance (ANOVA) using theCompare Means Procedure of SPSS Statistics (17.0) (SPSSInc., Chicago, IL). The least significant difference (LSD)procedure was used to test for difference between means(Differences were considered to be significant when p<0.05).
Results and discussion
Proximate composition and proportion of heads, muscle,bones, skin, scales, viscera and fins from farmed bighead carp
Table 1 shows the proximate composition and proportion of thehead, muscle, bones, skin, scales, viscera and fins from farmedbighead carp (harvested in March). The muscle accounts for41.32 % weight of the whole fish, followed by the head(33.37 %). Three other major freshwater species (crucian carp(Carassius carassius), grass carp (Ctenopharyngodon idella)and common carp (Cyprinus carpio)) have a relatively lower
proportion of heads according to our previous research(Hong et al. 2013). The proximate composition of bigheadcarp differs significantly in the level of moisture, crude pro-teins, ash and crude fat between tissues. The crude fat contentof muscle was 0.55 %, significantly lower than crude fatcontent of viscera (10.13 %) (p<0.05). Fish are often classi-fied into lean fish (fat less than 5 %), medium fat fish (fat 5–10 %) and fatty fish (fat more than 10 % by weight) on thebasis of their fat contents (Rahnan et al. 1995). Based on thisclassification, bighead carp could be characterized as lean fish.The highest crude protein value in bighead carp was observedin skin (24.28 %) and the lowest in viscera (11.70 %). Themoisture of fin was the lowest, while no significant differencewas determined between head, skin and scale (p>0.05). Theash content of bighead carp muscle was very closed to that ofthe dorsal meat cut of farmed giant catfish (Pangasianodongigas) (1.47 %, wet weight) (Chaijan et al. 2010).
Fatty acid composition
Gas chromatographic analysis of the fatty acids in the totallipid fraction of the fish samples revealed the presence of 27different fatty acids, 18 of which were unsaturated and 9 thatwere saturated (Tables 2, 3, 4 and 5). In general, most of fattyacid of different tissues in farmed bighead carp exhibitednotable similarities, with relatively high content of polyunsat-urated fatty acids (PUFA), predominantly C18:2n6 (linoleicacid, LA), C18:3n3 (linolenic acid, LNA), C20:5n3 (EPA) andC22:6n3 (DHA). The edible part, especially the muscle,shows highest EPA and DHA content when compared withthe corresponding content in other tissues. In contrast, Huynhet al. (2007) reported a converse pattern of EPA and DHA inspawning and non-spawning Pacific herring (Clupeaharengus pallasi). The highest EPA and DHA were deter-mined in their livers and gonad. This phenomenon is attribut-able in large part to that DHA is an important component ofmembrane structural lipids (Tocher and Harvie 1988), therelative percentage of this HUFA is expected to increaseduring the gonad development stage. A lower level of SFAof fish muscle was observed during spring (March), while a
Table 1 Proximate composition and proportion of heads, muscle, bones, skin, scales, viscera and fins of farmed bighead carp (% fresh weight)
Head Muscle Bone Skin Scale Viscera Fin
Proportion% 33.37±2.23c 41.32±2.79d 7.40±0.53b 2.92±0.24a 2.05±0.23a 6.34±0.13b 3.54±1.12a
Moisture% 70.55±1.30c 78.94±0.10e 66.68±2.36b 71.79±0.39cd 71.38±0.39c 74.23±1.95d 58.25±1.53a
Crude protein% 12.45±2.26ab 17.90±0.36d 14.57±0.99bc 24.28±2.15f 21.64±1.42e 11.70±0.50a 15.27±0.91c
Lipids% 3.48±0.50b 0.55±0.12a 1.27±0.68a 0.88±0.14a 0.11±0.03a 10.13±1.64c 0.67±0.10a
Ash% 8.89±0.69b 1.67±0.35a 8.19±0.26b 0.86±0.20a 9.46±1.66b 0.87±0.089a 17.73±1.64c
Values are expressed as Mean ± SD of triplicate measurements; Least Significant Difference (LSD); Different superscript lowercase letters (a, b, c, d) insame row indicate significant difference at p<0.05
J Food Sci Technol

higher proportion of PUFA was observed during summer(June) (Table 2). Similar results were reported by Dal Boscoet al. (2012) for goldfish (Carassius auratus L.).
Saturated fatty acids (SFA)
The dominant saturated fatty acid in farmed bighead carpwas palmitic acid (C16:0) (ranging from 12 % to 23 % indifferent tissues), contributing approximately 50.0–69.1 % to
the total SFA content during all seasons. Palmitic acid wasreported to be abundant since it is a key metabolite in fish andits level is not influenced by the diet (Ackman 1967). Thisfinding agrees with the study on fatty acid profile in flesh ofsome other freshwater fish species (crucian carp, Chineseperch (Siniperca chuatsi), snakehead (Channa argus), grasscarp, common carp, black carp (Mylopharyngodon piceus),silver carp (Hypophthalmichthys molitrix), swamp eel(Monopterus albus) and oriental weatherfish (Misgurnusanguillicaudatus)) (Li et al. 2011). C16:0 content determinedin scales was the highest compared to any other tissues duringspring (March), autumn (September) and winter (December),while they were determined the lowest in summer (June)(12 %). There were no significant differences between seasonsin terms of C16:0 in heads, bones,muscle and fins (p>0.05). Thehighest C16:0 was obtained in scale during spring (23.07 %).
Stearic acid (C18:0) was the second major SFA (3.82~11.32 %). The highest C18:0 was obtained in scales in thespring (March), significantly higher than that in the summer(June) (p<0.05). However, Xu et al. (2010) reported a differentresult that the highest C18:0 was presented in the liver(13~15%) of Japanese sea bass (Lateolabrax japonicus) rearedin seawater and freshwater. C15:0, C17:0, C20:0, C21:0, C24:0were found to be low in SFA fractions of all tissues investigat-ed. Behenic acid (C22:0) obtained in the summer (June)(1.95~3.23 %) in all tissues were the highest compared withtheir counterpart during the other three seasons (p<0.05).
Monounsaturated fatty acids (MUFA)
The total MUFA ranged from 21.80% to 36.99% (Tables 2, 3,4 and 5) in all tissues of bighead carp during the whole year.Bighead carp caught in spring (March) had the highest levelsof MUFA in muscle compared with those of the other threeseasons. Oleic (C18:1n-9) and palmitoleic (C16:1) acid dom-inated the MUFA fraction in all tissues of bighead carp andthis was similar to MUFA patterns in muscle, gill, and liver ofgilthead sea bream (Sparus aurata) (Ibarz et al. 2005).
Oleic acid (C18:1n-9) has been reported to be positivelycorrelated with the maximal swimming speed of Atlanticsalmon (Salmo Salar), indicating that these fatty acids ratherthan PUFA are the preferred fuels in swimming muscles offish (McKenzie et al. 1998). The C18:1n-9 in the present studywas the most abundant MUFA in all tissues, ranging from12.24 % to 23.45 %. The highest C18:1n-9 was observed inthe viscera obtained during spring (March). This observationsuggests that this particular fatty acid is transferred directlyfrom the diet, with greater levels found in the digestive organs(Huynh et al. 2007).
Palmitoleic acid (C16:1) was the second major MUFA(3.31–9.04%) in all tissues of bighead carp during four seasonsand they were lower than the reported C16:1 content of Vimbavimba tenella (16.20–20.01 %) by Kalyoncu et al. (2009).
Table 2 Fatty acid composition (% of total fatty acids) in the total lipidsof muscle from farmed bighead carp
Fattyacids
Spring(March)
Summer(June)
Autumn(September)
Winter(December)
C14:0 2.19±0.08a 2.65±0.13a 2.43±0.08a 2.64±0.56a
C15:0 0.60±0.15a 0.69±0.57a 0.26±0.03a 0.29±0.05a
C16:0 16.19±2.03a 15.22±0.36a 17.18±0.60a 17.83±1.51a
C17:0 0.51±0.27a 1.21±0.23b 0.84±0.34a 1.18±0.08b
C18:0 5.18±0.92a 6.87±0.72b 6.34±0.96ab 5.94±0.26ab
C20:0 0.19±0.07a 0.36±0.06b 0.39±0.02b 0.26±0.13ab
C21:0 0.08±0.07ab 0.06±0.07a 0.17±0.01b 0.14±0.01ab
C22:0 0.31±0.16a 1.95±0.08c 0.71±0.06b 0.50±0.11a
C24:0 0.06±0.04a 0.06±0.02a 0.07±0.03a 0.11±0.07a
ΣSFA 25.30±0.43a 29.07±1.19b 28.33±0.59b 28.87±2.09b
C14:1 0.73±0.06a 1.30±0.57ab 0.97±0.11a 1.74±0.21b
C15:1 0.17±0.13a 0.42±0.19b 0.06±0.02a 0.05±0.01a
C16:1 7.10±1.20a 6.26±1.38a 5.40±0.37a 6.20±0.43a
C17:1 0.26±0.19a 0.50±0.01a 0.83±0.15b 1.12±0.16c
C18:1n9 22.07±6.72a 14.91±2.73a 18.72±3.12a 15.63±3.36a
C20:1 1.24±0.17ab 1.10±0.15a 1.45±0.13b 1.20±0.02ab
C22:1n9 0.34±0.17a 0.13±0.01a 0.31±0.18a 0.20±0.01a
C24:1 0.12±0.02a 0.24±0.12b 0.10±0.02a 0.04±0.02a
ΣMUFA 32.03±7.49a 24.87±2.54a 27.84±2.93a 26.17±2.54a
C18:2n6 LA 8.34±3.10b 2.98±0.37a 11.79±1.57c 6.41±0.33b
C18:3n6 0.53±0.69a 0.38±0.02a 0.36±0.23a 0.49±0.08a
C18:3n3LNA
4.46±0.79a 5.66±0.44b 6.79±0.19c 6.08±0.47bc
C20:2 1.46±0.15b 0.61±0.02a 0.57±0.08a 0.79±0.16a
C20:3n6 0.47±0.20a 0.26±0.09a 0.42±0.20a 0.54±0.07a
C20:3n3 0.72±0.19a 1.14±0.01b 0.76±0.07a 0.91±0.16ab
C20:4n6 2.79±0.66a 2.88±0.49a 2.47±0.61a 4.58±0.69b
C22:2 1.54±0.18a 2.81±0.33b 1.61±0.16a 1.53±0.18a
C20:5n3 EPA 6.49±1.86ab 7.76±0.29b 4.62±0.76a 6.54±0.83ab
C22:6n3DHA
5.72±0.95a 9.18±0.87b 5.04±0.94a 6.58±1.36a
ΣPUFA 32.53±4.28a 33.66±1.25a 34.78±1.60a 33.65±4.43a
Σn-3 17.40 23.73 17.20 20.10
Σn-6 12.13 6.51 15.40 12.02
n-3/n-6 1.43 3.65 1.12 1.67
Values are expressed as Mean ± SD of triplicate measurements; LeastSignificant Difference (LSD); Different superscript lowercase letters (a, b,c) in same row indicate significant difference at p<0.05
J Food Sci Technol

C16:1 in autumn (September) was lower than those of the otherthree seasons in heads, bones, skin, viscera, muscle and fins.C15:1, C17:1, C22:1n9 and C24:1 contributed a small fractionto MUFA.
Polyunsaturated fatty acids (PUFA)
The amount of PUFA ranged from the lowest value 26.54% inscales in the spring (March) to 37.03 % in fin in autumn(September). The highest percentage of PUFA was noted in
muscle (32.53~34.78 %) during four seasons except PUFA infins in autumn (September). Similar amount of PUFA werealso reported for meat of common two-banded seabream(Diplodus vulgaris) (34.03 %), sand smelt (Atherina boyeri)(34.70 %) and black goby (Gobius niger) (34.24 %) (Pratoand Biandolino 2012), while significantly higher percentageof PUFAwere observed in zander (Sander lucioperca) (50.2–57.0 %) (Guler et al. 2007).
The PUFAwas mainly composed of n-3 and n-6 PUFA. Allexamined tissues contained higher proportions of n-3 PUFA
Table 3 Fatty acid composition (% of total fatty acids) in the total lipids of scale and viscera from farmed bighead carp
Fatty acids Scale Viscera
Spring(March)
Summer(June)
Autumn(September)
Winter(December)
Spring(March)
Summer(June)
Autumn(September)
Winter(December)
C14:0 2.05±0.17bc 3.10±0.06d 1.56±0.82ab 1.16±0.26a 2.73±0.61cd 3.43±0.63de 2.79±0.14cd 3.96±0.24e
C15:0 1.06±0.84b 0.02±0.18a 0.46±0.37bc 0.18±0.05a 0.07±0.04a 0.33±0.06a 0.30±0.03a 0.46±0.01bc
C16:0 23.07±1.33e 12.01±2.62a 19.11±1.60d 18.23±0.92cd 14.00±1.68ab 15.27±0.70b 16.31±0.94bc 17.93±0.67cd
C17:0 0.61±0.06a 0.58±0.54a 1.11±0.13bc 1.38±0.03c 0.44±0.22a 1.28±0.06c 0.85±0.15ab 1.18±0.06bc
C18:0 11.32±0.55b 4.77±1.34a 10.46±2.89b 9.34±0.83b 3.82±0.46a 6.13±0.89a 5.08±0.17a 4.10±1.81a
C20:0 0.25±0.04abc 0.24±0.05ab 0.48±0.10d 0.15±0.03a 0.13±0.11a 0.34±0.14bcd 0.39±0.02cd 0.47±0.03d
C21:0 0.06±0.04a 0.04±0.03a 0.13±0.06abc 0.12±0.05abc 0.17±0.05bc 0.10±0.01abc 0.18±0.04c 0.08±0.08ab
C22:0 0.20±0.02a 3.23±0.53e 0.55±0.17abc 0.17±0.12a 0.32±0.18ab 2.44±0.08d 0.85±0.02c 0.62±0.18bc
C24:0 0.43±0.53b 0.06±0.00ab 0.11±0.08ab 0.22±0.07ab 0.05±0.02a 0.07±0.01ab 0.05±0.00a 0.13±0.00ab
ΣSFA 39.04±0.63e 24.05±4.25ab 33.98±3.41c 30.95±1.62c 22.05±0.38a 29.36±1.08c 26.80±1.04bc 28.93±1.49c
C14:1 0.95±0.08a 1.49±0.33a 1.85±1.70a 1.72±0.09a 1.09±0.35a 1.11±0.16a 1.13±0.04a 2.07±0.09a
C15:1 0.03±0.02a 0.28±0.01d 0.28±0.06d 0.16±0.13bc 0.09±0.01ab 0.20±0.07cd 0.04±0.03a 0.07±0.03ab
C16:1 6.88±0.20cd 7.29±0.55cd 3.31±1.81a 4.56±0.36ab 8.62±0.84de 7.11±0.95cd 6.15±0.30bc 9.04±1.26e
C17:1 0.69±0.39ab 0.64±0.11ab 0.38±0.33a 1.11±0.13cd 0.56±0.15ab 0.51±0.04ab 0.82±0.09bc 1.39±0.05d
C18:1n9 12.24±0.32a 17.76±1.73ab 23.01±4.19b 14.86±1.40a 23.45±5.56b 15.17±1.27a 21.92±4.37b 13.81±1.88a
C20:1 0.44±0.11a 1.46±0.29bc 0.56±0.57ab 0.60±0.42abc 1.61±1.26c 1.16±0.12abc 1.56±0.13bc 1.42±0.09abc
C22:1n9 0.11±0.02a 0.32±0.12ab 0.11±0.04a 0.61±0.45b 0.30±0.08a 0.13±0.07a 0.20±0.03a 0.23±0.04a
C24:1 0.45±0.16d 0.28±0.06c 0.14±0.07ab 0.63±0.05e 0.15±0.05abc 0.20±0.02bc 0.06±0.04a 0.17±0.01abc
ΣMUFA 21.80±0.26a 29.52±3.21bc 28.69±2.44bc 24.25±1.15ab 36.87±4.81d 25.58±2.15ab 31.02±2.68c 28.20±0.80bc
C18:2n6 LA 7.12±0.37ab 4.01±0.48a 13.34±4.45cd 3.63±0.69a 10.32±3.24bc 3.32±0.30a 14.01±0.65d 7.08±0.84ab
C18:3n6 1.30±0.53bc 0.46±0.01a 0.75±0.41abc 0.58±0.20ab 1.46±0.96c 0.48±0.01a 0.40±0.15a 0.54±0.22ab
C18:3n3 LNA 2.21±0.74a 7.17±0.27b 3.23±2.13a 2.33±1.06a 6.30±1.59b 6.96±0.19b 7.88±0.23b 7.80±0.31b
C20:2 1.13±0.10c 0.36±0.20a 0.66±0.17b 0.85±0.10b 1.74±0.14d 0.66±0.03b 0.74±0.12b 0.80±0.15b
C20:3n6 0.27±0.13b 0.43±0.08c 0.49±0.07c 0.12±0.04a 0.55±0.10c 0.40±0.13bc 0.50±0.03c 0.56±0.04c
C20:3n3 0.66±0.18abc 1.31±0.07d 0.47±0.17ab 0.42±0.56a 0.91±0.25bcd 1.27±0.11d 0.80±0.04abc 1.08±0.07cd
C20:4n6 4.37±0.31c 1.93±0.06a 2.99±0.63b 8.30±0.91d 1.73±0.63a 1.89±0.08a 1.41±0.06a 2.96±0.16b
C22:2 0.85±0.25a 3.46±0.17d 0.96±0.29a 0.98±0.22a 1.84±0.52c 3.26±0.12d 1.75±0.05b 1.89±0.06bc
C20:5n3 EPA 4.07±0.10ab 7.33±0.15d 2.72±0.64a 4.58±0.32bc 4.76±1.35bc 7.05±0.23d 3.72±0.15b 4.97±0.20c
C22:6n3 DHA 4.56±0.27b 7.29±0.08c 3.47±0.60a 7.20±0.28c 2.88±0.63a 7.21±0.66c 3.04±0.23a 4.35±0.20b
ΣPUFA 26.54±1.24a 33.75±1.07d 29.46±0.70ab 28.14±1.21bc 30.80±4.78a 32.50±1.47d 34.61±1.27d 31.22±1.59cd
Σn-3 11.49 23.10 9.88 14.53 14.84 22.49 15.43 18.20
Σn-6 13.06 6.83 17.96 12.63 14.06 6.09 16.69 11.14
n-3/n-6 0.88 3.38 0.55 1.15 1.06 3.69 0.92 1.63
Values are expressed asMean ± SD of triplicate measurements; Least Significant Difference (LSD); Different superscript lowercase letters (a, b, c, d, e) insame row indicate significant difference at p<0.05
J Food Sci Technol
than those of n-6 PUFA. A dietary intake of fish with high n-3/n-6 ratio would be beneficial as people in modernized societytend to intake more n-6 PUFA (Memon et al. 2011). However,wild longsnout catfish (Leiocassis longirostris) contained alarger proportion of n-6 PUFA than n-3 PUFA (Wang et al.2012) which may be due to the fact that wild environmentprovides a good source of n-6 PUFA.
The major contributor to n-3 PUFAwas DHA (C22:6n-3),followed by EPA (C20:5n-3), that together accounted for56.16–71.38 % (muscle), 62.29–81.07 % (scales), 43.81–63.41 % (viscera), 48.08–63.98 % (skin), 45.26–61.83 %(fins), 43.51–62.93 % (bones), 45.46–62.53 % (heads) of thetotal n-3 PUFA. Significant higher value (over 70 %) wasreported for salema (Sarpa salpa), bogue (Boops boops),
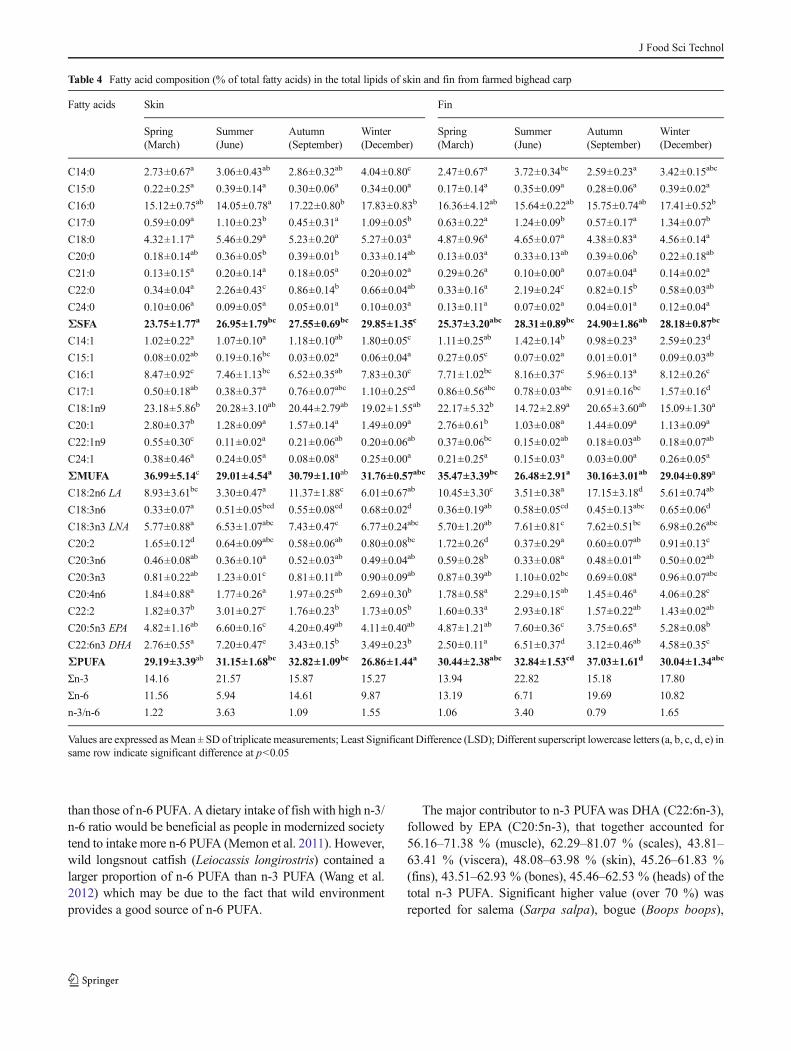
Table 4 Fatty acid composition (% of total fatty acids) in the total lipids of skin and fin from farmed bighead carp
Fatty acids Skin Fin
Spring(March)
Summer(June)
Autumn(September)
Winter(December)
Spring(March)
Summer(June)
Autumn(September)
Winter(December)
C14:0 2.73±0.67a 3.06±0.43ab 2.86±0.32ab 4.04±0.80c 2.47±0.67a 3.72±0.34bc 2.59±0.23a 3.42±0.15abc
C15:0 0.22±0.25a 0.39±0.14a 0.30±0.06a 0.34±0.00a 0.17±0.14a 0.35±0.09a 0.28±0.06a 0.39±0.02a
C16:0 15.12±0.75ab 14.05±0.78a 17.22±0.80b 17.83±0.83b 16.36±4.12ab 15.64±0.22ab 15.75±0.74ab 17.41±0.52b
C17:0 0.59±0.09a 1.10±0.23b 0.45±0.31a 1.09±0.05b 0.63±0.22a 1.24±0.09b 0.57±0.17a 1.34±0.07b
C18:0 4.32±1.17a 5.46±0.29a 5.23±0.20a 5.27±0.03a 4.87±0.96a 4.65±0.07a 4.38±0.83a 4.56±0.14a
C20:0 0.18±0.14ab 0.36±0.05b 0.39±0.01b 0.33±0.14ab 0.13±0.03a 0.33±0.13ab 0.39±0.06b 0.22±0.18ab
C21:0 0.13±0.15a 0.20±0.14a 0.18±0.05a 0.20±0.02a 0.29±0.26a 0.10±0.00a 0.07±0.04a 0.14±0.02a
C22:0 0.34±0.04a 2.26±0.43c 0.86±0.14b 0.66±0.04ab 0.33±0.16a 2.19±0.24c 0.82±0.15b 0.58±0.03ab
C24:0 0.10±0.06a 0.09±0.05a 0.05±0.01a 0.10±0.03a 0.13±0.11a 0.07±0.02a 0.04±0.01a 0.12±0.04a
ΣSFA 23.75±1.77a 26.95±1.79bc 27.55±0.69bc 29.85±1.35c 25.37±3.20abc 28.31±0.89bc 24.90±1.86ab 28.18±0.87bc
C14:1 1.02±0.22a 1.07±0.10a 1.18±0.10ab 1.80±0.05c 1.11±0.25ab 1.42±0.14b 0.98±0.23a 2.59±0.23d
C15:1 0.08±0.02ab 0.19±0.16bc 0.03±0.02a 0.06±0.04a 0.27±0.05c 0.07±0.02a 0.01±0.01a 0.09±0.03ab
C16:1 8.47±0.92c 7.46±1.13bc 6.52±0.35ab 7.83±0.30c 7.71±1.02bc 8.16±0.37c 5.96±0.13a 8.12±0.26c
C17:1 0.50±0.18ab 0.38±0.37a 0.76±0.07abc 1.10±0.25cd 0.86±0.56abc 0.78±0.03abc 0.91±0.16bc 1.57±0.16d
C18:1n9 23.18±5.86b 20.28±3.10ab 20.44±2.79ab 19.02±1.55ab 22.17±5.32b 14.72±2.89a 20.65±3.60ab 15.09±1.30a
C20:1 2.80±0.37b 1.28±0.09a 1.57±0.14a 1.49±0.09a 2.76±0.61b 1.03±0.08a 1.44±0.09a 1.13±0.09a
C22:1n9 0.55±0.30c 0.11±0.02a 0.21±0.06ab 0.20±0.06ab 0.37±0.06bc 0.15±0.02ab 0.18±0.03ab 0.18±0.07ab
C24:1 0.38±0.46a 0.24±0.05a 0.08±0.08a 0.25±0.00a 0.21±0.25a 0.15±0.03a 0.03±0.00a 0.26±0.05a
ΣMUFA 36.99±5.14c 29.01±4.54a 30.79±1.10ab 31.76±0.57abc 35.47±3.39bc 26.48±2.91a 30.16±3.01ab 29.04±0.89a
C18:2n6 LA 8.93±3.61bc 3.30±0.47a 11.37±1.88c 6.01±0.67ab 10.45±3.30c 3.51±0.38a 17.15±3.18d 5.61±0.74ab
C18:3n6 0.33±0.07a 0.51±0.05bcd 0.55±0.08cd 0.68±0.02d 0.36±0.19ab 0.58±0.05cd 0.45±0.13abc 0.65±0.06d
C18:3n3 LNA 5.77±0.88a 6.53±1.07abc 7.43±0.47c 6.77±0.24abc 5.70±1.20ab 7.61±0.81c 7.62±0.51bc 6.98±0.26abc
C20:2 1.65±0.12d 0.64±0.09abc 0.58±0.06ab 0.80±0.08bc 1.72±0.26d 0.37±0.29a 0.60±0.07ab 0.91±0.13c
C20:3n6 0.46±0.08ab 0.36±0.10a 0.52±0.03ab 0.49±0.04ab 0.59±0.28b 0.33±0.08a 0.48±0.01ab 0.50±0.02ab
C20:3n3 0.81±0.22ab 1.23±0.01c 0.81±0.11ab 0.90±0.09ab 0.87±0.39ab 1.10±0.02bc 0.69±0.08a 0.96±0.07abc
C20:4n6 1.84±0.88a 1.77±0.26a 1.97±0.25ab 2.69±0.30b 1.78±0.58a 2.29±0.15ab 1.45±0.46a 4.06±0.28c
C22:2 1.82±0.37b 3.01±0.27c 1.76±0.23b 1.73±0.05b 1.60±0.33a 2.93±0.18c 1.57±0.22ab 1.43±0.02ab
C20:5n3 EPA 4.82±1.16ab 6.60±0.16c 4.20±0.49ab 4.11±0.40ab 4.87±1.21ab 7.60±0.36c 3.75±0.65a 5.28±0.08b
C22:6n3 DHA 2.76±0.55a 7.20±0.47e 3.43±0.15b 3.49±0.23b 2.50±0.11a 6.51±0.37d 3.12±0.46ab 4.58±0.35c
ΣPUFA 29.19±3.39ab 31.15±1.68bc 32.82±1.09bc 26.86±1.44a 30.44±2.38abc 32.84±1.53cd 37.03±1.61d 30.04±1.34abc
Σn-3 14.16 21.57 15.87 15.27 13.94 22.82 15.18 17.80
Σn-6 11.56 5.94 14.61 9.87 13.19 6.71 19.69 10.82
n-3/n-6 1.22 3.63 1.09 1.55 1.06 3.40 0.79 1.65
Values are expressed asMean ± SD of triplicate measurements; Least Significant Difference (LSD); Different superscript lowercase letters (a, b, c, d, e) insame row indicate significant difference at p<0.05
J Food Sci Technol

common two-banded seabream and sand smelt (Prato andBiandolino 2012). The ΣEPA+DHA (%) of all bighead carptissues in summer (June) were the highest compared withthose of the other three seasons (p<0.05) (Fig. 1). This couldbe explained by the fact that the farmed bighead carp con-sumed a larger quantity of freshwater phytoplankton andzooplankton, which was rich in n-3 PUFA, in summer(June) than other seasons. Gökçe et al. (2004) also reported
higher ΣEPA+DHA in female common sole (Solea Solea)during the summer than the other three seasons. The lowestΣEPA+DHA were presented in autumn (September) (6.20–9.65 %), but still being higher than those of another threekinds of freshwater fish: grass carp (4.5 %), common carp(2.6 %) and black carp (1.3 %) (Li et al. 2011). The amount ofΣEPA+DHA in the edible part (muscle) of bighead carp washigher than those of other tissues.
Table 5 Fatty acid composition (% of total fatty acids) in the total lipids of bone and head from farmed bighead carp
Fatty acids Bone Head
Spring(March)
Summer(June)
Autumn(September)
Winter(December)
Spring(March)
Summer(June)
Autumn(September)
Winter(December)
C14:0 2.50±0.57a 3.20±0.04a 3.21±0.04a 3.16±0.67a 3.27±1.31a 3.47±0.49a 2.80±0.39a 3.61±0.08a
C15:0 0.07±0.02a 0.10±0.06a 0.35±0.08cd 0.17±0.21abc 0.10±0.03a 0.15±0.15ab 0.31±0.04bcd 0.37±0.01d
C16:0 17.72±4.68a 14.33±0.90a 16.20±2.38a 17.01±1.33a 16.29±0.97a 15.08±0.42a 16.78±0.55a 17.73±0.45a
C17:0 0.90±0.69abc 1.21±0.03bc 0.76±0.28ab 1.18±0.07bc 0.41±0.11a 1.27±0.03bc 0.67±0.09a 1.30±0.04c
C18:0 4.88±2.24a 4.83±0.16a 4.64±0.71a 4.63±0.08a 3.88±0.74a 5.32±0.17a 5.17±0.54a 4.81±0.39a
C20:0 0.21±0.23ab 0.42±0.07c 0.40±0.04bc 0.25±0.15abc 0.19±0.06a 0.31 ±0.06abc 0.40±0.02bc 0.44±0.02c
C21:0 0.05±0.06a 0.03±0.03a 0.11±0.08a 0.10±0.08a 0.10±0.12a 0.13±0.05ab 0.29±0.20b 0.15±0.00ab
C22:0 0.33±0.15a 2.34±0.04c 0.88±0.05b 0.74±0.04b 0.19±0.09a 2.24±0.23c 0.81±0.09b 0.71±0.02b
C24:0 0.07±0.01ab 0.07±0.02ab 0.05±0.01a 0.11±0.04b 0.07±0.01ab 0.05±0.03a 0.05±0.00a 0.10±0.03b
ΣSFA 26.74±8.52a 26.52±1.18b 26.58±3.17b 27.36±2.27b 24.48±2.91ab 28.01±0.69b 27.27±1.17b 29.23±0.11b
C14:1 1.08±0.29a 1.23±0.14a 1.29±0.13a 1.97±0.30b 1.25±0.29a 1.30±0.18a 1.09±0.21a 2.25±0.08b
C15:1 0.08±0.03a 0.13±0.03a 0.02±0.01a 0.03±0.01a 0.53±0.15b 0.12±0.06a 0.02±0.00a 0.07±0.04a
C16:1 7.44±0.90bcd 7.09±0.26abc 6.60±0.21ab 7.84±0.73cd 8.52±1.27d 7.33±0.20bcd 5.94±0.37a 8.03±0.36cd
C17:1 0.44±0.13a 0.69±0.03a 0.86±0.13a 0.88±0.73a 0.64±0.35a 0.65±0.07a 0.80±0.09a 1.27±0.07a
C18:1n9 22.47±6.90c 17.34±0.62abc 19.57±1.08a 17.06±0.33abc 21.60±2.79bc 16.67±2.75ab 20.65±2.62bc 15.28±1.40a
C20:1 2.56±0.10c 1.11±0.04a 1.56±0.11ab 1.41±0.16ab 1.84±0.78b 1.21±0.09a 1.54±0.12ab 1.30±0.06ab
C22:1n9 0.29±0.09c 0.17±0.04ab 0.21±0.04bc 0.23±0.04bc 0.18±0.07ab 0.09±0.02a 0.17±0.01ab 0.20±0.04bc
C24:1 0.08±0.02ab 0.10±0.03ab 0.05±0.01a 0.16±0.04c 0.06±0.04ab 0.11±0.04bc 0.05±0.01a 0.11±0.03abc
ΣMUFA 34.44±7.16b 27.86±0.76ab 30.17±1.16ab 29.58±1.58ab 34.63±8.67b 27.48±2.90a 30.25±2.18ab 28.49±1.10ab
C18:2n6 LA 9.64±3.81bc 3.46±0.46a 13.94±1.19cd 6.76±0.24ab 11.23±3.64cd 3.48±0.42a 14.70±1.62d 7.08±0.25ab
C18:3n6 0.31±0.03a 0.59±0.03a 0.44±0.14a 0.72±0.09a 0.76±0.88a 0.61±0.05a 0.56±0.04a 0.72±0.05a
C18:3n3 LNA 5.95±0.94ab 6.70±0.22abc 8.15±0.64c 7.85±0.32c 5.73±1.57a 7.09±0.76abc 7.40±0.57bc 7.86±0.27c
C20:2 1.72±0.16a 0.39±0.28a 0.55±0.02a 0.93±0.11a 1.71±0.50a 0.63±0.01a 0.46±0.31a 0.91±0.06a
C20:3n6 0.46±0.01bc 0.35±0.01ab 0.46±0.06bc 0.57±0.11c 0.54±0.14c 0.33±0.01a 0.47±0.03bc 0.50±0.01c
C20:3n3 0.75±0.07a 1.01±0.04bc 0.81±0.07ab 1.04±0.12c 0.75±0.26a 1.14±0.06c 0.78±0.09a 1.01±0.06bc
C20:4n6 1.54±0.22a 1.71±0.03ab 1.49±0.16a 2.86±0.23c 1.65±0.57ab 2.09±0.17b 1.58±0.24a 3.06±0.15c
C22:2 1.71±0.24a 2.85±0.15b 1.73±0.17a 1.76±0.24a 1.84±0.56a 2.94±0.23b 1.61±0.14a 1.66±0.12a
C20:5n3 EPA 4.67±0.75a 6.96±0.44b 3.90±0.37a 5.32±0.61a 5.13±2.01a 7.13±0.49b 3.83±0.40a 5.30±0.35a
C22:6n3 DHA 2.55±0.11a 6.13±0.20d 3.01±0.29ab 3.99±0.84c 2.94±1.13ab 6.62±0.37d 2.98±0.10ab 3.79±0.25bc
ΣPUFA 29.30±1.33a 30.15±0.94ab 34.91±2.92b 30.88±2.94ab 32.29±4.55ab 32.06±2.31ab 34.45±1.01b 30.97±0.78ab
Σn-3 13.92 20.80 15.88 18.20 14.55 21.99 14.98 17.96
Σn-6 11.95 6.11 16.76 10.92 14.19 6.50 17.40 11.35
n-3/n-6 1.16 3.40 0.95 1.67 1.03 3.38 0.86 1.58
Values are expressed as Mean ± SD of triplicate measurements; Least Significant Difference (LSD); Different superscript lowercase letters (a, b, c, d) insame row indicate significant difference at p<0.05
J Food Sci Technol

The most abundant n-6 PUFAwas linoleic acid (C18:2n-6),which is the highest in autumn (September) (ranging from11.37 % to 14.70 %) as compared to those of the other threeseasons (Tables 2, 3, 4 and 5). Huynh and Kitts (2009) ob-served that comparatively low C18:2n-6 (ranging from 0.85 %to 1.5%)were determined in eight kinds of pacific fish species,including Walleye pollock (Theragra chalcogramma), Pacificherring (Clupea harengus pallasi), capelin (Mallotus villosus),hake (Merluccius productus), canary rock fish (Sebastespinniger), sardine (Sardinops sagax), surf smelt (Hypomesuspretiosus) and pink salmon (Onchorhynchus gorbuscha).However, similar amount of C18:2n-6 (6.3–18.4 %) was re-ported in accordance with present results for eight kinds offreshwater species: crucian carp, Chinese perch, snakehead,grass carp, common carp, black carp, swamp eel and Orientalweatherfish (Li et al. 2011). Accordingly, we can draw aconclusion that freshwater species possibly possess largeramounts of C18:2n-6 than mostly marine species.
Arachidonic acid (C20:4n-6) was the second major n-6PUFA in all tissues of bighead carp during four seasons.Similar to EPA and DHA, C20:4n-6 is involved in maintainingcell membrane structure and function and also contributed toreproductive systems in fish (Cejas et al. 2004). C20:4n-6 waslower than either EPA or DHA in heads, bones, skin, viscera,muscle and fins during the whole year but it cannot beneglected in fish due to its important role in a variety ofphysiological functions including osmoregulation and cardio-vascular function (Cejas et al. 2004).
Pigott and Tucker (1990) proposed that the n-3/n-6 ratio isa useful indicator for comparing the relative nutritional valueof fish of different species. An increase in the human dietary n-3/n-6 fatty acid ratio helps to prevent cardiovascular diseasedue to strong anti-inflammatory effects of n-3 fatty acids(Simopoulos 2008). The ratio of n-3/n-6 PUFA in total lipidsof bighead carp varied from four seasons. The n-3/n-6 fattyacid ratios in summer (June) were nearly three times the ratiosof the other three seasons in all tissues (Tables 2, 3, 4 and 5).These high n-3/n-6 fatty acid ratios were the result of highΣEPA+DHA in summer (June). Dal Bosco et al. (2012) also
observed that the highest n-3/n-6 fatty acid ratios occurred inthe summer (June) for goldfish (Carassius auratus L.). Thus,the farmed bighead carp caught in the summer (June) is ofhigh nutritional value for human consumption by balancingn-3/n-6 ratio in the usual diet.
Comparison of SFA, MUFA and PUFA
The PUFA was the highest in the muscle of bighead carp inspring, summer, winter and autumn, compared with MUFAand SFAwhich was in agreement with a similar study carriedout by Li et al. (2011). The highest level of PUFA wasobserved in the scale during spring as a result of dominatedEPA and DHA, while the SFA were the most abundant fattyacids during spring, autumn and winter. MUFA contents werehigher than both of the SFAs and PUFAs in viscera, bone,head, skin and fin during spring,respectively. As reported byGuler et al. (2007), freshwater fish such as zander partiallypreferred to accumulate PUFA rather than SFA and MUFA inthe richer feeding period. This is in agreement with ourfinding that the highest PUFA occurred in the muscle ofbighead carp in summer. We can attribute this to the fact thatbighead carp is a typical filter-feeder fish. They consumemorephytoplankton and zooplankton whose development is partic-ularly abundant during summer in fresh water. Furthermore,the phytoplankton and zooplankton are the main source ofPUFA for fish, especially long-chain n-3 PUFA (EPA andDHA) (Sahena et al. 2009).
Conclusion
This study represented a step towards the characterization anddistribution of seasonal fatty acid profile of the whole bigheadcarp. The muscle of bighead carp was the most excellent sourcesof n-3 PUFA in the whole fish which could balanced fatty acidintake of today’s consumers. The best fatty acid signature offarmed bighead carp was obtained in the summer and it isproposed that the number of fish caught during this period shouldbe increased. These results could be of practical value from anutrition perspective for populations who consume these fish.
Acknowledgement This study was supported by the earmarked fundfor China Agriculture Research System (CARS–46) and National NaturalScience Foundation of China (award nr 30871946).
References
Ackman RG (1967) Characteristics of the fatty acid composition andbiochemistry of some fresh-water fish oils and lipids in comparisonwith marine oils and lipids. Comp Biochem Physiol 22:907–922
AOAC (1995) Methods of analysis, 16th edn. Association of OfficialAnalytical Chemists, Washington, DC
0
2
4
6
8
10
12
14
16
18
20
Muscle Scale Viscera Skin Fin Bone Head
∑E
PA
+DH
A (
%)
Tissues of farmed bighead carp
March
June
September
December
Fig. 1 ΣEPA+DHA (%) in different tissues (muscle, scales, viscera,skin, fins, bones and heads) of farmed bighead carp during four seasons
J Food Sci Technol

Bligh EG, Dyer WJ (1959) A rapid method of total lipid extraction andpurification. Can J Biochem Physiol 37:911–917
Cejas JR, Almansa E, Jérez S, Bolaños A, Samper M, Lorenzo A (2004)Lipid and fatty acid composition of muscle and liver from wild andcaptive mature female broodstocks of white seabream, Diplodussargus. Comp Biochem Physiol B: Biochem Mol Biol 138:91–102
Chaijan M, Jongjareonrak A, Phatcharat S, Benjakul S, Rawdkuen S(2010) Chemical compositions and characteristics of farm raisedgiant catfish (Pangasianodon gigas) muscle. LWT–Food SciTechnol 43:452–457
Dal Bosco A, Mugnai C, Mourvaki E, Castellini C (2012) Seasonalchanges in the fillet fatty acid profile and nutritional characteristicsof wild Trasimeno Lake goldfish (Carassius auratus L.). FoodChem 132:830–834
Folch J, Lees M, Sloane Stanley GH (1957) A simple method for theisolation and purification of total lipides from animal tissues. J BiolChem 226:497–509
Fishery Bureau of Ministry of Agriculture of the People’s Republic ofChina (2012) China fishery statistical yearbook. China AgriculturePress, Beijing (in Chinese)
Gökçe MA, Taşbozan O, Çelik M, Tabakoğlu ŞS (2004) Seasonal vari-ations in proximate and fatty acid compositions of female commonsole (Solea solea). Food Chem 88:419–423
Guler GO, Aktumsek A, Citil OB, Arslan A, Torlak E (2007) Seasonalvariations on total fatty acid composition of fillets of zander (Sanderlucioperca) in Beysehir Lake (Turkey). Food Chem 103:1241–1246
Hong H, Luo Y, Zhou Z, Bao Y, Lu H, Shen H (2013) Effects of differentfreezing treatments on the biogenic amine and quality changes ofbighead carp (Aristichthys nobilis) heads during ice storage. FoodChem 138:1476–1482
HuynhMD, Kitts DD (2009) Evaluating nutritional quality of pacific fishspecies from fatty acid signatures. Food Chem 114:912–918
Huynh MD, Kitts DD, Hu C, Trites AW (2007) Comparison of fatty acidprofiles of spawning and non-spawning Pacific herring, Clupeaharengus pallasi. Comp Biochem Physiol B: Biochem Mol Biol146:504–511
Ibarz A, Blasco J, Beltrán M, Gallardo MA, Sánchez J, Sala R,Fernández-Borràs J (2005) Cold-induced alterations on proximatecomposition and fatty acid profiles of several tissues in gilthead seabream (Sparus aurata). Aquaculture 249:477–486
Inhamuns AJ, Franco MRB (2008) EPA and DHA quantification in twospecies of freshwater fish from Central Amazonia. Food Chem 107:587–591
Kalyoncu L, Kıssal S, Aktumsek A (2009) Seasonal changes in the totalfatty acid composition of Vimba, Vimba vimba tenella (Nordmann,1840) in Eğirdir Lake, Turkey. Food Chem 116:728–730
Li G, Sinclair AJ, Li D (2011) Comparison of lipid content and Fatty Acidcomposition in the edible meat of wild and cultured freshwater andmarine fish and shrimps from china. J Agric FoodChem59:1871–1881
Liaset B, Lied E, Espe M (2000) Enzymatic hydrolysis of byproductsfrom the fish-filleting industry; chemical characterisation and nutri-tional evaluation. J Sci Food Agr 80:581–589
Mamelona J, Saint–Louis R, Pelletier É (2010) Proximate compo-sition and nutritional profile of by-products from green urchin andAtlantic sea cucumber processing plants. Intl J Food Sci Tech45:2119–2126
McKenzie DJ, Higgs DA, Dosanjh BS, Deacon G, Randall DJ (1998)Dietary fatty acid composition influences swimming performance inAtlantic salmon (Salmo salar) in seawater. Fish Physiol Biochem19:111–122
Memon NN, Talpur FN, Bhanger MI, Balouch A (2011) Changes in fattyacid composition in muscle of three farmed carp fish species (Labeorohita, Cirrhinus mrigala, Catla catla) raised under the same con-ditions. Food Chem 126:405–410
Narayan B, Miyashita K, Hosakawa M (2006) Physiological effects ofeicosapentaenoic acid (EPA) and docosahexaenoic acid (DHA)—Areview. Food Rev Int 22:291–307
Pigott GM, Tucker BW (1990) Seafood: Effects of technology on nutri-tion. Marcel Dekker, New York
Prato E, Biandolino F (2012) Total lipid content and fatty acid composi-tion of commercially important fish species from theMediterranean,Mar Grande Sea. Food Chem 131:1233–1239
Rahnan SA, Huah TS, Nassan O, Daud NM (1995) Fatty acid composi-tion of some Malaysian freshwater fish. Food Chem 54:45–49
Rubio-Rodríguez N, Beltrán S, Jaime I, de Diego SM, Sanz MT,Carballido JR (2010) Production of omega-3 polyunsaturated fattyacid concentrates: a review. Innov Food Sci Emerg 11:1–12
Sahena F, Zaidul ISM, Jinap S, Saari N, Jahurul HA, Abbas KA,Norulaini NA (2009) PUFAs in fish: extraction, fractionation, im-portance in health. Compr Rev Food Sci Food Saf 8:59–74
Simopoulos AP (2008) The omega-6/omega-3 fatty acid ratio, geneticvariation, and cardiovascular disease. Asia Pac J ClinNutr 17:131–134
Swapna HC, Rai A, Bhaskar N, Sachindra NM (2010) Lipid classes andfatty acid profile of selected Indian fresh water fishes. J Food SciTechnol 47:394–400
Tocher D, Harvie D (1988) Fatty acid compositions of the majorphosphoglycerides from fish neural tissues; (n-3) and (n-6) polyun-saturated fatty acids in rainbow trout (Salmo gairdneri) and cod(Gadus morhua) brains and retinas. Fish Physiol Biochem 5:229–239
Wang F, Ma X, Wang W, Liu J (2012) Comparison of proximate com-position, amino acid and fatty acid profiles in wild, pond- and cage-cultured longsnout catfish. Intl J Food Sci Tech 47:1772–1776
Whelan J, Surette ME, Hardardóttir I, Lu G, Golemboski KA, Larsen E,Kinsella JE (1993) Dietary arachidonate enhances tissuearachidonate levels and eicosanoid production in Syrian hamsters.J Nutr 123:2174–2185
Wu TH, Nigg JD, Stine JJ, Bechtel PJ (2011) Nutritional and chemicalcomposition of By-product fractions produced from wet reductionof individual red salmon (Oncorhynchus nerka) heads and viscera. JAquat Food Prod T 20:183–195
Xu J, Yan B, Teng Y, Lou G, Lu Z (2010) Analysis of nutrient compo-sition and fatty acid profiles of Japanese sea bass Lateolabraxjaponicus (Cuvier) reared in seawater and freshwater. J FoodComp Anal 23:401–405
J Food Sci Technol
Top Related