


Languages
Pages
Legal


Satellite Remote SensingSatellite Remote Sensing
GE 4150GE 4150-- Natural HazardsNatural Hazards
Some slides taken from Ann Maclean: Introduction to Some slides taken from Ann Maclean: Introduction to Digital Image ProcessingDigital Image Processing
Remote SensingRemote Sensing
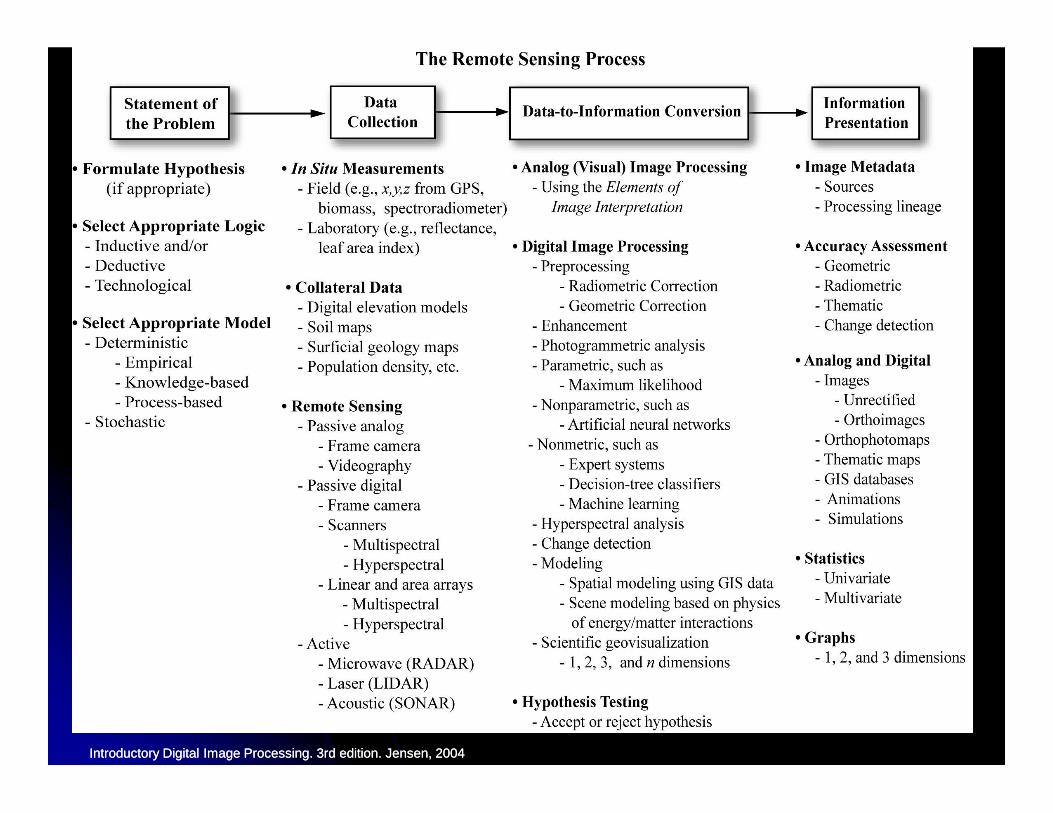
“the art, science, and technology of obtaining “the art, science, and technology of obtaining reliable information about physical objects and the reliable information about physical objects and the environment, through the process of recording, environment, through the process of recording, measuring and interpreting imagery and digital measuring and interpreting imagery and digital measuring and interpreting imagery and digital measuring and interpreting imagery and digital representations of energy patterns derived from representations of energy patterns derived from noncontact sensor systems”. (Cowell 1997)noncontact sensor systems”. (Cowell 1997)
Taken from: Introductory Digital Image Processing. 3Taken from: Introductory Digital Image Processing. 3rdrd edition. edition. Jensen, 2004Jensen, 2004
Remote SensingRemote Sensing
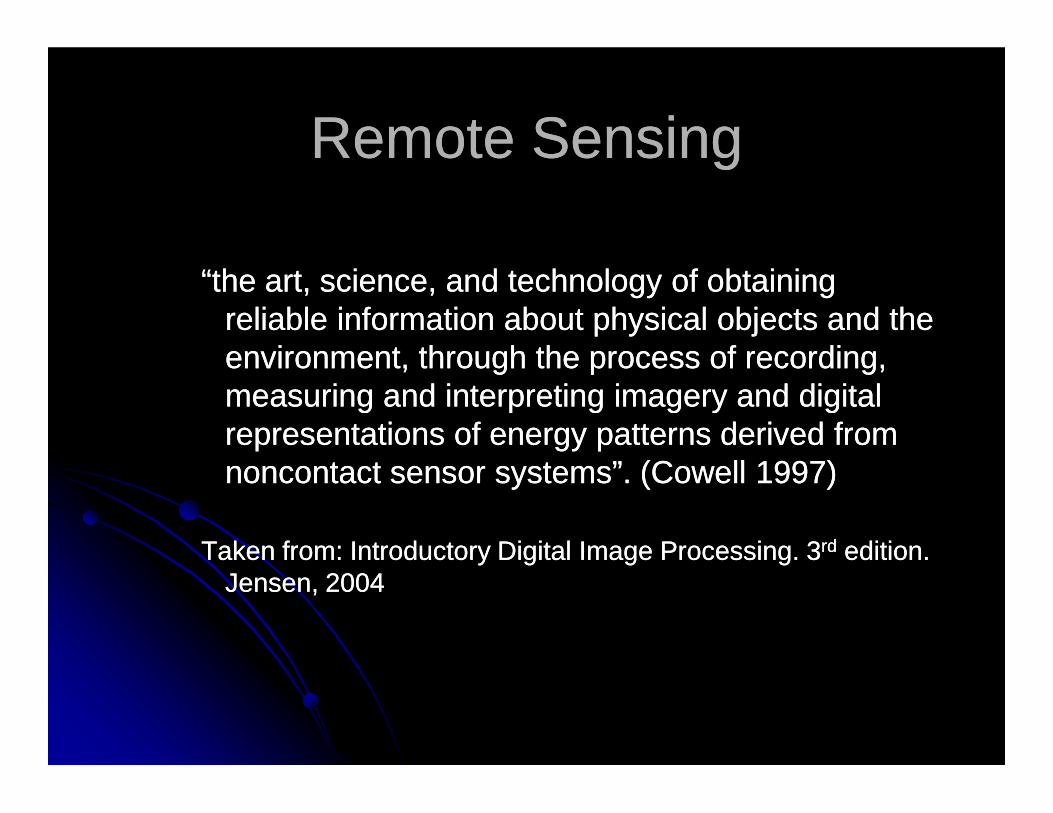
A remote sensing instrument collects information about an
object or phenomenon within the instantaneous-field-of-view instantaneous-field-of-view (IFOV) of the sensor system
without being in direct physical contact with it. The sensor is
located on a suborbitalor satellite platform.
Introductory Digital Image Processing. 3rd edition. Jensen, 2004Introductory Digital Image Processing. 3rd edition. Jensen, 2004
Remote SensingRemote Sensing
Remote sensing is a tool or technique similar to mathematics. Using sensors to measure the amount of electromagnetic radiation (EMR) exiting an object or geographic area from a distance and then extracting valuable information from the data using mathematically information from the data using mathematically and statistically based algorithms is a scientificactivity. It functions in harmony with other spatialdata-collection techniques or tools of the mapping sciences, including cartography and geographic information systems (GIS) (Clarke, 2001).
Introductory Digital Image Processing. 3rd edition. Jensen, 2004Introductory Digital Image Processing. 3rd edition. Jensen, 2004

Remote SensingRemote Sensing
Information about an Object or AreaInformation about an Object or AreaSensors can be used to obtain specific information about Sensors can be used to obtain specific information about an object (e.g., the diameter of a cottonwood tree crown) an object (e.g., the diameter of a cottonwood tree crown) or the geographic extent of a phenomenon (e.g., the or the geographic extent of a phenomenon (e.g., the boundary of a cottonwood stand). The EMR reflected, boundary of a cottonwood stand). The EMR reflected, emitted, or backemitted, or back--scattered from an object or geographic scattered from an object or geographic emitted, or backemitted, or back--scattered from an object or geographic scattered from an object or geographic area is used as a area is used as a surrogatesurrogate for the actual property under for the actual property under investigation. The electromagnetic energy investigation. The electromagnetic energy measurements must be calibrated and turned into measurements must be calibrated and turned into information using visual and/or digital image processing information using visual and/or digital image processing techniques.techniques.
Introductory Digital Image Processing. 3rd edition. Jensen, 2004Introductory Digital Image Processing. 3rd edition. Jensen, 2004
Introductory Digital Image Processing. 3rd edition. Jensen, 2004Introductory Digital Image Processing. 3rd edition. Jensen, 2004
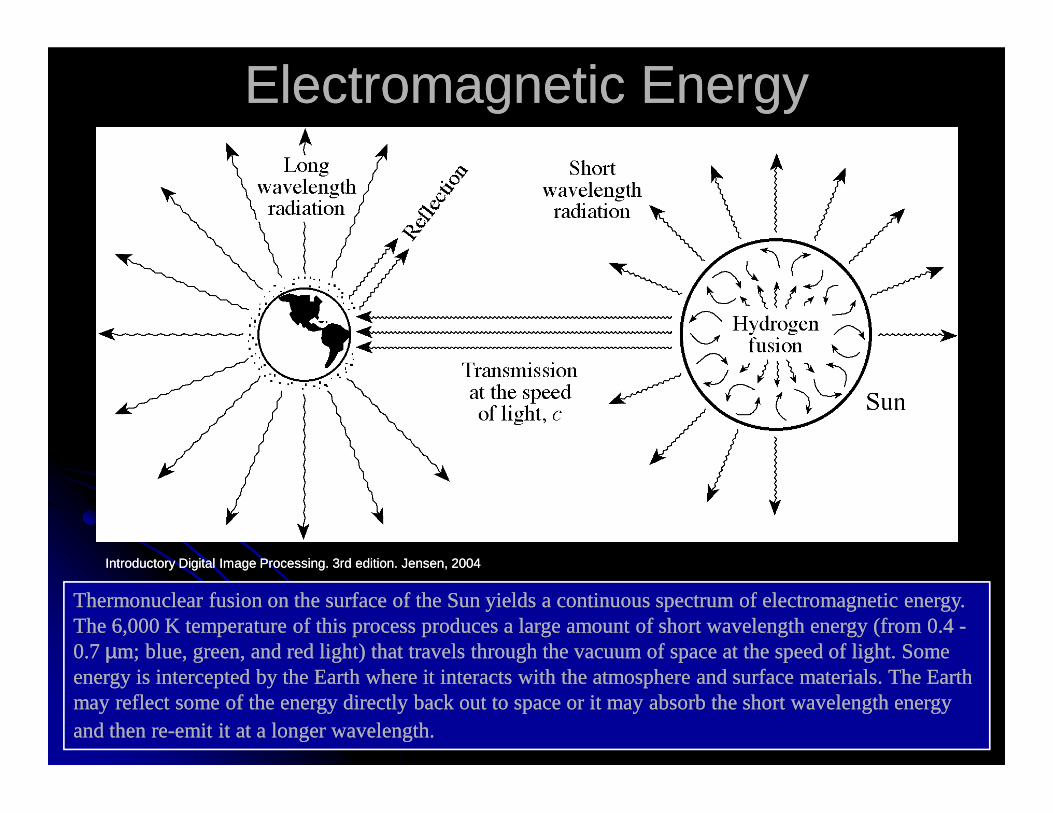
Electromagnetic EnergyElectromagnetic Energy
Thermonuclear fusion on the surface of the Sun yields a continuous spectrum of electromagnetic energy. Thermonuclear fusion on the surface of the Sun yields a continuous spectrum of electromagnetic energy. The 6,000 K temperature of this process produces a large amount of short wavelength energy (from 0.4 The 6,000 K temperature of this process produces a large amount of short wavelength energy (from 0.4 --0.7 0.7 µµm; blue, green, and red light) that travels through the vacuum of space at the speed of light. Some m; blue, green, and red light) that travels through the vacuum of space at the speed of light. Some energy is intercepted by the Earth where it interacts with the atmosphere and surface materials. The Earth energy is intercepted by the Earth where it interacts with the atmosphere and surface materials. The Earth may reflect some of the energy directly back out to space or it may absorb the short wavelength energy may reflect some of the energy directly back out to space or it may absorb the short wavelength energy and then reand then re--emit it at a longer wavelength.emit it at a longer wavelength.
Introductory Digital Image Processing. 3rd edition. Jensen, 2004Introductory Digital Image Processing. 3rd edition. Jensen, 2004
2.5
3.0
3.5
4.0
violet limit
blue
green limit
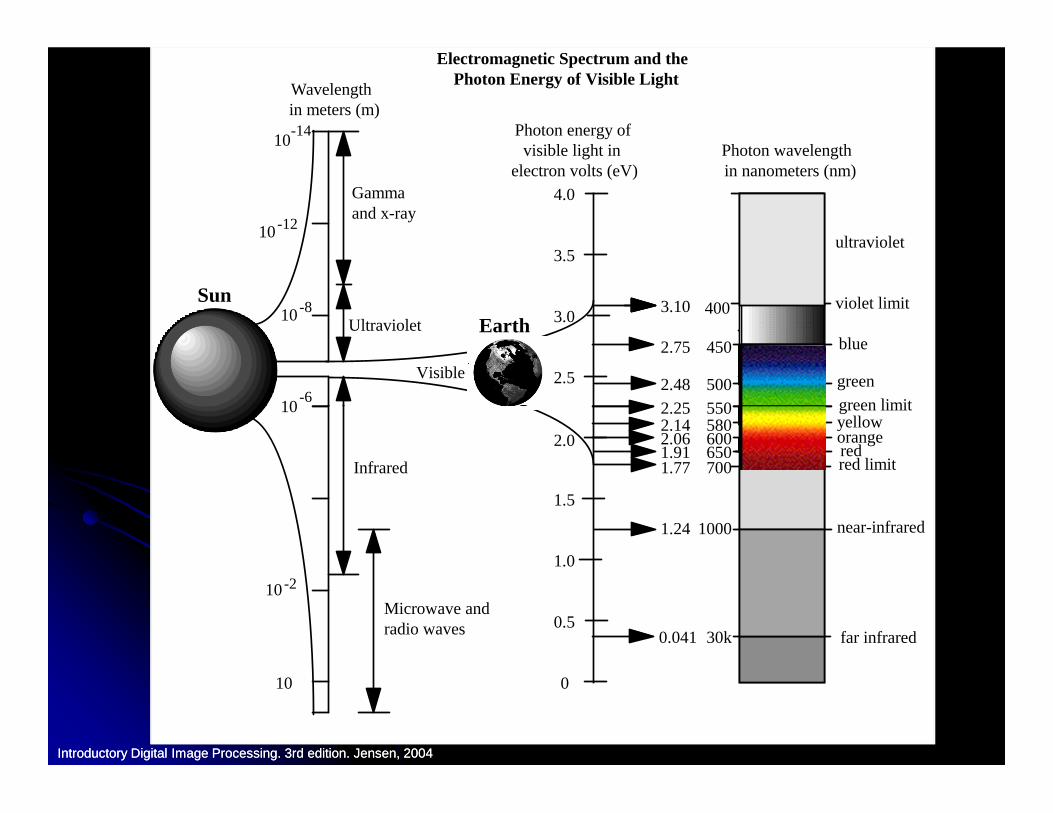
Photon energy of visible light in
electron volts (eV) Photon wavelength in nanometers (nm)
400
450
550
10 -14
10 -8
10 -6
Sun
Earth
Gamma and x-ray
Ultraviolet
Wavelength in meters (m)
Electromagnetic Spectrum and the Photon Energy of Visible Light
Visible
10 -12
3.10
2.75
2.252.48 green 500
ultraviolet
2.5
3.0
3.5
4.0
violet limit
blue
green limit
Photon energy of visible light in
electron volts (eV) Photon wavelength in nanometers (nm)
400
450
550
10 -14
10 -8
10 -6
Sun
Earth
Gamma and x-ray
Ultraviolet
Wavelength in meters (m)
Electromagnetic Spectrum and the Photon Energy of Visible Light
Visible
10 -12
3.10
2.75
2.252.48 green 500
ultraviolet
0
0.5
1.0
1.5
2.0
green limit yellow orange red
550 580 600 650
10
10 -2
10
Infrared
Microwave and radio waves
2.252.142.061.91
10001.24
1.77 700 red limit
30k0.041
near-infrared
far infrared
0
0.5
1.0
1.5
2.0
green limit yellow orange red
550 580 600 650
10
10 -2
10
Infrared
Microwave and radio waves
2.252.142.061.91
10001.24
1.77 700 red limit
30k0.041
near-infrared
far infrared
Introductory Digital Image Processing. 3rd edition. Jensen, 2004Introductory Digital Image Processing. 3rd edition. Jensen, 2004
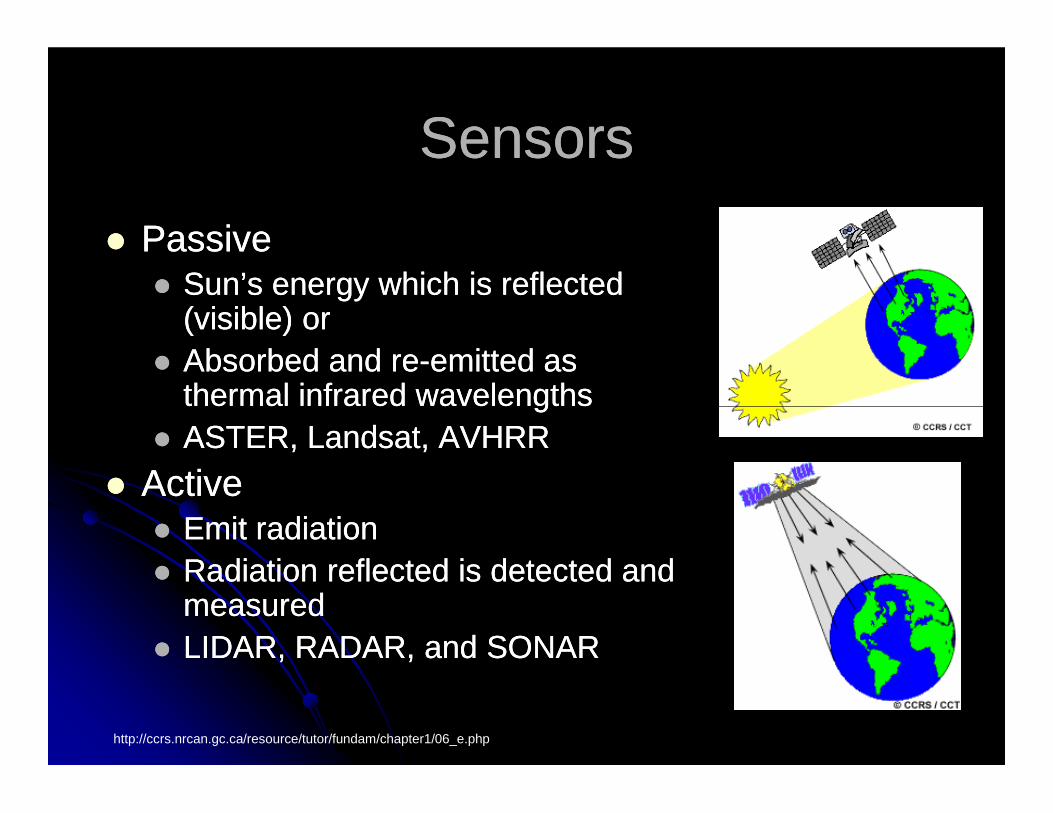
SensorsSensors
�� Passive Passive �� Sun’s energy which is reflected Sun’s energy which is reflected
(visible) or(visible) or�� Absorbed and reAbsorbed and re--emitted as emitted as
thermal infrared wavelengthsthermal infrared wavelengthsthermal infrared wavelengthsthermal infrared wavelengths�� ASTER, Landsat, AVHRRASTER, Landsat, AVHRR
�� ActiveActive�� Emit radiationEmit radiation�� Radiation reflected is detected and Radiation reflected is detected and
measuredmeasured�� LIDAR, RADAR, and SONARLIDAR, RADAR, and SONAR
http://ccrs.nrcan.gc.ca/resource/tutor/fundam/chapter1/06_e.php

Spectral ResolutionSpectral Resolution
Introductory Digital Image Processing. 3rd edition. Jensen, 2004Introductory Digital Image Processing. 3rd edition. Jensen, 2004
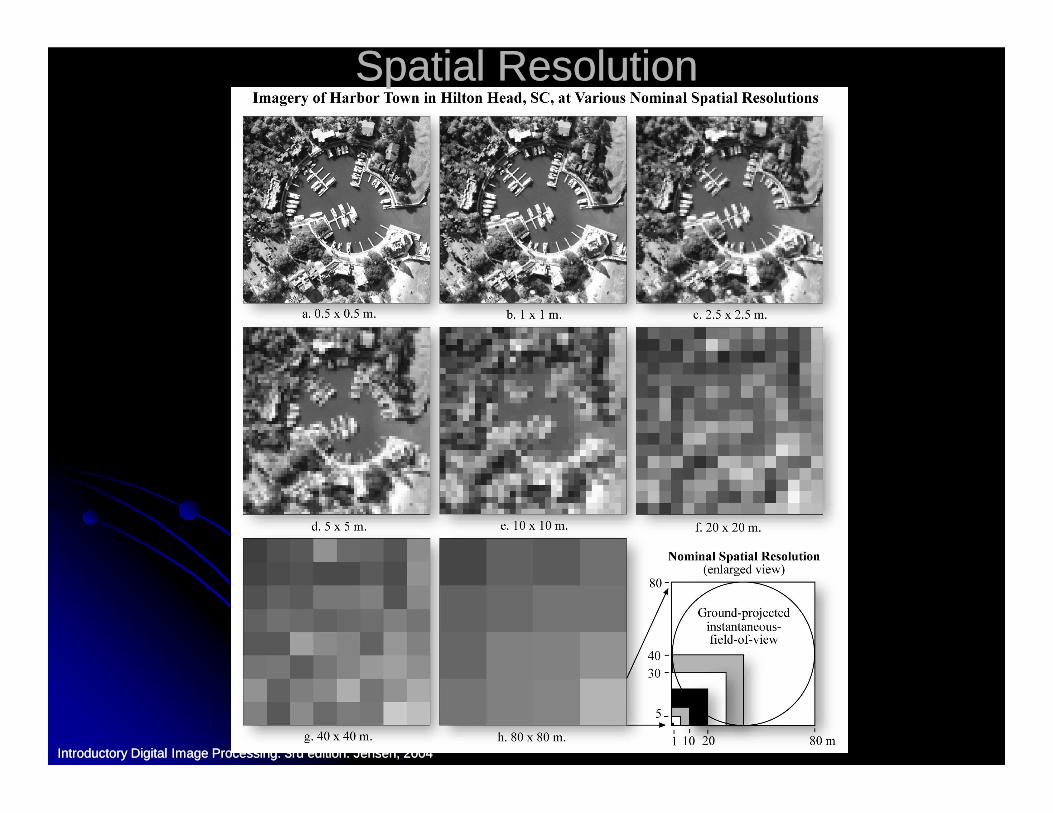
Spatial Spatial ResolutionResolution
Introductory Digital Image Processing. 3rd edition. Jensen, 2004Introductory Digital Image Processing. 3rd edition. Jensen, 2004

Temporal ResolutionTemporal Resolution
June 1, 2004June 1, 2004 June 17, 2004June 17, 2004 July 3, 2004July 3, 2004
Remote Sensor Data AcquisitionRemote Sensor Data Acquisition
16 days16 days

Radiometric ResolutionRadiometric Resolution
88--bitbit0
77--bitbit(0 (0 -- 127)127)0
88--bitbit(0 (0 -- 255)255)
99--bitbit(0 (0 -- 511)511)
1010--bitbit(0 (0 -- 1023)1023)
0
0
0

VolcanologyVolcanology
�� Map lava flows and eruptive deposits Map lava flows and eruptive deposits (lahars)(lahars)
�� Analyze SOAnalyze SO22 in volcanic plumesin volcanic plumes�� Thermal monitoringThermal monitoring�� Digital Elevation ModelsDigital Elevation Models�� Volcanic ash analysisVolcanic ash analysis
MODISMODIS
�� Moderate Resolution Imaging Moderate Resolution Imaging SpectroradiometerSpectroradiometer
�� Launched in 1999 on NASA’s Earth Launched in 1999 on NASA’s Earth Orbiting System (EOS) platformOrbiting System (EOS) platformOrbiting System (EOS) platformOrbiting System (EOS) platform
�� 36 spectral bands36 spectral bands�� http://terra.nasa.gov/About/MODIS/modis_http://terra.nasa.gov/About/MODIS/modis_
swath.htmlswath.html

MODVOLCMODVOLC
�� Algorithm created by University of HawaiiAlgorithm created by University of Hawaii�� “The MODVOLC algorithm automatically “The MODVOLC algorithm automatically
scans each 1 kilometer pixel within it to scans each 1 kilometer pixel within it to check for the presence of highcheck for the presence of high--check for the presence of highcheck for the presence of high--temperature hottemperature hot--spots.”spots.”
�� Used not only for volcanic eruptions, but Used not only for volcanic eruptions, but wildfires as well.wildfires as well.
http://modis.higp.hawaii.edu/
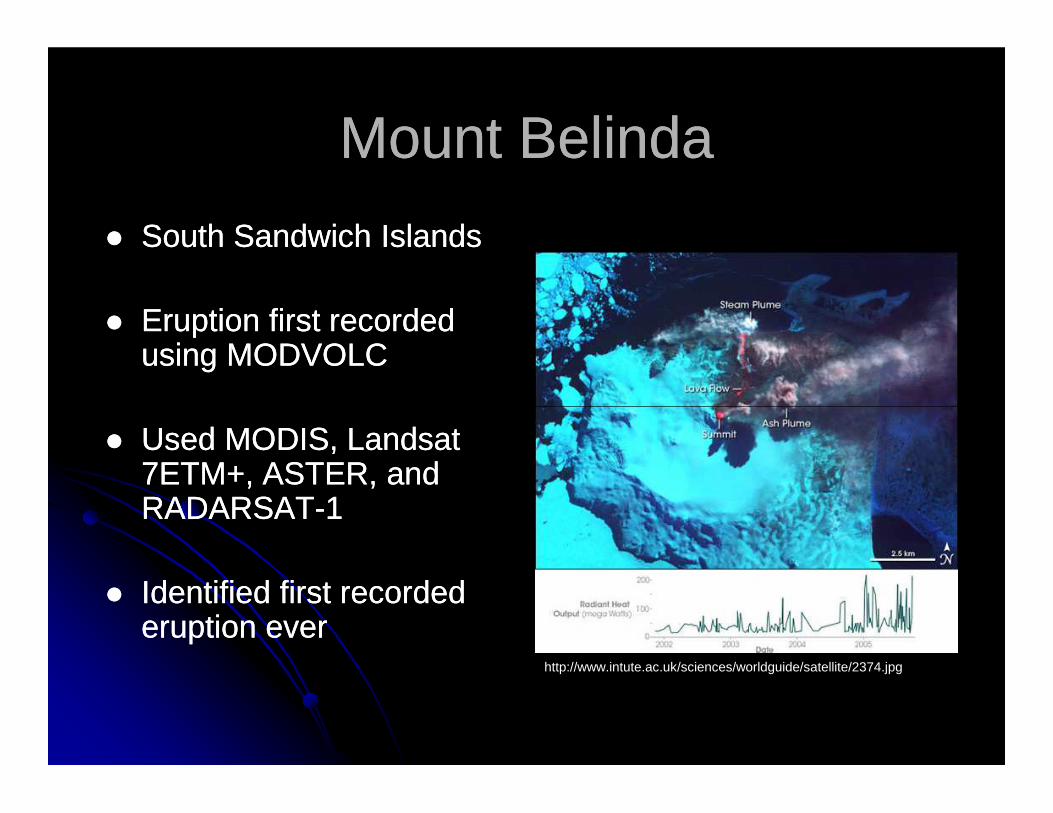
Mount BelindaMount Belinda
�� South Sandwich IslandsSouth Sandwich Islands
�� Eruption first recorded Eruption first recorded using MODVOLCusing MODVOLC
�� Used MODIS, Landsat Used MODIS, Landsat 7ETM+, ASTER, and 7ETM+, ASTER, and RADARSATRADARSAT--11
�� Identified first recorded Identified first recorded eruption evereruption ever
http://www.intute.ac.uk/sciences/worldguide/satellite/2374.jpg
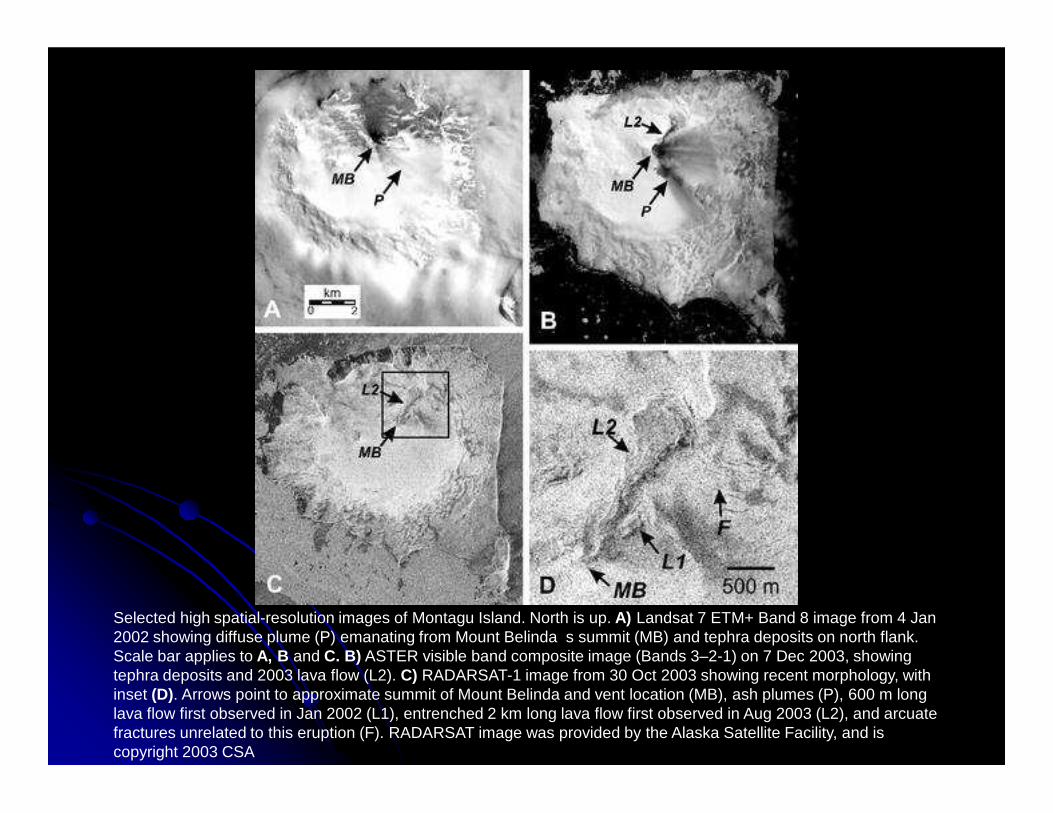
Selected high spatial-resolution images of Montagu Island. North is up. A) Landsat 7 ETM+ Band 8 image from 4 Jan 2002 showing diffuse plume (P) emanating from Mount Belinda s summit (MB) and tephra deposits on north flank. Scale bar applies to A, B and C. B) ASTER visible band composite image (Bands 3–2-1) on 7 Dec 2003, showing tephra deposits and 2003 lava flow (L2). C) RADARSAT-1 image from 30 Oct 2003 showing recent morphology, with inset (D). Arrows point to approximate summit of Mount Belinda and vent location (MB), ash plumes (P), 600 m long lava flow first observed in Jan 2002 (L1), entrenched 2 km long lava flow first observed in Aug 2003 (L2), and arcuate fractures unrelated to this eruption (F). RADARSAT image was provided by the Alaska Satellite Facility, and is copyright 2003 CSA
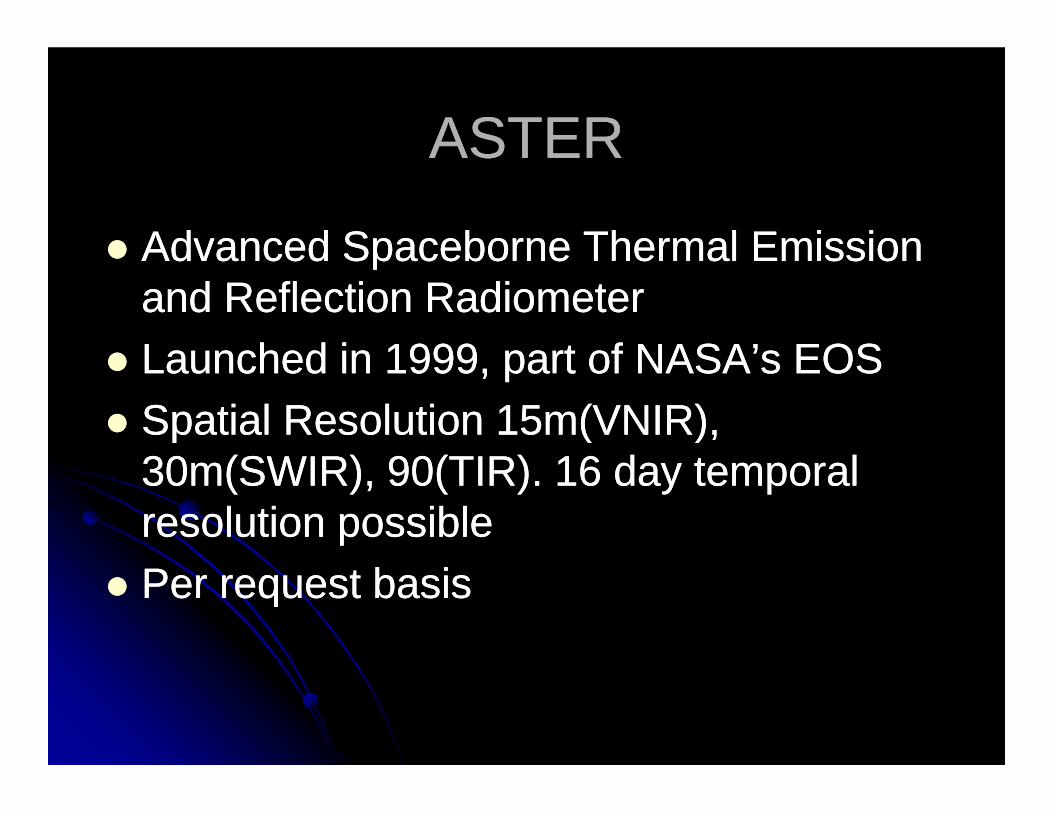
ASTERASTER
�� Advanced Spaceborne Thermal Emission Advanced Spaceborne Thermal Emission and Reflection Radiometerand Reflection Radiometer
�� Launched in 1999, part of NASA’s EOSLaunched in 1999, part of NASA’s EOS�� Spatial Resolution 15m(VNIR), Spatial Resolution 15m(VNIR), �� Spatial Resolution 15m(VNIR), Spatial Resolution 15m(VNIR),
30m(SWIR), 90(TIR). 16 day temporal 30m(SWIR), 90(TIR). 16 day temporal resolution possibleresolution possible
�� Per request basisPer request basis

ASTER UsesASTER Uses
�� Volcanological StudiesVolcanological Studies�� Mineralogical StudiesMineralogical Studies�� Hydrothermal StudiesHydrothermal Studies�� Forest FiresForest FiresForest FiresForest Fires�� Glacier StudiesGlacier Studies�� Limnological StudiesLimnological Studies�� Climatology StudiesClimatology Studies�� Digital Elevation ModelsDigital Elevation Models�� http://asterweb.jpl.nasa.gov/gallerymap.asphttp://asterweb.jpl.nasa.gov/gallerymap.asp

http://asterweb.jpl.nasa.gov/content/03_data/05_Application_Examples/volcanology/default.htm

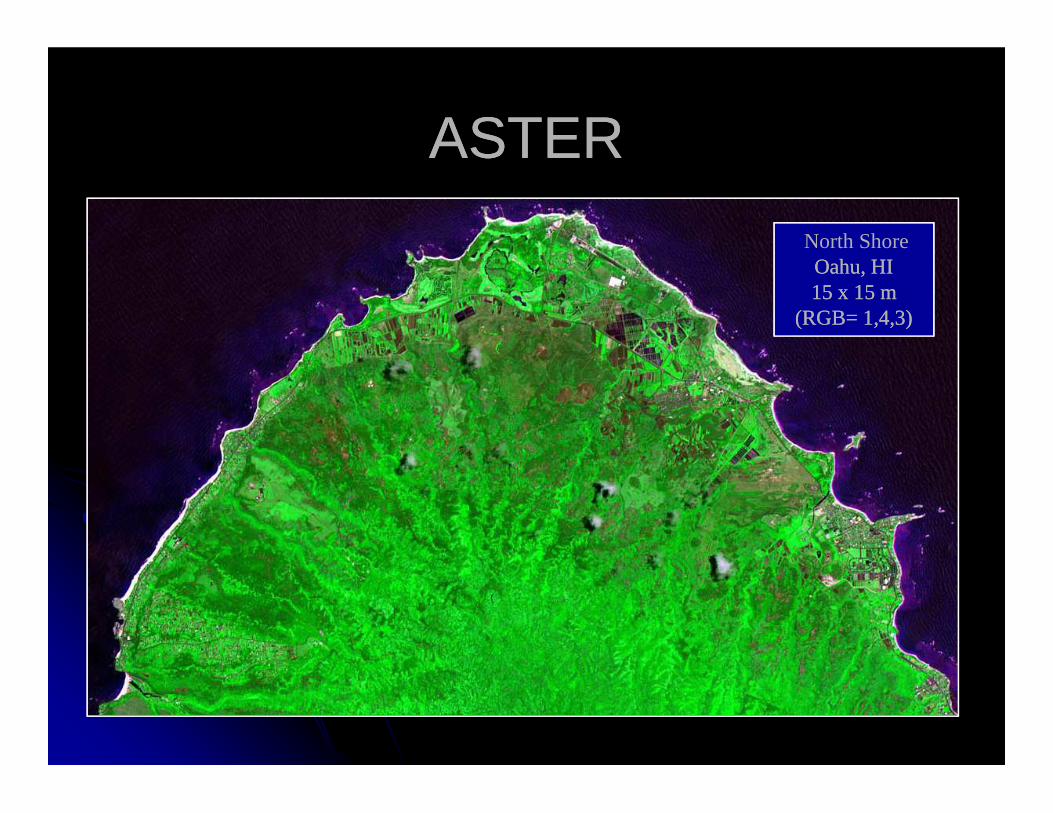
North ShoreOahu, HIOahu, HI15 x 15 m 15 x 15 m
(RGB= 1,4,3)(RGB= 1,4,3)
ASTERASTER

LANDSATLANDSAT
�� Launched in 1972, Launched in 1972, Managed by NASA and Managed by NASA and USGSUSGS
�� ETM 7+ has 7 bands (30 ETM 7+ has 7 bands (30 and 60 m) and a and 60 m) and a and 60 m) and a and 60 m) and a panchromatic (15)panchromatic (15)
�� Collected every 16 daysCollected every 16 days�� Mapping lava flows, Mapping lava flows,
thermal monitoring, thermal monitoring, extrusion ratesextrusion rates
Introductory Digital Image Processing. 3rd edition. Jensen, 2004Introductory Digital Image Processing. 3rd edition. Jensen, 2004
Landsat 7 Image of Landsat 7 Image of Palm Spring, CA Palm Spring, CA
30 x 30 m 30 x 30 m (bands 4,3,2 = RGB)(bands 4,3,2 = RGB)
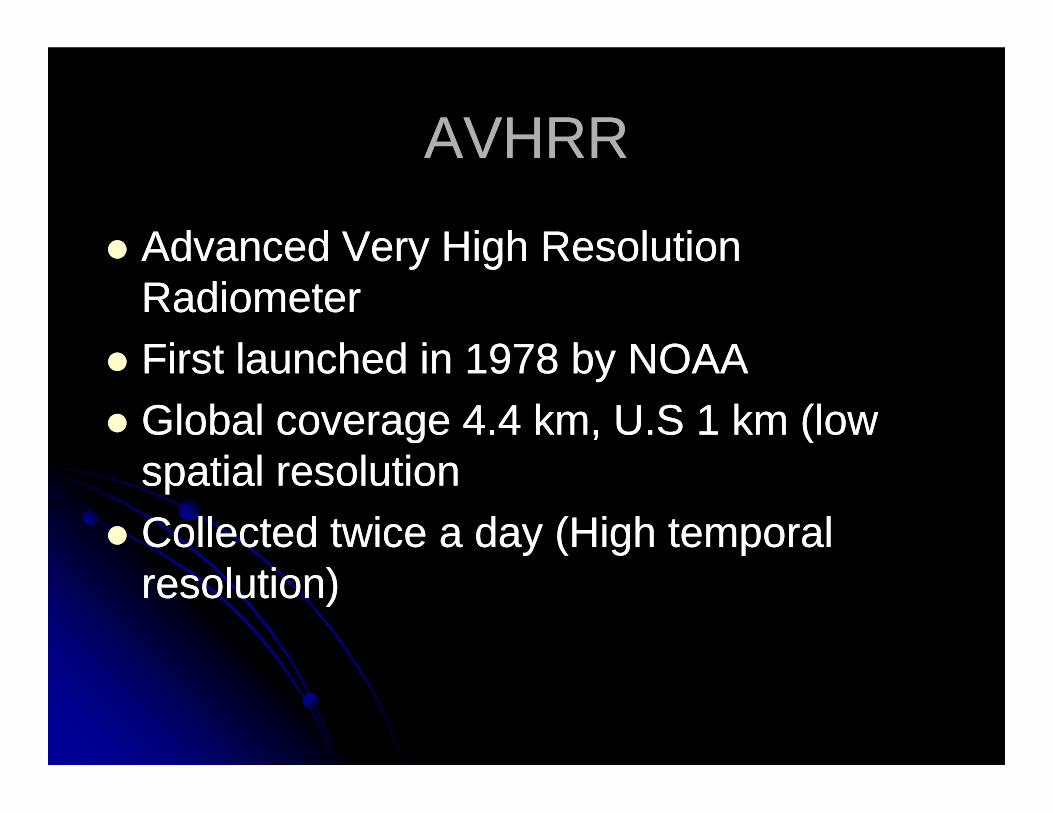
AVHRRAVHRR
�� Advanced Very High Resolution Advanced Very High Resolution RadiometerRadiometer
�� First launched in 1978 by NOAAFirst launched in 1978 by NOAA�� Global coverage 4.4 km, U.S 1 km (low Global coverage 4.4 km, U.S 1 km (low �� Global coverage 4.4 km, U.S 1 km (low Global coverage 4.4 km, U.S 1 km (low
spatial resolutionspatial resolution�� Collected twice a day (High temporal Collected twice a day (High temporal
resolution)resolution)
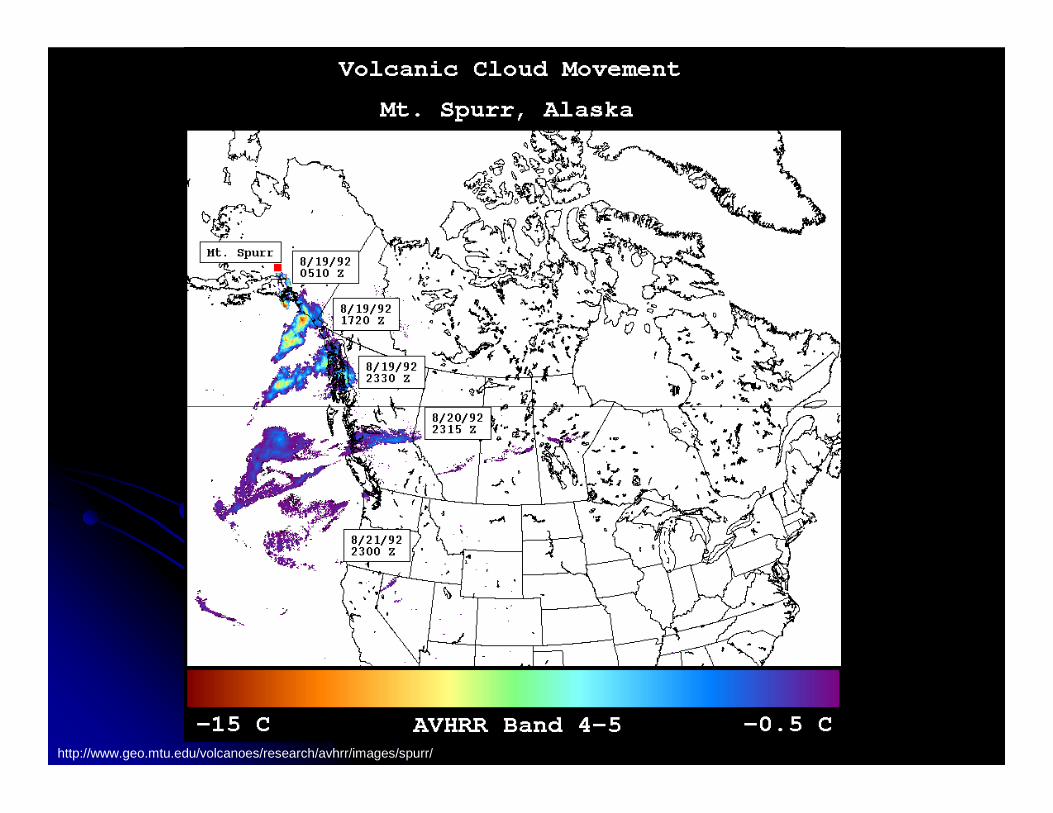
http://www.geo.mtu.edu/volcanoes/research/avhrr/images/spurr/
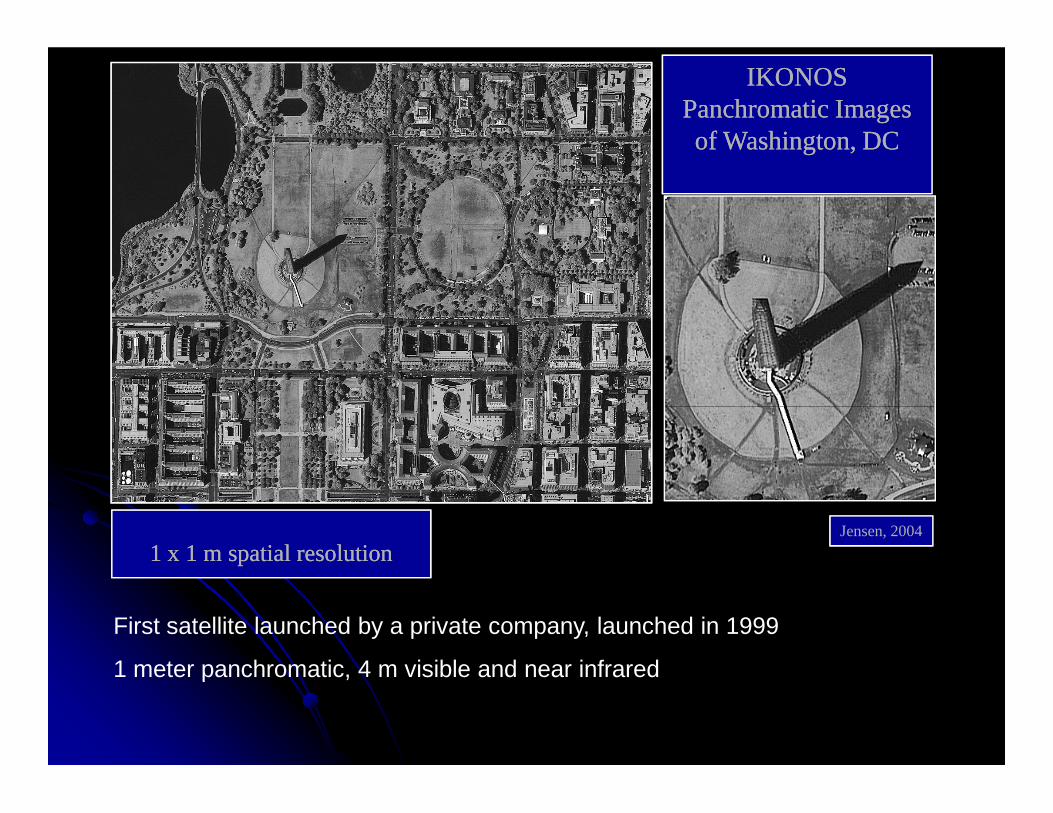
IKONOS IKONOS Panchromatic Images Panchromatic Images of Washington, DCof Washington, DC
Jensen, 2004
1 x 1 m spatial resolution1 x 1 m spatial resolution
First satellite launched by a private company, launched in 1999
1 meter panchromatic, 4 m visible and near infrared

Active SensorsActive Sensors
�� Emits energy pulse, measure backscatter, Emits energy pulse, measure backscatter, records as a digital numberrecords as a digital number
�� Long wavelengthLong wavelength--microwavemicrowave�� Long wavelengthLong wavelength--microwavemicrowave
�� Penetrates clouds and vegetationPenetrates clouds and vegetation
�� RADAR always black and white with speckled RADAR always black and white with speckled texturetexture

RADARRADAR
http://www.jpl.nasa.gov/images/earth/california/sar-la-browse.jpg
European Remote Sensing 1 satellite radar image of stormwater runoff plumes from Los Angeles and San Gabriel Rivers into the Los Angeles and Long Beach Harbors. Dec. 28, 1992. Image credit: ESA

LIDARLIDAR
�� Light Detection and RangingLight Detection and Ranging�� Transmits a laser light to targetTransmits a laser light to target�� 15 cm accuracy15 cm accuracy
http://vulcan.wr.usgs.gov/Volcanoes/MSH/http://vulcan.wr.usgs.gov/Volcanoes/MSH/�� http://vulcan.wr.usgs.gov/Volcanoes/MSH/http://vulcan.wr.usgs.gov/Volcanoes/MSH/Eruption04/LIDAR/Eruption04/LIDAR/
Top Related