


Languages
Pages
Legal


Supervisor: Kevin Cullinane Master Degree Project No. 2016:80 Graduate School
Master Degree Project in Logistics and Transport Management
Same Day Availability with a D2D Setup A case study of Volvo Group
Steffi Rose Jose and Anna Ulriksson
2
Abstract
In order to deliver high uptime service to end customers, it’s important for companies, within
the manufacturing industry, to have high availability of spare parts at the dealers, as they are
the face towards the end customers. To be able to do this, companies need to balance costs of
having big inventories, including all parts, with the service they want to offer. This thesis
focuses on how the availability within a manufacturing company, such as Volvo Group, can
increase their availability by grouping dealers, by using a general model, with the purpose of
implementing inventory pooling between the dealers.
The thesis is structured in such a way that it starts with presenting the general model, which
can be used by organizations for better management of their dealers and their services through
them. The thesis later delves into the logistics aspects such as inventory planning and transport
services for emergency orders. These two aspects answer the research questions for this Master
Thesis. In order to generate quality results, it was considered important to study the current
processes at Volvo and their dealers as they are the two main stockholders in this project.
Keywords: Availability, Service level, General model, Grouping dealers, Scenarios, Inventory
pooling, Transport solutions, Dealer process, Order process, D2D
3
Acknowledgements
We take this opportunity to express our gratitude to all those people who have been
instrumental in the successful completion of this Master Thesis.
First and foremost, we would like to thank The School of Business, Economics and Law at the
University of Gothenburg, Sweden and our department of Logistics and Transport
Management for allowing us to choose our topic of interest for our Master Thesis.
Our deep sense of gratitude goes to Volvo Group for allowing us to do our Master Thesis in the
companys’ headquarters for Volvo Logistics Services, Sweden.
We would also like to take this opportunity to thank our guide, Prof. Kevin Cullinane for his
valuable guidance, advice and willingness to motivate us, which contributed tremendously to
our thesis.
In addition, we are also thankful to our mentor, Erik Reklingsholmen at Volvo Group who
provided us with valuable information, advice and endless support in accomplishing the end
results with high quality. We are indebted to all the employees from Volvo Logistics Services
for their valuable guidance and advice through all the interviews conducted for this Thesis
work.
Finally and most importantly we would like to express thanks and gratitude to our friends and
families for their constant support and motivation.
Steffi Rose Jose
_______________________
Anna Ulriksson
_______________________
Gothenburg, June 2016
4
Table of Contents 1 Introduction ............................................................................................................................................. 8
1.1 Background ...................................................................................................................................... 8
1.2 Problem discussion ........................................................................................................................ 10
1.3 Purpose ........................................................................................................................................... 11
1.4 Research questions ......................................................................................................................... 11
1.5 Scope and limitation ...................................................................................................................... 12
1.6 Expected results ............................................................................................................................. 12
2 Literature review ................................................................................................................................... 13
2.1 The Aftermarket ............................................................................................................................. 13
2.2 Networks Planning ......................................................................................................................... 13
2.3 Structure and construction of network ........................................................................................... 14
2.4 Transportation networks ................................................................................................................ 17
2.4.1 Hub and spoke ......................................................................................................................... 18
2.4.2 Milk run .................................................................................................................................. 19
2.4.3 Direct Shipment ...................................................................................................................... 21
2.5 Inventory Planning ......................................................................................................................... 21
2.5.1 Inventory Pooling .................................................................................................................... 22
2.5.2 Legal aspects when sharing inventory .................................................................................... 24
2.6 Performance Indicators .................................................................................................................. 25
2.7 Literature Summary ....................................................................................................................... 27
3 Method .................................................................................................................................................. 28
3.1 Classifying research ....................................................................................................................... 28
3.2 Paradigm ........................................................................................................................................ 30
3.3 Case study ...................................................................................................................................... 30
3.4 Literature collection ....................................................................................................................... 31
3.5 Data collection ............................................................................................................................... 32
3.5.1 Interviews ................................................................................................................................ 32
3.5.2 Observations ........................................................................................................................... 33
3.5.3 Internal documents and systems ............................................................................................. 34
3.6 Data analysis .................................................................................................................................. 35

5
3.6.1 Qualitative data analysis ......................................................................................................... 35
3.6.2 Quantitative data analysis ....................................................................................................... 36
3.7 Validity, Reliability and Generalizability ...................................................................................... 36
3.8 Summary ........................................................................................................................................ 37
4 Results and analysis .............................................................................................................................. 39
4.1 Current Setup ................................................................................................................................. 39
4.1.1 Volvo process .......................................................................................................................... 40
4.1.1.1 Key performance indicators (KPI) ..................................................................................... 42
4.1.2 Dealer order process................................................................................................................ 44
4.1.3 Transport Processes................................................................................................................. 45
4.1.4 Current parts sharing ............................................................................................................... 46
4.1.5 Challenges from the current processes .................................................................................... 47
4.2 D2D Setup ...................................................................................................................................... 47
4.2.1 General model ......................................................................................................................... 48
4.2.2 Steering scenarios and transport solutions .............................................................................. 54
4.3 Case study ...................................................................................................................................... 56
5 Discussion ............................................................................................................................................. 67
5.1 Current processes ........................................................................................................................... 67
5.2 General model ................................................................................................................................ 68
5.3 Scenarios ........................................................................................................................................ 73
5.3.1 Challenges within the scenarios .............................................................................................. 75
5.3.2 Transportation network ........................................................................................................... 77
5.3.3 New dealer order process ........................................................................................................ 79
5.4 Impact on availability after grouping dealers ................................................................................ 80
6 Conclusion ............................................................................................................................................ 83
6.1 Recommendation ........................................................................................................................... 85
6.2 Limitations ..................................................................................................................................... 85
6.3 Future study ................................................................................................................................... 86
7 References ............................................................................................................................................. 87
Appendix 1 ............................................................................................................................................... 92

6
List of Figures
Figure 1: An undirected graph and a directed graph 15
Figure 2 Examples of two types of networks 18
Figure 3: An example hub-and-spoke network 19
Figure 4: The milk run concept 20
Figure 5: An inventory system with inventory sharing 23
Figure 6: Research process 29
Figure 7: Order flow within Volvo Group 40
Figure 8: The location of Volvo Group warehouses around the world 41
Figure 9: The dealer order process 44
Figure 10: A general model that can be used to group nodes 49
Figure 11: Volvo dealer locations in the USA 50
Figure 12: Volvo dealer locations in Italy 50
Figure 13: Single Dealer level 54
Figure 14: Group level 55
Figure 15: The location of Volvo Groups dealers in Sweden and Norway. 57
Figure 16: The segregation of nodes into Large ownerships 59
Figure 17: The segregation of nodes into Small ownerships 60
Figure 18: The segregation of nodes into Individual dealers 61
Figure 19: Dealer group based on 3.5-hour travel time from the support warehouse 62
Figure 20: Large ownerships groups 64
Figure 21: Small ownerships and Independent dealer groups 65
Figure 22: Large ownership group divided into two smaller groups 75
Figure 23: New dealer order process 79
Figure 24: The present and the new setup 84
List of Tables
Table 1: Service distribution at the dealer 43
Table 2: Calculation of average time on nodes closed to each other 52
Table 3: Calculation of average time on nodes far from each other 52
Table 4: Availability differences after using the grouping model on one group located in
Sweden. 81
Table 5: The current and new availability for one large groups in Sweden 82

7
List of abbreviations
D2D Dealer To Dealer
LPA Logistic Partner Agreement
LTL Less Than Truckload
FLT Full Truck Load
OEM Original Equipment Manufacturer
VMI Vendor Managed Inventory
EOQ Economic Order Quantity
VOR Vehicle Off Road
CW Central Warehouse
RW Regional Warehouse
SW Support Warehouse
BOR Back Order Recovery

8
1 Introduction
This chapter starts with a presentation of the background of the study explaining the growing
importance of aftermarket services and how an organization like Volvo Group works with this
service. The chapter also includes a problem discussion, which underpins the reason for this
study to be conducted together with the purpose of the thesis. Followed by this, the kind of
research questions that needs to be answered in order to solve the existing problems are
presented together with the scope and limitations for this study. The chapter ends with a
presentation of the expected results.
1.1 Background
The first thought that comes to mind when talking about a product based company is about
their manufacturing and selling of products. The loyalty and service of a company towards its
customers does not end there though; it starts from there with its “Aftermarket” services.
Aftermarket, which earlier used to be considered as an afterthought by companies has now
become one of the most important deciding factors from a customer’s point of view and a
competitive factor from a company’s point of view (Cohen et al, 2006). Aftermarket service
has various definitions in literature and these definitions can range from product support to
technical support (Saccani et al, 2007). The most important role for aftermarket business in any
industry is to reach high customer satisfaction. Customers first expect the manufacturers to fix
the issue soon rather than to get it fixed with high quality. Therefore to have this success factor,
it is important to have the right part at the right place in the right time and in the right quantity.
In short, availability of the products is the main concern for any company with aftermarket
services (Cohen et al, 2006).
Aftermarket business in any industry is at a place where the growth is much faster than any
business in the industry. Problems can occur in the aftermarket when there exits incompatible
components giving rise to proprietary aftermarkets (Shapiro, 2007). There are many challenges
that are faced by the aftermarket department of OEM’s (Original Equipment Manufacturer),
one of the main challenges being the uncertainty of the demand for parts as well as the large
amount of stock keeping units. On a positive side, they also account for high margin in the
business in turn giving the organization high profit levels (Cohen et al, 2006). Researchers also
discuss about studies, which prove the relation between the quality of a firm's aftermarket
services and the stock prices which are directly related. Researchers also agree that to attain
high profits, manufacturers should focus on the aftermarket services of a company (Saccani et
al, 2007).

9
The distribution strategy for the aftermarket services can be analyzed from the costs that are
associated in holding stocks at multiple locations, which can either be using a single
distribution point or multiple distribution points.
Aftermarket services are of high importance in the automotive industry who are into
manufacturing construction equipment, trucks and buses as these segments are supposed to
have a high “up-time” of their products. Big automobile manufacturers are already operating
with multiple locations concept to provide the customers with a high level of service and at the
same time not being dependent on one location. Automobile manufacturers serve their
customers through dealers who stock parts for the respective companies. The number of
stocking points and the types of dealer network needed mainly depends on the kind of service
level, which has been promised to the customers by the manufacturers. Therefore this also
leads to a market with high competition levels (Maheswaran et al, 2012).
Volvo Group is an organization that is a leading manufacturer of buses, construction
equipment, marine engines, trucks, industrial engines and sells its products in more than 190
markets. The organization today owns six different brands spread over the world, Renault
Trucks, Prevost, Mack, UD, Nova bus and Terex, and four brands with joint venture set up,
SDLG, Dongfeng brands, Sunwin and Eicher. (Volvo Group, 2016d)
Today about 100 000 people are employed within the organization and they have 18 production
facilities located around the world. The vision for the organization is to become a leader within
sustainable transportation solution with their focus being on the end customer and their needs.
The organization today has 10 different business areas, where Volvo Group Truck is the largest
area that cover 68% of the company's net sales (Volvo Group, 2016b; Volvo Group, 2016c;
Volvo Group, 2015). Within Volvo Group Truck operation exist Volvo Logistics Services,
which is responsible for optimizing, designing and managing its logistics services for all the
Volvo Group brands. Their goal is to have an efficient and sustainable supply chain with
reduced costs and causing minimum environmental impact. The main goal of aftermarket
services is to have high customer satisfaction, which is only possible by managing the global
availability of aftermarket parts at the dealers in the right quantity, time, place and cost. (Volvo
Group, 2016a)
Today, Volvo Group provides aftermarket service with a defined level of service. Volvo’s end
customers are served through dealers in every market. There are a given set of service models
differentiating the distribution based on part numbers’ characteristics (price, frequency,
forecast) in the strive to have spare parts available to the end customer. This is to a great extent
being performed by managing dealer network inventory according to Volvo’s VMI (vendor
managed inventory) concept called LPA (Logistics Partner Agreement). As the vast majority of

10
parts provided to end customers are managed by the LPA concept, it has a big impact on the
parts availability and also Volvo’s aftermarket cost. Therefore this is constantly under
refinement and development to secure world-class end service towards end customers.
1.2 Problem discussion
High availability is one aspect that is important for companies that work within the equipment-
intensive industry. In order to have high availability, spare parts needs to be available to reduce
customers downtime, when a product needs to be repaired (Wong et al, 2007; Kutanoglu, 2008;
Braglia & Frosonlini, 2013) The amount of spare parts that are needed within this industry is
considered to be high since for every new vehicle introduced in the market, introduces 500 to
1500 new parts as well. Adding to this, frequent launch of new models in the market also
indicates short product life cycle, which may have demerits in the supply chain management of
the aftermarket. Every OEM has a predefined service level, which depends on the life of the
product. Based on this, the stocking level at the warehouse and dealers, service strategy and
procurement are all handled by the aftermarket department of any OEM (Maheswaran et al,
2012).
For Volvo Group it is important to deliver high service to their end customers, to have high
uptime and get vehicles back on the road as soon as possible in case of an emergency. Last year
26% of Volvo Group’s net sales consisted of aftermarkets products and services and the
aftermarket service is an ever-increasing competitiveness factor for the company. In order to
have a high availability, this requires that the company is able to have spare parts available at
different dealers around the world. (Volvo Group, 2016a; Volvo Group, 2015) Today the
department of materials management within Logistics Services steers the inventory at dealers,
on a global level, to make sure that Volvo Group’s aftermarket services function efficiently.
They also have a number of warehouses located around the world to be able to balance costs
and manage the extreme demand that the company faces and there is also a consistent focus on
optimizing the stock level in different warehouses, in order to reduce the capital that is tied up
to it. (Volvo Group, 2016a)
To be able to be competitive in the market it is important for Volvo Group to make sure that
their aftermarket service is able to have a quick response time to the customers’ requirements.
As always when forecast demand is based on historical demand which deviates more or less
from actual demand, due to the uncertainty that comes with it. With increasing expectation
from end customers on high availability on spare parts together with short lead time without
any increase in costs, a pressure exists for Volvo Group and the Aftermarket Services to meet
this expectation and challenges.
11
Therefore grouping dealers, with an optimal time difference between the dealers, could lead to
a decrease in the lead time and an increase in the service level, which would be beneficial to
manufacturing companies who make the parts available to the end customers through their
dealers. This is the reason why this master thesis will focus on: how dealers can be grouped in
general in a cost efficient manner in order to facilitate the sharing of spare parts between
dealers and also look into the grouping process for Volvo Group. With this aim, there are many
advantages that exist but at the same time there are a few obstacles as well which need to be
considered when grouping dealers. Obstacles such as when dealers within the network need to
go from competitors to collaborators, when they need to share sensitive information with each
other and agree on which parameters that should be considered within the network and also
how the cost allocation should be distributed between the members in the network (Wong et al,
2007; Kutanoglu, 2008; Braglia & Frosonlini, 2013).
1.3 Purpose
Based on the problem discussion above, the purpose of this study is to investigate how
manufacturing companies in general can group their dealers in order to increase the
availability. This will include a cost efficient solution by constructing networks of dealers who
are able to share their inventories, in order to increase their service level and be competitive in
the market.
1.4 Research questions
Taking all the aspects discussed in the problem discussion above into consideration together
with the legal and cultural aspects that can occur when grouping dealers both within national
borders and across national borders, the aim with this study is to answer the following two
research questions:
RQ1: How can manufacturing companies improve same day availability of parts from a
management perspective?
RQ2: How can same day availability be achieved from a logistics point of view?
The first research question relates to the problem of how companies within the manufacturing
industry can improve the same day availability of spare parts by managing the parts sharing
between dealers and their processes in a more efficient manner. This will be answered by
developing a general model that can help achieve a better availability irrespective of the market
and the company.

12
The second research question caters to the logistical aspects that play a vital role in ensuring a
higher and faster availability of parts. This question will be answered by suggesting a better
model for the steering of inventory and a suitable transport solution for the same.
1.5 Scope and limitations
The scope of the research is to investigate from a D2D (dealer to dealer) perspective the
possibility of how parts can be better moved locally, have a better transportation solution and
availability solution from a legal and business point of view. This study will also investigate
the current aftermarket service provided by Volvo Group to their customers, which will be used
to decide the future performance potential with a better degree of planning the service
activities. The study will be limited to Volvo Truck brands in two countries. This is due to the
time constraint, but with the possibility to investigate important markets with different
characteristics. Two countries which were chosen to be a part of the case study that has been
conducted were Sweden and Norway, since these markets contain different types of ownerships
and also because Sweden is a part of EU and Norway is not, which makes these two markets
good samples and can be used to give a generalized view as well.
In the construction of networks, the parameters which have been used are limited to the costs,
time, capacity and distance as these parameters are of high importance while constructing
clusters in comparison to the other parameters which are not directly related. The other reason
to limiting this study to these parameters is also due to the time constraints that exist. There
have also been certain limitations while working on the literature required as the main focus
here has been on the construction of networks for better parts sharing.
1.6 Expected results
The study aims to investigate how a D2D setup can be created in a cost efficient manner to
enable shorter lead time for the availability of spare parts at a manufacturing company, such as
Volvo Group. It also aims to work as a prerequisite to share inventory within the dealer clusters
and from that gain potential in a more cost efficient inventory planning and improved end
customer service. Therefore the expected result from this study is to create a general model that
can be used to group dealers with the purpose of implementing inventory sharing within these
groups. The expected result is also to present two scenarios that can be used to steer the
inventory in a more efficient way together with appropriate transport solution to these
scenarios.
13
2 Literature review
This chapter presents the theoretical framework, which begins with describing the aftermarket
in general and is followed by network planning. This is then continued by a deeper explanation
on network structure and construction, including mathematical explanations on the parameters
that can affect the network construction. The theoretical framework continues with
transportation networks and different network models that can be used. The chapter ends with
a presentation about the concepts of inventory sharing, legal aspects, and performance
indicators that need to be considered – and a summary of the literature is presented.
2.1 The Aftermarket
In today’s fast paced society people have become customers to products which require repair,
servicing, maintenance work etc. Investments are being made by the end customers in products
which require frequent repair. Such repair works and services are mostly common for
sophisticated equipment’s, i.e. car parts. Customers with lack of knowledge about the products
they own or the new products in the market get locked to one product or brand (Klein, 1996).
This lock down to one brand by the customer makes it difficult and also costly to move from
one brand to the other.
The aftermarket business in the industry is dominated mainly by three elements. The first
element in this is the fact that a consumer usually purchases products which are made of many
components which give the value to the product (Shapiro, 2007). The next element is the fact
that these components may be bought at different points in time or at the same time. The third
element is that these products and components have some degree of costs attached to them
which cannot be recovered when the consumer changes brands (Shapiro, 2007). As the
aftermarket business is widespread, it involves a high volume of commerce.
2.2 Network Planning
Networks exist all around us and can be defined as both entities, like networks of collaboration
or neural networks, but also as tangible objectives in the Euclidean space, like subway,
highway system or as the internet (Boccaletti et al, 2006). As mass customization and
globalization create high complexity, demand volatility and uncertainty causes an increase in
the challenges that companies face regarding the planning, designing and the operation of a
network with time (Mourtzis et al, 2015).
A typical supply chain consists of the suppliers, plants, warehouses, distribution centers and
retail outlets with the flow of raw materials, work in process inventory and finished products
14
between these facilities. Therefore to structure and manage the materials and these facilities, it
is important to deal with the process, which is responsible for the same which is, network
planning. (Simchi-Levi et al, 2007)
Network planning manages the supply chain in order to match the supply and demand under
unseen circumstances by managing and positioning inventory effectively, make proper use of
resources by sourcing the products from the appropriate source and find the right balance
between manufacturing costs, inventory and transportation. Due to the complexity involved in
this process, it is important to make decisions with a hierarchical approach which involves
network design, inventory positioning, resource utilization and the overall management. All
this together will help in reducing the cost and in increasing the service level. (Simchi-Levi et
al, 2007)
To understand this planning process better, it is divided into three steps. The first step is
network design, it determines the physical and infrastructure configuration of the supply chain.
This includes decisions on the number, size of the plants, warehouses and location of the plants
etc.
The second step is inventory positioning. The importance of proper positioning of inventory,
coordination of inventory decisions and transportation policies are evident from a long time.
When talking about customer service level and supply chain costs, they might be impacted
when managing complex supply chains. There can be several forms of inventory that needs to
be managed and has its own control mechanism, for example raw material inventory, work in
process inventory and finished product inventory. (Simchi-Levi et al, 2007)
The third and last step is resource allocation, which means that on a monthly, quarterly and
annual basis, a firm has the responsibility to utilize resources effectively within a fixed logistics
network. For this planning, a supply chain master plan is developed, which coordinates and
allocates production and distribution strategies and resources to maximize profit and system
wide costs. (Simchi-Levi et al, 2007)
2.3 Structure and construction of network
The network structure is the construction behind the graph theory (Easley & Kleinberg, 2010).
This theory is the “The mathematical study of the organization of network structures (called
graphs)” (Graph theory, 2013). The theory explains the function and structure of a network by
analyzing the different nodes and edges that exist within the network and the reachability

15
between two nodes in a network is a central concept within this theory (Boccaletti et al 2006;
Graph theory 2013; Easley & Kleinberg, 2010).
Nodes in a network are the objects of study or interest. It can be the sources, destinations or
even the intermediate points in a network (Oracle, 2016). The edges are the links that connect
two different nodes that then can be seen as neighbors or adjacent points. The relationship
between the different nodes can be a symmetric or asymmetric relationship (Boccaletti et al
2006; Easley & Kleinberg, 2010). When a symmetric relationship exists between two nodes,
this can be referred to an undirect graph since both nodes point to each other, while in an
asymmetric relationship a direct graph exist, since one node point to another but not the other
way around, this can be seen in Figure 1 below (Easley & Kleinberg, 2010). What decides the
direction of the edge in a network is dependent of the relationship the nodes have with each
other but also on the type of the network that exist under the study (Rozenblat et al, 2013).
Figure 1: An undirected graph and a directed graph
Source: Easley & Kleinberg (2010)
A path within a network is a sequence of nodes and edges which link these nodes. The number
of edges indicates the length of a path. If there exists at least one path between the nodes then
the two nodes are said to be reachable. The nodes are considered to be connected if there exists
at least one path between the two nodes. (Rozenblat et al, 2013)
In the case of transportation network it is important that connection within the network exist, as
the main reason with the construction of a transportation network is to create an opportunity for
vehicles to go from one node to another within the network (Easley & Kleinberg, 2010).
Clustering is an operation that can act within a graph with the purpose of connecting nodes that
are strongly connected by the nature and presence of the edge between them. By clustering
different nodes, groups within the graph can be identified, which can result in the
representation of nodes on a graph is easier to understand. It is not feasible though when it
comes to directly applying the concepts of graph theory in practice to a geographical space.
The graph theory helps more in providing tools that consider the direction and the value of

16
edges into account when building a network. These directions are important in a geographical
context as they help in modeling a network in the right way (Rozenblat et al, 2013).
In the construction process of a network, there are different parameters that need to be
considered. One of these is distance. The distances between the different nodes in the network
are important, especially in a transportation network. The reason why distance needs to be
considered is because it gives the information about how long it takes to travel from A to B
(Easley & Kleinberg, 2010). In a communication or a transportation network, the shortest-path
is important. The average shortest path length is given by the typical separation between two
nodes, which can also be referred to as the characteristic path length (Boccaletti et al, 2006).
A simple model can be used to construct a geographical group of networks that explains the
basic features. The model includes the dimensions in the network, dimensions about the
competing preferences if it’s either short graph distance or short Euclidean distance between
vertices (Gastner & Newman, 2006).
As mentioned above, distance is important in a network, and from a user’s perspective often a
short path is more preferable. The way to calculate distance can differ between an air network
and a road network, since the way of considering distance can differ. In an air network it is
more important to look at the number of legs, while in a road network the miles become
important when considering distance. To be able to calculate this, each edge is assigned with an
effective length. “n” is the number of nodes and the effective length is calculated by 0 ≤ λ ≤
1. λ is the one that defines the preference of a user in order to measure distance regarding legs
or miles. The factor of √n is not necessary but it is convenient. The effective length becomes
infinity if no path exists between i and j. To determine the total distance that exists between
two nodes, the sum of the effective length that exists in the path of all the edges needs to be
calculated. After the distance is calculated and defined, the user’s preferences are received then
the network can be constructed. (Gastner & Newman, 2006)
Another parameter that can be important to consider is cost. The cost of building and keeping
the network is proportional to the total length of the edges. To calculate the cost, the following
equation can be used:
Cost = edges (i,j)dicost = edges (i,j)di
i and j stand for the nodes and dij represent the Euclidean length of the edge that exists between
the nodes. According to Gastner & Newman, (2006) is the plausible starting point, even if the
result only can be seen as approximately true.

17
2.4 Transportation networks
The transportation model can be expanded in several ways to accommodate the complications
in distribution planning. One way is by the use of Multi-commodity flow model. By using this
model multiple products are transported from sources to destinations and share capacities on
directed arcs. These kinds of models are used in describing flows in an express network where
each origin/destination pair is treated as a separate commodity. This model shares the
transportation capacity with other commodities using the same directed arcs though. The other
way by which the transportation model can be generalized is by involving a choice among the
modes of transportation which can be used on each directed arc. The transportation model
related to this generalization would be where unit costs on flows decrease with volume. High
flows will allow better utilization of FTL (full truckload) shipments, which are economical
than LTL (Less than truckload) shipments associated with low flows (Shapiro, 2007).
Networks that are embedded in real space, where the edge in the networks are real physical
connection and the nodes that exist within the network occupies an exact position in two or
three - dimensional Euclidean space, calls spatial networks. A network that can be referred to
these kinds of networks is a transportation network, examples of this can be seen in figure 2
(Easley & Kleinberg, 2010).
A transportation network is studied from a branch of mathematics which is known as the graph
theory, as explained above. Today, transportation networks internal efficiencies and
vulnerabilities have been better understood which has led to it receiving attention. Classic
graph theory and qualitative analysis have been of interest among scientists who are interested
in the transport networks. Methods like circulation routing approach and flow optimization are
mainly focused on the transportation costs whereas the complex networks integration by
transport specialists is very recent in nature and complements the above mentioned methods.
Transportation networks can be analyzed on the basis of the topology, morphology, their
spatial structure and on the basis of geometry. Network developments are made either to
support an existing network or to compete with an existing network. These developments can
be made either by expanding geographically or topologically or in both ways (Ducruet & Lugo,
2013). Three types of transportation networks for distribution are explained below:

18
Figure 2 Examples of two types of networks
Source: Ducruet, & Lugo (2013)
2.4.1 Hub and spoke
A hub and spoke network is mainly concerned with locating hub facilities and then the hubs are
allocated with the demand nodes, which can be seen in figure 3 (o Ekárt et al, 2011). In the
transport network of the hub and spoke, hubs perform the transshipment operations and the
depots or hubs link the end customers with the hubs (An et al, 2011). A hub-and-spoke network
is not always considered to be the most environment friendly and sustainable network, but
when the network is concentrate on traffic consisted of few spokes, the network can lead to a
reduction on transport congestion, air pollution and noise problem (Rodrigue et al, 2013).
There exist two types of the hub and spoke networks: single allocation and multiple allocations
(o Ekárt et al, 2011). In the first type of model which is the single allocation model, the sending
and receiving depot is assigned to one single hub. Whereas in multiple allocation model,
sending and receiving depots are assigned to multiple hubs (An et al, 2011).
Recent research shows the advanced practical features that have been incorporated to this
network model of hub and spoke. Features such as nonlinear economies of scale, congestion
effect are a more sophisticated solution (o Ekárt et al, 2011). Reducing the cost of the transport
will force the traffic to take a small number of hubs, which in turn will lead to congestion at the

19
hubs as well. It is suggested that since the effect from congestion will reduce the advantage
which can be obtained from a hub and spoke network, therefore direct service between nodes
should be encouraged as well as capacities at hubs should be expanded as well (o Ekárt et al,
2011).
Some studies show that the selected hubs usually operate as they have been planned unless
disruptions due to natural calamities take place. In case of logistics networks, facilities that
provide service to customers may be affected due to such disruptions (An et al, 2014). In order
to prevent this and to have a better backup plan for the same, authors talk about the reliable
facility location model. Authors try to minimize the transportation cost that is expected which
is generated by receiving service from the back up facilities with the assumption that the
unavailability at all the nodes is the same (An et al, 2011). Lim et al (2009) talks about two
types of facilities, one, which is completely reliable, and the other which is unreliable. The
reliable facilities are usually more expensive and so they are not subject to disruptions whereas
in case of unreliable facilities, it is vice versa.
Figure 3: An example hub-and-spoke network
Source: DHL (2008)
2.4.2 Milk run
Milk run concept has been taken from the dairy industry where the requirement is covered by a
transportation network (Bowersox et al, 2002). Milk run has been widely used in supply chain
and logistics studies which has helped in decreasing the costs associated in the transportation of
materials and finished products (Sadjadi et al, 2009). Milk run system has been known to be
one of the cost effective research tools, which also helps in reducing the travelling path and at
the same time reduce the fuel consumption (Brar & Saini, 2011). This system has been widely
used in the automobile industries and other global product manufacturers. Depending on the
20
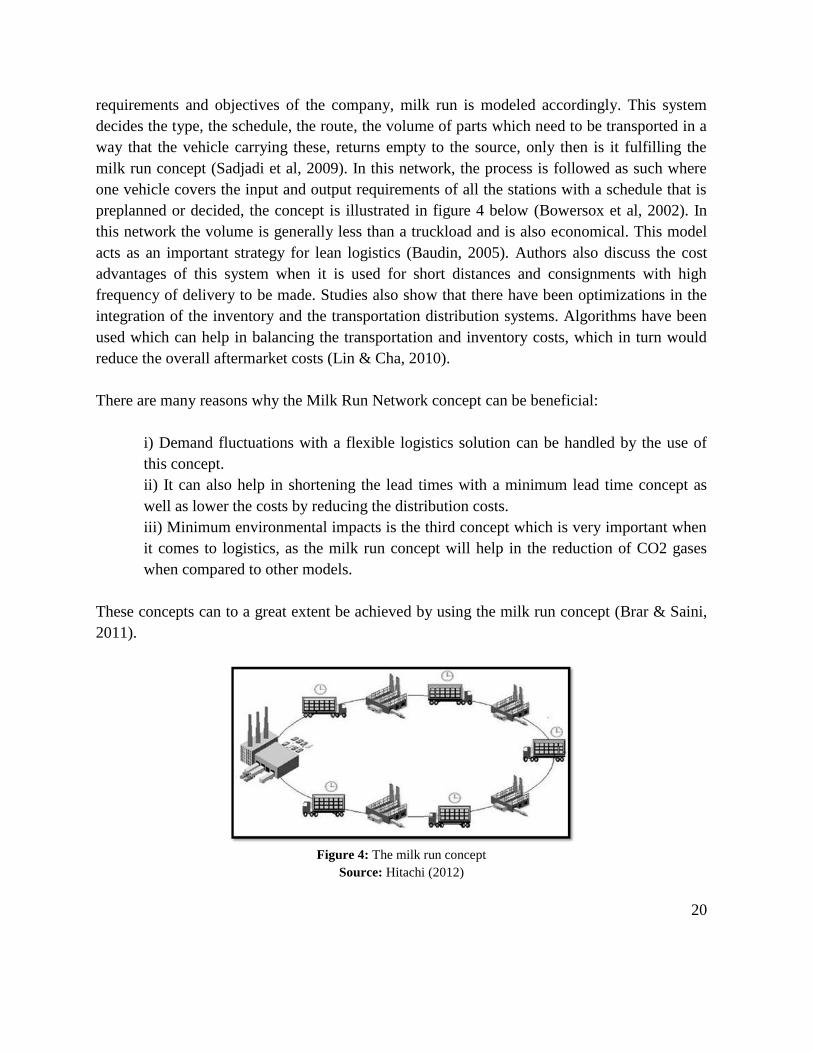
requirements and objectives of the company, milk run is modeled accordingly. This system
decides the type, the schedule, the route, the volume of parts which need to be transported in a
way that the vehicle carrying these, returns empty to the source, only then is it fulfilling the
milk run concept (Sadjadi et al, 2009). In this network, the process is followed as such where
one vehicle covers the input and output requirements of all the stations with a schedule that is
preplanned or decided, the concept is illustrated in figure 4 below (Bowersox et al, 2002). In
this network the volume is generally less than a truckload and is also economical. This model
acts as an important strategy for lean logistics (Baudin, 2005). Authors also discuss the cost
advantages of this system when it is used for short distances and consignments with high
frequency of delivery to be made. Studies also show that there have been optimizations in the
integration of the inventory and the transportation distribution systems. Algorithms have been
used which can help in balancing the transportation and inventory costs, which in turn would
reduce the overall aftermarket costs (Lin & Cha, 2010).
There are many reasons why the Milk Run Network concept can be beneficial:
i) Demand fluctuations with a flexible logistics solution can be handled by the use of
this concept.
ii) It can also help in shortening the lead times with a minimum lead time concept as
well as lower the costs by reducing the distribution costs.
iii) Minimum environmental impacts is the third concept which is very important when
it comes to logistics, as the milk run concept will help in the reduction of CO2 gases
when compared to other models.
These concepts can to a great extent be achieved by using the milk run concept (Brar & Saini,
2011).
Figure 4: The milk run concept
Source: Hitachi (2012)

21
2.4.3 Direct Shipment
In the case of any product based company, it is highly important for the company to have a
good logistics system with the major focus on the flow of goods from the manufacturers to the
customers. Along with having a good logistics system comes the critical factor of having a
system, which is at a reasonable cost as well. Researchers have therefore looked into the
possibilities of delivery systems with the most cost effective methods of delivery (Lee &
Whang, 2001). One common type of delivery system is the direct shipment system. This
system allows each facility to operate individually and also by having their own individual fleet
of goods. By having a direct shipment, each facility gets the opportunity to have specific
shipments coming to the facility alone unlike other transportation networks. This method is
therefore suggested by researchers to be used in cases of short lead times or when the lead time
is tight and the shipment needs to be delivered in urgent scenarios. Researchers also suggest the
use of this delivery model in cases where the shipments are large as well. This system has the
advantage of visiting only one customer in a trip. (Liu et.al, 2003)
2.5 Inventory Planning
In today’s scenario, inventory planning is done in a more traditional setup where “pull” type of
inventory is used. The stocking levels in this traditional setup are based on parameters such as
demand, costs and service requirements. This can also lead to lower inventory levels in turn
when compared to the push type method. Push and pull type of inventories help in deciding
when and where the inventories should be moved. In the “push” type, a make to stock
environment is characterized whereas in case of a “pull” type, make to order is characterized.
(Ramachandran et al, 2002)
Inventory planning is to a large extent based on the forecasts as well as on the sales and
demand. The demand is usually structured to be fulfilled from the primary assigned location. In
case the demand is not able to be fulfilled as required then it turns out to be backordered. In
inventory planning, Economic order quantity (EOQ) plays a vital role. Based on the EOQ are
methods like reorder point, min-max and periodic review etc. used. Pull type of inventory
ranges from EOQ based on stock to demand approaches. Associated with the inventory are
variables like the holding cost, capacity and product availability. Therefore depending on the
type of the stocking method used, the quality of the product availability can be seen as a result.
(Ballou & Burnetas, 2003)
In a normal scenario, planned inventory does not guarantee a high level of customer
satisfaction. Authors have discussed that the planned inventory could still lead to backorder
and in some cases lost sale. In cases where the part is not available at the primary location then

22
this requirement is usually checked at secondary or tertiary locations. Authors have even
discussed the high possibility of fulfilling the demand from secondary location even when the
availability at the primary location is low. This concept will be discussed in detail below.
(Ballou & Burnetas, 2003)
2.5.1 Inventory Pooling
Parts service is an area in the automobile industry where the low level of inventory
management has grabbed the attention of a few authors. Fill rates estimation and inventory
sharing is focused in some studies where facilities are grouped into pools. Every pool is
connected to the central warehouse and is replenished by the same. (Kutanoglu, 2008)
Inventory pooling is defined as a complex system where the main aim is to reduce the costs
involved while improving the overall performances by sharing inventories with the help of
different stocking points, which can either be inter operational or intra operational. This is
therefore named as Virtual pooled inventory and this helps in locating emergency parts either
locally or from remote locations within the same company (Braglia & Frosolini, 2013). The
demand at these facilities can be fulfilled in either of the following ways:
i) If the facility holds the required demand as current stock in its inventory, then it is
used to fulfill the demand
ii) If the facility does not hold the requirement in its stock, then it is checked with
another facility, which is then fulfilled by a lateral supply between these facilities.
iii) If the requirement is not available at any of the facilities in the pool, then this
requirement is satisfied by the central warehouse which has the requirement in stock by
sending it through a direct shipment (Kutanoglu, 2008).
These kinds of lateral shipments were first considered by Lee (1987) who has studied the
system of pooling groups which have similar facilities (Lee, 1987). This can be better
understood from the figure 5 below.

23
Figure 5: An inventory system with inventory sharing
Source: Kutanoglu (2008)
This therefore leads to the study of emergency lateral transshipments, which helps a firm in
getting the necessary requirements from another company which has surplus in stock. This can
be better explained with the help of a scenario where if the demand coming from a local facility
cannot be fulfilled because it’s out of stock then in that case it is fulfilled by another facility,
which has the stock for the required part, by the use of an emergency lateral transshipment.
(Kutanoglu, 2008)
Depending on the type of company, its service varies. Some companies’ main focus can be to
have a high time based service level. For certain product types, time based service levels are
very important as it can be directly related to their equipment downtime, which can cause them
huge losses. Authors also discuss the type of contracts that are preferred by customers to have
the best service level. Examples of time based contracts are 80% of the service is completed
within 4hrs or 100% of the service is provided within a day. This process induces the
consolidation of parts or products for which a limited number of locations are selected as
sources and these as it is in many cases can be a single facility. Studies suggest the
consolidation of these parts at the facility which has the least standard deviation of lead time.
Studies also suggest that strategic advantage can be achieved by using an appropriate order
splitting approach. Pooling of inventories have also been considered to be one of the effective
strategies, which can help improve the availability of parts and at the same time decrease the
total costs of management. It also has to be considered that the actors involved in the same
market can also act as competitors for each other, but this depends on the market. So it is

24
important to convince the actors involved in this setup about the benefits that they will receive
rather than subsidizing. (Kutanoglu, 2008)
Another important aspect to consider when establishing inventory sharing is that even if
companies are able to agree on the different aspect discussed above, there still remains one
question that needs to be answered and that is how to solve the cost allocation problem.
According to Wong et al (2007) the total system cost can be distributed or allocated among all
the members such as transportation, holding inventory and down-time costs that are incurred
by one company. It must also be noted that by having more and more companies in inventory
pooling, the savings will be higher. However, there should be a proper balancing of the benefits
and the risks which could lead to optimal policies for the companies involved in the pool
thereby leading the project to a failure in the end (Braglia & Frosolini, 2013).
By having the inventory pooling setup the difference in the service levels can be calculated
with the help of the formula below:
Service level in % = (Ps / TD) *100
Where Ps = Part of demand that can be delivered directly from stock
TD = Total Demand
(Jonsson & Mattsson, 2009)
2.5.2 Legal aspects when sharing inventory
Establishing inventory sharing and creating new networks consisting of different parties, such
as individual companies, requires that legal aspects are taken into consideration. When sharing
inventory the parties may need to have contractual agreements that handles aspects such as
information sharing and responsibility. By creating a contractual agreement, the different
parties can agree on various aspects of the transaction and apportion the responsibility and
liabilities. The legal aspects can become more complex if the networks cross jurisdictional
boundaries.
To start with, privacy must be taken into consideration, both concerning business and personal
information that is collected, shared, stored and used. Liability is another aspect that needs to
be considered since it’s important to decide who should bear the risks that is associated with
problems that can occur within the network. When sharing inventory and IT-platform, it’s also
important to consider data security as well as the enforcement, not only if something goes
wrong, but also when something can or is close to happen that can cause a risk for the system.

25
Finally, compliance with regulation and standards are also something that needs to be decided
upon within the contract.
Inventory sharing may occur across national borders, which includes legal challenges. Below
are topics that may be relevant to be considered:
Tax regulations.
Difficulties in agreeing on the foreign applicable contract law.
Formal requirements, e.g. licensing and registration procedures.
Language of the contract, communication, documents, etc.
Problems with cross-border delivery; e.g., customs.
Difficulties faced by a party in finding out about the provisions of a foreign contract
law.
Problems in resolving cross-border conflicts, including costs of litigation abroad
Obtaining legal advice on foreign contract law, etc.
(Basu Bal, 2016; OECD, 2013)
2.6 Performance Indicators
If one cannot measure it, one cannot improve it – this has been stated by Lord Kelvin. In order
to benchmark the current levels of service with the best in class, it is important to measure the
service levels provided by an organization (Anand & Grover, 2015). Key performance
indicators (KPI) or performance metrics main objective is to provide the organization a
visibility of the processes and the accuracy of how the process is executed (Gopal & Thakkar,
2012). In general, organizations have performance measures for financial performance
assessment but organizations in general are not aware of performance measures related to the
supply chain. Organizations now have started understanding the importance in measuring the
supply chain performance and therefore are looking into areas such as continuous
improvements in the supply chain. These continuous improvements will not only benefit the
organization but also the stakeholders associated to organizations such as suppliers,
manufacturers, dealers, retailers, end customers etc. Authors also have discussed the
uncertainty that increases along with an increase in the variety of products by companies.
These cause an uncertainty in the demand and supply structure of the products (Anand &
Grover, 2015). Therefore authors suggest that by identifying the performance indicators, the
improvement areas and the percentage gaps can be identified and worked upon. The
performance indicators have also been categorized into different levels such as ground level,
mid-level and top level (Hoffman, 2004). Some measures to check the performance of a supply
chain are categorized into cost, flexibility, time and quality (Shepherd & Gunter,
2006). Authors have narrowed down the performance indicators for retailers into transport

26
optimization, resource optimization, information technology optimization and inventory
optimization (Gunasekaran, 2001).
Inventory Optimization
When it comes to optimizing inventory, researchers look into ways how an optimum level of
inventory can be achieved to serve the customers. Researchers have also looked into the
relationship between the inventory turns and the floor space where stores with a good
performance level have higher turns in the inventory per unit area (Raman et al, 2001).
Transport Optimization
Authors have identified logistics as one of the highest costs involved when it comes to
international trade (Bowersox et al, 2005). The performance indicator associated to logistics
indicates the efficiency of an organization when it comes delivering goods and services at the
right place, in the right time and the quantity required by the customer. Logistics is a very
important performance indicator as this indicator links all the stakeholders of an organization
such as the suppliers, sellers, manufacturers, distributors, customers etc. Therefore this is a
very important indicator of how well the customers are being served (Anand & Grover, 2015).
Resource Optimization
This performance indicator indicates the importance of having the right mix of workforce at the
right place. Retailers work not only in making sure that the total cost is optimized but also that
the right workforce is available at the right time and place. By optimizing the workforce, it
leads to minimizing the variance in the budget (KPMG, 2011).
Information Technology Optimization
Under today’s scenario, businesses are developing by having best in class information
technologies. Same way the optimization of information technology plays a vital role in retail
operations by processing the flow of information, services and the goods. Some authors also
prove the importance of information technology in aligning the supply chain of an organization
(Rajaguru & Matanda, 2009). Therefore authors suggest that by sharing information, it helps
in balancing the loss, gain, risks, costs etc (Ballou et al, 2000).

27
2.7 Literature Summary
This chapter stared with a presentation about the general aftermarket followed by an
explanation about the network planning – a three step process including network design,
inventory positioning and resource allocation. When planning the network design it is
important that the networks are able to fulfill the requirements. The main aspects in a network
are the nodes, edges, paths and how these can be clustered. Networks are built with these basic
aspects in any scenario, be it the transportation networks, programming networks, web
networks, retail networks or electrical networks. In this study, the main focus is on
transportation networks which are studied from a branch of mathematics called graph theory.
There are three types of transportation networks that have been discussed: the hub and spoke
network, the milk run concept network and the direct shipment.
Construction of networks is done as a pre-requirement for something major to be achieved,
which in this case is to make inventory sharing cost and time effective. Therefore, the literature
also deals with different aspects of inventory planning and pooling. With inventory pooling the
main aim is to reduce the costs involved in holding high levels of inventory and at the same
time this helps in reducing the number of transport flows from the central or regional
warehouse as well. To be able to implement inventory pooling there exist different legal
aspects that needs to be taken consideration, in order implement it in an efficient way and avoid
potential future problems, which been discussed in this chapter. The chapter ends with a brief
description of the performance indicators, which measure these services and indicate the
potential improvement areas.

28
3 Method
This chapter describes the method and methodology that has been used in order to conduct this
study. The chapter starts with classifying the research, which gives an overview about how this
research can be classified according to the purpose, process, outcome and logic of the
research. This is followed by an explanation about the study’s paradigm, a description of the
case study and how the literature and the data were collected. The chapter continues with a
description of the method that has been used in the data analysis. The chapter ends with
discussing the studies validity, reliability and generalizability together with a summary of the
chapter.
3.1 Classifying research
According to Collis & Hussey (2014) research can be classified according to the purpose,
process, outcome and logic of the research. To clarify how this study has been conducted, the
different classifications will be described in this chapter. The purpose of the study is to
investigate how a manufacturing company can group dealers to increase the availability of
spare parts in a cost efficient way. According to Collis & Hussey (2014), this purpose can be
referred to their description of a predictive research. A predictive research means that it looks
into answering the ‘how’, ‘why’ and ‘where’ questions and the answers or solutions generated
from this analysis will be used to generalize in similar studies, where applicable.
The process of the study refers to what kind of data that is collected during a study in order to
answer the research questions (Collis & Hussey, 2014). The research questions for this study
are:
How can manufacturing companies improve same day availability of parts from a
management perspective?
How can same day availability be achieved from a logistics point of view?
In order to answer these questions, both qualitative and quantitative data needed to be
collected, which according to Byrman & Bell (2011) is referred to as mixed methods research.
A mixed method research is used when both research strategies are used within one study,
which is the case in this study. The qualitative data refers to the interviews that were
conducted, both from knowledge sharing interviews that were made in order to get experts
within the field to share their knowledge about the current situation, and also the interviews
that were made at a later stage in the study to get information about the particular areas that the
study was aimed to investigate. The qualitative data also refers to the observations that have
been conducted in the study, in order to understand the current process. The quantitative data

29
refers to the numerical data that was collected to calculate the improvement in the availability
of spare parts from the current availability as well as what percentage of expensive transport
could be reduced such as air transport for example. Both qualitative and quantitative data have
also been collected through internal documents and systems that have been provided by Volvo
Group. The research process can also be seen in figure 6 below.
Figure 6: Research process
As described above, the purpose of the research is to group dealers, since it will result in better
availability of parts, something that is important for some companies to be able to deliver high
service to their end customers. This explains why the outcome of the research can be connected
to an applied research method as described by Collis & Hussey (2014). Applied research refers
to a study, where the goal is to solve a problem and since companies face challenges regarding
lead time, costs and customer satisfaction, this can be related to a problem that this research
aims to solve.
30
Before the grouping process of the dealers began, a theoretical structure was created, with the
purpose of being tested later on in the process of the research. This structure of the process
indicates that the study was made under a deductive approach. A deductive approach refers to
the empirical observations that are tested against an already developed theoretical structure and
the fact that the method goes from general to particular. (Collis & Hussey, 2014)
3.2 Paradigm
A research process is guided by a paradigm, which can be referred to a framework that is based
on people’s assumption about the nature of knowledge and the world but also based on
people’s philosophies. There are two main paradigms that exist: interpretivism and positivism.
Interpretivism refers to the fact that social reality is subjective, since social reality shapes
people’s perception. This paradigm focuses on exploring the complexity of social phenomena,
while in a positivist paradigm it is more about measuring the social phenomena (Collis &
Hussey, 2014). A positivist paradigm focuses on different theories that can be explained by the
social phenomena that exist. Since this study is about constructing a dealer-to-dealer solution
that includes a development of a new network by using theories about network construction
and inventory sharing, this refers to the study that is done under a positive paradigm. There are
different philosophical assumptions that underpin the paradigm and since this study is done
under a positive paradigm, the philosophy that is used in the study is methodological
assumption since a particular aspect was studied and also because the association between the
variables were looked into. (Collis & Hussey 2014)
3.3 Case study
A general model, have been developed within this study, that could be applied in different
markets and companies in order to improve the availability at dealers, which can be referred to
the fact that the study is generalizable (Bryman & Bell, 2011). To be able to test the model a
case study has been conducted, showing how dealers within Volvo Group can be grouped in an
efficient way. A case study is more common under an interpretivist paradigm, but can also be
used under a positivist paradigm. The point with a case study is to investigate a single case or
phenomenon by using different methods. In this study, an experimental case study has been
used, since the point was to implement techniques and procedures that were new for Volvo
Group. (Collis & Hussey, 2014)
Collis & Hussey (2014) described the different stages that occur in a case study, stages that
have been followed in this study. As explained above, the case was first selected, followed by a
preliminary investigation, which was done by knowledge sharing with experts within the field.

31
During the pre-interviews, both primary and secondary data about dealers geographical
position was collected, which was then used to map the dealers.
To test the model, a web-based program was used called Map Business Online. The program
was developed by SpatialTEQ, inc and was used in the study, since it provided advance
geographical analysis tools that could be used in order to map different transportation routes,
which was an important factor in the creation of the different networks (SpatialTEQ Inc, 2010).
The different steps in the case study are presented below:
1. The first step was to collect all the dealers’ coordinates, which could be used to plot the
dealers on a map, by using the Map Business Online program. The coordinates were
gathered from Google maps, by entering the dealer's address, that were given by
employees at Volvo Group.
2. The next step in the process was to follow the different steps in the model to be able to
group dealers in the most efficient way. From the general model, Volvo specific
information was taken into consideration, to be able to apply the model for this specific
company. This process resulted in three types of groups in Sweden and one type of
group in Norway, together with groups both within the countries and across borders.
3. In order to confirm the accuracy of the travel times given by the program Map Business
online – Another program, Google Maps, was used to test the travel time between the
different points.
3.4 Literature collection
To be able to create the theoretical framework, literature had to be collected. The literature that
was searched for and collected can be referred to as secondary data, which means that the data
already existed before the study began. To find relevant literature, as published in articles and
journals, the first step was to identify the scope of the research. The scope of the research was
to investigate from a D2D perspective the possibilities of how parts can be better moved
locally, have a better transport solution and availability solution from a legal and business
angle. By having the scope defined, it is possible to have some limitations, which will improve
the literature search. (Collis & Hussey, 2014)
After the scope was defined, the search for literature began. By using different databases
provided by the university’s library, together with keywords relevant literature could be found.
The following databases have been used in this study: Business Source Premier and Web of
Science. The following keywords were used when searching the databases: Transportation,
32
network, dealership, dealership network, car dealership network, virtual stocking, inventory
sharing, inventory pooling, network planning, hub-and-spoke and milk run.
By studying the gathered literature, other relevant sources and primary sources were found.
The use of primary sources was important in the study in order to give the study high validity.
3.5 Data collection
To be able to conduct this study, data needed to be collected from different sources. This
chapter will include a presentation about how both qualitative and quantitative data was
collected through interviews, observations, internal documents and systems.
3.5.1 Interviews
Interview, is a commonly used method within qualitative research and within this study two
types of interviews were used: unstructured and semi-structured interviews, depending on the
person and the situation. The interviews have also been divided into two parts – knowledge
sharing and interviews, to be able to collect knowledge about the processes at first and then use
this knowledge to have a more in depth interview. Unstructured interviews refer to an interview
that is as the name states, unstructured and it’s more similar to a conversation (Bryman & Bell,
2011). This type of interview was mostly used during the first part of the interviews, the
knowledge sharing part, since this type allows the interviewee to answer more freely and also
for the authors to ask questions related to the interviewees answers, because of the use of open
questions (Collis & Hussey, 2014; Bryman & Bell, 2011). Open questions are according to
Collis & Hussey (2014), good to use when the authors want to explore and gather broad
information, which was the point in the first interview phase.
The other type, semi-structured interviews, refers to when the questions in the interview is
related to a specific topic. These kinds of interviews have been needed in the later state of the
study, in the interview part, where the goal was to collect answers regarding specific topics. To
be able to conduct this type of interviews, the authors needed to prepare questions before the
interviews, to be able to get the answers that they were looking for. Most of the interviews that
have been conducted during this study, both knowledge sharing and the interview, have been
face-to-face interviews and due to the fact that some interviewees were located in other
countries or other places in Sweden, some interviews have been conducted through Skype,
something that is quite similar to a face-to-face meeting. The interviews were also recorded, to
give the authors the possibility to listen to them afterwards. (Collis & Hussey, 2014; Bryman &
Bell, 2011)

33
The interviews in this study have been done with people from different departments (Material
management, Transport optimization, Purchasing, Sales, Legal, business implementation)
within Volvo in order to get input from the relevant departments. To exemplify, employees for
material management gave information about current setup of inventory steering. Employees
from the transporting optimization, purchasing and sales gave information related to how the
current transportation set up is today together with input on how the transportation can work
with the new set up constructed in the study. The list of interviewees is found in Appendix1.
When conducting interviews, there exist some problems that need to be considered. In the case
when more than one interviewee exists, it’s important for the authors to recognize both of
them, to get the right person to answer the question (Collis & Hussey, 2014). In this study only
a few interviews included more than one interviewee, but during those interviews the authors
paid attention to both of the interviewees and directed the questions to the person who was the
most appropriate to answer the question, depending on their role within the company. This has
been possible, by asking the interviewees to describe their role in the company in the beginning
of each interview. Since one of the topics that have been covered within this study relates to the
current situation at Volvo Group, it has been important for the authors to recognize when
personal feelings have been expressed and when facts have been expressed, in order to give the
right picture in the study. To be able to do this, different interviews regarding the same topic
have been conducted, which was helpful in the explanation of the current situation. (Collis &
Hussey, 2014) There might be a chance that there is a discrepancy between the theoretical
descriptions of how the company operates and how the company operates in reality. In order to
ensure that the interviewees had the possibility to be honest when describing the current
processes, the authors decided not to tie quotes to individuals that have been interviewed.
3.5.2 Observations
Observations can be done in natural or laboratory settings, where observations in a natural
setting are referred to fieldwork. In this study, only observations within natural settings have
been conducted, meaning that people in their real life have been observed (Collis & Hussey,
2014). According to Collis & Hussey (2014) different types of observations exist, and the
participating observation has been used in this study, which refers to the authors that have been
involved in the observations in order to understand the motives, values and practices of what
they observed (Collis & Hussey, 2014). The first observation that has been done in this study
refers to the employees at Volvo Group in Gothenburg, by observing how the current process
of order handling in the aftermarket works. This gave the authors the opportunity to see the
process through their own eyes, which gave an understanding that couldn’t be gathered through

34
interviews (Bryman & Bell, 2011). The second observation that has been conducted refers to a
visit to two dealers located in Sweden, which gave the authors an understanding of how they
see their process and how they work when they are searching for a spare part. This visit
generated knowledge that couldn’t be gathered by only observing and interviewing employees
at Volvo Group. The dealers that were observed where chosen based on their size and
ownership structure, in order to get an overview of how different dealers work since different
construction of dealers exist within Volvo Group, such big, small and independent dealers.
Using observations gives an opportunity to experience unexpected situations as Bryman & Bell
(2011) discussed, which could give information that the interviews couldn’t. The fact that the
possibility was given to the authors to observe two different dealers and a number of
employees within Volvo, conclusions could be drawn since the different observations could be
compared. By observing two dealers the demand characteristics could be reduced – something
that can happen during observations, when an observed person can think about how they work
in order to show their best side. Observing different people and asking questions could avoid
this. (Collis & Hussey, 2014)
3.5.3 Internal documents and systems
Qualitative data can be both interviews and observation, but it can also be figures, diagrams
and texts that are presented in printed materials (Collis & Hussey, 2014). Data from printed
materials have been collected within this study. To be able to answer the research questions,
information from Volvo Group was collected, which in this case is referred to internal
documents. The internal documents have been helpful in the process of defining the current
situation at Volvo and were provided by employees at Volvo. The documents have also
provided information about dealers’ addresses that was used to find the coordinates, which
later could be used to plot the dealers on a map in the case study.
The quantitative data that has been used in this study refers to the numerical data that has been
used to calculate the increased availability and the decrease in the percentage of transportation
at some of the dealers within Sweden, which was provided by internal documents and systems.
Regarding the transportation costs, secondary data has been used, meaning that the data already
existed before the study began. To be able to calculate the availability, primary data was
needed meaning that the data was collected from an original source provided by Volvo. When
analyzing quantitative data a sample needs to be decided. Since the calculations only have been
done on dealers located in Sweden, these dealers can be referred to as the population in the
study. From this population, one group was selected as a sample, since this is one of the bigger
groups which were considered to be enough to show what percentage of availability of parts

35
will increase even by having the same service level as today and only by grouping the dealers.
This will also indicate what percentage of transportation could be reduced for emergency
orders as the parts can be made available in the group itself. After the sample was selected, the
variable was stated. In this study both rational and nominal variables have been used. (Collis &
Hussey, 2014)
3.6 Data analysis
This chapter includes what kind of the methods that have been used in order to analyze the
qualitative and quantitative data which have been gathered.
3.6.1 Qualitative data analysis
As authors have discussed, it is common when qualitative data is used in a study that the
analyzing process starts during the collection of the data. In this study a general analytic
procedure has been used to analyze the qualitative data (Bryman & Bell, 2011). This suits the
study, since different data collection methods have been used.
The analyzing method includes data reduction, which is a process where the authors select
what they should focus on, since a lot of data has been gathered. Collis & Hussey (2014)
describe two different ways of doing this: anticipatory data reduction and continuous data
reduction. Anticipatory data relates to studies where the data is ignored due to the theoretical
framework that have been conducted in the study and continuous data reduction means that the
data is reduced if no relationship between irrelevant data and collecting data exist. In this study
the first alternative that has been used, since the theoretical framework was first developed in
order to know what kind of data that needed to be collected. The next step is data display
meaning that the data should be summarized, which in this study has been done by using a
network, linking the data together. In this study four categories of data have been created when
the qualitative data was summarized: information about current process at Volvo, information
about grouping dealers, information about inventory steering and information about
transportation networks. The last step was to analyze the data, which was done by relating them
to the existing theories. (Collis & Hussey, 2014; Bryman & Bell, 2011)
36
3.6.2 Quantitative data analysis
To analyze the quantitative data correlation has been used, which means that the variables that
have been used in this study have been tested against each other to see if any relationship
exists. (Collis & Hussey, 2014)
The emergency order data for one dealer group was collected and evaluated in order to
understand what percentage of orders are sourced from the different warehouses. This data was
used to identify the different scenarios and from that calculate the difference in the availability
at dealers individually compared to the difference when the dealers are grouped.
The quantitative data in this study has been used to calculate the percentage difference the
grouping of dealers can cause compared to the present setup. This percentage will also indicate
reduced percentage of parts that need to be sourced from outside the groups. By calculating the
increased availability, the percentage reduction in transportation can be seen as well which will
thereby indicate the decrease in transport costs. This can be referred to authors who state that
with quantitative methods of analysis is positivism attached to. From this a social phenomena
can also be measured (Collis & Hussey, 2014) Different scenarios for one group of dealer was
used in order to check the impact that was created by the grouping process. As suggested by
Jones (2001) and Martin et al (2010), when the data involves uncertain demands, then in such
cases a clear view of the supply chain is required as the methods from quantitative forecasting
can be hard to manage.
3.7 Validity, Reliability and Generalizability
The validity in a study is important and there exist different types of validity (Bryman & Bell,
2011). According to Collins & Hussey (2014) validity refers to how well the results reflect
what the author actually wants to study. According to Bryman & Bell, (2011) validity in a
study is one of the most important criterions. What can underpin the research are the research
errors like poor sample, inaccurate measurement and according to Collis & Hussey, (2014)
different ways of how the validity in a study can be ensured exist and the authors’ gives
example of constructs validity and face validity
Construct validity refers to the problem that can occur in a study regarding the phenomena that
authors are not able to observed, such as ambition, anxiety, ambition and satisfaction. This is
something that has been taken into the consideration in the study as explained regarding the
interviews and the observations. Different people have been interview and observed regarding
the same topic in order to be able to ensure that right data is collected.

37
Face validity refers to the fact that the things measured in the study actually test what it is
supposed to test. This can be ensured in a study by the authors consulting experts within the
field to ensure the results. In this study this been confirmed by the authors conducting the
different test and later asking experts to review the results, which in this case refers to expert
within Volvo Group. The authors have used multiple sources and experts within the company
with good knowledge within the field, which ensures that the conclusions are based on solid
data. Since multiple interviews were conducted the authors were able to eliminate personal
views and filter out the actual key concerns that multiple employees and experts had.
(Bryman & Bell, 2011; Collis & Hussey, 2014)
Reliability in a study refers to the measurements precision and accordance together with how
well a study can be replicated. By using documents and the systems provided by Volvo, the
same results could be achieved by other author/authors, which show that the study is replicable
– which is a sign of reliability. One problem that exists if the study were to be replicated is that
access to Volvo Groups databases would be needed (Collis & Hussey, 2014).
Generalizability refers to which extent the results from a study can be generalized. The study
includes two levels of generalizability. The first level concerns the development of the general
model itself. The general model has been generated from current research and literature. Since
it has been developed from theories and studies that don’t focus on Volvo, the model could be
able to be implemented in other companies that rely on dealers and that have similar logistical
challenges, no matter industry. The second level of generalizability concerns the case study
that focuses on Volvo group’s dealers. The case study involves implementation of dealer
logistics on two markets – dealers in Norway and Sweden. One can argue that the
implementation of the grouping model on other markets could be a problem, but since these
two markets cover many of the important aspects the generalizability must be consider very
high in the case of Volvo. The markets included dealers with varying size, different ownership
constellations, different nationalities, cultures and legal requirements. (Collis & Hussey, 2014)
3.8 Summary
To be able to conduct this study, different methods have been used, which have been presented
in this chapter. The chapter starts with presenting how this study can be classified based on the
purpose, process, outcome and logic of the research, which is followed by a presentation about
the positivism paradigm that has been used in the study. To test the general model that has been
developed a case study has been done on Volvo Groups dealers in Sweden and Norway. The

38
process of how the case study was conducted is presented in this chapter, followed by a
presentation of how the literature is presented in the theoretical framework of the study.
To be able to conduct this study, both qualitative and quantitative data were needed, which
resulted in collecting them through interviews, observations, internal documents and systems,
which have been used to gather the right information. The data that has been collected is
presented in the interview together with an explanation about how the qualitative and
quantitative data has been analyzed, in order to use it in an accurate way. The chapter ends with
discussing the validity, reliability and generalizability.
39
4 Results and analysis
This chapter1 starts with presenting the current processes followed by Volvo Group in their
aftermarket services and the processes followed by Volvo dealers in acquiring spare parts from
the company for their end customers. The chapter then delves into the challenges faced by the
current processes in order to achieve time and cost efficient services. Followed by this a
“General Model” is developed which can be tested and applied to any manufacturing
company. The general model is proposed for better management of dealers in order to achieve
better services towards their end customers. Based on the general model, two new scenarios
will be presented on better parts sharing along with suitable transportation setup for each
scenario. The general model is then later tested for two markets where Volvo operates. The
case study shows how dealers, within Sweden and Norway, can be grouped to have same day
availability of spare parts.
4.1 Current Setup
Volvo Group provides its services to its end customers through two different types of dealers:
LPA and Non LPA dealers. The dealers which follow the VMI (Vendor Managed Inventory)
concept are termed as LPA dealers whereas the dealers which do not adhere to the VMI
concept are considered as Non LPA dealers in Volvo terms. Some markets have both types of
dealers whereas some have only one type. As this project is focused on looking into optimal
ways of setting up D2D solution to support same day availability, only these dealers and their
processes will be looked into in detail. The next subchapter will present the current processes
followed by Volvo Group in making the spare parts available at the shelves of LPA dealers.
1 All data presented in this chapter comes from different interviews and observations that have been conducted in
this study, together with internal documents and systems provided by Volvo Group. For a complete list of
interviews see Appendix 1.

40
4.1.1 Volvo process
Volvo Group today has around 2300 LPA dealers spread around the world. The process of
refilling these dealers can be done in different ways depending on where in the world the
dealers are located, as shown in figure 7 below.
Figure 7: Order flow within Volvo Group
Volvo has six central warehouses spread around the world, 17 regional warehouses and
10 support warehouses. The service level at each of these warehouses differs as their
functions differ. To be able to support their different dealers Volvo has divided their markets
into different regions that are supported by one of the six central warehouses together with the
regional and support warehouses, which can be seen in Figure 8 that show the different
warehouses location around the world.

41
Figure 8: The locations of Volvo Group warehouses around the world
The flow of spare parts starts at one of the Volvo Group Trucks’ 1500 suppliers that deliver the
parts to the different central warehouses, which either distribute the spare parts directly to the
dealers or to the regional or support warehouses. These orders are called stock orders and are
refilled by Volvo Group to the dealers based on various parameters and forecasts. Regional
warehouses exists in different markets to support the central warehouses by delivering stock
orders to dealers and are often located closer to the dealers, as the lead time from the central
warehouses to the dealers are too high. In Europe, there exist support warehouses that act as the
name suggests, as a support to the central warehouse, which carry parts that are too expensive
for the dealers to carry themselves. The dealer can attain these expensive or exotic parts by
placing a day order to the support warehouse when the spare parts are needed. A day order can,
as shown in figure 7, be delivered from the central/ regional or support warehouses and is an
order that is placed by a dealer when the dealer does not have the part and when it’s not
included in the stock orders. When a day order is placed by a dealer, it needs to be done within
a certain time frame as the warehouse that receives the day order should be able to pick, pack
and send the consignment so that it reaches the dealer within 24 hours. To exemplify this
better, in Sweden the support warehouse is located in Eskilstuna and if a dealer in Gothenburg
needs a part, they need to place a day order before 4.30pm in the evening to have the part by
07:00am next day morning.

42
Today Volvo approximately has 600 000 different parts stored in their warehouses and in case
of an emergency, a VOR (Vehicle Off the Road) order is placed. A VOR order is placed when
an urgent part from an emergency situation is not available in the dealer stock and needs to be
transported on an urgent basis from anywhere in the world. Volvo’s customer support team
receives a VOR order and it is first their responsibility to locate the part, within the facing
warehouses, and if this does not work then the responsibility passes to the BOR (Back Order
Recovery). This team continues to locate the needed part outside the normal distribution
channels for the dealers and who fix the problem with an express transport solution. The goal
in this situation is to find the part as soon as possible and deliver it to the dealer. This can result
in taxis going from one dealer to another or airlifting the part from a warehouse and delivering
it to the dealer.
4.1.1.1 Key Performance Indicators (KPI)
Performance indicators show the measurement of the processes in the aftermarket parts flow.
They help in supporting the goals of the company. The KPIs, which the materials management
department mainly focuses on is the availability at the central warehouse, regional warehouse,
and support warehouse and most importantly at the dealers. The other KPI, which is associated
to the availability, is the cost involved in holding these parts and shipping them on urgent
orders when the parts are not available on an urgent basis at the dealerships. The Key
performance indicators can be measured from the start of the process which can be at the
suppliers, the three types of warehouses and at the dealers. Below three performance
measurements will be described.
Aftermarket Dealer Service Index (DSI) - This performance indicator measures the ability of a
dealer to serve its end customers based on a dealer’s stock capacity. This measurement is made
based on the weekly forecast of sales. If there is a high service index then a high delivery
capacity to dealers can also be achieved.
Aftermarket Parts Availability - This performance indicator indicates how big share of all
orders being entered towards the warehouse can be fulfilled. The warehouses being the central,
regional and support warehouse.
Aftermarket Delivery Precision - This performance indicator measures the ability to deliver
parts in the right quantity, at the right place, in the right time and in the right condition.
The service level at each dealer is based on the inventory planning done by Volvo. Over the
counter availability for dealers is a consequence, which varies according to the availability at
the central/ regional warehouse. The table below shows an example of how Volvo supports
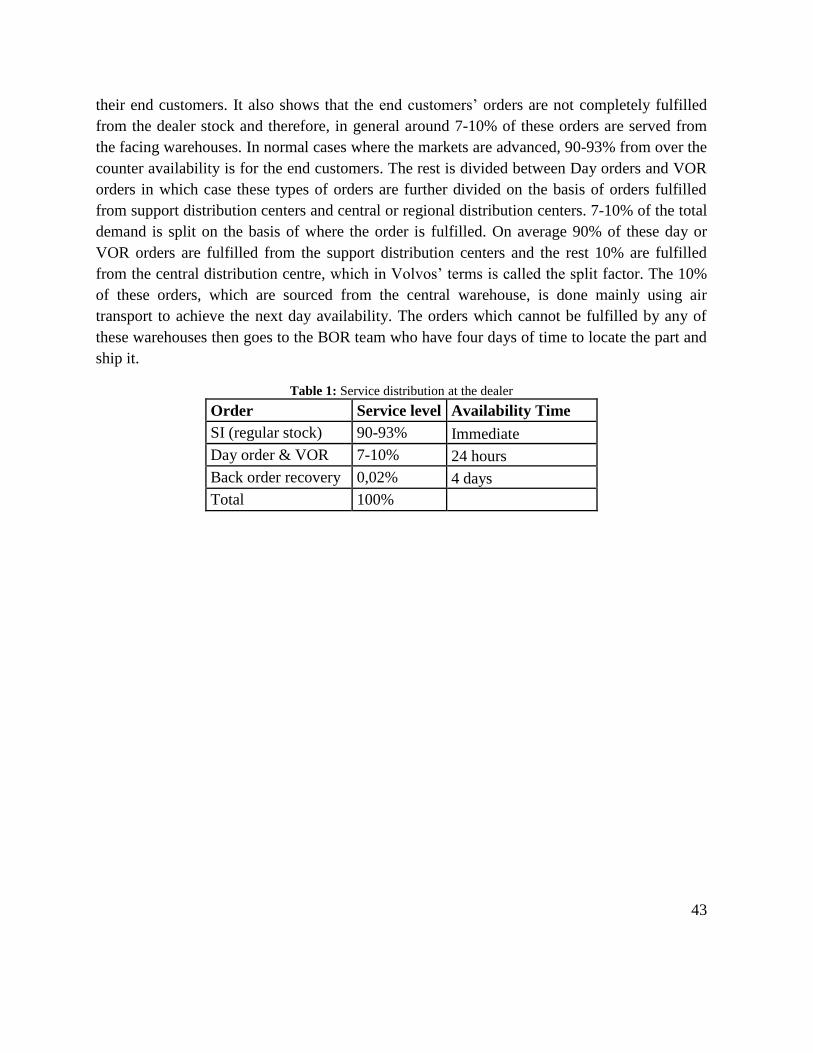
43
their end customers. It also shows that the end customers’ orders are not completely fulfilled
from the dealer stock and therefore, in general around 7-10% of these orders are served from
the facing warehouses. In normal cases where the markets are advanced, 90-93% from over the
counter availability is for the end customers. The rest is divided between Day orders and VOR
orders in which case these types of orders are further divided on the basis of orders fulfilled
from support distribution centers and central or regional distribution centers. 7-10% of the total
demand is split on the basis of where the order is fulfilled. On average 90% of these day or
VOR orders are fulfilled from the support distribution centers and the rest 10% are fulfilled
from the central distribution centre, which in Volvos’ terms is called the split factor. The 10%
of these orders, which are sourced from the central warehouse, is done mainly using air
transport to achieve the next day availability. The orders which cannot be fulfilled by any of
these warehouses then goes to the BOR team who have four days of time to locate the part and
ship it.
Table 1: Service distribution at the dealer
Order Service level Availability Time
SI (regular stock) 90-93% Immediate
Day order & VOR 7-10% 24 hours
Back order recovery 0,02% 4 days
Total 100%
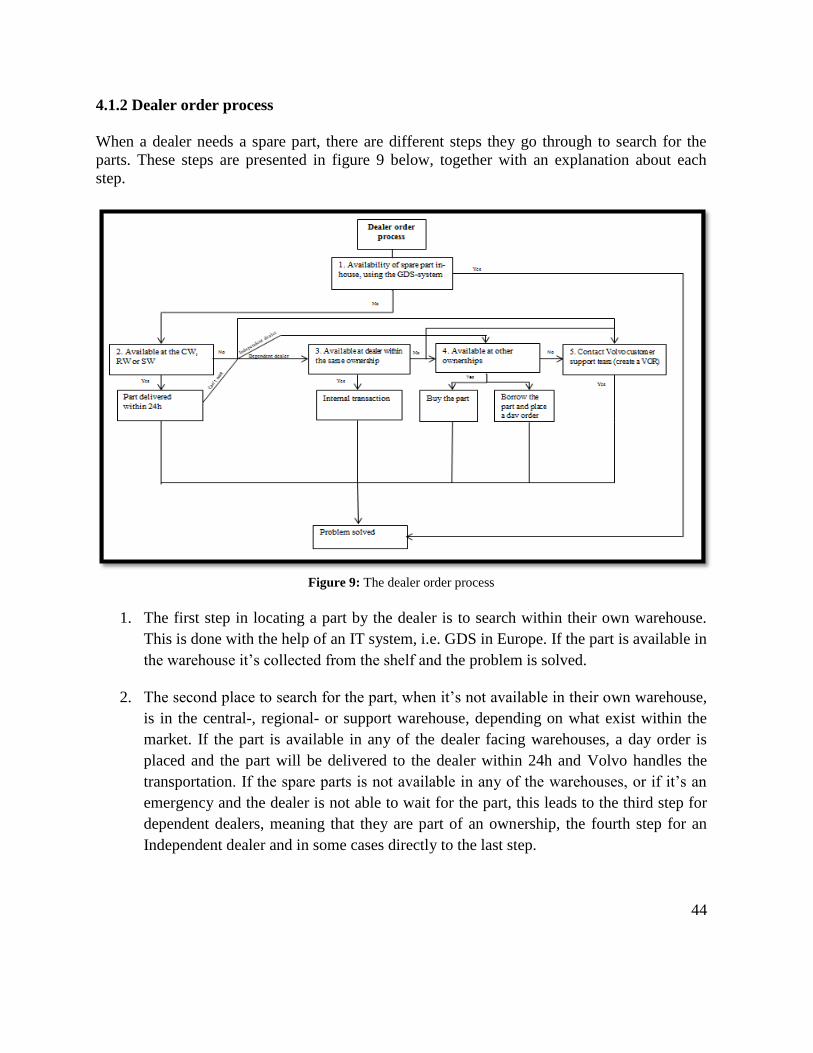
44
4.1.2 Dealer order process
When a dealer needs a spare part, there are different steps they go through to search for the
parts. These steps are presented in figure 9 below, together with an explanation about each
step.
Figure 9: The dealer order process
1. The first step in locating a part by the dealer is to search within their own warehouse.
This is done with the help of an IT system, i.e. GDS in Europe. If the part is available in
the warehouse it’s collected from the shelf and the problem is solved.
2. The second place to search for the part, when it’s not available in their own warehouse,
is in the central-, regional- or support warehouse, depending on what exist within the
market. If the part is available in any of the dealer facing warehouses, a day order is
placed and the part will be delivered to the dealer within 24h and Volvo handles the
transportation. If the spare parts is not available in any of the warehouses, or if it’s an
emergency and the dealer is not able to wait for the part, this leads to the third step for
dependent dealers, meaning that they are part of an ownership, the fourth step for an
Independent dealer and in some cases directly to the last step.
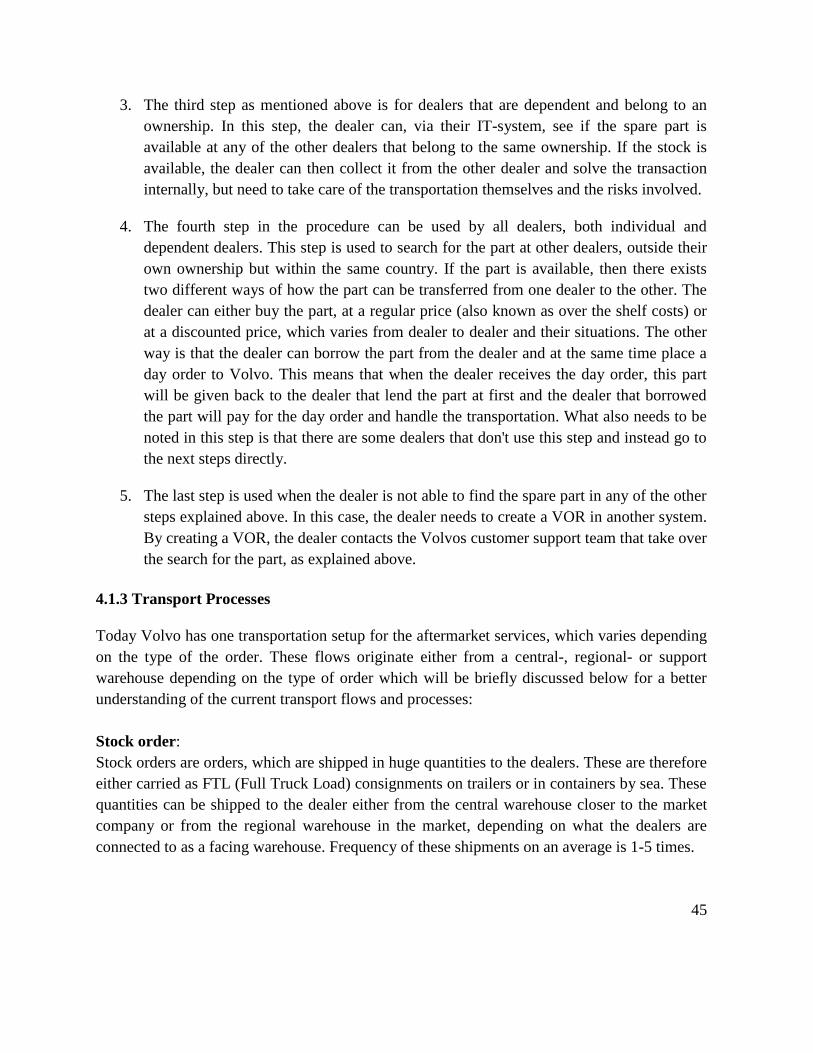
45
3. The third step as mentioned above is for dealers that are dependent and belong to an
ownership. In this step, the dealer can, via their IT-system, see if the spare part is
available at any of the other dealers that belong to the same ownership. If the stock is
available, the dealer can then collect it from the other dealer and solve the transaction
internally, but need to take care of the transportation themselves and the risks involved.
4. The fourth step in the procedure can be used by all dealers, both individual and
dependent dealers. This step is used to search for the part at other dealers, outside their
own ownership but within the same country. If the part is available, then there exists
two different ways of how the part can be transferred from one dealer to the other. The
dealer can either buy the part, at a regular price (also known as over the shelf costs) or
at a discounted price, which varies from dealer to dealer and their situations. The other
way is that the dealer can borrow the part from the dealer and at the same time place a
day order to Volvo. This means that when the dealer receives the day order, this part
will be given back to the dealer that lend the part at first and the dealer that borrowed
the part will pay for the day order and handle the transportation. What also needs to be
noted in this step is that there are some dealers that don't use this step and instead go to
the next steps directly.
5. The last step is used when the dealer is not able to find the spare part in any of the other
steps explained above. In this case, the dealer needs to create a VOR in another system.
By creating a VOR, the dealer contacts the Volvos customer support team that take over
the search for the part, as explained above.
4.1.3 Transport Processes
Today Volvo has one transportation setup for the aftermarket services, which varies depending
on the type of the order. These flows originate either from a central-, regional- or support
warehouse depending on the type of order which will be briefly discussed below for a better
understanding of the current transport flows and processes:
Stock order:
Stock orders are orders, which are shipped in huge quantities to the dealers. These are therefore
either carried as FTL (Full Truck Load) consignments on trailers or in containers by sea. These
quantities can be shipped to the dealer either from the central warehouse closer to the market
company or from the regional warehouse in the market, depending on what the dealers are
connected to as a facing warehouse. Frequency of these shipments on an average is 1-5 times.

46
Day order (24 hours):
Day orders, as explained above, are orders placed by a dealer when they do not have the part in
stock and need it on an urgent basis with a lead time no longer than 24h. These types of orders
usually come in small quantities compared to stock orders therefore the type of transport used
is either a small truck or the orders can also be combined with another order which is in transit.
These orders can be fulfilled either from a central-, regional- or support warehouse. The dealer
on a daily basis can place these types of orders before the cutoff times depending on the region,
which is again based on the transport solution purchased for the region so that the dealer can
have the part the next morning. This setup also has certain exceptions, which depend on where
the dealer is located, and which type of warehouse is located close to it.
VOR (ASAP):
VOR orders are orders placed when a vehicle has broken down when in transit, therefore the
urgency of a part for the vehicle to be up and running in such a situation is of the highest
importance for the customer. If the dealer close to the end customer does not have the part
required then a VOR request is placed in which case due to the urgency, the part can be either
airlifted or transported by other modes depending on how far away the part is located from the
dealer. This transport is therefore much faster and expensive compared to the other two order
types explained above. The frequency for such deliveries cannot be forecasted and therefore
depends on the breakdown of the vehicle.
4.1.4 Current parts sharing
The relationship between dealers varies from market to market and also within the same
market. In some markets, dealers see each other as competitors, while in other markets they see
each other as collaborators. In the later case, it is more common that dealers share parts with
each other in case of an emergency. For example, in Sweden it’s common that dealers share
parts with each other, either by buying or borrowing the part, as explained in the dealer order
process above. In other markets such as South Africa, Dubai, Thailand and Russia it so
happens that the dealer shares parts with each other, depending on the situations, such as in the
case when the support/regional warehouse is too far away. What is common in these markets is
that the dealers are able to see each others inventories, since they share the same IT-platform.
Something notable from this is that Volvo today isn’t involved in the parts sharing, expect
when Volvo owns the dealer.
Regarding how the transaction and payment is solved, it differs between the markets and
depends on the relationship between the different dealers and their agreement between each
other. What is common in some markets, like in South Africa and Russia, is that the price that
the dealers need to pay to another dealer is often 10% higher than the price that Volvo takes for

47
the part. This 10% often exist to cover the administration costs that the dealers need to take
when transferring a part to another dealer. Since Volvo isn’t involved in most of the parts
sharing between the dealers, the transportation is solved by the dealers.
4.1.5 Challenges from the current processes
From the current processes presented above, certain challenges could be identified that indicate
the need for an improved setup or process.
Since the dealers do not hold all the Volvo parts, which can be from very old part range to very
new part range therefore over the counter availability for the dealers is never 100%. In practical
terms having an availability of 100% has its own negative aspects like capital costs, parts
loosing value etc. and therefore is not suggested. This is the reason Volvo has the structure
with the day order set up to secure a faster response whenever parts are demanded and cannot
be covered from dealer stock, but unfortunately not every country has a support warehouse nor
is the support warehouse able to solve this issue completely at all times.
The other prominent issue that Volvo deals with is the transportation costs and the long lead
times it takes to solve these emergency issues. In case of an emergency today, parts are often
airlifted from different warehouses, causing huge transportation costs for Volvo together with
expensive taxi transports used within the same country. Today, dealers in some countries help
each other in case of an emergency by sharing parts with each other. This requires dealers to be
transparent, but a phenomenon that exists is that dealers hide parts from each other. Dealers do
this due to the fact that some parts are difficult to refill by Volvo. Another challenge today is
that Volvo isn’t involved in the process, a process that could increase the availability Volvo
could offer their end customers.
Because of these challenges it is suggested that Volvo needs an improved setup, which can
increase the availability and reduce the emergency orders.
4.2 D2D Setup
After understanding the current processes and the challenges involved in the current processes
for Volvo and from interviews conducted with other brands acquired by Volvo a general setup
is suggested called the “general model”. This section of the chapter starts with explaining how
the general model can be constructed and used by any company and in any market. This will be
followed by two new scenarios along with suitable transportation setups which is later tested in
two Volvo markets as discussed in the introduction of this chapter.

48
4.2.1 General model
Every established automobile manufacturer has dealers, which serve the end customers with
their needs. Therefore keeping the requirements of such dealers in mind a general model is
designed, which can be seen in figure 10 below. The suggested model designed is also keeping
in mind a faster availability of parts and high uptime of the vehicles. This model can be used in
any market for companies within the manufacturing industry. The grouping can be done on
various parameters but it depends on which are the most important parameters for the particular
company. To group these dealers it is also important to narrow the landscape of a country
based on the right parameters in order to reach to the final groups. In general, a country can be
seen as a big group of dealers which needs to be further narrowed down to get the best possible
dealer groups fulfilling the main requirements from this grouping process. The dealers
presented on the maps below will be referred to as nodes for this model whereas the distance
between these nodes will be referred to as the edge in this grouping process. The grouping
process is shown in figure and explained in steps below based on the parameters which are
most important for this project:
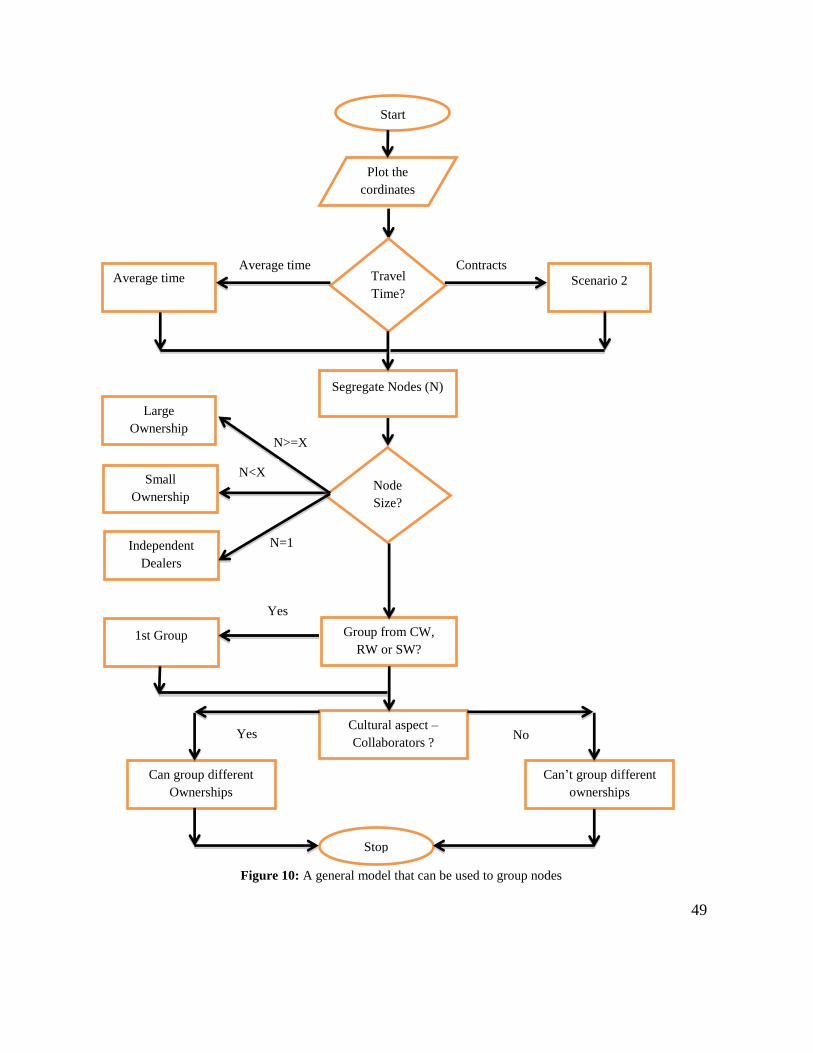
49
Figure 10: A general model that can be used to group nodes
Node
Size?
Can group different
Ownerships
Can’t group different
ownerships
Stop
Yes No
Independent
Dealers
Small
Ownership
Group from CW,
RW or SW?
Cultural aspect –
Collaborators ?
1st Group
N>=X
N<X
N=1
Yes
Start
Plot the
cordinates
Travel
Time?
Average time
Scenario 2
Segregate Nodes (N)
Large
Ownership
Average time Contracts

50
1. Plot the nodes
In order to start the grouping process, the dealer points need to be plotted on a mapping
application or software. The plotting of these points is done based on the dealer coordinates
as can be seen below in the maps of USA and Italy.
Figure 11: Volvo dealer locations in the USA
Figure 12: Volvo dealer locations in Italy

51
2. Travel Time
In order to start with the grouping process, it is important to first consider the parameters
for grouping. It is also important to understand the reason for the grouping process well
enough to get to the right set of groups which are based on the right set of parameters. The
main reason behind this process of grouping dealers/nodes is to ensure faster availability of
parts in case of an emergency. Faster availability indicates the fact that dealers, which are
close to each other need to be grouped together. The closeness of a dealer can be seen in
two ways;
1. Based on the distance between the nodes
2. Based on the travel time between the nodes
The distance between two nodes can be small but if the road conditions or the type of roads
(no highways) are not fit for heavy duty vehicles then this might take more time between
nodes compared to nodes which are a bit far away yet the road conditions are better and
therefore take less time to travel. Taking this as the main argument, it is suggested to base
the groupings on travel time as it takes into consideration the distance as well.
Associated to the travel time are many costs such as transport costs, waiting time costs to
be given to the end customer etc. It is important therefore to decide a suitable travel time
between the nodes. The travel time which is decided should be suitable for same day
availability as that is the main objective from this grouping process. Therefore two different
ways for deciding the travel time are presented below. The first way is based on the average
travel time, and below are two different scenarios presented on how this can be calculated.
This is followed by the second way of how travel time can be decided based on companies
contract towards their end customers.
Scenario 1: Dealers/ Nodes are close (travel time) to each other
This step can be mathematically tested by checking the travel time from one node in this
region to 5 or 10 neighboring nodes and calculating the average travel time. The same step
can be repeated for few more nodes and an average of these average travel times can be
decided for this scenario. This can be better understood from the example below where the
suggested travel time for this scenario will be 2,23 hours.
52
Table 2: Calculation of average time on nodes close to each other
Scenario 2: Dealers/ Nodes are far (travel time) from each other
This step can also be mathematically tested in the same way as in scenario 1, where an
average travel time from one node to 5 or 10 neighboring nodes is calculated. The same
step can be repeated to get an average travel time from a few more average travel time
calculated and decided for this scenario. This can be seen from the table below for a better
understanding.
Table 3: Calculation of average time on nodes far from each other
The second way to decide on a suitable travel time can be based on the contracts offered by
the company to its end customers. These contracts are basically based on the availability of
spare parts in case of emergency. If companies don’t use these kinds of contract, the
decision on travel time can also be decided on a lead time target for the type of service they
want to offer to their end customers.
3. Segregation of nodes
The next step in the grouping process is to segregate the nodes in a manner, which will be
useful when clustering the nodes. The nodes may have different characteristics, such as
being part of different types of ownership and based on the project's requirement, these can
be segregated into different groups. For this project, it was noted that some nodes were a
part of a big group or in other words have many branches (more than one node/branch)
whereas some nodes are on their own. Therefore taking this as the main consideration for
this step of segregating the nodes, three groups were decided – Large Ownership, Small
Ownership and Independent dealers.
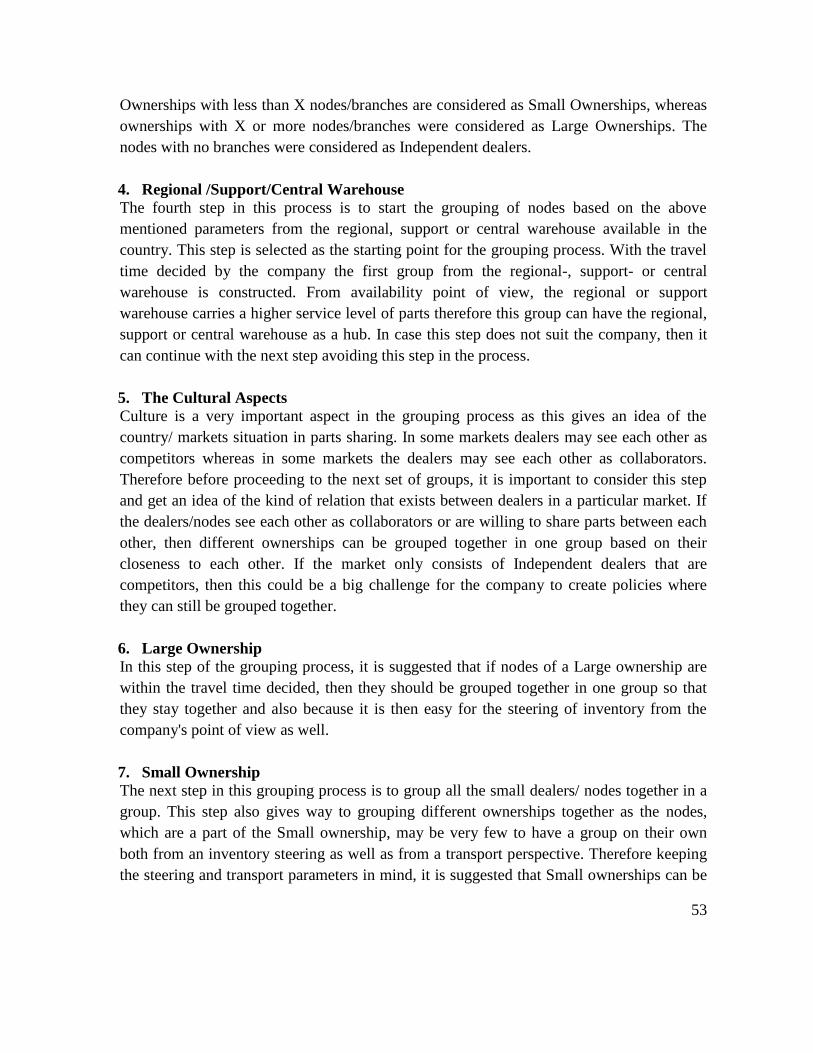
53
Ownerships with less than X nodes/branches are considered as Small Ownerships, whereas
ownerships with X or more nodes/branches were considered as Large Ownerships. The
nodes with no branches were considered as Independent dealers.
4. Regional /Support/Central Warehouse
The fourth step in this process is to start the grouping of nodes based on the above
mentioned parameters from the regional, support or central warehouse available in the
country. This step is selected as the starting point for the grouping process. With the travel
time decided by the company the first group from the regional-, support- or central
warehouse is constructed. From availability point of view, the regional or support
warehouse carries a higher service level of parts therefore this group can have the regional,
support or central warehouse as a hub. In case this step does not suit the company, then it
can continue with the next step avoiding this step in the process.
5. The Cultural Aspects
Culture is a very important aspect in the grouping process as this gives an idea of the
country/ markets situation in parts sharing. In some markets dealers may see each other as
competitors whereas in some markets the dealers may see each other as collaborators.
Therefore before proceeding to the next set of groups, it is important to consider this step
and get an idea of the kind of relation that exists between dealers in a particular market. If
the dealers/nodes see each other as collaborators or are willing to share parts between each
other, then different ownerships can be grouped together in one group based on their
closeness to each other. If the market only consists of Independent dealers that are
competitors, then this could be a big challenge for the company to create policies where
they can still be grouped together.
6. Large Ownership
In this step of the grouping process, it is suggested that if nodes of a Large ownership are
within the travel time decided, then they should be grouped together in one group so that
they stay together and also because it is then easy for the steering of inventory from the
company's point of view as well.
7. Small Ownership
The next step in this grouping process is to group all the small dealers/ nodes together in a
group. This step also gives way to grouping different ownerships together as the nodes,
which are a part of the Small ownership, may be very few to have a group on their own
both from an inventory steering as well as from a transport perspective. Therefore keeping
the steering and transport parameters in mind, it is suggested that Small ownerships can be
54
grouped together. When clustering small groups of dealers/ nodes, it is also suggested to
limit the number of different ownership in one group.
8. Independent Dealers/Nodes
The last step in the grouping process is to group the nodes, which are independent. This
step can be conducted only if these independent nodes lie within the travel time decided by
the company. If these nodes are not located within the decided travel time then it is
suggested that these nodes are grouped together with the closest Small ownership groups.
This can be better explained with an example; if there are three independent nodes located
close to each other and a Small ownership group with three branches close to each other,
then these six nodes/ dealers can be put together in a group.
4.2.2 Steering scenarios and transport solutions
To be able to increase the availability of spare parts two new scenarios have been developed,
based on the different groups that have been created in the general model above. Below is the
two new scenarios presented together with models showing how they work.
Figure 13: Single Dealer level
The first scenario, which can be seen in figure 13 above, is developed to utilize sharing of part
between two parties. In this scenario it is suggested that a node with a higher stock holding
capacity having nodes around it is made the hub in the group. This scenario is called Single
dealer level as one node in the group supports the other neighboring nodes by holding
inventory when in need. To exemplify this better, from the figure above it can be seen that the

55
fast moving parts such as 1 to 10 can be stocked at all the nodes in the group whereas the entire
part range (1-16) can be stocked at the hub, which in the figure is D. With the steering of the
parts comes the transportation of parts between nodes. Therefore the suggested transportation
for such a scenario can be the hub and spoke system where the transport starts at the hub and
supplies parts to the spokes, which in this case are the other nodes. Depending on the size of
the group and on the company a milk run can also be used as a transport solution in this setup.
A milk run transportation set up means that a truck starting from one node going around to the
other nodes included in the group.
Figure 14: Group level
The second scenario suggested for nodes within a group can be seen in the model above, Figure
14. This model is known as Group Level, since the stocking of parts in this setup is done by all
dealers in the group, but not all the dealers carry the same parts. To exemplify this better, from
the figure above it can be seen that the fast moving parts such as 1 to 10 can be stocked at all
the nodes in the group whereas the slow moving or exotic parts will be distributed in the group
in a way that it can be shared among the nodes when needed. Moving to the transportation
setup for such models, milk run suits best for this type of need. This is because there will be
parts moving in and out from each node and not one common point as in the hub and spoke
system.
56
4.3 Case study
A case study was performed to put the general model into practice for a pilot batch and to test
the results. For this case study, Volvo Groups LPA dealers in Sweden and Norway were
selected due to the following reasons:
1. Sweden and Norway are two mature markets for Volvo Group aftermarket services.
2. In these markets cross border parts sharing can be tested.
3. These markets are part of EU and Non EU.
4. These markets have all the three types of ownerships.
5. The authors are close to these markets, which make it easy for them to visit dealers.
In total these two markets have 152 LPA dealers, 97 dealers in Sweden and 55 dealers in
Norway. Sweden has dealers which are part of an ownership as well as independent dealers
whereas Norway has dealers which are only part of an ownership and there are no independent
LPA dealers. Based on this basic information, the groups for both the markets were built as
follows:

57
1. Plot dealers As described in the general model above, the first step is to plot the dealers on a map to
be able to continue with the next steps and create different groups. In order to plot the
dealer locations on mapping software, which in this case was Business Maps Online,
the coordinates of these dealers had to be searched. After the coordinates were gathered,
all the dealer locations were plotted on the map as shown in figure 15 below, where the
different colors represents different ownerships.
Figure 15: The location of Volvo Groups dealers in Sweden and Norway
Note: The colors represent the different ownerships of dealers
58
2. Travel Time
In the second step, the travel time for grouping was decided. This step can be based on
two factors as explained in the general model above. One way of deciding on a travel
time is based on the average time taken between the different nodes and the other way
is based on the contracts that are offered to the end customers in case of emergency
situations. Volvo offers different contracts to its end customers, Gold contract promises
the fastest uptime of vehicles in case of an emergency, which mean that the part should
be delivered within four hours. Therefore, a travel time of three and a half hours has
been used to group the dealers with 30 minutes allocated for picking and packing of
parts. The goal with the group is to improve the availability and increase the service.
3. Segregation of Nodes
In the third step, the entire list of dealers was segregated into three different types for
Sweden. In case of Norway, the entire list of dealers was segregated into one type. The
Swedish dealers were segregated into; Large ownership if there were five or more
dealers within one ownership, Small ownership if there were less than five dealers
within one ownership and Independent dealers if there were one on their own. The
breaking point at five dealers was based on a pre-study made at Volvo that came to the
conclusion about five or more dealers within one group, since it was suitable for
inventory planning. The Norwegian dealers were only divided into Large Ownership,
since this was the only type of ownership that existed within the market. The
segregation of these dealers can be seen in figures 16, 17 and 18 below:

59
Figure 16: The segregation of nodes into Large ownerships

60
Figure 17: The segregation of nodes into Small ownerships

61
Figure 18: The segregation of nodes into Individual dealers
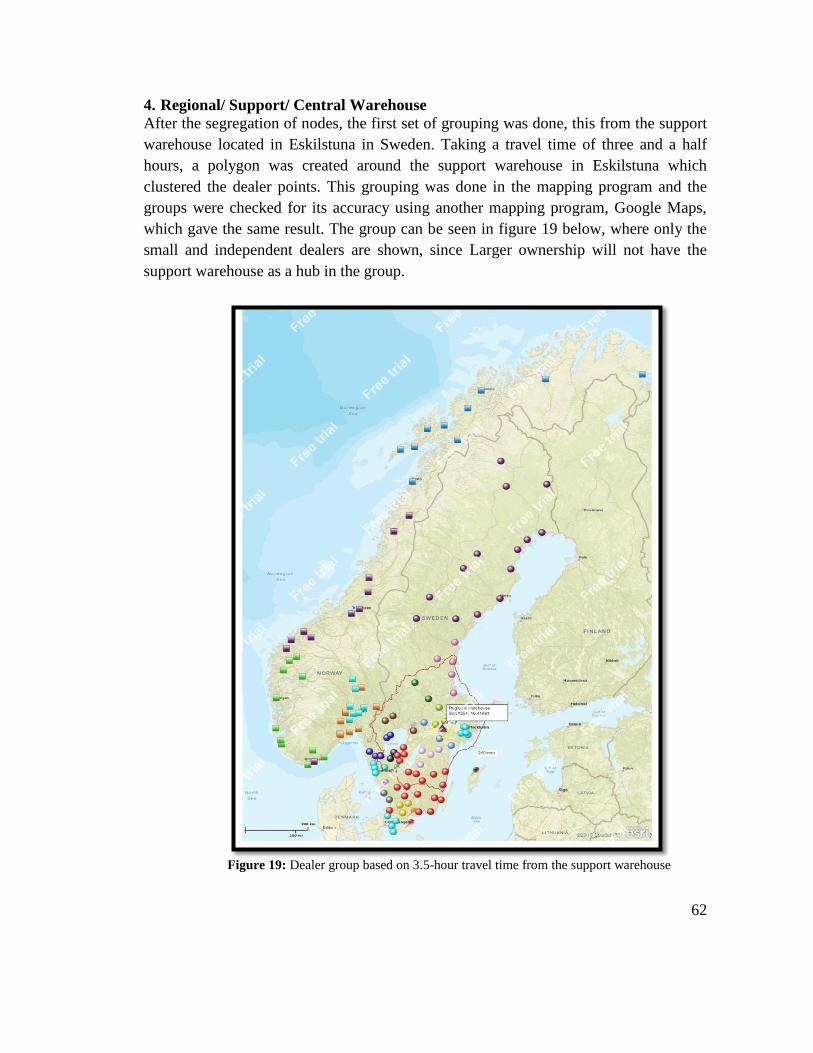
62
4. Regional/ Support/ Central Warehouse
After the segregation of nodes, the first set of grouping was done, this from the support
warehouse located in Eskilstuna in Sweden. Taking a travel time of three and a half
hours, a polygon was created around the support warehouse in Eskilstuna which
clustered the dealer points. This grouping was done in the mapping program and the
groups were checked for its accuracy using another mapping program, Google Maps,
which gave the same result. The group can be seen in figure 19 below, where only the
small and independent dealers are shown, since Larger ownership will not have the
support warehouse as a hub in the group.
Figure 19: Dealer group based on 3.5-hour travel time from the support warehouse

63
5. The Cultural Aspects
The next step was to look into the current scenario of parts sharing in Sweden and
Norway. Dealers in both these countries see each other as collaborators and are willing
to share their parts between different ownerships. This step therefore allows dealers to
be grouped with different ownerships together as well in the following steps, which can
be seen in figure 21 below.
6. Large Ownership
In this step, the dealers which from an earlier step were segregated into Large
ownership were plotted on the mapping software based on their coordinates. These
dealers are part of big ownerships, which have a main dealer in every group. Therefore
from the main dealer in every group taking a three and a half hour travel time, polygons
were drawn on the map. There are certain ownerships, such as the green dealer group,
which are a very big ownership spread over a very large area, such ownerships were
therefore further divided into two groups. What also can be seen in figure 20 is that two
groups are cross-border groups, with dealers located both in Sweden and Norway.

64
Figure 20: Large ownerships groups
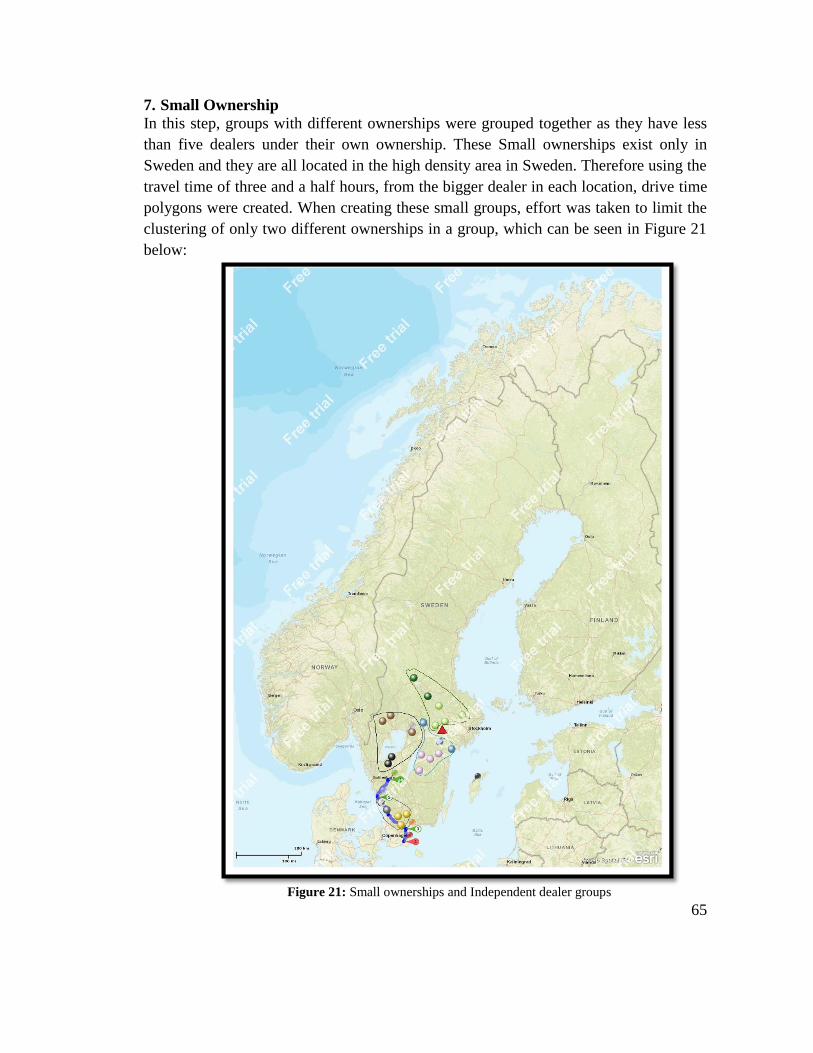
65
7. Small Ownership
In this step, groups with different ownerships were grouped together as they have less
than five dealers under their own ownership. These Small ownerships exist only in
Sweden and they are all located in the high density area in Sweden. Therefore using the
travel time of three and a half hours, from the bigger dealer in each location, drive time
polygons were created. When creating these small groups, effort was taken to limit the
clustering of only two different ownerships in a group, which can be seen in Figure 21
below:
Figure 21: Small ownerships and Independent dealer groups

66
8. Independent dealers
In the last step of the grouping process, a three and a half hours drive time polygon was
created from the biggest independent dealer. As with the Small ownership, this group
only exists in Sweden and in high-density area, which also can be seen in Figure 21
above.
From the case study, it can be seen that Sweden and Norway together have 14 big
groups, four small groups and one group of independent dealers in Sweden, which can
be used to increase the availability of parts at group level. The impact from this setup
will be discussed in the next chapter.

67
5 Discussion
This chapter starts with a discussion on Volvo Group’s current processes and is followed by a
discussion about the general model that has been developed within this study and how groups
can be created. This is followed by a discussion about the two new scenarios that have been
developed, discussing how this will change the steering of inventory towards dealers, how
inventory pooling can be implemented and what challenges that exist with the concept. The
chapter ends with a discussion that concerns how same day availability within the groups can
be achieved by using new transport solutions, the new dealer order processes and how the
availability can be improved by the grouping process.
5.1 Current processes
Today Volvo Group dealers’ requirements are fulfilled from three different types of
warehouses with different functionalities. As can be seen in the flow of parts process in figure
7, the dealer is the face of the company to its end customers. The flow of the parts in the supply
chain today takes place through the same facilities as described by the author Simchi Levi et al
(2007). This flow of parts through these various facilities is usually the same when comparing
manufacturing industries due to their functionalities in the supply chain but the source and
destination for the parts may differ between companies. It can also be noted that the flow
process for a stock order is different from the flow process for a day order or VOR order. The
main reason for this difference is due to the demand for parts.
In case of a stock order, the demand is known and is based on a push type of inventory. This
setup is based on the previous sales which indicate what level of sales can be expected from
each dealer and as stated by authors such as Ramachandran et al (2002), these types of
inventories help in deciding when and where to move the inventories. Whereas in the case of a
VOR or day order, the demand is not known and therefore cannot be predicted exactly, as a
breakdown can take place anytime. To handle such kinds of emergencies, it is important that
the dealers have all parts in stock at all times in order to take care of these situations without
having to make the end customer wait. There exist both advantages and disadvantages with
keeping all the parts in stock as an inventory by the dealers. The advantage is that the customer
receives a high uptime of the vehicles and the dealer creates a good image with high customer
loyalty, but the disadvantage from keeping high stock is the high capital cost tied up to this
high inventory. In addition to the high capital costs, there are other costs associated to this –
such as the warehousing costs that include the extra warehouse space to carry all parts. Other
common costs associated to this storage are the degradation and potential obsolescence of parts
and the costs associated to it (Simchi-Levi et al, 2007).
68
As the role of a central warehouse includes holding all the stock for the markets dependent on
it, therefore there exist six central warehouses in the world to serve all the Volvo markets
today. The role of these central warehouses is to supply the production sites with parts and the
dealers with regular stock orders. The inbound flow to the central warehouses can be from the
suppliers and production sites whereas the outbound flow is to many facilities like the
production sites, central-, regional- and support warehouses, dealers etc just as discussed by the
authors who state that every pool is connected to the central warehouse and is replenished by
the same (Kutanoglu, 2008). The role of the regional and support warehouses of Volvo are
designed and positioned in such a way that they serve the purpose of efficient inventory
steering to the dealers. As described in the current process of Volvo, this states that the support
warehouse acts as a support to the central warehouse by carrying the exotic parts. By applying
the general model and the two scenarios developed within this study, the current setup will be
changed. This will be discussed within this chapter together with the pros and cons at a general
level.
5.2 General model
This part of the discussion concerns the importance of availability of spare parts for companies
within the manufacturing industry to be able to deliver a high service level to their end
customers. The chapter will discuss the general model that has been developed within this
study with the main focus on how this can improve the availability.
Manufacturing companies function in different ways to be competitive in market and to attract
more and more customers to their brand. When it comes to construction vehicles, buses, trucks
etc the competition is even higher as these vehicles in general mainly carry business. Therefore
companies manufacturing such heavy equipment vehicles have to be extra sharp in making sure
that their customers vehicle is up and running as soon as possible after a breakdown. To make
this happen, the parts which are distributed or sold by dealers have to have a very high stock of
parts which are not 100 or 200 types of parts but more than 10 000 parts in general, which
varies depending on the market and the new vehicles on road. It is not wise to carry all the
parts by all the dealers due to the high capital costs tied up to it as well as due to the high
inventory holding costs especially if the parts are from very old vehicles. Therefore a model
that can improve the current setup without needing to stock expensive parts at all dealers was
developed.
The new model was designed by keeping in mind all the requirements which are needed to be
fulfilled by any manufacturing company’s aftermarket service. As stated in the processes

69
above, the main requirement from an aftermarket service is high uptime of vehicles in case of
emergencies together with faster availability of parts. The latter requirements can be fulfilled
by grouping dealers in every market which will be discussed below.
This grouping process is a general grouping process, which can be modified based on specific
requirements that companies may have. This process can also be referred to the discussion by
Rozenblat et al (2013) on how nodes can be clustered better. To discuss this better, it is
important to understand what kind of dealers the company has for their parts distribution and
therefore how they should be grouped or clustered. The three aspects that are important to be
considered in network planning are network design, inventory positioning and the resource
allocation (Simichi-Levi et al, 2007). This includes the number of nodes within one group,
location of the dealers and how the service level will be affected by the positioning of the
inventories. Therefore when clustering or grouping these dealers such parameters and criteria
were taken into consideration from which a cost and time effective solution could be suggested.
Below mentioned are the steps used for the grouping process within the general model:
1. Plot the nodes
The first step suggested in this grouping process is the plotting of the dealer points
which according to the literature is referred to as nodes on a map as this makes the
grouping process easier and better (Oracle, 2016). The reason this plotting of nodes is
decided as the first step is because it gives the researcher an idea of how the dealers are
spread in a market and how should the next steps be decided and the process be
designed. The grouping of dealer points will be accurate only if these dealers are plotted
on the basis of their coordinates and not merely their addresses or pin codes. This is the
reason the dealers suggest that the nodes are plotted on the basis of the dealer
coordinates only.
2. Travel time
The next step in this process is supposed to be the most important step from a grouping
perspective. This step decides or is the basis for the other steps. Therefore it is
suggested that this step is the second step in the process and is done with utmost
accurateness. The reason this step is suggested as the second step in the grouping
process is because the main reason for grouping is high and faster availability of parts.
This can be performed only by measuring how close the dealers are to each other.
Measuring the closeness can be done on the basis of distance and on the basis of travel
time. It might be a little confusing as to why the travel time has been considered, as
travel time will be calculated on the basis of distance. That is true but from the
interviews conducted in the study, information about poor infrastructure in certain

70
markets leading to higher travel time even in shorter distances were understood.
Therefore, travel time is suggested to be a more accurate form of measuring the
closeness between the dealers.
There are two ways of deciding the travel time between the nodes as suggested by the
dealers. It is in this step where the plotting of nodes on a landscape becomes more
useful. From the maps, in the case study, it can be seen that certain nodes are close to
each other whereas some of these nodes are far from each other. Therefore, it is
suggested that an average travel time for these areas are calculated in order to conclude
what travel time should be taken as an average in these areas. This can be related to
Boccaletti et al (2006) description about the importance of the shortest-path in a
transportation network and that the average time, which can be referred to the
characteristic path length, which is the separation between two nodes. It is also possible
that in some markets an average travel time in general between the nodes will be similar
and therefore only one travel time for the market can be decided for the grouping
process. This might not be the case in all the markets due to their geography, population
etc which may show different average times for these high and low regions, therefore in
such scenarios it is suggested that two travel times are taken for the grouping process.
This is the reason why an example has been shown of both the types of average travel
times.
The second way of deciding a travel time is based on the contracts that the company
may have for their end customers. These contracts basically promise the end customer
the best service as early as possible that can be provided by the company in case of an
emergency. Some companies have such contracts while some may not have such
contracts as these depend on company policies. These contracts may vary depending on
the type of services offered by the company and the different type of end customers a
company has (Kutanoglu, 2008). In the case of Volvo Group, the best contract offered
in terms of fastest uptime of vehicles in emergency situations is the Gold contract
where the company promises its customers 100% uptime within four hours. Therefore
for the grouping of dealers in Sweden and Norway, the lead time provided by Volvo for
Gold contract was used as it offers the best service and fastest availability of parts. This
lead time of four hours was therefore used when grouping dealers in Sweden and
Norway. This lead time of 4hours included a travel time of three and a half hours and
the pick and pack time of 30 minutes. The travel time of three and a half hours was also
cross checked for these two regions with the help of the first way of grouping dealers
that is using the mathematical average method. It should be discussed that the company

71
can decide to use another travel time based on their lead-time target, which is up to the
company to decide.
3. Segregation of Nodes
In this step of segregating the nodes, the dealers are segregated into different groups in
order to keep similar dealers, which are based on numbers of dealers within one
ownership, in one group and steer inventory in these groups with similar service level.
Interviews conducted with Volvo representatives in different markets gave an idea
about the different types of dealers that existed in every market. Based on this dealers
were divided into three different groups. These three groups of dealers were Large,
Small and Independent dealers were then plotted into three different maps in order to
make the grouping process easier on the software and also to keep similar dealers
together on maps. This can also be seen in the case study, figures 20 and 21, where
Sweden has all three types of dealers whereas Norway has only one type of ownership.
The case study reveals that different types of dealers exist in different markets and
therefore how this segregation process can be of help in any market.
4. Regional/ Support/ Central Warehouse
In order to start the grouping process, it is important to start from some point. Therefore
it was considered best start the grouping process either from the regional-, support- or
central warehouse depending on what exists in the market. There may also be markets
which have neither of these warehouses, in such cases it is suggested that the next steps
in the grouping process is followed. A group consisting of having a regional-, support-
or central warehouse can always have the warehouse as the hub for the group. This can
be a positive aspect in parts sharing as the warehouse always has high levels of
inventory as well as frequent outbound transport as well. This step can be clearly seen
in the case study, figure 19, where the regional warehouse in Eskilstuna, Sweden is
considered as the hub and from this a three and a half hour travel time is used to create
the first group of dealers. This first group consisted of all the three types of dealers but
the dealers which are a part of Large ownerships were excluded from this first group
because the aim was to keep all the dealers under the Large ownership as one group
together, provided they can be reached from their main dealer using the three and a half
hours travel time which in this case did fulfill that aspect.
This step as stated above is not a compulsory step and can be altered as per the
company's requirement. This step can also be related to the first step in network
planning, where the first step is to decide the design of the network. By starting from
the regional-, support- or central warehouse, the physical and infrastructural
72
configuration in the supply chain has been decided (Simchi-Levi et al, 2007). What
needs to be noted in this step is that if a company chooses to use this step, the
warehouse will act as a hub and the travel time will be based from this. If Volvo decide
to use this step, they also need to consider the aspect of changing the current inventory
handling set up that exists within the warehouse today in order to be able to implement
inventory sharing within this group.
5. The Cultural Aspect
The cultural aspect is considered to be another important checkpoint in this grouping
process. Whether dealers in a particular market consider each other as competitors or
collaborators is vital. If dealers see each other as competitors it can be difficult to group
different ownership together, whereas if dealers see each other as collaborators then
dealers from different ownerships can easier be grouped together. This aspect can be
very well seen in the case study, figure 20 and 21, where dealers in Sweden and
Norway see each other as collaborators when it comes to parts sharing. Therefore the
dealers in these markets, with different owners have been grouped together. If the cross
ownership grouping is successful then huge savings on time and costs for parts sharing
can be made. It’s important to give the dealers an understanding of all the benefits that
can be received by participating in this process (Kutanoglu, 2008).
6. Large Ownership
The next set of grouping begins with ownerships, which have X or more branches in a
group, where X is decided by the main company. The grouping process starts from the
main dealer in each ownership. By using three and a half hours of travel time, the
groups are created from these main dealers, in the case study, this can be seen better in
figure 20. There were cases when some dealer points fall out of the three hours travel
time, therefore in such cases it is suggested by the dealers to make more than one group
of dealers. For Volvo, it is suggested to have at least five dealer points in a group, since
this was stated from a pre-study for steering of inventory which was done by Volvo.
The groups in Sweden and Norway were created from using these five dealer points. It
can also be seen from the maps that there are certain groups which stretch across
border. The reason this is considered as a good way of grouping is because there are
points across borders which can be reached faster than dealer’s points which are in the
same country. This can be seen clearly in the case study where the blue dealer group is
a major dealer who has branches in both Sweden and Norway. These were grouped into
three different groups across borders. From certain interviews conducted, this was
suggested as a good move by the transport department as Norway does not have a good

73
road infrastructure compared to Sweden. As a consequence certain shipments going to
the North of Norway go via Sweden by taking a de tour.
7. Small Ownership
As can be seen from the map in figure 21 above in the case study, there exist very few
dealers which are a part of the Small ownership. These ownerships may not have X
branches under an ownership and therefore it is not suggested to keep these dealers in a
group alone as this will be a costly affair for the company. Therefore by clustering these
ownerships together, it is suggested to have them as one group.
8. Independent Dealers
The independent dealers are suggested to be grouped together in the same group if these
dealers are located within the travel time of three and a half hours from each other. This
can be seen from the case study, in figure 21, where Sweden has only six independent
dealers, out of which four dealers follow the travel time of three and a half hours.
Therefore it can be seen that most of the independent dealers can be grouped together.
Although, there can be certain cases where independent dealers don’t fall under the
same group or can’t form their own group – either because of the travel time being high
or because there are less than five dealers in a group. In such cases it is suggested that
these dealers either are left out of the grouping process or that these dealers are grouped
with one of the Small ownerships. The Small ownership might be able to manage this
extra dealer as well. The decision is left to the company to decide based on their
requirements.
5.3 Scenarios
To achieve same-day availability there are different aspects, from a logistics point of view, that
needs to be considered – such as the steering of inventory and the transportation networks. By
analyzing the structure of the network the reachability between nodes can be seen, which is
important when striving to achieve same day availability (Boccaletti et al, 2006; Graph theory,
2013; Easley & Kleinberg, 2010). The two scenarios that have been developed within this
study are based on the concept of inventory pooling to improve the availability of spare parts at
dealers within the manufacturing industry.
Inventory pooling, is a kind of lateral transshipment that was first considered by Lee (1987)
and by using inventory pooling, also known as virtual pool inventory, the service level can be
improved as well as the costs can be reduced. It suggested that, by adapting inventory pooling,
the company would also use an efficient strategy, which can be considered to be important for

74
companies that strive to attain a high service level, like companies within the automobile
industry. (Kutanoglu, 2008; Braglia & Frosolini, 2013)
The concept of how inventory-pooling works is explained by Kutanoglu (2008) who describes
how dealers, in this case, can search for a part at a secondary location by creating an
emergency lateral transshipment between each other. After grouping dealers based on the
general model that has been developed and discussed within this study, the two scenarios can
be applied which will improve the service level at the dealers. This is something that is
important for Volvo to deliver to their end customers and something that also can be related to
Kutanoglu’s (2008) discussion about the importance for some companies to be able to deliver
high uptime service, as this incurs high costs for both Volvo by sending the parts through an
expensive mode of transport and to the end customer as a standstill cost for the vehicle.
The first scenario, Single Dealer Level, is based on the fact that one dealer acts as a hub,
supporting the other dealers with stock. This can be referred to Kutanoglu’s (2008) description
about consolidating parts within a limited number of locations. The scenario is recommended
to dealers within a Larger ownership, which suggests that by being within the same ownership
it’s easy to collaborate with each other, something that could be considered to be a challenge in
this concept. By being within the same ownership it’s easier to share parts between each other
and give one dealer the responsibility to carry all the stocks for the others. The decision of who
is going to be the hub or how many hubs that should exists within one network depends on the
design of the network, as Simichi-Levi et al (2007) discussed. This is in the first part of
network planning that this decision is taken regarding where the inventory should be located
and how many locations that should exist (Simichi-Levi et al, 2007) In some of the Large
ownership groups, it can be necessary to use two hubs or even divide the group into smaller
units, in order to achieve same day availability, since the truck need to be able to reach all
dealers within the same day. With too many nodes within one group, this can be problematic
and something that the main company need to consider, when deciding the size of the group.
The second scenario, Group level, is based on the fact that all parties within one group should
share the responsibility of carrying the stocks. This means that all of the dealers within the
group will be carrying some of the parts, like the fast moving parts. The carrying of slow
moving parts will be divided between the parties. In this scenario all dealers will help each
other by carrying some of the parts, meaning that the dealers become dependent of each other.
All groups created by the general model can use the second scenario, compared to the first one.
The scenario can be applied to Large ownership groups, as well as for Independent dealers and
Small ownerships. This setup will also avoid dealer to be able to hide parts from each other,

75
mainly due to the fact that by giving all the dealers within the group the responsibility,
decreases the risks of dealers parasitizing other dealers within the same group if they are part of
a Small ownership, since they will all be dependent of each other.
5.3.1 Challenges within the scenarios
As Braglia & Frosolini (2013) discussed the number of parties involved in inventory pooling
will affect the possible savings that can be made from the concept. The more dealers
participating in the concept the more money can be saved. But there are also risks that might
come with too many parties involved, such as the risk of not being able to deliver within the
decided time frame or the risk of creating high costs due to the need of trucks going to and
from the different nodes. This creates a challenge when it comes to deciding how many nodes
that should be grouped together. In the case study were all the Large ownerships are grouped
together and to be able to apply the second scenario into these groups, some of the larger
groups can be divided into small groups, which can be seen in figure 22 below.
Figure 22: Large ownership group divided into two smaller groups
This is suggested in order to be able to receive same day availability in the second scenario,
since it’s especially important that the number of nodes within the group isn’t too big, since the
spare parts will be divided between the dealers, and this can result in one dealer needing a part

76
both from dealer A and dealer B. It’s also important to get dealers to understand the benefits
that can be received with this scenario in order to get them to go from being competitors to
being collaborators, as Kutanoglu (2008) described. Due to the fact that different ownerships
are grouped together, this will create some challenges regarding the transaction, compared to if
all the parties are within the same ownership since everything can be handled internally, which
is a simpler procedure (Basu Bal, 2016). One way to solve this is to do it automatically, by the
main company creating a credit note to the dealer sending the part and an invoice to the dealer
that receives the part. This including that the main company buys the part back from the dealer
and sells it to the other dealer, which includes some legal aspects that will be discussed below.
Before the scenarios can be implemented into groups, there are some legal aspects that need to
be dealt with. To start with, the parties need to sign a contract between each other, which either
can be done by signing a contract between all the parties involved or the main company
creating a master contract that involves all the participants. By having dealers creating
contracts between each other, there is a risk that different contracts are constructed – something
that in the end can causes negative effect on inventory sharing and the main company will not
be able to have control over the situation. In case of Volvo, it’s recommended that Volvo
creates a master contract with all dealers, due to the huge administration that other views would
be needed if all dealers within a group should sign a contract with each other. By creating a
master contract, Volvo either can add information to their already existing LPA contract or
create a new one. By creating the contract, Volvo is receiving power that could be used in
deciding that the dealer needs to sell the product to Volvo that in turn can sell it to the other
dealer, which can be a challenge in this concept since this can affect the willingness to send
parts from a dealer to another dealer. It should be noted that it can be a challenge when it
comes to pricing of parts, which can affect the dealers’ willingness to sell the part back to
Volvo when needed, at the price quoted by Volvo.
Regarding the contract, there are also some other legal aspects that need to be considered
depending on if the group is within the same country or not. Groups that exist within the same
country rely on the same national law, while in the cross border group there can be more
aspects concerning multiple national legislations that needs to be considered, (Basu Bal, 2016;
OECD, 2013). Due to the fact that Sweden and Norway have a good relationship with each
other, Volvo only needs to pay customs every time a truck cross the national border, but with
today's technology this can be handled electronically – which reduces that administration costs.
In other cases, if no trade agreement exists, and/or the legislation in the countries isn’t
harmonized and/or their national laws differ the sharing of inventory can be problematic (Basu
Bal, 2016; OECD, 2013).
77
As Braglia & Frosolini (2013) discussed the parties participating in an inventory sharing
concept also need to discuss how the costs should be divided between the parties. There are
different ways that this could be done, either by dividing all the costs, such as transportation
costs, holding inventory and the down-time costs, between all the participants, like Wong et al
(2007) suggested. In interviews made within this study it have been discussed that Volvo
should take the transportation costs, since this otherwise, will be an obstacle for the company to
get the dealers onboard with the new concept. Regarding the handling costs, this is something
that the dealer will need to take, as they already do today. But something that can be discussed
is whether it should be included in the transportation costs taken by Volvo. For some dealers
the holding costs will be higher, especially for those dealers that will act as a hub. That’s
another reason why the first scenario is recommended to dealers within larger ownership, since
they can divide the costs between each other. Depending on how the steering of inventory will
be in the end it doesn’t necessarily mean that dealers adapting the second scenario have to get a
higher holding costs, since they will divide the parts between each other. This is also something
that needs to be seen in relation to how the availability will increase at the dealers and the costs
they can save by quicker solving a problem and send a truck back on track.
To summarize, it can be stated that different challenges such as number of dealers within a
group, transaction, cost allocation, transportation solutions and responsibility exist when
creating groups with the purpose of sharing inventory by using one of the scenarios discussed
above. This indicates that before this setup can be implemented, it’s important for the main
company and the participants to discuss and clearly state how everything should be solved and
work in order to get this setup to work as efficient as possible.
5.3.2 Transportation network
To be able to achieve same day availability it isn’t just the groups and the scenarios that need
to be implemented but also new transportation networks needs to be developed. As Easley &
Kleinberg (2010) describes, a transportation network is a spatial network consisting of edges
and nodes, which in this case are dealers and roads. As described in the current process, Volvo
today uses different transportation networks depending on the order types. Regarding the stock
order, there will be no changes since these orders will not be included in the inventory sharing.
For the parts transferred with the D2D setup that will be collected within the new groups, new
transportation networks will be implemented in order to achieve same day availability and
increase the service at the dealers. Depending on the scenarios that are implemented to the
groups, two transport solutions from the three described in the literature above are
recommended as they suit the need:

78
For the first scenario, Single dealer level, it’s recommended that this group uses a
transportation network called hub and spoke. As O Ekárt et al (2011) describes, two types of
hub and spoke network exists, single allocation or multiple allocation and as discussed above
both are recommended for this scenario, depending on the number of dealers within a group,
due to the possibility to achieve same day availability but also due to the environmental
aspects. Even if the hub-and-spoke network is not seen as the most environmental friendly and
sustainable network, traffic congestions, air pollution and noise problem can be reduced by
having a smaller number of spokes within the network, which is the reason why it’s
recommended that Larger ownerships, like the red group in Sweden, uses multiple hubs and by
that reduce the effect on the environment. By using this transportation network, a symmetric
relationship between the nodes exist, meaning that the nodes will go from the hub to the dealer
and back, which can be referred to as an undirected graph (Easley & Kleinberg, 2010). An
asymmetric relationship can also be used in this network, by applying a milk run as a transport
solution, but to be able to do this the groups need to have less number of dealers compared to a
group that uses hub and spoke. If a Large ownership group wants to use milk run, it’s
recommended that the group is divided into smaller groups with multiple hubs (Easley &
Kleinberg, 2010).
For the second scenario, Group level, where all dealers carry some of the divided parts, it’s
recommended that a milk run is used as the transportation network. This implies that a truck
starts at one point in the network and goes to all the other points. It also involves that the
dealers that use this kind of network, need to stick to some cut off times in order to achieve the
spare part the same day. Something that could be seen as a problem, but due to the fact that
dealers today already are used to cut of times, this problem is consider to be small, and as Sadja
et al, (2009) describes, the milk run can be modeled according to the situation, which indicates
that the taxi/van/truck can start from different points each day, as well as skip some stops if it’s
not needed, which indicates that the system is flexible and it’s suitable for some of the groups.
For Volvo, milk run is a good transportation network to be used, due to the fact that it can
reduce both travel time and fuel consumption (Brar & Saini, 2011).
In case of an emergency, when the cut of time in the milk run network has passed or if no truck
is available from the hub, one solution is to order a taxi. This is something that both Volvo and
the dealers use today. It’s more expensive, but it needs to be related to the time it can save, the
stand still costs that affect the company and the service they can provide to the end customer.
As well as the fact that with the new groups and scenarios, the part will be maximum three and
a half hours away.

79
5.3.3 New dealer order process
The current dealer processes are more of a pull type process performed by the dealers. The
reason it’s a pull type process is because the dealers order only in case of emergencies when
the part is not available in their stock (Ramachandran et al, 2002). The stock orders are
different from this type of ordering process as they are pushed to the dealer’s inventory based
on their EOQ. By adapting the new scenarios, the dealer order process, will still be a pull type
of process when it comes day orders and VOR, but the step in the process will be reduced from
five to three steps, which can be seen in the Figure 23 below.
Figure 23: New dealer order process
The first step is, as in the old process, a basic step of locating the required parts within the
dealer's stock itself before proceeding to the next steps. This step is carried out with the help of
an IT system which should be a common system for all the dealers within the group. In the case
when no common IT system exists, it’s this a matter of legal requirements that need to be
handle before the setup of inventory sharing can exists, since it’s about company information
that will be transferred (Basu Bal, 2016).
The second step is that instead of searching for the parts in one of the three types of
warehouses located close to the market, is to search of the part within the new group. If the part
is available the dealer can order the part from the other dealer. As mentioned above the

80
transportation and transaction in this case will be handled by Volvo, meaning that the dealer
only is responsible for sending the part. By Volvo taking care of the transaction, the dealer that
search for the part can buy it from Volvo to the purchasing price. This is a way of how the cost
allocation issue, as discussed by Wong et al (2007) can be solved, in the inventory sharing
setup. By collecting the part from a dealer within the same group, will the service the dealer
can offer the end customer be improved, while Volvo will save money due to the reduction in
transportation cost.
The last step within the new scenario is that if the part is not available within the dealer's own
warehouse or within the group, they should contact Volvo. The dealer can either create a day
order, if not too urgent or a VOR. In the case of a VOR or a back order recovery, Volvo has the
opportunity to now act faster since they now can exclude other dealers that are closely located
to the dealer, since they already know that they dealer has searched within the group for the
part. Today Volvo doesn’t have information on whether the dealer has searched for the part or
not, which results in extra lead time.
5.4 Impact on availability after grouping dealers
The table below shows how the availability differs after using the grouping model for this case
study, of Sweden and Norway. It also shows the impacts from the regional and central
warehouse and the support warehouse in terms of availability and transportation. The
availability scenario for one week for the red dealer group, in the case study, was taken as a
sample and was analyzed to see what percentage of these emergency orders that can be solved
from the grouping process. The data was calculated by using the formula presented by Jonsson
& Mattsson (2009).

81
Table 4: Availability differences after using the grouping model on one group located in Sweden
In the case of the red group, the total number of VOR and day orders for one week was
calculated at the end of the week. These emergency orders were then checked for availability
within the red dealer group. To exemplify this better, it can be explained with the help of an
example of a part number XYZ, which was a VOR in dealer A belonging to the red group. The
availability of this part was then checked in the stock balance from the previous week for the
red group as a whole. If the part was available then it meant that the group itself could solve the
VOR and if the part wasn’t available within the group then a VOR or a day order would be
placed. The table shows this percentage of VOR and day orders of the total emergency orders,
which cannot be solved, from the group and therefore a VOR or day order has to be placed. In
a similar way this method was used to check for all the VOR and day orders and the percentage
of availability and unavailability is listed above.
The impact this grouping makes to the parts sourced from the central and support warehouse is
also shown above. From this impact it can be seen how the transportation will be impacted as
well. To exemplify this better; 57% from the total emergency orders placed at the central
warehouse are seen to be available in the red group which can be seen in the table above. This
therefore indicates that 57% of the transports from the central warehouse can be reduced which
is mainly air transport. This reduction will also therefore reduce 57% of the transport costs for
orders placed by the red group individually and not when part of a group. By being in a group
the transportation cost will reduce as the parts then need to be sourced from within the group

82
which will use road transport. The data shows the high availability that can be achieved by
grouping the dealers together in a group. From this data it can also be noted that this grouping
process will or does not solve all the VOR and day orders but will reduce these emergency
orders from the warehouses and in turn solve them within the groups created. Emergency
orders will still take place but the percentage of these emergency orders that needs to be solved
from outside the group will be much less, thereby reducing the overall management costs as
suggested by Kutanoglu, (2008). The grouping process is described as a strategic advantage
that can be used by the companies. This data also shows the percentage of orders sourced both
from the regional and central warehouse. From this data two things can be analyzed. The first
thing that can be seen from this is the difference in the percentage of orders that originate from
both these types of warehouses. It shows that most of these emergency orders can be solved by
the regional warehouse and therefore the remaining of only 21% of the orders need to be
sourced from outside the group. Moving to the orders which were solved by the central
warehouse, 57% of those orders were available within the red group. These figures also
indicate what percentage of transport could have been avoided and in turn be sourced from
dealers which are closer to each other. As we know from the current scenario, the mode of
transport used for these emergency requirements are express transports such as by air or by
expensive road transports which are customized as per the requirement. These lead to huge
costs in delivering the parts which can be avoided by grouping dealers and having faster and
cheaper transport setups.
The second table, table 5, shows the current counter availability and new availability for one
big group. From the figures presented in the table it can be seen and confirmed that there will
be a rise in availability for bigger ownership groups even with the same over the counter
availability of parts as it is today.
Table 5: The current and new availability for one large group in Sweden
The increase in the availability of emergency parts by merely grouping the dealers while still
keeping the same service level at the dealers can be seen from the table above. This clearly
shows the increase in the availability by using the D2D setup.
Dealer Group Dealers in the group Current counter availability New availability (Group)
Red Group 19 91,7 96,09

83
6 Conclusion
Having a high uptime service for vehicles is an important aspect for companies within the
manufacturing industry where aftermarket services are offered. High uptime of vehicles can
only be achieved by having an efficient availability solution for spare parts. This type of
service is provided by the company dealers who are the company’s’ face to the end customers.
It increases the importance of improving the availability at the different dealer locations. A
challenge that companies like Volvo Group always works with in order to improve the service
towards their end customers. This study’s main focus is on how availability can be improved
for a company, like Volvo Group, and how same day availability can be improved and
achieved. In order to succeed with this, a general model has been developed which includes a
number of steps that should be followed in order to create groups. These groups that can be
related to clusters, that are grouped together in order to help each other out in case of an
emergencies by being close to each other, in Volvo’s case, a maximum of four hours away.
This means that from a management perspective companies can improve their same day
availability by following all the steps in the model, creating groups that in a later step adapt the
concept of inventory pooling.
In order to achieve same day availability at dealers for a manufacturing company, there are
other aspects besides grouping dealers together, which include the logistical aspects that need
to be taken into consideration. To start with, for a manufacturing company to have same day
availability it is recommended that the company implements inventory pooling, meaning that
dealers within the group should be able to share inventory. Before this can be done, there exist
some challenges that needs to be discussed and concluded by different parts, including the
main company and the dealers, such as legal aspects, transaction, pick and pack of parts and
transportation solution in order to avoid any future conflicts. In this study, two scenarios have
been developed in order to enable part sharing between dealers. The first scenario, called
Single dealer level, is based on the fact that one node within a group should act as a hub,
carrying parts for the other dealers in the group. To be able to succeed within this it is
recommended that a hub and spoke network is used as a transport solution, or if the group can
be divided into smaller groups or if multiple hubs are used, then a milk run can also be applied.
The second scenario, called the Group level, is based on the concept that the slow moving or
exotic parts range is equally distributed among all the dealers in the group. To be able to have
same day availability it is recommended that a milk run is used as the transportation network.

84
Figure 24: The present and the new setup
As can be seen in figure 24 above where X% depicts the total end customer demand, the
percentage difference in VOR/day orders is a comparative difference, which can be seen
between the two setups. D2D setup covers a part of the emergency orders today which can also
be seen from the graph above. By using the D2D concept, different groups can be created that
could apply one of the scenarios together with a transport solution, which will improve the
same day availability both from a management and logistical point of view, which is presented
in the study. From this concept, transportation costs as well as the impact from unwanted
transport can also be reduced on the environment. As Volvo Group is known for its
contribution towards sustainability, this process will add to the company’s endeavor in being
an environmental friendly company by reducing the impact it causes from the services it
provides.

85
6.1 Recommendation
After conducting this study, it’s recommended that Volvo Group uses the general model to
create groups with the purpose of improving the same day availability of spare parts to their
dealers. By using the model, depending on the structure of the markets, different groups will be
created that can apply either of the scenarios. Depending on the construction of the groups,
together with one of the scenarios and with one of the recommended transport solutions, the
company’s availability as well as service will increase in turn reducing the transportation costs.
Regarding the different challenges that exist within the company, it’s recommended from a
legal aspect that Volvo creates a master contract, in order to have control over the situation and
also the possibility to have the same contract with all groups. It’s also recommended that Volvo
takes care of the transactions for the parts, by buying back the parts and selling them to the
dealers, while the transportation goes from one dealer to another. By using this method, Volvo
can decide the price that the dealer pays and by that problems regarding unfair treatment can be
avoided.
Regarding the transportation, it’s recommended that Volvo takes care of the transportation
which means that they arrange and pay for the transportation. This is due to the fact, which has
been presented earlier, that will increase the chances of a dealer’s participation in the D2D
concept. Another reason why this is suggested as a recommendation is because Volvo today
already takes care of the transportation, which is expensive due to express transport solutions
used. This can be replaced by Volvo taking care of transportation between dealers, which are
four hours away from each other and also at shorter distances. It also is better for the
environment since the air transport, with this set up will be reduced.
6.2 Limitations
The general model developed in the study has been developed from literature and current
research. While it is possible to implement the suggested grouping model for Volvo, the
general model outlines the method, however there can be limitations to when and where it can
be implemented. Creating groups that involves dealers in different nations may be harder due
to political and legal aspects, as well as cultural and infrastructural aspects. Another limitation
in the study is that the calculation that showed the improved availability was only done on one
dealer group in the case study. However, it’s reasonable to assume that grouping dealer based
on the general model will improve the availability.

86
6.3 Future study
This study has focused on how the availability of spare parts at dealers can be improved by
grouping dealers together. In the study only one case study has been conducted and for future
studies, it would be interesting to see how the model can be applied to other markets and
companies. It would also be interesting to see in the future, if a new technology can improve
the two scenarios that have been developed, together with the two transportation solutions that
have been presented.
In future studies, it would also be a good idea to use telematics for better management of parts
distribution between dealers. It is believed that telematics can completely reduce emergency
orders as the company or the dealerships will get information of the part that will be required
prior to its requirement which will allow proper planning to solve such cases. It will also be
interesting to study the possibility of using 3D printing for the aftermarket services, which can
reduce the unwanted transports and in turn solve the emergencies on site.

87
7 References
An, Y., Zhang, Y., & Zeng, B. 2011, 'The reliable hub-and-spoke design problem: Models and
algorithms'. Optimization Online.
An, Y., Zeng, B., Zhang, Y. & Zhao, L. 2014, 'Reliable p-median facility location problem:
two-stage robust models and algorithms, Transportation Research Part B: Methodological, vol.
64, pp. 54-72.
Anand, N. & Grover, N. 2015, 'Measuring retail supply chain performance: Theoretical model
using key performance indicators (KPIs)', Benchmarking, vol. 22, no. 1, pp. 135.
Ballou, R.H. & Burnetas, A. 2003, 'Planning multiple location inventories', Journal of Business
Logistics, vol. 24, no. 2, pp. 65.
Ballou, R.H., Gilbert, S.M. and Mukherjee, A. 2000, 'New managerial challenges from supply
chain opportunities', Industrial Marketing Management, Vol. 29 No. 1, pp. 7-18.
Basu Bal A. 2016, 'Knowledge sharing'.
Baudin, M. 2005, 'Lean logistics: the nuts and bolts of delivering materials and goods'. CRC
Press.
Boccaletti, S., Latora, V., Moreno, Y., Chavez, M. & Hwang, D. 2006, 'Complex networks:
Structure and dynamics', Physics Reports, vol. 424, no. 4, pp. 175-308.
Bowersox, D. J., Closs, D. J., & Cooper, M. B. 2002, 'Supply chain logistics management'
(Vol. 2). New York, NY: McGraw-Hill.
Braglia, M. & Frosolini, M. 2013, 'Virtual pooled inventories for equipment-intensive
industries. An implementation in a paper district', Reliability Engineering & System Safety,
vol. 112, pp. 26-37.
Brar, G.S. & Saini, G. 2011, 'Milk Run Logistics: Literature Review and Directions', Lecture
Notes in Engineering and Computer Science, vol. 2190, no. 1, pp. 797-801.
Bryman, A. & Bell, E. 2011, Business research methods, 3.th edn, Oxford University Press,
Oxford.
Cohen, M. Agrawal, N. & Agrawal, V. 2006, 'Winning the Aftermarket'. Harvard Business
Review. Boston: Harvard Business School Press

88
Collis, J. & Hussey, R. 2014, 'Business research: a practical guide for undergraduate &
postgraduate students', 4thition. edn, Palgrave Macmillan, Basingstoke
DHL, (2008). DHL Discover Logistic. https://www.dhl-
discoverlogistics.com/cms/en/course/management/logistical_net_plan/flow.jsp Viewed: 2016-
03-07
Ducruet, C., & Lugo, I. 2013, 'Structure and dynamics of transportation networks: Models,
methods and applications'. The SAGE handbook of transport studies.
Easley, D., & Kleinberg, J. 2010, 'Networks, crowds, and markets: Reasoning about a highly
connected world'. Cambridge University Press.
Gastner, M.T. & Newman, M.E.J. 2006, 'The spatial structure of networks', The European
Physical Journal B, vol. 49, no. 2, pp. 247-252.
Graph theory 2013, 1st edn, Oxford University Press.
Gopal, P.R. and Thakkar, J. 2012, 'A review on supply chain performance measures and
metrics:2000-2011', International Journal of Productivity and Performance Management, Vol.
61 No. 5, pp. 518-547.
Gunasekaran, A., Patel, C. and Tirtiroglu, E. 2001, 'Performance measures and metrics in a
supply chain environment', International Journal of Operations & Production Management,
Vol. 21 No. 1, pp. 71-87.
Hitachi, (2012) 'Smart logistic solution: the milk run concept'. http://www.hitachitransport-
eu.com/english/general/blog/smart-logistics-solution-the-milk-run-concept Viewed: 2016-03-
03
Hoffman, D. 2004, 'The Hierarchy of Supply Chain Metrics: Diagnosing your Supply Chain
Health', AMR Research, Boston, MA.
Jones, R.M. and Towill, D.R. 1997, 'Information enrichment: designing the supply chain for
competitive advantage', Supply Chain Management: An International Journal, Vol. 2 No. 4,pp.
137-148.
Jones, K. 2001, 'Planning for aftermarket supply chain'. MSI, 19, 32-34.
Jonsson, P. & Mattsson, S. 2009, 'Manufacturing planning and control ', McGraw-Hill
Education, London.

89
Klein, B. 1996, ‘Market Power in Aftermarkets’, Managerial and decision economics, vol. 17,
pp. 143 – 164.
KPMG (2011), Issues Monitor: Sharing Knowledge on Topical Issues in Retail Industry, Vol
10, KPGM, Amstelveen, July.
Kutanoglu, E. 2008, 'Insights into inventory sharing in service parts logistics systems with
time-based service levels', Computers & Industrial Engineering, vol. 54, no. 3, pp. 341-358.
Lee, H.L. 1987, 'A Multi-Echelon Inventory Model for Repairable Items with Emergency
Lateral Transshipments', Management Science, vol. 33, no. 10, pp. 1302-1316.
Lim, M., Daskin, M.S., Bassamboo, A. & Chopra, S. 2009, 'A facility reliability problem:
Formulation, properties, and algorithm', Naval Research Logistics, , pp. NA.
Lin Y., and Cha C., 2010, 'Inventory–Transportation Integrated Optimization Based on Milk
Run Model', International Conference on E-Business and E-Environment, pp. 3372 – 3376.
Liu, J., Li, C. & Chan, C. 2003, "Mixed truck delivery systems with both hub-and-spoke and
direct shipment", Transportation Research Part E, vol. 39, no. 4, pp. 325-339.
Maheswaram G & Rakesh Gopal C.2012, 'Increasing importance of Aftermarket Parts',
Miebach Consulting India Pvt. LTD
Martin, H., Syntetos, A. A., Paraodi, A., Polychronakis, Y. E. & Pintelon, L.2010, 'Integrating
the spare parts supply chain: an inter-disciplinary account'. Journal of Manufacturing
Technology Management, 21, 236-245.
Mourtzis, D, Doukas, M, & Psarommatis, F 2015, 'A toolbox for the design, planning and
operation of manufacturing networks in a mass customisation environment', Journal Of
Manufacturing Systems, 36, pp. 274-286, Business Source Premier, EBSCOhost
o Ekárt, A., Buckingham, C., & Welch, P. G. 2011, 'Multiple-participant hub-and-spoke
logistics networks: Challenges, solutions and limits'. Proc. of the 13th Int. Conf. on Modern
Information Technology in the Innovation Processes of Industrial Enterprises MITIP 2011
OECD (2013) Regions and Innovation: Collaborating across Borders, OECD Reviews of
Regional Innovation, OECD Publishing. Avialable:
Https://dx.doi.org/10.1787/9789264205307-en Viewed: 2016-04-01
Oracle (2016) Spatial Topology and Network Data Models Developer’s Guide.
Available:https://docs.oracle.com/cd/B28359_01/appdev.111/b28399/sdo_net_concepts.htm
Viewed: 2016-02-22

90
Rajaguru, R. and Matanda, M.J. 2009, 'Influence of inter-organisational integration on business
performance: the mediating role of organisational-level supply chain functions', Journal of
Enterprise Information Management, Vol. 22 No. 4, pp. 456-467.
Ramachandran, K., Whitman, L. and Ramachandran, A.B., 2002, 'Criteria for determining the
push-pull boundary'. In IIE Annual Conference. Proceedings (p. 1). Institute of Industrial
Engineers-Publisher.
Raman, A., DeHoratius, N. and Ton, Z. 2001, 'The achilles heel of supply chain management',
Harvard Business Review, pp. 136-152.
Rodrigue, J.P., Slack, B. and Comtois, C., 2001, Green logistics (the paradoxes of). The
Handbook of Logistics and Supply-Chain Management, 2.
Rozenblat, C., Melançon, G. & SpringerLink (Online service) 2013, Methods for Multilevel
Analysis and Visualisation of Geographical Networks: Elektronisk resurs, Springer
Netherlands, Dordrecht.
Saccani, Ni. Johansson, P. & Person, N. 2007, 'Configuring the after-sales service supply
chain: A multiple case study'. International Journal of Production Economics, 110, 52-69
Sadjadi, S.J., Jafari, M. and Amini, T., 2009, 'A new mathematical modeling and a genetic
algorithm search for milk run problem (an auto industry supply chain case study) '. The
International Journal of Advanced Manufacturing Technology, 44(1-2), pp.194-200.
.
Shepherd, C. and Gunter, H. 2006, 'Measuring supply chain performance: current research and
future directions', International journal of Productivity and Performance Measurement, Vol. 55
Nos 3/4, pp. 242-258
Shapiro, J.F. 2007, Modeling the supply chain, 2.th edn, Thomson Brooks/Cole, Belmont, Calif
Simchi-Levi, D., Simchi-Levi, E. & Kaminsky, P. 2007, Designing and managing the supply
chain: concepts, strategies, and case studies, 3.th edn, McGraw-Hill, Boston, Mass.
SpatialTEQ, Inc (2016) Welcome to Map Business Online.
https://www.mapbusinessonline.com/map-business-online.aspx/About-Map-Business-Online
viewed: 2016-04-05
Volvo Group (2015) Annual and sustainability report 2014
http://www.volvogroup.com/group/global/engb/investors/reports/annual_reports/Pages/annual_
reports.aspx Viewed: 2016-02-15

91
Volvo Group (2016a) Parts Disitribution. http://www.volvogroup.com/GROUP/GLOBAL/EN-
GB/PRODUCTSANDSERVICES/LOGISTICSSOLUTIONS/PARTSDISTRIBUTION/PAGE
S/DEFAULT.ASPX Viewed: 2016-02-15
Volvo Group (2016b) A global group. http://www.volvogroup.com/group/global/en-
gb/volvo%20group/Pages/aboutus.aspx viewed:2016-03-29
Volvo Group (2016c) Volvo Group organization. http://www.volvogroup.com/group/global/en-
gb/volvo%20group/our%20companies/Pages/business_structure.aspxviewed:2016-03-29
Volvo Grpup (2016d) Brands .http://www.volvogroup.com/group/global/en-
gb/whatwedo/our_brand/Pages/brands.aspx#sthash.Iq718ykx.dpuf viewed: 2016-05-06
Wong, H., Oudheusden, D.V. & Cattrysse, D. 2007, 'Cost allocation in spare parts inventory
pooling ', Transportation Research Part E, vol. 43, no. 4, pp. 370-386
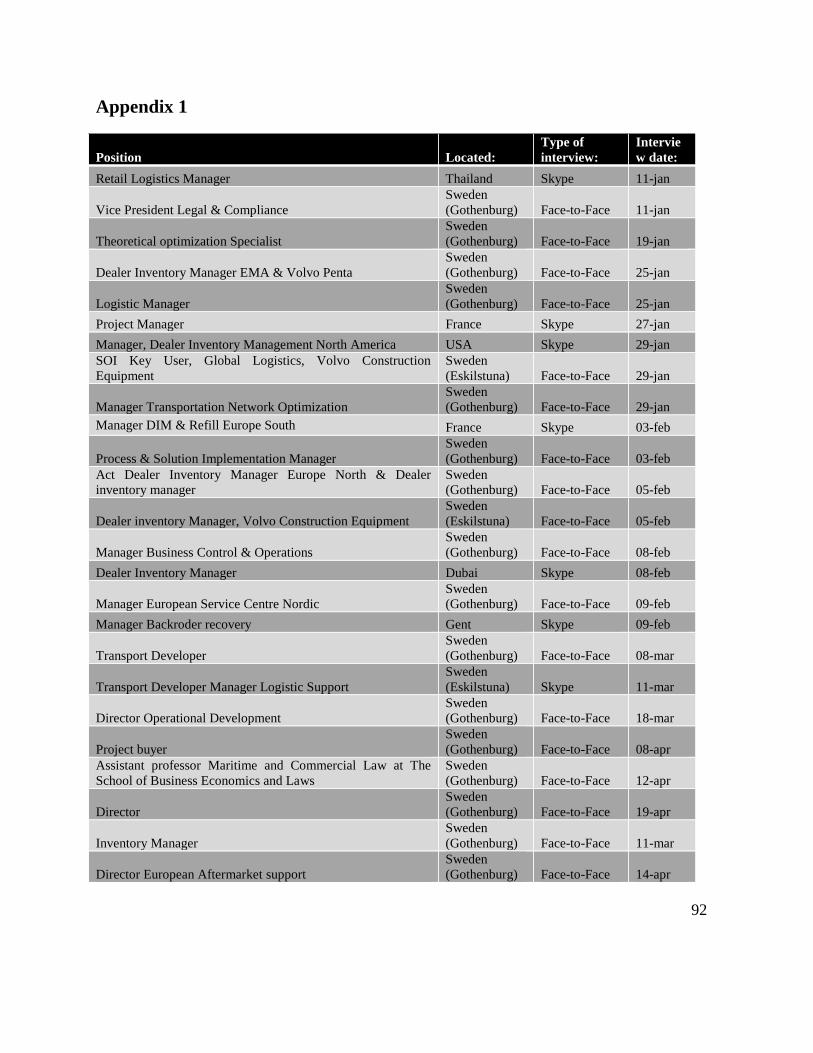
92
Appendix 1
Position Located:
Type of
interview:
Intervie
w date:
Retail Logistics Manager Thailand Skype 11-jan
Vice President Legal & Compliance
Sweden
(Gothenburg) Face-to-Face 11-jan
Theoretical optimization Specialist
Sweden
(Gothenburg) Face-to-Face 19-jan
Dealer Inventory Manager EMA & Volvo Penta
Sweden
(Gothenburg) Face-to-Face 25-jan
Logistic Manager
Sweden
(Gothenburg) Face-to-Face 25-jan
Project Manager France Skype 27-jan
Manager, Dealer Inventory Management North America USA Skype 29-jan
SOI Key User, Global Logistics, Volvo Construction
Equipment
Sweden
(Eskilstuna) Face-to-Face 29-jan
Manager Transportation Network Optimization
Sweden
(Gothenburg) Face-to-Face 29-jan
Manager DIM & Refill Europe South France Skype 03-feb
Process & Solution Implementation Manager
Sweden
(Gothenburg) Face-to-Face 03-feb
Act Dealer Inventory Manager Europe North & Dealer
inventory manager
Sweden
(Gothenburg) Face-to-Face 05-feb
Dealer inventory Manager, Volvo Construction Equipment
Sweden
(Eskilstuna) Face-to-Face 05-feb
Manager Business Control & Operations
Sweden
(Gothenburg) Face-to-Face 08-feb
Dealer Inventory Manager Dubai Skype 08-feb
Manager European Service Centre Nordic
Sweden
(Gothenburg) Face-to-Face 09-feb
Manager Backroder recovery Gent Skype 09-feb
Transport Developer
Sweden
(Gothenburg) Face-to-Face 08-mar
Transport Developer Manager Logistic Support
Sweden
(Eskilstuna) Skype 11-mar
Director Operational Development
Sweden
(Gothenburg) Face-to-Face 18-mar
Project buyer
Sweden
(Gothenburg) Face-to-Face 08-apr
Assistant professor Maritime and Commercial Law at The
School of Business Economics and Laws
Sweden
(Gothenburg) Face-to-Face 12-apr
Director
Sweden
(Gothenburg) Face-to-Face 19-apr
Inventory Manager
Sweden
(Gothenburg) Face-to-Face 11-mar
Director European Aftermarket support
Sweden
(Gothenburg) Face-to-Face 14-apr
Top Related