


Languages
Pages
Legal

SAGE Academy 2014/2015 Worlds Best Workforce Report & Annual Report on Curriculum, Instruction and Student Achievement
1
SAGE Academy Secondary Charter School
Students Achieving Global Excellence
DISTRICT 4087
World’s Best Workforce Report &
Annual Report on Curriculum,
Instruction and Student Achievement
SAGE Academy 2014/2015 Worlds Best Workforce Report & Annual Report on Curriculum, Instruction and Student Achievement
2
INTRODUCTION
SAGE Academy is a Minnesota charter school authorized by Novation Education
Opportunities. SAGE opened its doors to students in September 2002 and completed its
Thirteenth year of operation in June 2015. SAGE Academy is a project and
expeditionary based high school, serving students in grades nine through twelve.
Enrollment for SAGE was 89 students in fall on October 1, 2014, and had an enrollment
of 87 students on the last day of school, June 5, 2015.
SAGE Academy is a high school with a project-‐based educational delivery
Model. Its teachers serve as advisors to the students, assisting them in incorporating
content into projects. The school curriculum was designed around the former
Minnesota Profiles of Learning and SAGE continues to focus its instruction on the MDE
required standards as the central framework for content and educational delivery. The
new State standards were integrated into the school’s curriculum during the 2003/2004
school year (for content areas where State standards exist). In addition to integrating
the State’s standards, the school presents an approach to learning that focuses on four
areas:
1. How to learn.
2. How to think critically.
3. How to problem solve.
4. How to teach others.
The above standards are the cornerstones of the school’s educational approach and are
integrated into the project-‐based learning model used at SAGE. The approach was
researched prior to the school’s opening and SAGE was designed with the above
standards in mind. SAGE focuses on an individualized approach to learning. Each
student completes a Multiple Intelligences inventory, which gives SAGE administrative
staff a tool to recognize and enhance the individual strengths of each student.
SAGE utilizes an accountability plan that was developed during the school’s first year of
operation and revised during the 2003/2004 school year. The revised plan has been
SAGE Academy 2014/2015 Worlds Best Workforce Report & Annual Report on Curriculum, Instruction and Student Achievement
3
used to assess the school’s progress toward meeting student outcomes in five major
areas: 1) Academic Achievement, 2) Citizenship, 3) Social and Personal Development, 4)
Lifelong Learning, and 5) Satisfaction. The requirements of both the Minnesota
Department of Education and the school’s sponsor are integrated into the plan and the
report.
FOCUS OF THE REPORT
This annual report summarizes the data elements required by the Minnesota
Department of Education, the school’s sponsor, and results from the school’s
accountability initiative. Data presented in this report are from the school’s eleventh
year of operation. Comparisons are made between cohorts of students who were
enrolled in the school for more than one year and, when appropriate, between SAGE
Academy students and national comparison groups.
SAGE ACADEMY MISSION STATEMENT SAGE Academy’s mission statement reads:
SAGE Academy seeks to develop a community of reflective learners of academic
excellence who actively promote tolerance, respect, and understanding as citizens of
the world. SAGE Academy is a student-centered educational setting providing life
preparedness for a global community and global environment.
SAGE has a written vision statement that explains core beliefs and the manner in which
the beliefs are implemented. SAGE Academy vision statement reads:
The school’s vision is to “provide an academic environment of excellence for secondary
students which encourages life-long learning; respect for a diverse, global community;
awareness of the earth’s limited resources; and understanding of social justice issues
throughout the world—To promote active participation of students as citizens of the
world and to offer multiple and diverse opportunities for leadership in team dynamics
and problem-solving experience.”

SAGE Academy 2014/2015 Worlds Best Workforce Report & Annual Report on Curriculum, Instruction and Student Achievement
4
SAGE ACADEMY SPONSOR INFORMATION SAGE Academy is authorized by Novation Education Opportunities. The school was
initially sponsored in 2011 for a one-‐year contract. . In the spring of 2012, following an
intensive review by NEO, the charter was renewed for a four-‐year term.
The sponsor’s relationship with the school has been supportive and positive.
Representatives of SAGE Academy are required to report annual curriculum and
financial status through the Annual Report and Board documentation.
Authorizer Liaison and Contact.
Novation Education Opportunities (NEO)
Wendy Swanson Choi, Executive Director
3432 Denmark Avenue Suite 130 Eagan, MN 55123
Email: [email protected]
Tele: 612.889.2103
www.novationeducationopportunities.org
STUDENT BACKGROUND/DEMOGRAPHICS
Characteristics
The majority of SAGE students reside in suburban Minneapolis. Some students
previously attended K-‐8 charter schools; others enrolled directly from a large school
district. The characteristics of the school’s student population have changed throughout
SAGE Academy’s nine years of operation. The table below reflects changes for the past
five years.
SAGE Academy 2014/2015 Worlds Best Workforce Report & Annual Report on Curriculum, Instruction and Student Achievement
5
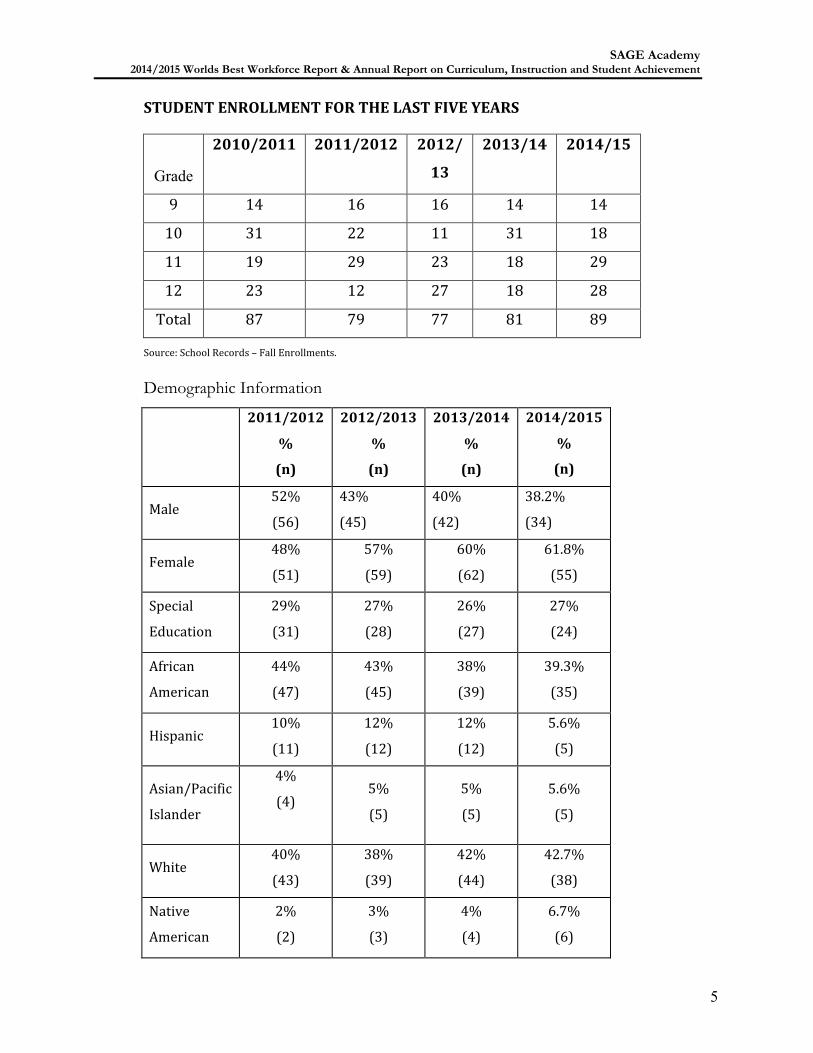
STUDENT ENROLLMENT FOR THE LAST FIVE YEARS
Grade
2010/2011 2011/2012 2012/
13
2013/14 2014/15
9 14 16 16 14 14
10 31 22 11 31 18
11 19 29 23 18 29
12 23 12 27 18 28
Total 87 79 77 81 89
Source: School Records – Fall Enrollments.
Demographic Information
2011/2012
%
(n)
2012/2013
%
(n)
2013/2014
%
(n)
2014/2015
%
(n)
Male 52%
(56)
43%
(45)
40%
(42)
38.2%
(34)
Female 48%
(51)
57%
(59)
60%
(62)
61.8%
(55)
Special
Education
29%
(31)
27%
(28)
26%
(27)
27%
(24)
African
American
44%
(47)
43%
(45)
38%
(39)
39.3%
(35)
Hispanic 10%
(11)
12%
(12)
12%
(12)
5.6%
(5)
Asian/Pacific
Islander
4%
(4)
5%
(5)
5%
(5)
5.6%
(5)
White 40%
(43)
38%
(39)
42%
(44)
42.7%
(38)
Native
American
2%
(2)
3%
(3)
4%
(4)
6.7%
(6)
SAGE Academy 2014/2015 Worlds Best Workforce Report & Annual Report on Curriculum, Instruction and Student Achievement
6
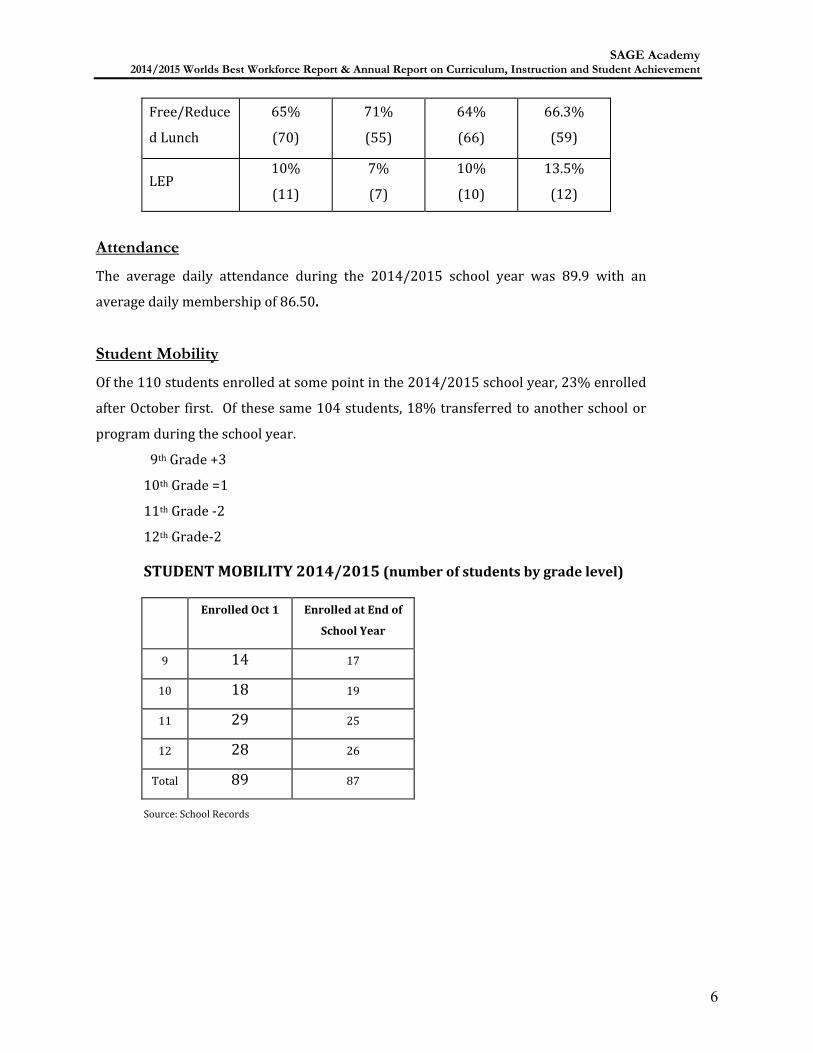
Free/Reduce
d Lunch
65%
(70)
71%
(55)
64%
(66)
66.3%
(59)
LEP 10%
(11)
7%
(7)
10%
(10)
13.5%
(12)
Attendance
The average daily attendance during the 2014/2015 school year was 89.9 with an
average daily membership of 86.50.
Student Mobility
Of the 110 students enrolled at some point in the 2014/2015 school year, 23% enrolled
after October first. Of these same 104 students, 18% transferred to another school or
program during the school year.
9th Grade +3
10th Grade =1
11th Grade -‐2
12th Grade-‐2
STUDENT MOBILITY 2014/2015 (number of students by grade level)
Enrolled Oct 1 Enrolled at End of
School Year
9 14 17
10 18 19
11 29 25
12 28 26
Total 89 87
Source: School Records
SAGE Academy 2014/2015 Worlds Best Workforce Report & Annual Report on Curriculum, Instruction and Student Achievement
7
Graduation Rates/Post-secondary Enrollment
Of twenty-‐eight seniors who were enrolled at some point during the 2014/2015 school year,
Twenty students graduated, two students transferred out of SAGE before the end of the school year,
and three didn’t finish the required work to graduate. And have returned to SAGE for another year.
Also three foreign exchange students returned home. So at the end of the year we had a total
number twenty of a possible twenty-‐three students graduate. These are the future plans of our
graduates. Colleges: Saint Cloud State University (1) North Hennepin Community College (8) International Colleges (2) Hennepin Technical College (3) Anoka-Ramsey Community College (1) Century (1) Minneapolis Community & Technical College (1) Arts Institute International (2) Job Corp (2) Yoga Training (1)
POST-SECONDARY ENROLLMENT
Teachers reported a high percentage of students demonstrating positive Lifelong
Learning skills (e.g. self-‐initiative, using skills to educate others). The rate of graduate
enrollment in post-‐secondary institutions was 96%. This came in above the school’s
90% goal. There was a part-‐time career educator on staff for the 2014/2015 school
year.
A four-‐year College and Career Counseling Plan has been implemented and an Honors
Senior Advisory has been added to the regular Project Based curriculum. Honor seniors
are encouraged to engage in PSEO classes and high-‐level mentorships or internships
their senior year.
GOVERNANCE A Board of Directors governs the school. The Board’s purpose is to promote effective
education for students at SAGE Academy Charter School with attention to the areas of
curriculum, staffing, policy formulation, community involvement, home-‐school
communication, budget, and other appropriate matters affecting the well being of the
school. The Board’s decisions govern the school and the actions of its employees.
Membership on the Board is in accord with Minnesota law.

SAGE Academy 2014/2015 Worlds Best Workforce Report & Annual Report on Curriculum, Instruction and Student Achievement
8
Below is the list of board members for the 2014/2015 school year.
NAME POSITION AFFILIATION
CONTACT TERM Status of Basic Training
Meeting Attendance for 2014-15
Diane Scholten
Ex officio Admin 763-420-4973 [email protected]
On-going Completed Present 100%
Jeff Heidenreich
Vice Chair Community 608-347-6684 2 years Completed Missed Dec. Feb. April June
Josh Bickert Treasurer Teacher 763-315-4020
[email protected] 1 year Completed
Missed Oct. Gwen Gemeinder
Chair Community 651-336-3142 2 year Completed Present 100%
Steven Martinez-Grande
Member Community 651-788-0399 2 years Completed Missed May
Marilyn Thompson
Member Teacher 763-420-4973 [email protected]
1 years Completed
Present 100% Cari- Ana Luna Garcia
Secretary Teacher 763-315-4020 [email protected]
2 years Completed Missed May
Georgia Afton
Member Community
2 years Completed Missed. Aug Nov. Dec. May June
Lorrie Semmelink
Business Manager Non voting
Business Manager 763-315-4020
On-going NA Present 100%
Sue Colgrove
Member Parent
763-913-8921 2 years
Completed Missed Feb.
Diane Scholten is an Ex officio of the board. Diane is one of SAGE Academy’s founders
and serves as Administrative director of SAGE Academy.
Jeff Heidenreich serves as Vice Chair. He previously worked at SAGE Academy as a math
teacher and not sits on the board as a community member.
Josh Bickert is the physical education teacher/ Dean of students/ advisor at SAGE
Academy. He has been at SAGE Academy eleven years and has served on the board for
eight years. He serves as the Treasurer of the Board.
Gwen Gemeinder is our Board Chair. She serves as a community member and works for
the University of Minnesota.
Steven Martinez-‐Grande is a community member on our board. He is a full time student.

SAGE Academy 2014/2015 Worlds Best Workforce Report & Annual Report on Curriculum, Instruction and Student Achievement
9
Marilyn Thompson is also a founder of SAGE Academy. She serves on the board as a
teacher. She is also SAGE’s Program Director. She has been serving on SAGE’s board for
13 years.
Cari-‐Ana Luna Garcia serves the board as a teacher. She is the social studies teacher and
advisor at SAGE Academy.
Georgia Afton serves our board as a community member. She is a social worker.
Sue Colgrove serves our board as a parent of one of our students.
MANAGEMENT Administrative responsibilities of SAGE Academy are facilitated via a collaborative team
model. Members of the leadership team are as follows.
Diane Scholten Administrative Director
Marilyn Thompson Program Director
Joshua Bickert Dean of Students
Ms. Scholten and Ms. Thompson have program and supervisory duties, including
observations of and feedback to staff. Ms. Scholten has a current administrative license;
her File Folder Number is 261905 and her license has been renewed until 06/30/2017.
Ms. Thompson has a BA in English from UNI, 12 graduate credits in English, Psychology
& Remedial Reading from UNI and a Master of Arts Degree in Educational Psychology
from St. Thomas University. She has seven years of Human Relations Facilitation &
Training as well as Leadership Development from working within the Waterloo, Iowa,
and Public School System. She also completed a two-‐week training in Neuro-‐
Psychological & Cognitive Learning Strategies at the University of North Carolina,
Chapel Hill under Dr. Mel Levine. She served on the Middle School Guidance Committee
& Administrative Team at Breck School, which centered on cognitive & affective support
for students. She was on staff for the Rimm National Conference, a nationally recognized
institute for at-‐risk students. She has presented at the Hopkins Educational Conference
on Strategies for Achievement as well as the state conference for the Learning
Disabilities of Minnesota where she was recipient of the Professional Excellence Award.
As a founder of SAGE Academy Charter School, Ms. Thompson has led numerous
workshops, including Heidi Hayes design for backward mapping, Instruction by Design

SAGE Academy 2014/2015 Worlds Best Workforce Report & Annual Report on Curriculum, Instruction and Student Achievement
10
by Jay McTighe and Restorative Justice Processes/Circle Learning. Ms. Thompson is
responsible for providing curricular support to teachers, coordinating staff
development and completing growth/goal setting processes with the licensed staff.
Marilyn’s professional development plans for this upcoming year include: participation
in differentiated learning workshops, NWEA testing workshops, and MDE training in
teacher evaluations, part 1 and part 2.
Mr. Bickert graduated from the University of Northern Iowa with a BA in physical
education and coaching. He completed his college degree in three years and has been
working for SAGE Academy since 2004. Mr. Bickert is in charge of the schools
expedition program, school discipline, district assessment coordinator, advisor, and
physical education classes. In 2007, Mr. Bickert was named an outstanding teacher by
Sylvan Learning Center for helping students outside of his school schedule. This year
marks the seventh year of Mr. Bickert being the Dean of Students. Mr. Bickert’s plans for
continuing professional development include leading a NWEA training for the entire
SAGE Academy staff, continuing service as Board Treasurer, Special education
workshops, serving as a mentor for three other staff members, and the continuation of
being a teacher/advisor/dean of students.
STAFFING SAGE Academy employed nine licensed teachers for the 2014/2015 school year. Three
of the teachers formed the administrative team sharing administrative and teaching
duties. This was the eleventh year of this type of administrative arrangement. The
administrative team held positions with responsibilities in the areas of administration,
student service coordination, and directing the overall school program. SAGE Academy
also employed an administrative assistant, part time technology assistant, a part time
choir/music director, a part time nurse/clerical paraprofessional, a part time business
manager, a part time special education paraprofessional, and a part time lunch
coordinator.
Staff development focused on the following themes for the 14/15 school year: 1)
Reading – improving reading scores for our students; 2) Multiple Intelligences and Life
Skills; 3) Project Development & Enhancement; 4) Service Learning.

SAGE Academy 2014/2015 Worlds Best Workforce Report & Annual Report on Curriculum, Instruction and Student Achievement
11
Joshua Bickert led a session on NWEA testing and strategies for classrooms in teaching
all students. In-‐house task forces (learning communities) focused on project rubric
evaluation and enhancement, expeditions, service group improvements, and over-‐all
policies to improve respect and behavioral issues at SAGE. Staff development and
implementation is based upon the strategic plan and is evaluated at the beginning of the
school year, re-‐evaluated mid-‐year, as well as in May at a week long staff development
planning session.
SAGE Academy 2014/2015 Worlds Best Workforce Report & Annual Report on Curriculum, Instruction and Student Achievement
12
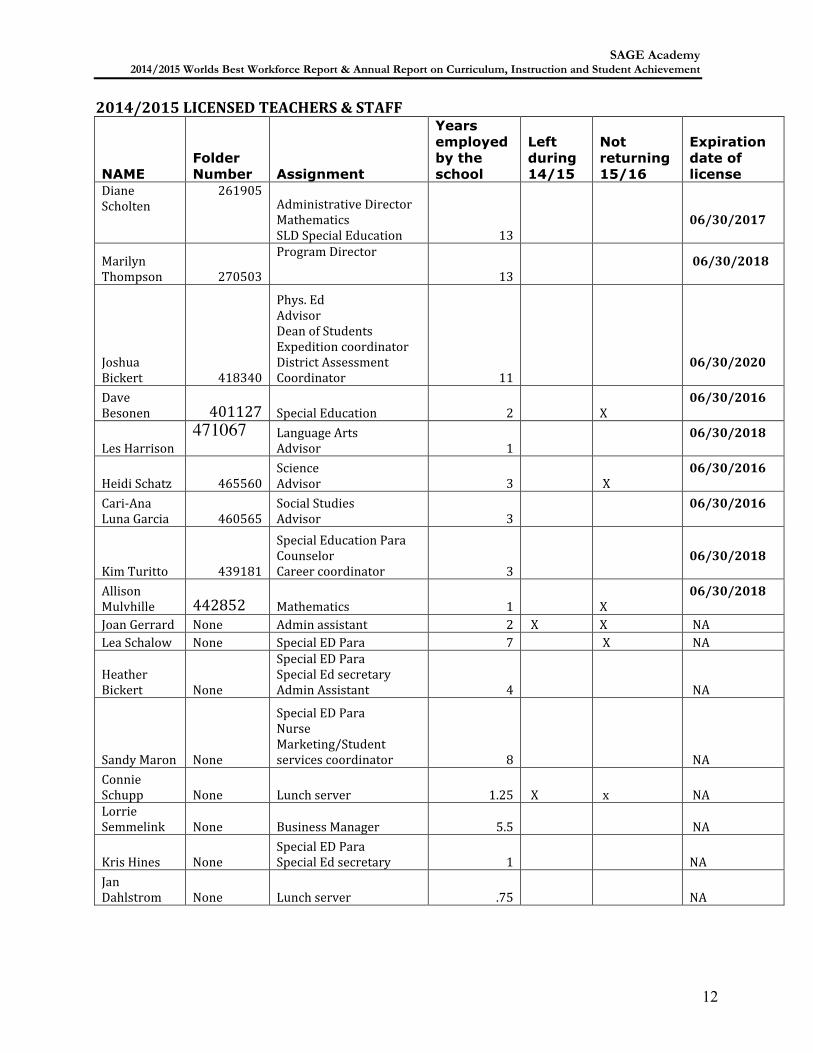
2014/2015 LICENSED TEACHERS & STAFF
NAME Folder Number Assignment
Years employed by the school
Left during 14/15
Not returning 15/16
Expiration date of license
Diane Scholten
261905 Administrative Director Mathematics SLD Special Education 13
06/30/2017
Marilyn Thompson 270503
Program Director
13 06/30/2018
Joshua Bickert 418340
Phys. Ed Advisor Dean of Students Expedition coordinator District Assessment Coordinator 11
06/30/2020
Dave Besonen 401127 Special Education 2 X
06/30/2016
Les Harrison 471067
Language Arts Advisor 1
06/30/2018
Heidi Schatz 465560 Science Advisor 3 X
06/30/2016
Cari-‐Ana Luna Garcia 460565
Social Studies Advisor 3
06/30/2016
Kim Turitto 439181
Special Education Para Counselor Career coordinator 3
06/30/2018
Allison Mulvhille 442852 Mathematics 1 X
06/30/2018
Joan Gerrard None Admin assistant 2 X X NA Lea Schalow None Special ED Para 7 X NA
Heather Bickert None
Special ED Para Special Ed secretary Admin Assistant 4 NA
Sandy Maron None
Special ED Para Nurse Marketing/Student services coordinator 8 NA
Connie Schupp None Lunch server 1.25 X x NA Lorrie Semmelink None Business Manager 5.5 NA
Kris Hines None Special ED Para Special Ed secretary 1 NA
Jan Dahlstrom None Lunch server .75 NA

SAGE Academy 2014/2015 Worlds Best Workforce Report & Annual Report on Curriculum, Instruction and Student Achievement
13
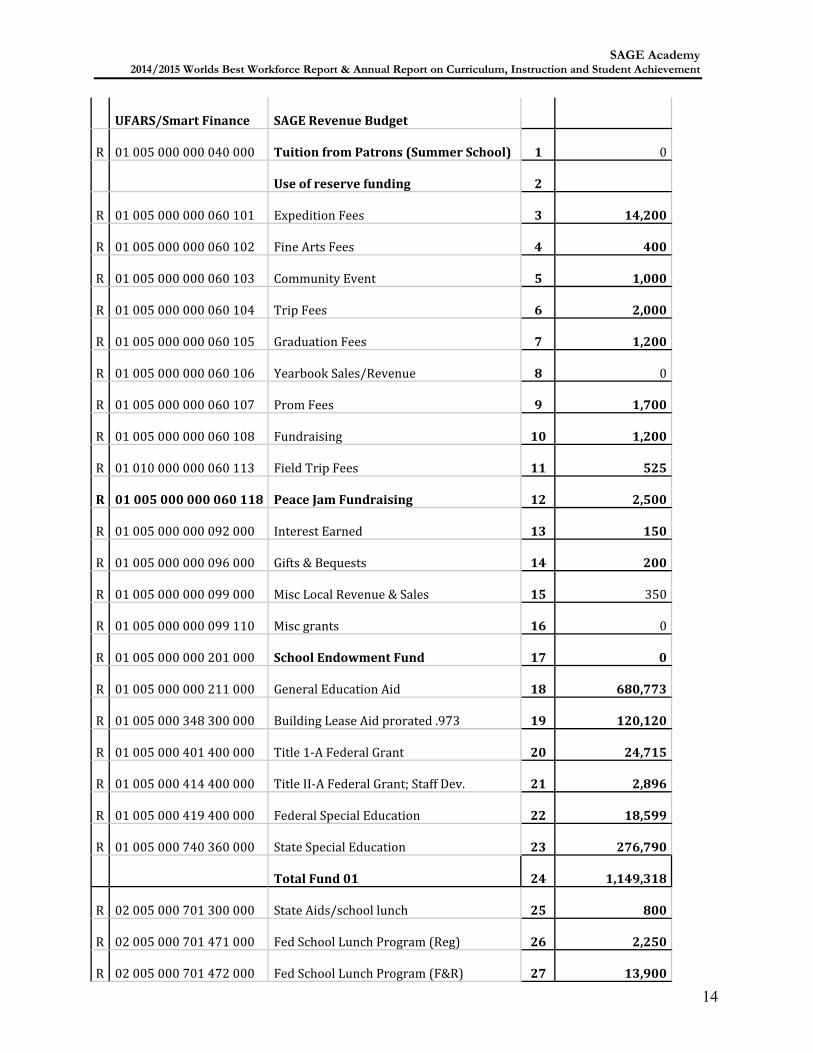
FINANCE Below we have our in depth financial records from the previous two years.
Approved 2014 Budget passed 6/13/13
SAGE FY14 Budget SAGE 9-‐12 Students Based on 77 ADM
Passed 6/13/13 FY14
SAGE Academy 2014/2015 Worlds Best Workforce Report & Annual Report on Curriculum, Instruction and Student Achievement
14
UFARS/Smart Finance SAGE Revenue Budget
R 01 005 000 000 040 000 Tuition from Patrons (Summer School) 1 0
Use of reserve funding 2
R 01 005 000 000 060 101 Expedition Fees 3 14,200
R 01 005 000 000 060 102 Fine Arts Fees 4 400
R 01 005 000 000 060 103 Community Event 5 1,000
R 01 005 000 000 060 104 Trip Fees 6 2,000
R 01 005 000 000 060 105 Graduation Fees 7 1,200
R 01 005 000 000 060 106 Yearbook Sales/Revenue 8 0
R 01 005 000 000 060 107 Prom Fees 9 1,700
R 01 005 000 000 060 108 Fundraising 10 1,200
R 01 010 000 000 060 113 Field Trip Fees 11 525
R 01 005 000 000 060 118 Peace Jam Fundraising 12 2,500
R 01 005 000 000 092 000 Interest Earned 13 150
R 01 005 000 000 096 000 Gifts & Bequests 14 200
R 01 005 000 000 099 000 Misc Local Revenue & Sales 15 350
R 01 005 000 000 099 110 Misc grants 16 0
R 01 005 000 000 201 000 School Endowment Fund 17 0
R 01 005 000 000 211 000 General Education Aid 18 680,773
R 01 005 000 348 300 000 Building Lease Aid prorated .973 19 120,120
R 01 005 000 401 400 000 Title 1-‐A Federal Grant 20 24,715
R 01 005 000 414 400 000 Title II-‐A Federal Grant; Staff Dev. 21 2,896
R 01 005 000 419 400 000 Federal Special Education 22 18,599
R 01 005 000 740 360 000 State Special Education 23 276,790
Total Fund 01 24 1,149,318
R 02 005 000 701 300 000 State Aids/school lunch 25 800
R 02 005 000 701 471 000 Fed School Lunch Program (Reg) 26 2,250
R 02 005 000 701 472 000 Fed School Lunch Program (F&R) 27 13,900
SAGE Academy 2014/2015 Worlds Best Workforce Report & Annual Report on Curriculum, Instruction and Student Achievement
15
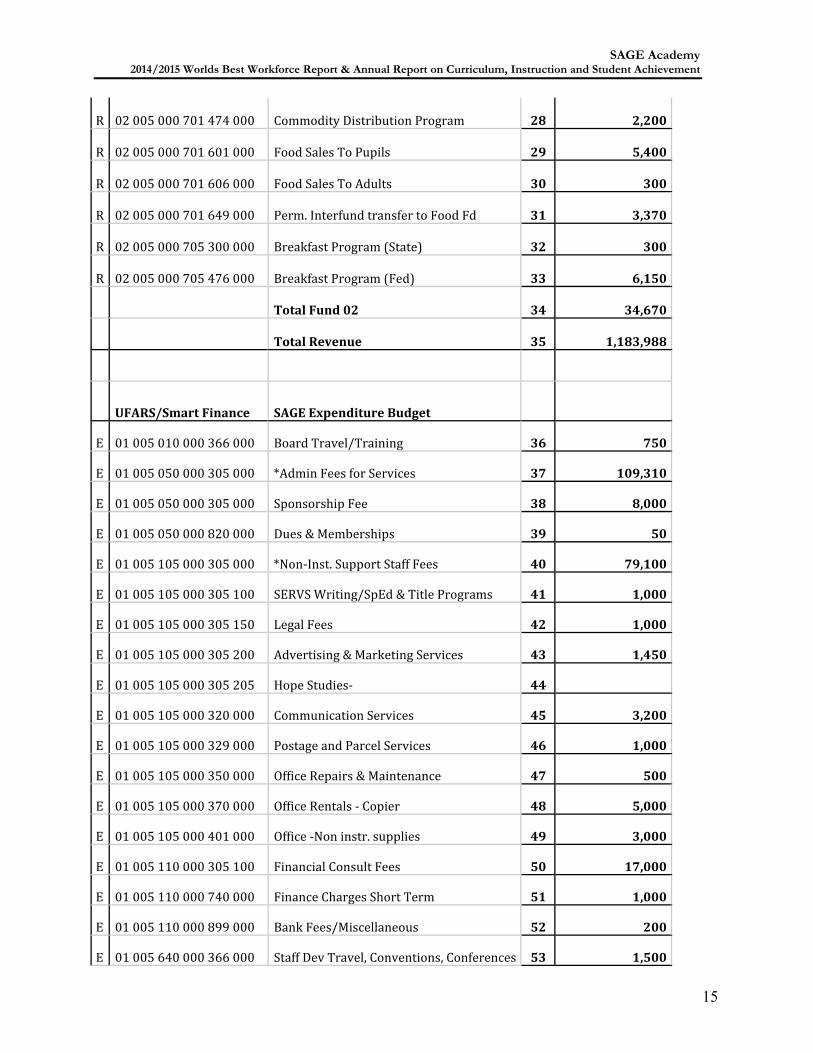
R 02 005 000 701 474 000 Commodity Distribution Program 28 2,200
R 02 005 000 701 601 000 Food Sales To Pupils 29 5,400
R 02 005 000 701 606 000 Food Sales To Adults 30 300
R 02 005 000 701 649 000 Perm. Interfund transfer to Food Fd 31 3,370
R 02 005 000 705 300 000 Breakfast Program (State) 32 300
R 02 005 000 705 476 000 Breakfast Program (Fed) 33 6,150
Total Fund 02 34 34,670
Total Revenue 35 1,183,988
UFARS/Smart Finance SAGE Expenditure Budget
E 01 005 010 000 366 000 Board Travel/Training 36 750
E 01 005 050 000 305 000 *Admin Fees for Services 37 109,310
E 01 005 050 000 305 000 Sponsorship Fee 38 8,000
E 01 005 050 000 820 000 Dues & Memberships 39 50
E 01 005 105 000 305 000 *Non-‐Inst. Support Staff Fees 40 79,100
E 01 005 105 000 305 100 SERVS Writing/SpEd & Title Programs 41 1,000
E 01 005 105 000 305 150 Legal Fees 42 1,000
E 01 005 105 000 305 200 Advertising & Marketing Services 43 1,450
E 01 005 105 000 305 205 Hope Studies-‐ 44
E 01 005 105 000 320 000 Communication Services 45 3,200
E 01 005 105 000 329 000 Postage and Parcel Services 46 1,000
E 01 005 105 000 350 000 Office Repairs & Maintenance 47 500
E 01 005 105 000 370 000 Office Rentals -‐ Copier 48 5,000
E 01 005 105 000 401 000 Office -‐Non instr. supplies 49 3,000
E 01 005 110 000 305 100 Financial Consult Fees 50 17,000
E 01 005 110 000 740 000 Finance Charges Short Term 51 1,000
E 01 005 110 000 899 000 Bank Fees/Miscellaneous 52 200
E 01 005 640 000 366 000 Staff Dev Travel, Conventions, Conferences 53 1,500
SAGE Academy 2014/2015 Worlds Best Workforce Report & Annual Report on Curriculum, Instruction and Student Achievement
16
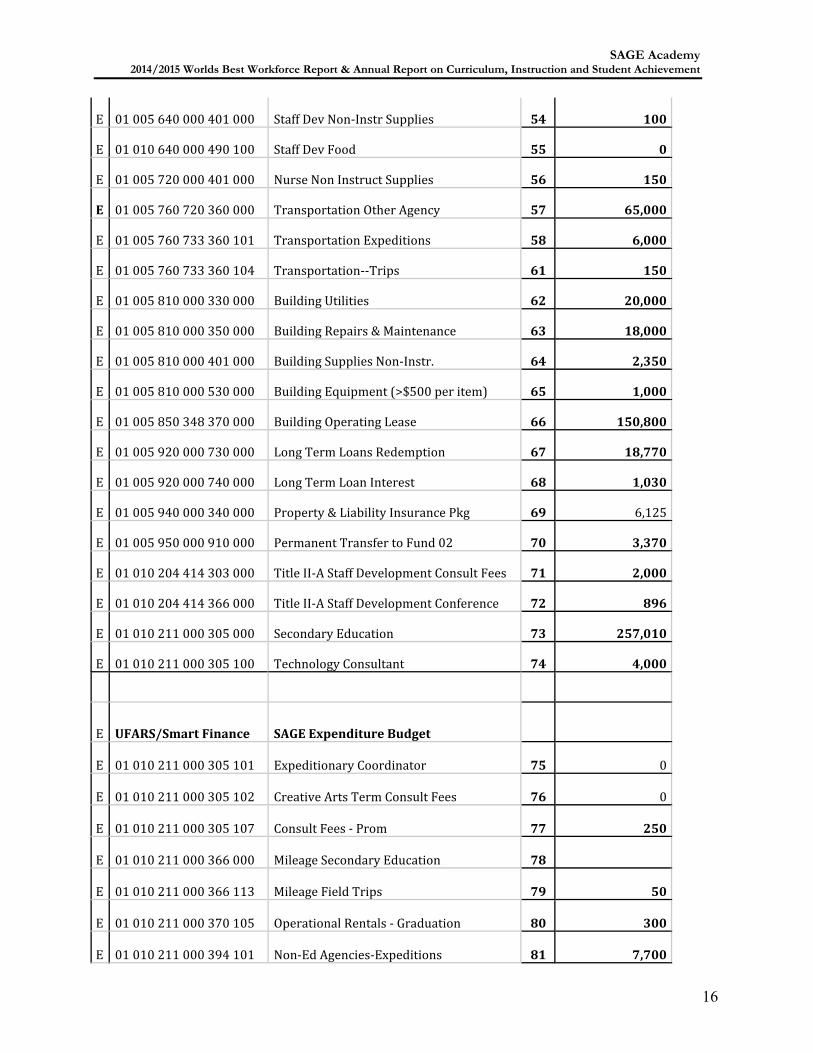
E 01 005 640 000 401 000 Staff Dev Non-‐Instr Supplies 54 100
E 01 010 640 000 490 100 Staff Dev Food 55 0
E 01 005 720 000 401 000 Nurse Non Instruct Supplies 56 150
E 01 005 760 720 360 000 Transportation Other Agency 57 65,000
E 01 005 760 733 360 101 Transportation Expeditions 58 6,000
E 01 005 760 733 360 104 Transportation-‐-‐Trips 61 150
E 01 005 810 000 330 000 Building Utilities 62 20,000
E 01 005 810 000 350 000 Building Repairs & Maintenance 63 18,000
E 01 005 810 000 401 000 Building Supplies Non-‐Instr. 64 2,350
E 01 005 810 000 530 000 Building Equipment (>$500 per item) 65 1,000
E 01 005 850 348 370 000 Building Operating Lease 66 150,800
E 01 005 920 000 730 000 Long Term Loans Redemption 67 18,770
E 01 005 920 000 740 000 Long Term Loan Interest 68 1,030
E 01 005 940 000 340 000 Property & Liability Insurance Pkg 69 6,125
E 01 005 950 000 910 000 Permanent Transfer to Fund 02 70 3,370
E 01 010 204 414 303 000 Title II-‐A Staff Development Consult Fees 71 2,000
E 01 010 204 414 366 000 Title II-‐A Staff Development Conference 72 896
E 01 010 211 000 305 000 Secondary Education 73 257,010
E 01 010 211 000 305 100 Technology Consultant 74 4,000
E UFARS/Smart Finance SAGE Expenditure Budget
E 01 010 211 000 305 101 Expeditionary Coordinator 75 0
E 01 010 211 000 305 102 Creative Arts Term Consult Fees 76 0
E 01 010 211 000 305 107 Consult Fees -‐ Prom 77 250
E 01 010 211 000 366 000 Mileage Secondary Education 78
E 01 010 211 000 366 113 Mileage Field Trips 79 50
E 01 010 211 000 370 105 Operational Rentals -‐ Graduation 80 300
E 01 010 211 000 394 101 Non-‐Ed Agencies-‐Expeditions 81 7,700
SAGE Academy 2014/2015 Worlds Best Workforce Report & Annual Report on Curriculum, Instruction and Student Achievement
17
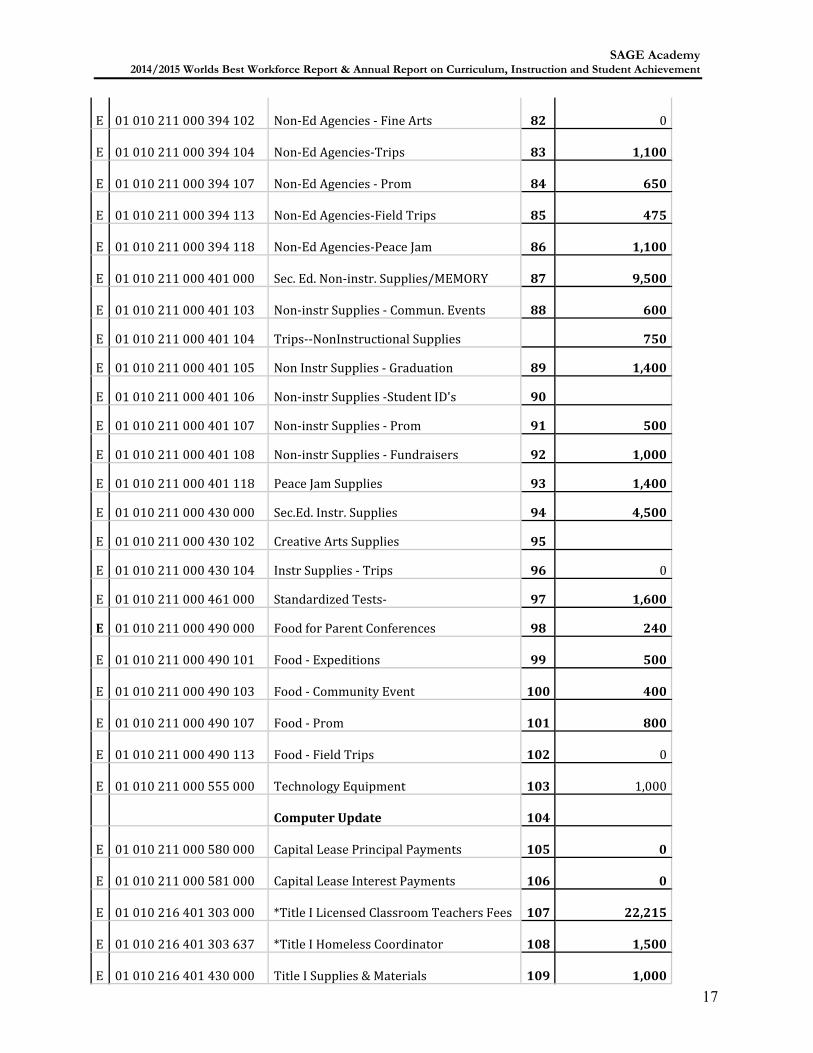
E 01 010 211 000 394 102 Non-‐Ed Agencies -‐ Fine Arts 82 0
E 01 010 211 000 394 104 Non-‐Ed Agencies-‐Trips 83 1,100
E 01 010 211 000 394 107 Non-‐Ed Agencies -‐ Prom 84 650
E 01 010 211 000 394 113 Non-‐Ed Agencies-‐Field Trips 85 475
E 01 010 211 000 394 118 Non-‐Ed Agencies-‐Peace Jam 86 1,100
E 01 010 211 000 401 000 Sec. Ed. Non-‐instr. Supplies/MEMORY 87 9,500
E 01 010 211 000 401 103 Non-‐instr Supplies -‐ Commun. Events 88 600
E 01 010 211 000 401 104 Trips-‐-‐NonInstructional Supplies 750
E 01 010 211 000 401 105 Non Instr Supplies -‐ Graduation 89 1,400
E 01 010 211 000 401 106 Non-‐instr Supplies -‐Student ID's 90
E 01 010 211 000 401 107 Non-‐instr Supplies -‐ Prom 91 500
E 01 010 211 000 401 108 Non-‐instr Supplies -‐ Fundraisers 92 1,000
E 01 010 211 000 401 118 Peace Jam Supplies 93 1,400
E 01 010 211 000 430 000 Sec.Ed. Instr. Supplies 94 4,500
E 01 010 211 000 430 102 Creative Arts Supplies 95
E 01 010 211 000 430 104 Instr Supplies -‐ Trips 96 0
E 01 010 211 000 461 000 Standardized Tests-‐ 97 1,600
E 01 010 211 000 490 000 Food for Parent Conferences 98 240
E 01 010 211 000 490 101 Food -‐ Expeditions 99 500
E 01 010 211 000 490 103 Food -‐ Community Event 100 400
E 01 010 211 000 490 107 Food -‐ Prom 101 800
E 01 010 211 000 490 113 Food -‐ Field Trips 102 0
E 01 010 211 000 555 000 Technology Equipment 103 1,000
Computer Update 104
E 01 010 211 000 580 000 Capital Lease Principal Payments 105 0
E 01 010 211 000 581 000 Capital Lease Interest Payments 106 0
E 01 010 216 401 303 000 *Title I Licensed Classroom Teachers Fees 107 22,215
E 01 010 216 401 303 637 *Title I Homeless Coordinator 108 1,500
E 01 010 216 401 430 000 Title I Supplies & Materials 109 1,000

SAGE Academy 2014/2015 Worlds Best Workforce Report & Annual Report on Curriculum, Instruction and Student Achievement
18
E 01 010 294 000 820 000 Boys' Athletics Dues & Membership 110 300
E 01 010 296 000 820 000 Girls' Athletics Dues & Membership 111 300
E UFARS/Smart Finance SAGE Expenditure Budget
E 01 010 401 740 394 000 *Sp Ed Speech Therapist-‐-‐State 112 7,000
E 01 010 407 740 394 000 *Sp Ed SLD Consult Fees 50% 113 32,720
E 01 010 408 740 394 000 *SpEd EBD Consult Fees 25% 114 16,360
E 01 010 410 740 394 000 *Sp Ed OHD Consult Fees 20% 115 13,090
E 01 010 411 740 394 000 *Sp Ed ASD Consult Fees 5% 116 3,270
E 01 010 420 740 394 300 Sp Ed Consult Fees -‐ Consultant 117 4,000
E 01 010 420 419 303 000 Sp Ed Consult Fees -‐ ISES 118 10,850
E 01 010 420 419 366 000 Sp Ed Conferences & Travel 119 0
E 01 010 420 740 394 300 Sp Ed School Psychologist-‐-‐State 120 3,250
E 01 010 420 419 401 000 Sp Ed Non-‐Instruct Supplies 121 4,000
E 01 010 420 419 433 000 Sp Ed Indiv. Instr. Materials 122 3,099
E 01 010 420 419 555 000 Sp Ed Tech Equipment 123 650
E 01 010 420 740 394 000 *Sp Ed Consult Fees (Para) 124 158,620
E 01 010 420 740 394 335 SpEd Counselor 125 38,480
Total Fund 01 Expenditures 126 1,146,330
Net Fund 01 Revenue (Expense) 127 2,988
UFARS/Smart Finance SAGE Expenditure Budget
E 02 005 770 701 305 000 *Food Service Fee for Lunch Svc 128 5,000
E 02 005 770 705 305 000 *Food Service Fee for Breakfast Svc 129 860
E 02 005 770 701 401 000 Food Service Supplies 130 1,000
E 02 005 770 705 490 000 Breakfast Food 131 4,000
E 02 005 770 701 490 000 Lunch Food 132 23,200
E 02 005 770 701 491 000 Commodities 133 2,200

SAGE Academy 2014/2015 Worlds Best Workforce Report & Annual Report on Curriculum, Instruction and Student Achievement
19
E 02 005 770 701 820 000 Licenses for Food Service 134 270
E 02 005 770 707 899 000 Miscellaneous: late fees 135 0
Total Fund 02 Expenditures 136 36,530
Net Fund 02 Revenue (Expense) 137 (1,860)
Net per fund: Fund 01 General Education Net 138 2,988
Fund 02 Food Net 139 (1,860)
Total Bottom Line 140 1,128
Payroll Total (Total) 141 737,535
Reg Ed Payroll 142 474,995
SpEd Payroll 143 $262,540.00 Areas of concern for our budget: Every year SAGE Academy has to pay the property taxes on the
building. The cost of this is between $49000-‐$50000 yearly. This is SAGE’s largest concern and a
facilities committee has been formed on the board of directors to look into the possibility of finding
a new building. The other areas of concern are the food programs. The lunch program always has a
negative balance and money must be transferred from the general fund to the lunch fund. SAGE
Academy has looked into finding cheaper supplies as well as working on a system to get a more
accurate lunch count.
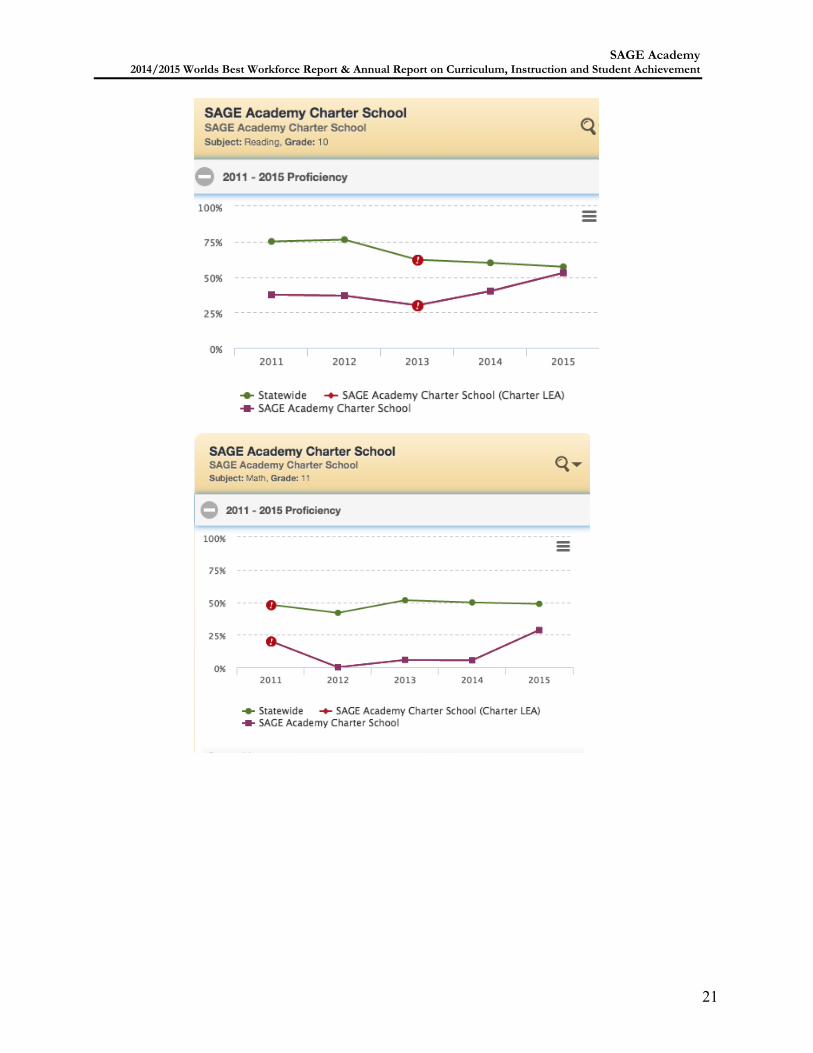
ACADEMIC PERFORMANCE Test Percent who passed Year
MCA Reading 30 2013
40 2014
53 2015
MCA Math 5.6 2013
5.3 2014
28.5 2015
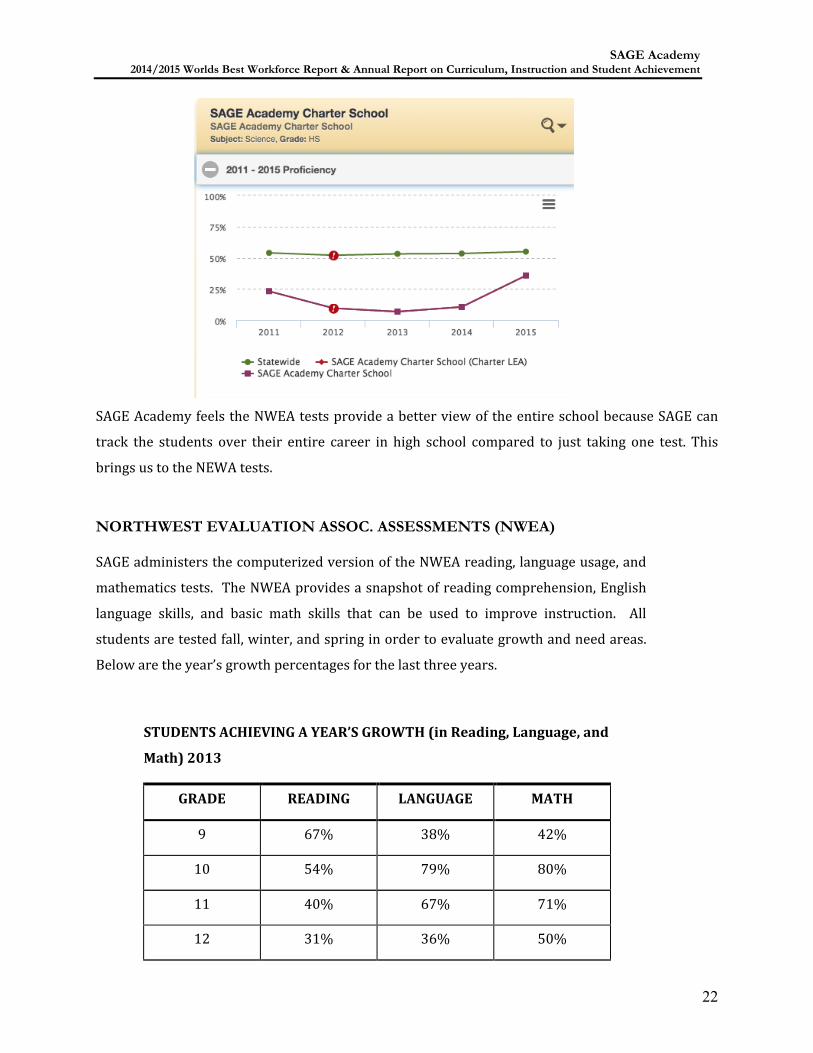
MCA Science 10.5 2013
6.7 2014
35.7 2015

SAGE Academy 2014/2015 Worlds Best Workforce Report & Annual Report on Curriculum, Instruction and Student Achievement
20
The large percentage of students who enter SAGE during the school year, often in tenth, eleventh,
and twelfth grade, who have huge gaps in math and reading skills, greatly affects the over-‐all gains
or lack of gains as demonstrated on the standardized testing data. SAGE offers five levels of math,
from Pre-‐Algebra through Pre-‐Calculus and meets students at their individual performance levels.
Many students have not completed Algebra before taking the MCA math test and, therefore, their
performance is greatly affected.
o SAGE Academy Goal #1: Students will improve their skills in Reading as shown by
progress on MCA-‐II tests: The proportion of students who meet Proficient in
Reading will increase from 40% from 2014, to at least 48% for 2015.
o SAGE Academy Goal #2: Students will improve their skills in Mathematics as shown
on MCA-‐II tests: The proportion of students who meet proficient Targets in
Mathematics will increase from 5.3% for 2014 to at least 15% for 2015.
SAGE ACADEMY MET BOTH OF THESE GOALS.
SAGE Academy 2014/2015 Worlds Best Workforce Report & Annual Report on Curriculum, Instruction and Student Achievement
21
SAGE Academy 2014/2015 Worlds Best Workforce Report & Annual Report on Curriculum, Instruction and Student Achievement
22
SAGE Academy feels the NWEA tests provide a better view of the entire school because SAGE can
track the students over their entire career in high school compared to just taking one test. This
brings us to the NEWA tests.
NORTHWEST EVALUATION ASSOC. ASSESSMENTS (NWEA)
SAGE administers the computerized version of the NWEA reading, language usage, and
mathematics tests. The NWEA provides a snapshot of reading comprehension, English
language skills, and basic math skills that can be used to improve instruction. All
students are tested fall, winter, and spring in order to evaluate growth and need areas.
Below are the year’s growth percentages for the last three years.
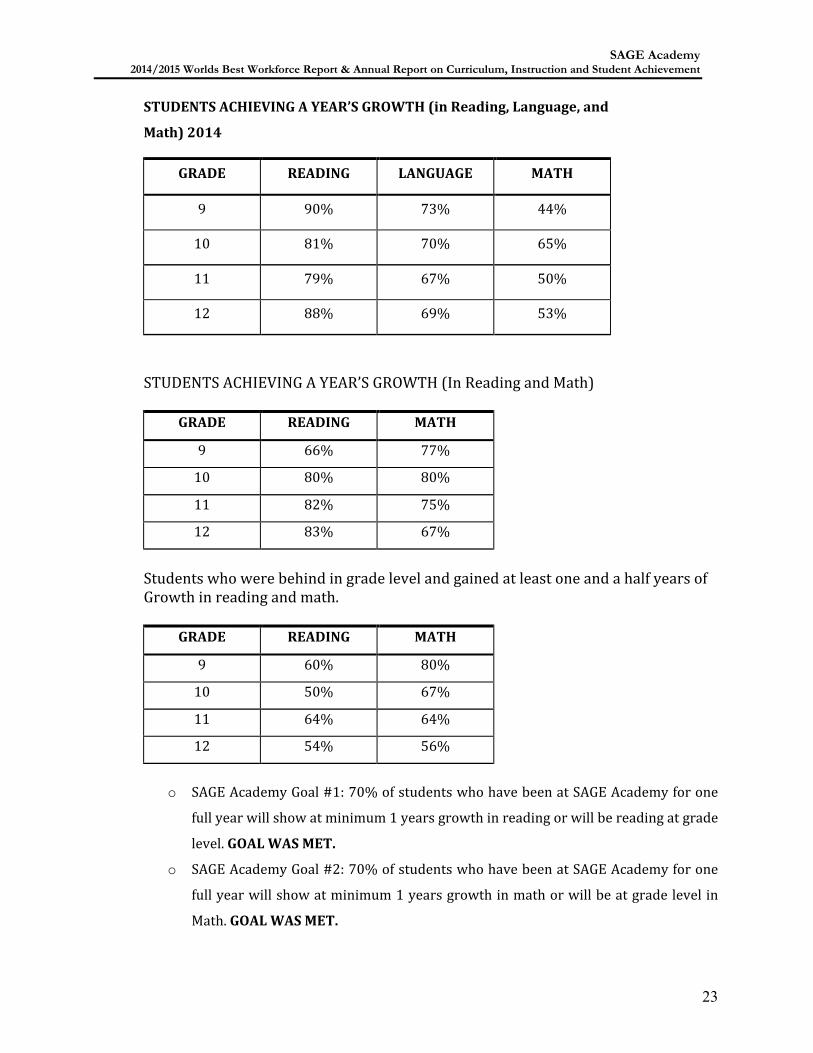
STUDENTS ACHIEVING A YEAR’S GROWTH (in Reading, Language, and
Math) 2013
GRADE READING LANGUAGE MATH
9 67% 38% 42%
10 54% 79% 80%
11 40% 67% 71%
12 31% 36% 50%
SAGE Academy 2014/2015 Worlds Best Workforce Report & Annual Report on Curriculum, Instruction and Student Achievement
23
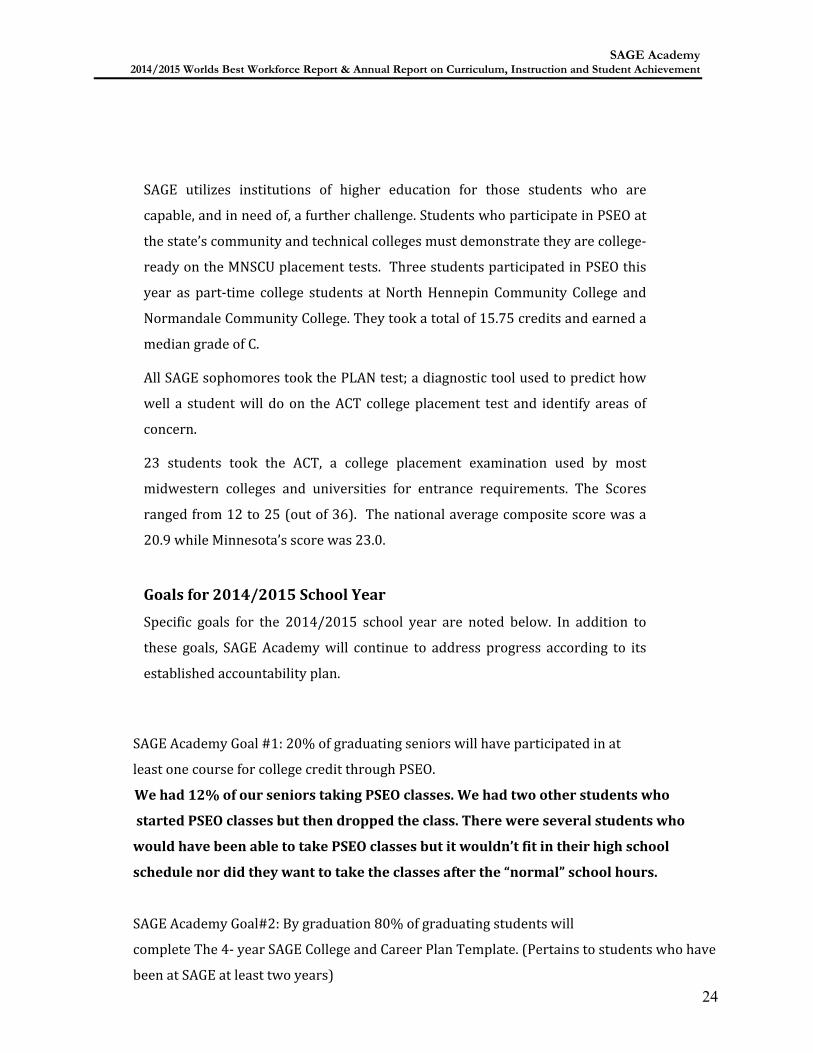
STUDENTS ACHIEVING A YEAR’S GROWTH (in Reading, Language, and
Math) 2014
GRADE READING LANGUAGE MATH
9 90% 73% 44%
10 81% 70% 65%
11 79% 67% 50%
12 88% 69% 53%
STUDENTS ACHIEVING A YEAR’S GROWTH (In Reading and Math)
GRADE READING MATH
9 66% 77%
10 80% 80%
11 82% 75%
12 83% 67%
Students who were behind in grade level and gained at least one and a half years of
Growth in reading and math.
GRADE READING MATH
9 60% 80%
10 50% 67%
11 64% 64%
12 54% 56%
o SAGE Academy Goal #1: 70% of students who have been at SAGE Academy for one
full year will show at minimum 1 years growth in reading or will be reading at grade
level. GOAL WAS MET.
o SAGE Academy Goal #2: 70% of students who have been at SAGE Academy for one
full year will show at minimum 1 years growth in math or will be at grade level in
Math. GOAL WAS MET.
SAGE Academy 2014/2015 Worlds Best Workforce Report & Annual Report on Curriculum, Instruction and Student Achievement
24
SAGE utilizes institutions of higher education for those students who are
capable, and in need of, a further challenge. Students who participate in PSEO at
the state’s community and technical colleges must demonstrate they are college-‐
ready on the MNSCU placement tests. Three students participated in PSEO this
year as part-‐time college students at North Hennepin Community College and
Normandale Community College. They took a total of 15.75 credits and earned a
median grade of C.
All SAGE sophomores took the PLAN test; a diagnostic tool used to predict how
well a student will do on the ACT college placement test and identify areas of
concern.
23 students took the ACT, a college placement examination used by most
midwestern colleges and universities for entrance requirements. The Scores
ranged from 12 to 25 (out of 36). The national average composite score was a
20.9 while Minnesota’s score was 23.0.
Goals for 2014/2015 School Year
Specific goals for the 2014/2015 school year are noted below. In addition to
these goals, SAGE Academy will continue to address progress according to its
established accountability plan.
SAGE Academy Goal #1: 20% of graduating seniors will have participated in at
least one course for college credit through PSEO.
We had 12% of our seniors taking PSEO classes. We had two other students who
started PSEO classes but then dropped the class. There were several students who
would have been able to take PSEO classes but it wouldn’t fit in their high school
schedule nor did they want to take the classes after the “normal” school hours.
SAGE Academy Goal#2: By graduation 80% of graduating students will
complete The 4-‐ year SAGE College and Career Plan Template. (Pertains to students who have
been at SAGE at least two years)
SAGE Academy 2014/2015 Worlds Best Workforce Report & Annual Report on Curriculum, Instruction and Student Achievement
25
100% of our graduating seniors who were here for at least two years met this goal.
SAGE Academy Goal #3: At the end of the school year, 70% of SAGE students will score in a
medium or high range in on the Advisor Checklist. The checklist addresses Restorative
Justice, Conflict Resolution, and Social Justice which links to the SAGE Mission of tolerance,
respect, and understanding as citizens of the world.
96% of our students scored in the medium or high range on the advisor checklist.
SAGE Academy Goal #4 70% of SAGE Academy Students will experience a safe learning
environment at SAGE. Parents will report their own satisfaction on safety as measured by: Annual
student and parent survey.
100% of parents reported that they felt their child was safe at school. (34 parent surveys
were returned) 94% of the students answered that they felt safe at school in the
anonymous student survey.
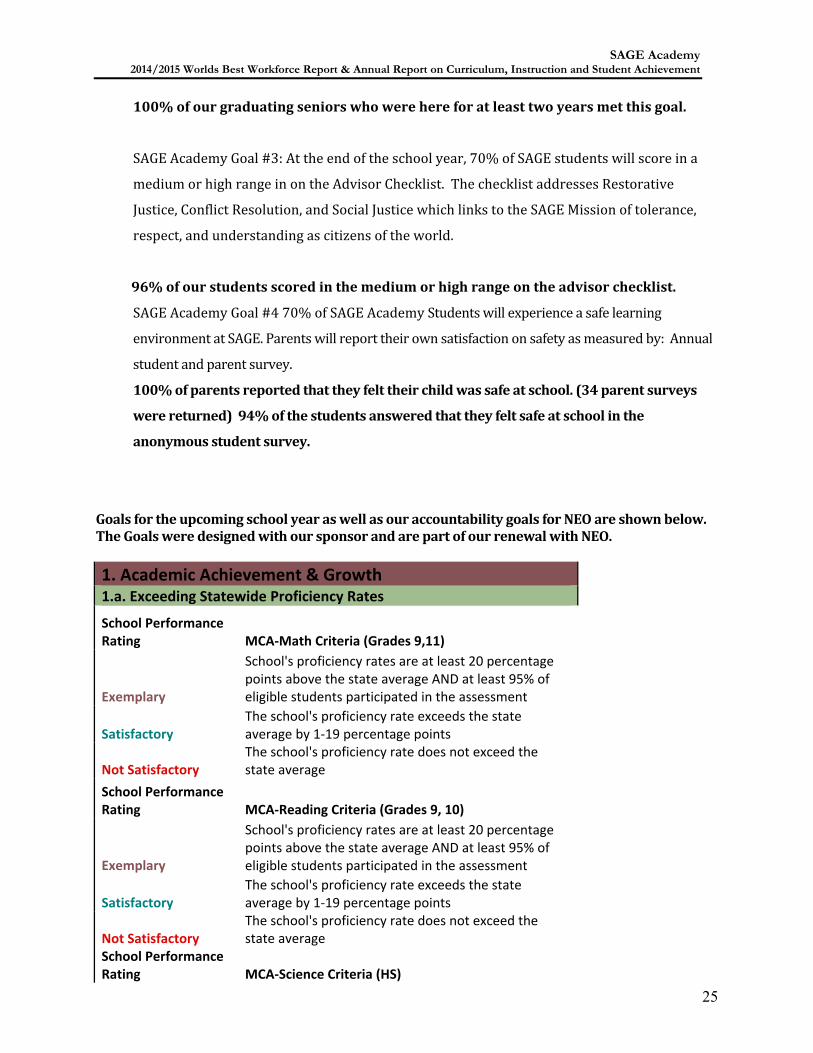
Goals for the upcoming school year as well as our accountability goals for NEO are shown below. The Goals were designed with our sponsor and are part of our renewal with NEO.
1. Academic Achievement & Growth 1.a. Exceeding Statewide Proficiency Rates
School Performance Rating MCA-‐Math Criteria (Grades 9,11)
Exemplary
School's proficiency rates are at least 20 percentage points above the state average AND at least 95% of eligible students participated in the assessment
Satisfactory The school's proficiency rate exceeds the state average by 1-‐19 percentage points
Not Satisfactory The school's proficiency rate does not exceed the state average
School Performance Rating MCA-‐Reading Criteria (Grades 9, 10)
Exemplary
School's proficiency rates are at least 20 percentage points above the state average AND at least 95% of eligible students participated in the assessment
Satisfactory The school's proficiency rate exceeds the state average by 1-‐19 percentage points
Not Satisfactory The school's proficiency rate does not exceed the state average
School Performance Rating MCA-‐Science Criteria (HS)
SAGE Academy 2014/2015 Worlds Best Workforce Report & Annual Report on Curriculum, Instruction and Student Achievement
26
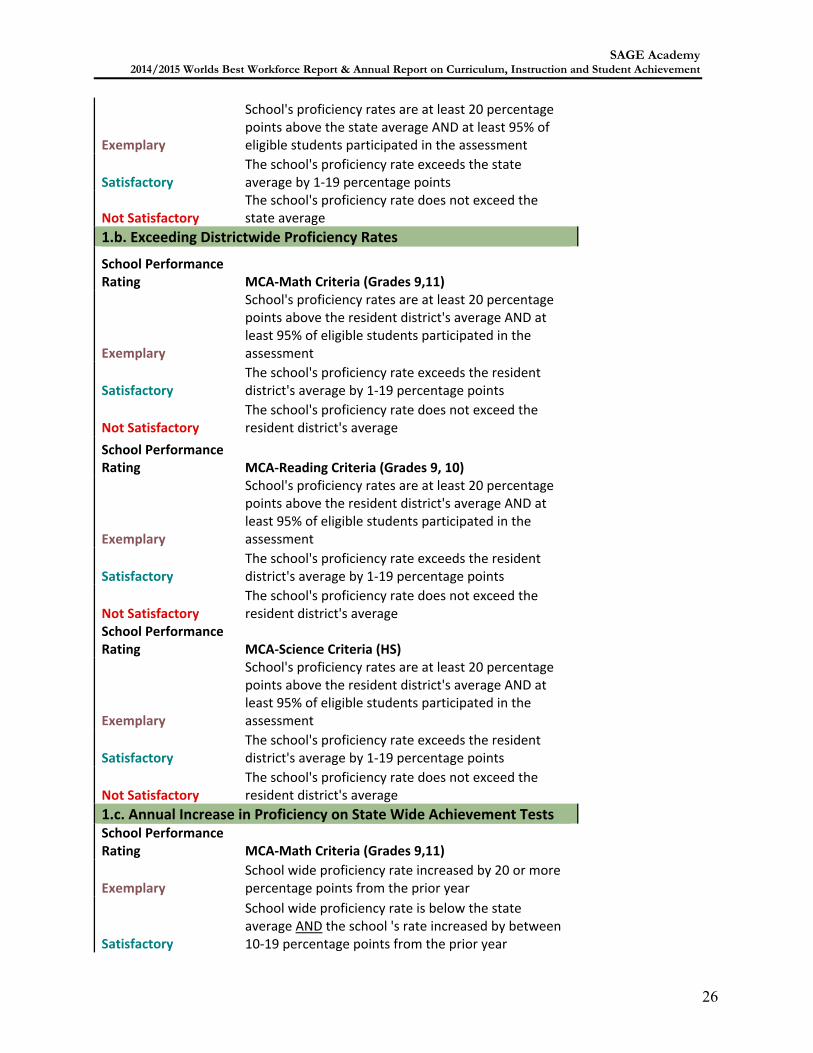
Exemplary
School's proficiency rates are at least 20 percentage points above the state average AND at least 95% of eligible students participated in the assessment
Satisfactory The school's proficiency rate exceeds the state average by 1-‐19 percentage points
Not Satisfactory The school's proficiency rate does not exceed the state average
1.b. Exceeding Districtwide Proficiency Rates
School Performance Rating MCA-‐Math Criteria (Grades 9,11)
Exemplary
School's proficiency rates are at least 20 percentage points above the resident district's average AND at least 95% of eligible students participated in the assessment
Satisfactory The school's proficiency rate exceeds the resident district's average by 1-‐19 percentage points
Not Satisfactory The school's proficiency rate does not exceed the resident district's average
School Performance Rating MCA-‐Reading Criteria (Grades 9, 10)
Exemplary
School's proficiency rates are at least 20 percentage points above the resident district's average AND at least 95% of eligible students participated in the assessment
Satisfactory The school's proficiency rate exceeds the resident district's average by 1-‐19 percentage points
Not Satisfactory The school's proficiency rate does not exceed the resident district's average
School Performance Rating MCA-‐Science Criteria (HS)
Exemplary
School's proficiency rates are at least 20 percentage points above the resident district's average AND at least 95% of eligible students participated in the assessment
Satisfactory The school's proficiency rate exceeds the resident district's average by 1-‐19 percentage points
Not Satisfactory The school's proficiency rate does not exceed the resident district's average
1.c. Annual Increase in Proficiency on State Wide Achievement Tests School Performance Rating MCA-‐Math Criteria (Grades 9,11)
Exemplary School wide proficiency rate increased by 20 or more percentage points from the prior year
Satisfactory
School wide proficiency rate is below the state average AND the school 's rate increased by between 10-‐19 percentage points from the prior year
SAGE Academy 2014/2015 Worlds Best Workforce Report & Annual Report on Curriculum, Instruction and Student Achievement
27
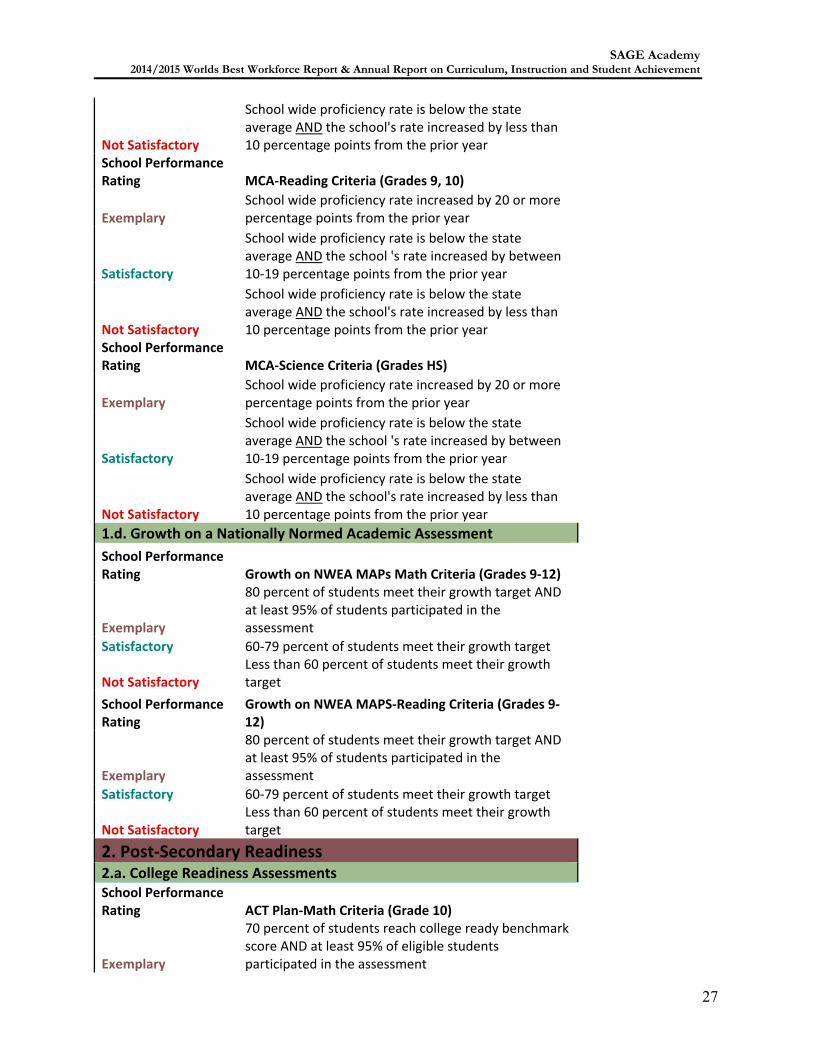
Not Satisfactory
School wide proficiency rate is below the state average AND the school's rate increased by less than 10 percentage points from the prior year
School Performance Rating MCA-‐Reading Criteria (Grades 9, 10)
Exemplary School wide proficiency rate increased by 20 or more percentage points from the prior year
Satisfactory
School wide proficiency rate is below the state average AND the school 's rate increased by between 10-‐19 percentage points from the prior year
Not Satisfactory
School wide proficiency rate is below the state average AND the school's rate increased by less than 10 percentage points from the prior year
School Performance Rating MCA-‐Science Criteria (Grades HS)
Exemplary School wide proficiency rate increased by 20 or more percentage points from the prior year
Satisfactory
School wide proficiency rate is below the state average AND the school 's rate increased by between 10-‐19 percentage points from the prior year
Not Satisfactory
School wide proficiency rate is below the state average AND the school's rate increased by less than 10 percentage points from the prior year
1.d. Growth on a Nationally Normed Academic Assessment School Performance Rating Growth on NWEA MAPs Math Criteria (Grades 9-‐12)
Exemplary
80 percent of students meet their growth target AND at least 95% of students participated in the assessment
Satisfactory 60-‐79 percent of students meet their growth target
Not Satisfactory Less than 60 percent of students meet their growth target
School Performance Rating
Growth on NWEA MAPS-‐Reading Criteria (Grades 9-‐12)
Exemplary
80 percent of students meet their growth target AND at least 95% of students participated in the assessment
Satisfactory 60-‐79 percent of students meet their growth target
Not Satisfactory Less than 60 percent of students meet their growth target
2. Post-‐Secondary Readiness 2.a. College Readiness Assessments School Performance Rating ACT Plan-‐Math Criteria (Grade 10)
Exemplary
70 percent of students reach college ready benchmark score AND at least 95% of eligible students participated in the assessment
SAGE Academy 2014/2015 Worlds Best Workforce Report & Annual Report on Curriculum, Instruction and Student Achievement
28
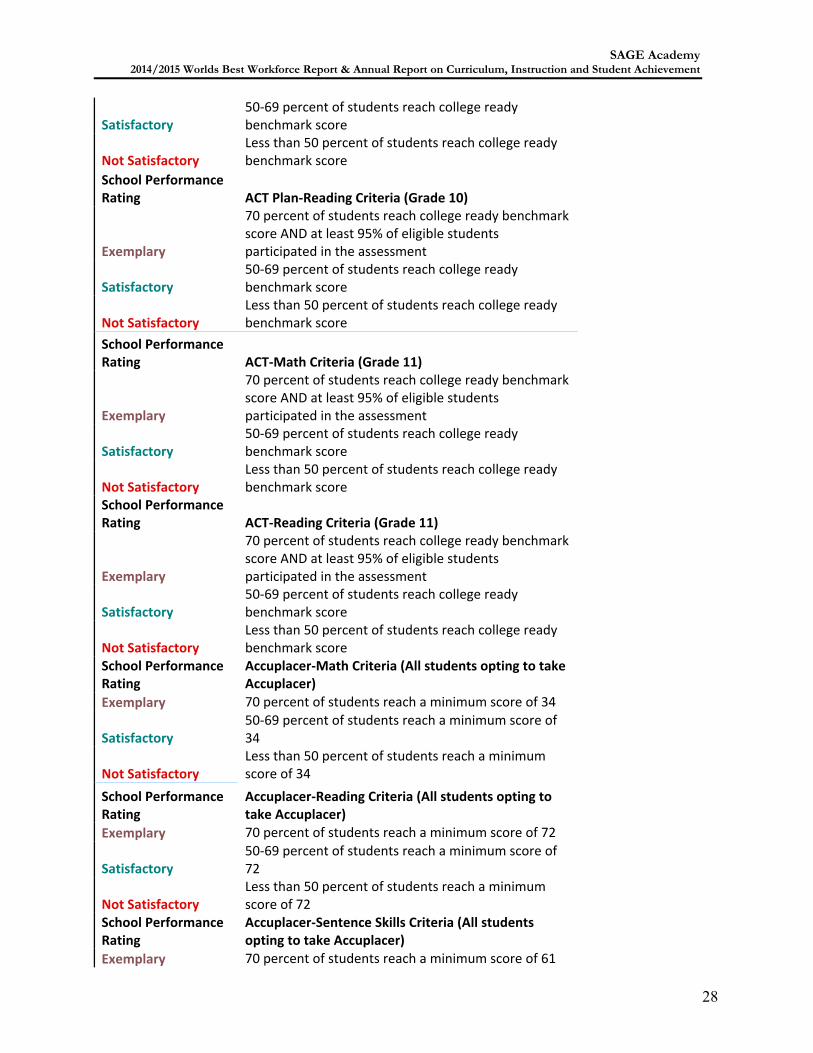
Satisfactory 50-‐69 percent of students reach college ready benchmark score
Not Satisfactory Less than 50 percent of students reach college ready benchmark score
School Performance Rating ACT Plan-‐Reading Criteria (Grade 10)
Exemplary
70 percent of students reach college ready benchmark score AND at least 95% of eligible students participated in the assessment
Satisfactory 50-‐69 percent of students reach college ready benchmark score
Not Satisfactory Less than 50 percent of students reach college ready benchmark score
School Performance Rating ACT-‐Math Criteria (Grade 11)
Exemplary
70 percent of students reach college ready benchmark score AND at least 95% of eligible students participated in the assessment
Satisfactory 50-‐69 percent of students reach college ready benchmark score
Not Satisfactory Less than 50 percent of students reach college ready benchmark score
School Performance Rating ACT-‐Reading Criteria (Grade 11)
Exemplary
70 percent of students reach college ready benchmark score AND at least 95% of eligible students participated in the assessment
Satisfactory 50-‐69 percent of students reach college ready benchmark score
Not Satisfactory Less than 50 percent of students reach college ready benchmark score
School Performance Rating
Accuplacer-‐Math Criteria (All students opting to take Accuplacer)
Exemplary 70 percent of students reach a minimum score of 34
Satisfactory 50-‐69 percent of students reach a minimum score of 34
Not Satisfactory Less than 50 percent of students reach a minimum score of 34
School Performance Rating
Accuplacer-‐Reading Criteria (All students opting to take Accuplacer)
Exemplary 70 percent of students reach a minimum score of 72
Satisfactory 50-‐69 percent of students reach a minimum score of 72
Not Satisfactory Less than 50 percent of students reach a minimum score of 72
School Performance Rating
Accuplacer-‐Sentence Skills Criteria (All students opting to take Accuplacer)
Exemplary 70 percent of students reach a minimum score of 61

SAGE Academy 2014/2015 Worlds Best Workforce Report & Annual Report on Curriculum, Instruction and Student Achievement
29
Satisfactory 50-‐69 percent of students reach a minimum score of 61
Not Satisfactory Less than 50 percent of students reach a minimum score of 61
2.b. Successful Completion of Capstone Projects
School Performance Rating Capstone Project Completion Criteria (Grades 12)
Exemplary
80 percent of students complete projects with a satisfactory evaluation or better AND at least 95% of eligible students completed a project.
Satisfactory 60-‐79 percent of students complete projects with a satisfactory evaluation or better
Not Satisfactory Less than 60 percent of students complete projects with a satisfactory evaluation or better
2.c. On-‐track to Graduation School Performance Rating
Individualized Credit Accumulation Goals Criteria (Grades 9-‐12)
Exemplary
at least 80 percent of students meet their annual credit accumulation goal, whereby maintain on-‐track to graduation goal.
Satisfactory
60-‐79 percent of students meet their annual credit accumulation goal, whereby maintain on-‐track to graduation goal.
Not Satisfactory
Less than 60 percent of students meet their annual credit accumulation goal, whereby maintain on-‐track to graduation goal.
2.d. Graduation Rate School Performance Rating
Individualized Graduation Goals Criteria (Grades B6212)
Exemplary 85-‐100 percent of students graduate on or before their GRAD Year.
Satisfactory 70-‐84 percent of students graduate on or before their GRAD Year.
Not Satisfactory Less than 70 percent of students graduate on or before their GRAD Year.
3. Student Engagement & Satisfaction 3.a. Attendance Rates
School Performance Rating Annual Attendance Rate Criteria (Grades 9-‐12) Exemplary 95 percent attendance rate Satisfactory 90-‐94 percent attendance rate Not Satisfactory below 90 percent attendance rate 3.b. Changes in Student Hope
School Performance Rating
Changes in the Hope Scale Score Criteria (Grades 9-‐12)

SAGE Academy 2014/2015 Worlds Best Workforce Report & Annual Report on Curriculum, Instruction and Student Achievement
30
Exemplary
Average spring to spring growth on the Hope Survey, based on matched students, increases 2 scale score points or more.
Satisfactory
Average spring-‐to-‐spring growth on the Hope Survey, based on matched students, increases between 1.0 and 1.9 scale score points.
Not Satisfactory
Average spring-‐to-‐spring growth on the Hope Survey, based on matched students, increases less than 1.0 scale score point.
3.c. Parent Satisfaction
School Performance Rating
5-‐Point Parent Satisfaction Scale Criteria (Grades 9-‐12)
Exemplary
80 percent of parents agree (4) or strongly agree (5) that they are satisfied with the school AND at least 95% of students had at least one parent/guardian respond to the survey
Satisfactory
60-‐79 percent of parents agree (4) or strongly agree (5) that they are satisfied with the school AND at least 25 percent of students had at least one parent/guardian respond to the survey.
Not Satisfactory Less than 60 percent of parents agree (4) or strongly agree (5) that they are satisfied with the school
3.d. Safe School Environment School Performance Rating Safe School Scale Criteria (Grades 9-‐12)
Exemplary
80 percent of parents agree (4) or strongly agree (5) that the school is safe AND at least 95% of students had at least one parent/guardian respond to the survey
Satisfactory 60-‐79 percent of parents agree (4) or strongly agree (5) that the school is safe
Not Satisfactory Less than 60 percent of parents agree (4) or strongly agree (5) that the school is safe
.
OPERATIONAL PERFORMANCE SAGE Academy has served nutritious lunches since opening and in the last five years
added breakfast for our students and staff. We contract through Done Right Food,
located in Columbia Heights. Done Right Food serves fresh, wholesome, scratch cooked, nutritious
food that teaches a healthy message. They follow Healthy School Menu Guidelines when planning

SAGE Academy 2014/2015 Worlds Best Workforce Report & Annual Report on Curriculum, Instruction and Student Achievement
31
menus that offer great food for students at school. Menus are aligned with the intent of SAGE
Academy school wellness policies and Dietary guidelines. These guidelines state specific types of
healthy, wholesome, homemade foods that are popular with students and are served every day in
school. Daily lunches include fresh green leafy salads, fresh vegetables, fresh fruits, lean
meats and poultry, whole grains, reduced fat cheeses and dressings, and more. Breakfast offers
lower sugar cereals, low fat yogurt, etc. All meals include skim milk. In addition, our guidelines
state specific types of less "healthy' foods that are considered convenience, highly processed, fast
foods that will NOT be served at all. Lunches do not include any breaded chicken products, high fat
hot dogs, hamburgers, corn dogs, frozen pizza, French fries, tater tots, etc. Likewise, breakfasts
do not include high-‐sugar cereals, chewy breakfast bars, pop tarts, etc.
Approximately 79% of SAGE students utilize bussing services provided by SAGE via the contractual
agreement with American Student Transportation. SAGE has contracted with American Student for
the past nine years and has been very satisfied with their services. SAGE pays for the
transportation through its own budget rather than through District 279 as times and geographical
boundaries differ. Although SAGE is committed to providing busing to all students within the
District 279 boundaries, they also provide busing beyond these boundaries when possible as SAGE
students attend from a variety of school districts. Students who do not utilize busing often drive
themselves or have family members who provide transportation. American Student also offers
instruction on bus safety as required by MDE regulations.
PARENT INVOLVEMENT
SAGE Academy continues to involve parents in the education of their child. There are
regularly scheduled conferences and other opportunities for parental involvement. In
2014/2015, 98% of students had parents attend conferences. In addition to
conferences, parents sign an agreement for volunteering (both on-‐site and off-‐site) to
support and enhance student learning and achievement. Parents/guardians receive a
monthly newsletter and mailing informing them of upcoming events at SAGE and
promoting volunteer opportunities
VOLUNTEERS
Over 23% of families at SAGE were represented in providing volunteer services during
the 14-‐15 school year. Volunteer activities ranged from support for SAGE graduation,
benefit dinner, to Prom, to transportation, and classroom assistants. Parents also
SAGE Academy 2014/2015 Worlds Best Workforce Report & Annual Report on Curriculum, Instruction and Student Achievement
32
served as SAGE Board members. In total, SAGE families dedicated more than eight
hundred and fifty hours to support SAGE programming and student activities.
Parents are involved in special events such as Prom and graduation, board membership,
serving as mentors for students, and leading fund-‐raising endeavors. Parents are also
invited to presentation nights where students give presentations on the projects they
have completed. At least 70% of family members attend one these evenings.
SAGE Academy conducts fire, tornado & lock down drills every year. Every room has a map of the
building showing all of the exits and the paths to take in case of an emergency. Every classroom and
office (except the gym) has a phone in the room in case of an emergency. This phone is also used to
page the staff as well. SAGE Academy is a very safe school and we only had one incident of a
physical altercation. As stated earlier in the report 94% of the students answered that they felt safe at
school. All staff has been certified in CPR and AED use. SAGE Academy has also sent employees to the
School Indoor Air Quality (IAQ) Coordinator and Environmental Health Trainings.
Innovative Practices & Implementation CITIZENSHIP RECOGNITION & AWARDS SAGE Academy requires its students to be active in the community. Students must earn service
credit in order to graduate. Last year the students helped in the community by donating their time
at the Gale Woods Farm and Carver Park (Part of Three Rivers Park District) Students picked up
trash, improved walking trails, removed buckthorn and planted natural grasses. Several students
participated in Feed My Starving Children as well as helping with pit bull rescuing in the Twin
Cities.
StandUp is a student lead service-‐learning group that has been active for the past three years.
Within the 2014-‐2015 school year, StandUp students tackled the issue of youth sex-‐trafficking in
Minnesota. The goal of the group was to examine the root causes of the issue. Students did research
and connected with community organizations such as Breaking Free, People Serving People, and
Avenues Youth Shelter. Students planned community service nights that were open to all SAGE
students; they fundraised to provide adopt-‐a-‐family gifts, and held clothing drives to provide to
youth. Students also planned an all day event to educate fellow students on the issues that affect
Minnesota youth such as homelessness and bullying. StandUp also held school Spirit Weeks to
promote students engagement.
SAGE Academy 2014/2015 Worlds Best Workforce Report & Annual Report on Curriculum, Instruction and Student Achievement
33
CURRICULUM AND EDUCATIONAL DELIVERY
SAGE Academy continues to deliver educational content through a curricular program
that focuses on an individualized approach to learning. Each student completes
learning modalities as well as Multiple Intelligences inventories. Howard Gardner’s
Frames of Intelligences serve as an instructional guide as well as Vicki Phillip’s
Developmental Skills packets, which are based on brain-‐compatible leaning strategies.
Circle Learning based on Ojibwa and Sioux circles of justice are practiced in Base
Groups, Gender Groups, and full Community meetings to teach democratic skills and to
involve students in conflict resolution and Restorative-‐Justice based discipline
processes.
Learning and assessments at SAGE focus on: Project-‐based Learning; Expeditions;
Multiple Intelligences; Cooperative Learning/Team Dynamics; Service Learning;
Mentorships; and Global Connections.
SAGE Academy is designed with small classrooms around the perimeter of the school
with a large open area housing student centers where each student has their own Ipad
and work space. While students receive content area instruction from teachers each
day, the bulk of the learning time is independent. Students work on individual projects
with guidance and assistance from their teachers.
EVALUATION OF CURRICULUM
All licensed instructors complete backward maps in accordance with Vicky Hayes “Backward
Mapping,” and McTigue and Wiggins Instruction By Design. Essential Questions are required for all
maps as well as skills to be addressed and scaffolding of skills in order to meet the final
assessments. All maps are reviewed by the Program Director and support is given as needed in staff
development and on a one-‐to-‐one basis. Licensed teachers are required to embed standards in both
direct instruction and project-‐based classes.
As SAGE is a PBL focused school, all projects must have standards embedded and all projects are
over-‐seen by content licensed teachers. Follow-‐up is by observation, student surveys, mentor
meetings and Professional Learning Committees. All evaluation is in accordance with The Growth
and Evaluation Manual as approved by the SAGE Academy School Board.

SAGE Academy 2014/2015 Worlds Best Workforce Report & Annual Report on Curriculum, Instruction and Student Achievement
34
Extensive staff development is held in August, throughout the year, and a full week in
May to evaluate curriculum, standards and project focused learning. These workshops
link to delivery methods and the mission of SAGE in accordance with required MDE standards.
Staff is allowed to have two paid days for staff development opportunities outside of the SAGE
school setting. Also, licensed instructors facilitate workshops in their content area for the entire
SAGE staff.
EXPEDITIONS
Students are encouraged to learn outside the walls of the school by engaging in
expeditions. An expedition may be a learning event at a local area of interest or it may
involve a learning experience out of the state or country. In either case, the student
works on material associated with the expedition to enhance the learning opportunity.
The following expeditions were completed during the 2014/2015 school year.
Twin Cities Metropolitan Expeditions
1. State Fair-‐ Scavenger hunt and Minnesota knowledge
2. Renaissance fair – Diverse culture and fine arts
3. Institute of Arts – Correlation of art and student projects
4. Minnesota History Theater “The Debutantes Ball” for Fine Arts
5. Global Youth Service day-‐ Three Rivers Park district helping with clean up.
6. Baker Near wilderness settlement-‐ Overnight camping focusing on team
building.
7. Science Museum of Minnesota – Omni Theatre Tornado Alley and SPACE
exhibit.
8. The Depot for ice skating-‐ physical education
9. Mill City Museum-‐ History of the city of Minneapolis
10. End of the Year picnic-‐ Base group competitions and team building
11. Minnesota Zoo – animal habits
12. Wildlife Science center-‐ wolf study
13. Youth Performance Company-‐ Dracula the play
SAGE Academy 2014/2015 Worlds Best Workforce Report & Annual Report on Curriculum, Instruction and Student Achievement
35
FUTURE PLANS SAGE Academy is interchanging our desktop computers to iPads. This way students can take their
computers into the classrooms with them and it would make for a more interactive teaching
environment.
SAGE Academy is looking into the possibility of moving to a different location so we don’t have to
pay the property taxes on the building that we currently lease. Our property taxes are quite
expensive and take out a large chunk of our budget. We currently have a three-‐year lease on this
building with the possibility of adding a fourth year.
2014-‐2015 World’s Best Workforce Report Summary District or Charter Name SAGE Academy Contact Person Name and Position Diane Scholten Stakeholder Engagement
Report
http://www.sageacademy.org/images/2015WBWF.pdf
Annual Public Meeting
October 22, 2015 & November 12, 2015
District Advisory Committee
The District Advisory Committee members for the 2014-‐2015 school year
included school board members, students, parents and teachers. This
committee met with NEO during their visit to SAGE. Parents included Jan
Dahlstrom, Ena Easter, Kate Hahn and Sherilyn Stokes. Teachers included
Cari-‐Ana Garcia Luna, Les Harrison, Heidi Schatz and Allison Mulvhille. The
students that met with the group are under 18 so their names will not be
published.
SAGE Academy 2014/2015 Worlds Best Workforce Report & Annual Report on Curriculum, Instruction and Student Achievement
36
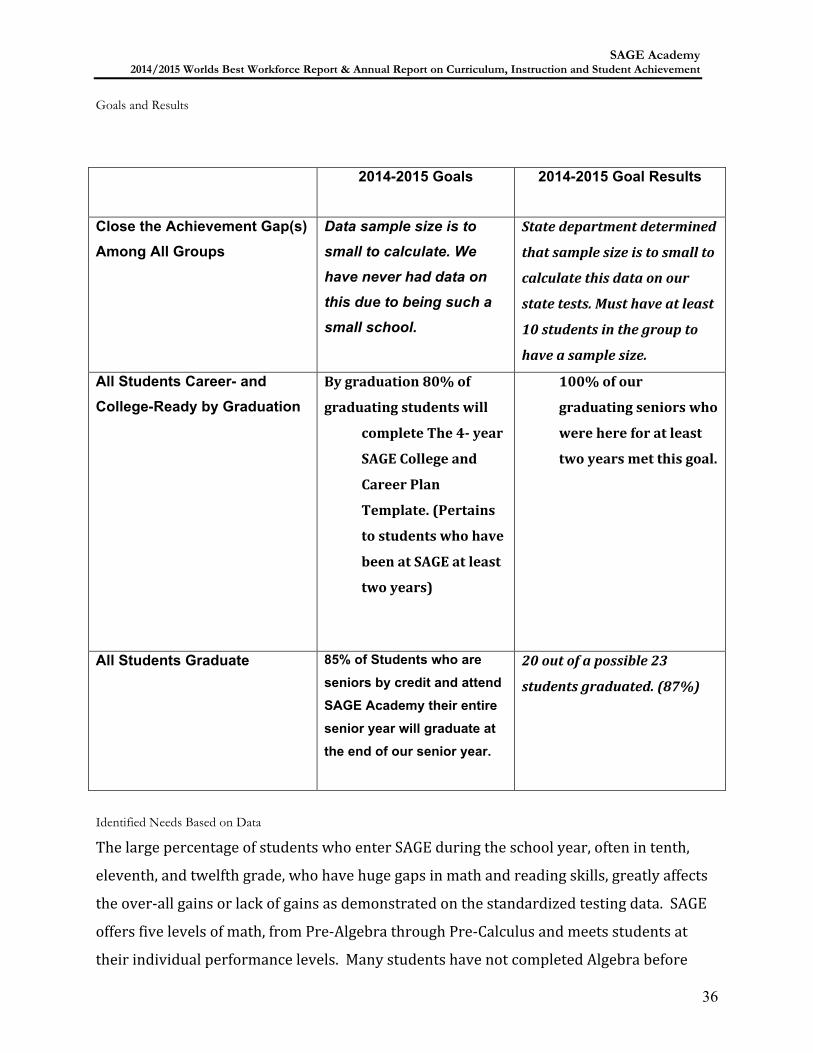
Goals and Results
SMART Goal 2014-2015 Goals 2014-2015 Goal Results
Close the Achievement Gap(s) Among All Groups
Data sample size is to
small to calculate. We
have never had data on
this due to being such a
small school.
State department determined
that sample size is to small to
calculate this data on our
state tests. Must have at least
10 students in the group to
have a sample size.
All Students Career- and College-Ready by Graduation
By graduation 80% of
graduating students will
complete The 4- year
SAGE College and
Career Plan
Template. (Pertains
to students who have
been at SAGE at least
two years)
100% of our
graduating seniors who
were here for at least
two years met this goal.
All Students Graduate 85% of Students who are
seniors by credit and attend SAGE Academy their entire
senior year will graduate at the end of our senior year.
20 out of a possible 23
students graduated. (87%)
Identified Needs Based on Data
The large percentage of students who enter SAGE during the school year, often in tenth,
eleventh, and twelfth grade, who have huge gaps in math and reading skills, greatly affects
the over-‐all gains or lack of gains as demonstrated on the standardized testing data. SAGE
offers five levels of math, from Pre-‐Algebra through Pre-‐Calculus and meets students at
their individual performance levels. Many students have not completed Algebra before
SAGE Academy 2014/2015 Worlds Best Workforce Report & Annual Report on Curriculum, Instruction and Student Achievement
37
taking the MCA math test and, therefore, their performance is greatly affected. We focus
more on our NWEA scores more because all of our students take these tests three times a
year compared to the MCA tests that the students only take once. Also we have such a small
sample size of students who take the specific MCA tests that we don’t get any accurate
sample size to identify students specific needs compared to all the data we receive from
students taking the NWEA tests.
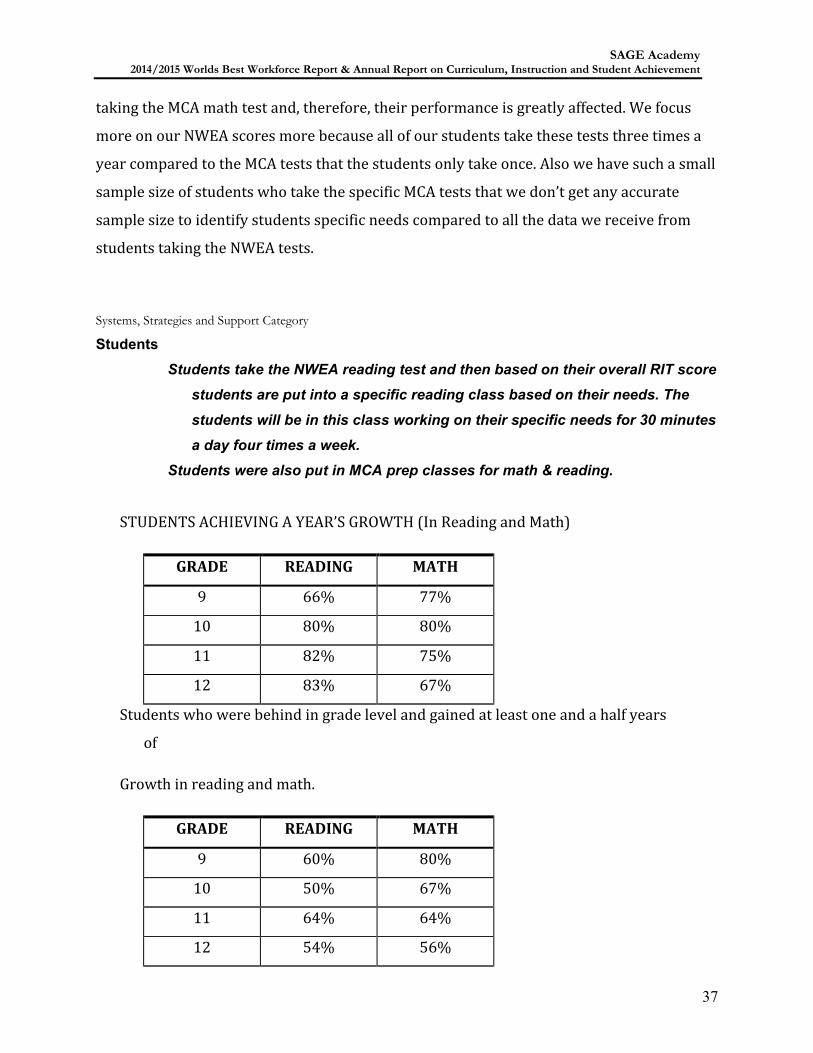
Systems, Strategies and Support Category
Students Students take the NWEA reading test and then based on their overall RIT score
students are put into a specific reading class based on their needs. The
students will be in this class working on their specific needs for 30 minutes
a day four times a week.
Students were also put in MCA prep classes for math & reading.
STUDENTS ACHIEVING A YEAR’S GROWTH (In Reading and Math)
GRADE READING MATH
9 66% 77%
10 80% 80%
11 82% 75%
12 83% 67%
Students who were behind in grade level and gained at least one and a half years
of
Growth in reading and math.
GRADE READING MATH
9 60% 80%
10 50% 67%
11 64% 64%
12 54% 56%
SAGE Academy 2014/2015 Worlds Best Workforce Report & Annual Report on Curriculum, Instruction and Student Achievement
38
Teachers and Principals
All licensed instructors complete backward maps in accordance with Vicky Hayes
“Backward Mapping,” and McTigue and Wiggins Instruction By Design. Essential Questions
are required for all maps as well as skills to be addressed and scaffolding of skills in order
to meet the final assessments. All maps are reviewed by the Program Director and support
is given as needed in staff development and on a one-‐to-‐one basis. Licensed teachers are
required to embed standards in both direct instruction and project-‐based classes.
As SAGE is a PBL focused school, all projects must have standards embedded and all
projects are over-‐seen by content licensed teachers. Follow-‐up is by observation, student
surveys, mentor meetings and Professional Learning Committees. All evaluation is in
accordance with The Growth and Evaluation Manual as approved by the SAGE Academy
School Board. Staff must be able to do peer reviews of other staff members and also keep
an up to date portfolio to be used as part of their evaluation
Extensive staff development is held in August, throughout the year, and a full week in May
to evaluate curriculum, standards and project focused learning. These workshops link to
delivery methods and the mission of SAGE in accordance with required MDE standards.
Staff is allowed to have two paid days for staff development opportunities for continuing
education outside of the SAGE school setting. Also, licensed instructors facilitate
workshops in their content area for the entire SAGE staff.
Our district goals are the same as our school goal since we are our own independent school
district.
Top Related