


Languages
Pages
Legal


Safety and Inspections
To preserve and improve the quality of life in Saint Paul by protecting and promoting public health and safety for all.
Office of the Director· Business Review Council· City-Council Liaison· Finance, Accounting & Personnel· Legislation Development and Review· Public Information· Technology Services
7.00 FTE
Housing and Building Inspection
Code Enforcement and Vacant Buildings
· Code Enforcement· Nuisance Abatement· Truth in Sale of
Housing· Vacant Building
Construction Inspection· Plan Review· Building Inspection· Electrical· Elevator· Mechanical· Mechanical-Sheet Metal· Plumbing
Fire Inspections· Residential· Commercial· Fire Engineering· Case Managed
Properties
89.00 FTE
Development, Licensing, Permits and Customer Service
· Licensing· Zoning and Site Plan Review· Gambling Enforcement· Clerical Support· Info and Complaint· Animal Control· Project Facilitation· Skyway Management
49.00 FTE
Building Official
Fire Chief
Fire Marshal
(Total 145.00 FTE)
7/31/2015405

Department Description:
Department Goals
Department Facts Recent Accomplishments
● Total General Fund Budget: $18,510,696
● Total Special Fund Budget: $545,515
● Total FTEs: 145.00
● Issued 4,251 business licenses.
2016 Proposed Budget
Department of Safety and Inspections
The Department of Safety and Inspections (DSI) is a proactive, multi-disciplinary safety and inspections organization that builds and maintains a livable Saint Paul community through strong
leadership, creative partnerships, teamwork, and effective regulatory strategies. DSI’s responsibilities include: 1) Animal Control, 2) Construction Inspection, 3) Code Enforcement, 4) Fire
Inspections, 5) Information and Complaint, 6) Business Licensing, 7) Construction Plan Review, 8) Site Plan Review, 9) Project Facilitation for new businesses and expansions, 10) Vacant
Buildings, and 11) Zoning.
Safety & Inspections’ Portion
of General Fund Spending
• Ensure safety in our built environment.
• Prevent life and property loss.
• Promote safe neighborhoods.
• Continue to integrate and streamline workflow throughout the City.
• Make it easy to open or expand a business in Saint Paul.
• Improve citizen education and communication.
• Implemented Amanda Web software upgrade.
• Completed Strength, Weakness, Opportunities, Threats analysis of department.
• Maintained housing stock, through the C of O inspection process, by improving or
retaining the grade classification of 244 rental properties.
• Issued 29,044 building trade permits in 2014.
• 228 new businesses opened in 2014 using a streamlined application and approval
process. (MDH and MDA licenses no longer handled by the City)
• Issued 181 liquor licenses in 2014.
• Issued 444 special event related licenses in 2014.
• Facilitated the re-occupancy of 537 vacant building structures in 2014.
• Reduced reported dog bites from 1,346 in 1971 to 165 in 2014.
• Managed 81,846 calls and 9,155 emails to our Information and Complaint line in 2014.
• Processed 27,517 license transactions plus charitable gambling activity for a total value
of $3,104,167.
In 2014 DSI :
● Conducted 28,477 code enforcements and 19,598 vacant building inspections.
● Responded to 4,284 animal related complaints.
● Reviewed 2,228 construction plans for a total valuation of $636,461,645.
● Conducted 57,690 construction inspections.
● Conducted 10,382 Fire C of O inspections and issued 3,865 certificates.
● Information and Complaint processed 28,298 complaints.
7.6%
406

Fiscal Summary
2014
Adopted
2015
Adopted
2016
Proposed Change % Change
2015
Adopted
FTE
2016
Proposed
FTE
Spending
17,573,317 17,927,343 18,510,696 583,353 3.3% 142.12 144.12
400,000 400,000 400,000 - 0.0% - -
115,113 136,249 145,515 9,266 6.8% 0.88 0.88
18,088,430 18,463,592 19,056,211 592,619 3.2% 143.00 145.00
Financing
15,135,436 15,978,185 17,280,800 1,302,615 8.2%
400,000 400,000 400,000 - 0.0%
115,113 136,249 145,515 9,266 6.8%
15,650,549 16,514,434 17,826,315 1,311,881 7.9%
Budget Changes Summary
2016 Proposed Budget
Department of Safety and Inspections
The 2016 proposed budget for the Department of Safety and Inspections (DSI) includes staffing changes to meet increasing demand in the Zoning division. The increase of 2.00 FTE in
DSI are offset by new revenue generated through a combination of volume increases in building permits and site plan reviews, as well as fee increases. Other changes in the 2016
proposed budget for DSI are largely due to current service level adjustments.
228: Charitable Gambling
215: Assessment Financing
100: General Fund
228: Charitable Gambling
215: Assessment Financing
100: General Fund
Total
Total
407

100: General Fund
Spending Financing FTE
Current Service Level Adjustments 425,712 - -
Subtotal: 425,712 - -
85,070 - 1.00
Zoning revenue volume adjustment - 70,000 -
Subtotal: 85,070 70,000 1.00
Zoning Design Review Standards
DSI Inspector II 39,359 - 0.50
DSI Inspector I 33,212 - 0.50
Design standards revenue - 72,000 -
Subtotal: 72,571 72,000 1.00
The 2016 proposed budget includes resources to hire a Senior City Planner in the Zoning division of DSI, in order to keep up with the growing
demand for construction site plan reviews in St. Paul. This employee will have the level of professional expertise needed for the number of
increasingly complex site plan reviews, allowing DSI to achieve compliance with Minnesota statute and ensure timely review of applications.
This addition is largely offset by the growth in Zoning revenues due to the volume increase.
Zoning Plan Review
Department of Safety and Inspections
Change from 2015 Adopted
Senior City Planner
In 2016, DSI will have to comply with new design review standards for 1 and 2 family residential structures. The new design standards are
expected to increase the demand on staff due to a increase in the number and scope of reviews required. The 2016 proposed budget
includes resources for DSI to hire an additional 0.50 FTE for the Zoning division to help address the additional workload, as well as an
additional 0.50 FTE for the Licensing Division, allowing DSI to convert a current FTE which is split between Zoning and Licensing into separate
FTEs for each division. The spending increase from these positions are almost entirely offset by the projected additional revenue due
volume and fee adjustments to the design review standards.
408

100: General Fund
Spending Financing FTE
- 700,000 -
3% increase in fees - 460,615 -
Subtotal: - 1,160,615 -
Fund 100 Budget Changes Total 583,353 1,302,615 2.00
The 2016 proposed budget includes adjustments to DSI revenues to reflect actual trends in construction services and a 3% increase to all DSI
fees including, building permits, business licenses, fire inspection, and vacant buildings.
DSI Revenues
Department of Safety and Inspections
Change from 2015 Adopted
Volume-based adjustments
409

215: Assessment Financing
Spending Financing FTE
No Changes from 2015 Adopted Budget - - -
Subtotal: - - -
Fund 215 Budget Changes Total - - -
228: Charitable Gambling
Spending Financing FTE
Current Service Level Adjustments 9,266 9,266 -
Subtotal: 9,266 9,266 -
Fund 228 Budget Changes Total 9,266 9,266 -
Department of Safety and Inspections
The Assessment fund includes revenues and expenditures for vacant building demolitions.
Change from 2015 Adopted
Change from 2015 Adopted
The Charitable Gambling fund includes DSI's gambling enforcement activities and revenues.
Department of Safety and Inspections
410

Spending Reports 411

CITY OF SAINT PAULDepartment Budget Summary
(Spending and Financing)Department: Budget Year: 2016
2013Actuals
Change From
2015Adopted
2016Mayor's
Proposed
2015Adopted
2014Actuals
SAFETY AND INSPECTION
Spending by FundCITY GENERAL FUND 15,829,494 17,951,721 17,927,343 18,510,696 583,353
ASSESSMENT FINANCING 397,266 429,966 400,000 400,000
CHARITABLE GAMBLING 82,137 68,342 136,249 145,515 9,265
CITY CAPITAL PROJECTS 102,751 47,450
TOTAL SPENDING BY FUND 19,056,210 18,463,593 18,497,479 16,411,647 592,618
Spending by Major AccountEMPLOYEE EXPENSE 13,143,216 15,400,085 14,757,058 13,837,111 643,028 SERVICES 2,706,934 3,144,060 3,192,599 4,118,842 (48,539)MATERIALS AND SUPPLIES 203,066 312,535 319,405 320,536 (6,870)ADDITIONAL EXPENSES 115,530 1,500 1,500 1,500 CAPITAL OUTLAY 124,356 37,531 37,531 67,450 DEBT SERVICE 44 20 OTHER FINANCING USES 118,500 160,499 155,500 152,020 4,999
TOTAL SPENDING BY MAJOR ACCOUNT 19,056,210 18,463,593 18,497,479 16,411,647 592,618
Financing by Major AccountTAXES 136,357 145,515 136,249 134,024 9,266
LICENSE AND PERMIT 10,796,051 8,413,805 7,506,869 10,815,883 906,936
CHARGES FOR SERVICES 4,341,297 5,622,275 5,226,596 5,040,256 395,679
FINE AND FORFEITURE 77,843 67,000 67,000 86,019
ASSESSMENTS 177,108
INVESTMENT EARNINGS 1,544
MISCELLANEOUS REVENUE 459 2,659
OTHER FINANCING SOURCES 2,750,942 3,577,720 3,577,720 2,829,026
TOTAL FINANCING BY MAJOR ACCOUNT 17,826,315 16,514,434 19,086,518 18,102,950 1,311,881
As of August 1st, 2015, actual spending and financing amounts for 2014 listed above remain unaudited due to a delay in the 2014 financial audit. Because of this delay, these reports may significantly deviate from final audited numbers.
412

CITY OF SAINT PAULSpending Plan by Department
Department:Fund: Budget Year: 2016
SAFETY AND INSPECTIONCITY GENERAL FUND
2013Actuals
Change From
2014Actuals
2015Adopted
2016Mayor's
Proposed
2015Adopted
Spending by Major Account
13,064,343 13,796,598 14,654,704 15,288,252 EMPLOYEE EXPENSE 633,548 2,233,953 3,682,003 2,778,921 2,730,597 SERVICES (48,324)
203,066 311,270 310,769 303,995 MATERIALS AND SUPPLIES (6,774) 115,530 1,500 1,500 1,500 ADDITIONAL EXPENSES 95,500 20,000 37,531 37,531 CAPITAL OUTLAY
44 20 DEBT SERVICE 117,057 140,330 143,918 148,821 OTHER FINANCING USES 4,903
583,353 18,510,696 17,927,343 17,951,721 15,829,494 Total Spending by Major Account
Spending by Accounting UnitDSI ADMINISTRATION 607,196 855,176 891,421 720,117 10024100 (36,245)PROPERTY CODE ENFOREMENT 1,657,535 1,378,126 1,416,862 1,651,113 10024200 (38,736)VACANT BLDG CODE ENFORCEMENT 586,152 982,054 768,187 767,373 10024205 213,867 SUMMARY NUISANCE ABATEMENT 1,056,859 1,399,497 1,506,489 2,429,755 10024210 (106,992)TRUTH IN SALE OF HOUSING 101,726 120,553 114,716 119,062 10024215 5,837 PERFORMANCE DEPOSIT PROJECTS 19 10024220CONSTRUCTION SVCS AND PERMITS 4,435,475 6,206,241 5,678,398 4,470,486 10024300 527,843 FIRE CERTIFICATE OF OCCUPANCY 2,080,715 2,765,673 2,638,476 2,498,484 10024400 127,197 BUSINESS AND TRADE LICENSE 2,622,359 2,820,584 3,152,213 3,183,159 10024500 (331,629)ZONING 754,545 1,011,019 742,362 883,471 10024505 268,657 ANIMAL AND PEST CONTROL 807,980 971,773 927,824 1,037,883 10024510 43,949 ENVIRONMENTAL HEALTH 1,118,952 90,395 190,799 10024515 (90,395)
Total Spending by Accounting Unit 15,829,494 18,510,696 583,353 17,951,721 17,927,343
As of August 1st, 2015, actual spending and financing amounts for 2014 listed above remain unaudited due to a delay in the 2014 financial audit. Because of this delay, these reports may significantly deviate from final audited numbers. 413

CITY OF SAINT PAULSpending Plan by Department
Department:Fund: Budget Year: 2016
SAFETY AND INSPECTIONASSESSMENT FINANCING
2013Actuals
Change From
2014Actuals
2015Adopted
2016Mayor's
Proposed
2015Adopted
Spending by Major Account
11,917 7,368 7,890 7,970 EMPLOYEE EXPENSE 80 385,349 421,968 392,110 392,030 SERVICES (80)
630 MATERIALS AND SUPPLIES
400,000 400,000 429,966 397,266 Total Spending by Major Account
Spending by Accounting UnitNUISANCE BUILDINGS ABATEMENT 397,266 400,000 400,000 429,966 21524250
Total Spending by Accounting Unit 397,266 400,000 429,966 400,000
As of August 1st, 2015, actual spending and financing amounts for 2014 listed above remain unaudited due to a delay in the 2014 financial audit. Because of this delay, these reports may significantly deviate from final audited numbers.
414

CITY OF SAINT PAULSpending Plan by Department
Department:Fund: Budget Year: 2016
SAFETY AND INSPECTIONCHARITABLE GAMBLING
2013Actuals
Change From
2014Actuals
2015Adopted
2016Mayor's
Proposed
2015Adopted
Spending by Major Account
66,956 33,146 94,463 103,864 EMPLOYEE EXPENSE 9,400 13,738 14,871 21,568 21,433 SERVICES (135)
8,636 8,636 8,540 MATERIALS AND SUPPLIES (96) 1,443 11,690 11,582 11,678 OTHER FINANCING USES 96
9,265 145,515 136,249 68,342 82,137 Total Spending by Major Account
Spending by Accounting UnitGAMBLING ENFORCEMENT 82,137 145,515 136,249 68,342 22824550 9,265
Total Spending by Accounting Unit 82,137 145,515 9,265 68,342 136,249
As of August 1st, 2015, actual spending and financing amounts for 2014 listed above remain unaudited due to a delay in the 2014 financial audit. Because of this delay, these reports may significantly deviate from final audited numbers. 415

CITY OF SAINT PAULSpending Plan by Department
Department:Fund: Budget Year: 2016
SAFETY AND INSPECTIONCITY CAPITAL PROJECTS
2013Actuals
Change From
2014Actuals
2015Adopted
2016Mayor's
Proposed
2015Adopted
Spending by Major Account
73,894 SERVICES 28,856 47,450 CAPITAL OUTLAY
47,450 102,751 Total Spending by Major Account
Spending by Accounting UnitSAFETY INSPECT CAPITAL MAINT 102,751 47,450 40024950
Total Spending by Accounting Unit 102,751 47,450
As of August 1st, 2015, actual spending and financing amounts for 2014 listed above remain unaudited due to a delay in the 2014 financial audit. Because of this delay, these reports may significantly deviate from final audited numbers.
416
Financing Reports 417

CITY OF SAINT PAULFinancing by Company and Department
Budget Year:
CITY OF SAINT PAULCompany:
Department: SAFETY AND INSPECTION
Change From
2015Adopted
2014Actuals
2013Actuals
Account Account Description
2015Adopted
2016Mayor's
Proposed
Fund: CITY GENERAL FUND 2016
BUSINESS LICENSE42105-0 272,469 2,437,693 2,033,048 685,275 957,744
TRADE OCCUPATION LICENSE42205-0 235,840 257,661 240,000 240,000
TRUTH IN HOUSING EVALUATOR42210-0 5,000 6,240 4,500 4,500
ANIMAL LICENSE42220-0 (25,000) 121,231 106,773 135,000 110,000
BUILDING PERMIT42505-0 659,467 7,996,286 8,412,160 6,442,094 7,101,561
906,936 TOTAL FOR LICENSE AND PERMIT 10,796,051 10,815,883 7,506,869 8,413,805
MISCELLANEOUS FEES44190-0 25,695 34,000 34,000
COPIES44215-0 2,000 2,000 2,000
MAPS PUBLICATION REPORT HISTOR44225-0 1,079 180
ADMINISTRATION OUTSIDE44505-0 86,186 34,542
MISCELLANEOUS SERVICES44590-0 67,038 6,611
PARAMEDIC SERVICE45105-0 477
FIRE SAFETY SERVICES RMS45110-0 278,339 222,176 186,000 186,000
FIRE WATCH STANDBY45130-0 13,851 10,000 10,000
PLAN REVIEW46105-0 366,000 1,398,786 2,197,879 1,900,000 2,266,000
VACANT BUILDING REGISTRATION46110-0 23,622 653,692 560,745 787,406 811,028
ZONING FEES AND LETTERS46115-0 17,500 30,370 126,100 35,000 52,500
DSI SAC ADMINISTRATION46120-0 16,032 19,106 19,106
TRUTH IN SALE OF HOUSING46125-0 (25,000) 152,831 150,444 175,000 150,000
ZONING SITE PLAN46130-0 130,950 149,320 116,267 110,000 240,950
CERTIFICATE OF COMPETENCY46135-0 230,053 237,739 220,000 220,000
EXAMINATION FEES46140-0 (14,000) 20,453 34,820 44,000 30,000
CODE COMPLIANCE INSPECTION46145-0 192,450 251,800 251,800
EXCESSIVE CONSUMPTION46150-0 22,920
CERT OF OCC COMMERCIAL46205-0 86,920 492,214 464,738 406,000 492,920
CERT OF OCC PROVISIONAL46210-0 (59,327) 133,453 266,003 206,676
CERT OF OCC RESID 1 AND 2 UNIT46215-0 14,296 595,422 369,750 428,323 442,619
CERT OF OCC RESID 3 OR MORE46220-0 (145,282) 159,821 137,082 351,958 206,676
As of August 1st, 2015, actual spending and financing amounts for 2014 listed above remain unaudited due to a delay in the 2014 financial audit. Because of this delay, these reports may significantly deviate from final audited numbers.
418

CITY OF SAINT PAULFinancing by Company and Department
Budget Year:
CITY OF SAINT PAULCompany:
Department: SAFETY AND INSPECTION
Change From
2015Adopted
2014Actuals
2013Actuals
Account Account Description
2015Adopted
2016Mayor's
Proposed
Fund: CITY GENERAL FUND 2016
395,679 TOTAL FOR CHARGES FOR SERVICES 4,341,297 5,040,256 5,226,596 5,622,275
PENALTY AND FINE53105-0 77,843 71,019 67,000 67,000
FORFEITURES53305-0 15,000
TOTAL FOR FINE AND FORFEITURE 77,843 86,019 67,000 67,000
TAX FORFEITED PROPERTY54115-0 71,200
TOTAL FOR ASSESSMENTS 71,200
OTHER AGENCY SHARE OF COST55520-0
AUTOMOBILE CLAIMS55740-0 517
SUBPOENA WITNESS55850-0 459 157
CASH OVER OR SHORT55905-0 992
OTHER MISC REVENUE55915-0 993
TOTAL FOR MISCELLANEOUS REVENUE 459 2,659
TRANSFER FR SPECIAL REVENUE FU56225-0 262,525 502,893 262,525 262,525
TRANSFER FR CAPITAL PROJ FUND56235-0 1,394,967
TRANSFER FR ENTERPRISE FUND56240-0 194,496 200,303 210,050 210,050
TRANSFER ABATEMENT ASMTS56305-0 893,090 1,296,500 1,296,500
TRANSFER EXCESSIVE CONSUMP ASMTS56310-0 116,607 135,000 135,000
TRANSFER VEHICLE TOWING ASMTS56315-0 15,863 45,000 45,000
TRANSFER TRASH HAULING ASMTS56320-0 57,530 128,000 128,000
TRANSFER GRAFFITI ASMTS56325-0 9,624 23,000 23,000
TRANSFER BOARD UP ASMTS56330-0 88,150 205,000 205,000
TRANSFER CERT OF OCCUPANCY ASMTS56340-0 169,490 123,424 123,424
TRANSFER VACANT BUILDINGS ASMTS56345-0 351,873 749,221 749,221
TOTAL FOR OTHER FINANCING SOURCES 1,851,988 2,405,422 3,177,720 3,177,720
17,280,800 TOTAL FOR CITY GENERAL FUND 17,067,639 18,421,438 15,978,185 1,302,615
As of August 1st, 2015, actual spending and financing amounts for 2014 listed above remain unaudited due to a delay in the 2014 financial audit. Because of this delay, these reports may significantly deviate from final audited numbers.
419
CITY OF SAINT PAULFinancing by Company and Department
Budget Year:
CITY OF SAINT PAULCompany:
Department: SAFETY AND INSPECTION
Change From
2015Adopted
2014Actuals
2013Actuals
Account Account Description
2015Adopted
2016Mayor's
Proposed
Fund: ASSESSMENT FINANCING 2016
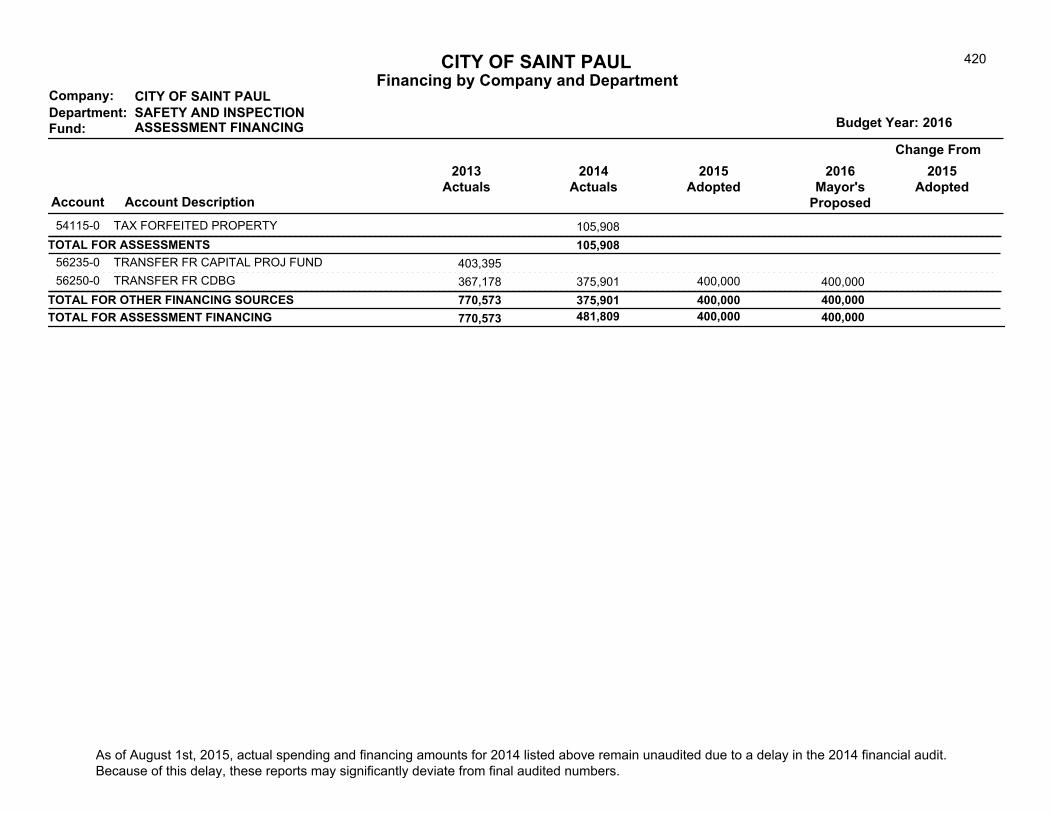
TAX FORFEITED PROPERTY54115-0 105,908
TOTAL FOR ASSESSMENTS 105,908
TRANSFER FR CAPITAL PROJ FUND56235-0 403,395
TRANSFER FR CDBG56250-0 367,178 375,901 400,000 400,000
TOTAL FOR OTHER FINANCING SOURCES 770,573 375,901 400,000 400,000
400,000 TOTAL FOR ASSESSMENT FINANCING 770,573 481,809 400,000
As of August 1st, 2015, actual spending and financing amounts for 2014 listed above remain unaudited due to a delay in the 2014 financial audit. Because of this delay, these reports may significantly deviate from final audited numbers.
420

CITY OF SAINT PAULFinancing by Company and Department
Budget Year:
CITY OF SAINT PAULCompany:
Department: SAFETY AND INSPECTION
Change From
2015Adopted
2014Actuals
2013Actuals
Account Account Description
2015Adopted
2016Mayor's
Proposed
Fund: CHARITABLE GAMBLING 2016
GAMBLING TAX40710-0 9,266 136,357 134,024 136,249 145,515
9,266 TOTAL FOR TAXES 136,357 134,024 136,249 145,515
INTEREST INTERNAL POOL54505-0 1,544
TOTAL FOR INVESTMENT EARNINGS 1,544
145,515 TOTAL FOR CHARITABLE GAMBLING 136,357 135,568 136,249 9,266
As of August 1st, 2015, actual spending and financing amounts for 2014 listed above remain unaudited due to a delay in the 2014 financial audit. Because of this delay, these reports may significantly deviate from final audited numbers.
421

CITY OF SAINT PAULFinancing by Company and Department
Budget Year:
CITY OF SAINT PAULCompany:
Department: SAFETY AND INSPECTION
Change From
2015Adopted
2014Actuals
2013Actuals
Account Account Description
2015Adopted
2016Mayor's
Proposed
Fund: CITY CAPITAL PROJECTS 2016
INTRA FUND IN BOND DRAW56110-0 176,622
TRANSFER FROM CIB56255-0 128,381 (128,919)
TOTAL FOR OTHER FINANCING SOURCES 128,381 47,703
TOTAL FOR CITY CAPITAL PROJECTS 128,381 47,703
16,514,434 17,826,315 1,311,881 TOTAL FOR SAFETY AND INSPECTION 19,086,518 18,102,950
As of August 1st, 2015, actual spending and financing amounts for 2014 listed above remain unaudited due to a delay in the 2014 financial audit. Because of this delay, these reports may significantly deviate from final audited numbers.
422

CITY OF SAINT PAULFinancing Plan by Department
Department:Fund: Budget Year: 2016
SAFETY AND INSPECTIONCITY GENERAL FUND
2013Actuals
Change From
2014Actuals
2015Adopted
2016Mayor's
Proposed
2015Adopted
Financing by Major Account
10,796,051 10,815,883 7,506,869 8,413,805 LICENSE AND PERMIT 906,936
4,341,297 5,040,256 5,226,596 5,622,275 CHARGES FOR SERVICES 395,679
77,843 86,019 67,000 67,000 FINE AND FORFEITURE
71,200 ASSESSMENTS
459 2,659 MISCELLANEOUS REVENUE
1,851,988 2,405,422 3,177,720 3,177,720 OTHER FINANCING SOURCES
1,302,615 17,280,800 15,978,185 18,421,438 17,067,639 Total Financing by Major Account
Financing by Accounting UnitDSI ADMINISTRATION 63,860 2,821,776 3,031,826 1,824,172 10024100 (210,050)PROPERTY CODE ENFOREMENT 266,688 201,000 201,000 204,920 10024200VACANT BLDG CODE ENFORCEMENT 1,480,890 1,062,828 1,039,206 1,168,925 10024205 23,622 SUMMARY NUISANCE ABATEMENT 733,954 10024210TRUTH IN SALE OF HOUSING 157,831 154,500 179,500 156,684 10024215 (25,000)CONSTRUCTION SVCS AND PERMITS 9,590,407 9,602,561 8,577,094 10,886,453 10024300 1,025,467 FIRE CERTIFICATE OF OCCUPANCY 1,573,838 1,544,891 1,648,284 1,389,212 10024400 (103,393)BUSINESS AND TRADE LICENSE 2,641,691 1,279,744 1,021,275 2,439,356 10024500 258,469 ZONING 280,441 363,650 145,000 204,949 10024505 218,650 ANIMAL AND PEST CONTROL 264,381 249,850 135,000 129,590 10024510 114,850 ENVIRONMENTAL HEALTH 13,657 17,177 10024515
Total Financing by Accounting Unit 17,067,639 17,280,800 1,302,615 18,421,438 15,978,185
As of August 1st, 2015, actual spending and financing amounts for 2014 listed above remain unaudited due to a delay in the 2014 financial audit. Because of this delay, these reports may significantly deviate from final audited numbers. 423

CITY OF SAINT PAULFinancing Plan by Department
Department:Fund: Budget Year: 2016
SAFETY AND INSPECTIONASSESSMENT FINANCING
2013Actuals
Change From
2014Actuals
2015Adopted
2016Mayor's
Proposed
2015Adopted
Financing by Major Account
105,908 ASSESSMENTS
770,573 375,901 400,000 400,000 OTHER FINANCING SOURCES
400,000 400,000 481,809 770,573 Total Financing by Major Account
Financing by Accounting UnitNUISANCE BUILDINGS ABATEMENT 770,573 400,000 400,000 481,809 21524250
Total Financing by Accounting Unit 770,573 400,000 481,809 400,000
As of August 1st, 2015, actual spending and financing amounts for 2014 listed above remain unaudited due to a delay in the 2014 financial audit. Because of this delay, these reports may significantly deviate from final audited numbers.
424

CITY OF SAINT PAULFinancing Plan by Department
Department:Fund: Budget Year: 2016
SAFETY AND INSPECTIONCHARITABLE GAMBLING
2013Actuals
Change From
2014Actuals
2015Adopted
2016Mayor's
Proposed
2015Adopted
Financing by Major Account
136,357 134,024 136,249 145,515 TAXES 9,266
1,544 INVESTMENT EARNINGS
9,266 145,515 136,249 135,568 136,357 Total Financing by Major Account
Financing by Accounting UnitGAMBLING ENFORCEMENT 136,357 145,515 136,249 135,568 22824550 9,266
Total Financing by Accounting Unit 136,357 145,515 9,266 135,568 136,249
As of August 1st, 2015, actual spending and financing amounts for 2014 listed above remain unaudited due to a delay in the 2014 financial audit. Because of this delay, these reports may significantly deviate from final audited numbers. 425

CITY OF SAINT PAULFinancing Plan by Department
Department:Fund: Budget Year: 2016
SAFETY AND INSPECTIONCITY CAPITAL PROJECTS
2013Actuals
Change From
2014Actuals
2015Adopted
2016Mayor's
Proposed
2015Adopted
Financing by Major Account
128,381 47,703 OTHER FINANCING SOURCES
47,703 128,381 Total Financing by Major Account
Financing by Accounting UnitSAFETY INSPECT CAPITAL MAINT 128,381 47,703 40024950
Total Financing by Accounting Unit 128,381 47,703
As of August 1st, 2015, actual spending and financing amounts for 2014 listed above remain unaudited due to a delay in the 2014 financial audit. Because of this delay, these reports may significantly deviate from final audited numbers.
426
Top Related