


Languages
Pages
Legal

2020 Private SaaS Company Survey
1
11TH ANNUAL
SAAS SURVEY RESULTS
2020
COVID EDITION
THROUGH MAY 31, 2020
2020 Private SaaS Company Survey
2
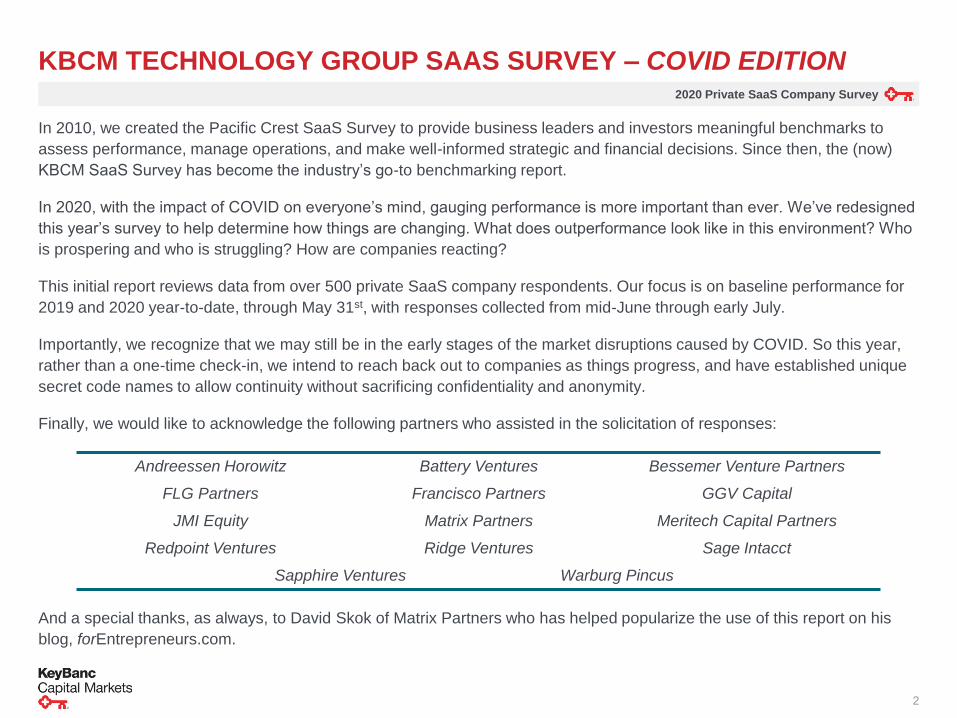
KBCM TECHNOLOGY GROUP SAAS SURVEY – COVID EDITION
In 2010, we created the Pacific Crest SaaS Survey to provide business leaders and investors meaningful benchmarks to
assess performance, manage operations, and make well-informed strategic and financial decisions. Since then, the (now)
KBCM SaaS Survey has become the industry’s go-to benchmarking report.
In 2020, with the impact of COVID on everyone’s mind, gauging performance is more important than ever. We’ve redesigned
this year’s survey to help determine how things are changing. What does outperformance look like in this environment? Who
is prospering and who is struggling? How are companies reacting?
This initial report reviews data from over 500 private SaaS company respondents. Our focus is on baseline performance for
2019 and 2020 year-to-date, through May 31st, with responses collected from mid-June through early July.
Importantly, we recognize that we may still be in the early stages of the market disruptions caused by COVID. So this year,
rather than a one-time check-in, we intend to reach back out to companies as things progress, and have established unique
secret code names to allow continuity without sacrificing confidentiality and anonymity.
Finally, we would like to acknowledge the following partners who assisted in the solicitation of responses:
Andreessen Horowitz Battery Ventures Bessemer Venture Partners
FLG Partners Francisco Partners GGV Capital
JMI Equity Matrix Partners Meritech Capital Partners
Redpoint Ventures Ridge Ventures Sage Intacct
Sapphire Ventures Warburg Pincus
And a special thanks, as always, to David Skok of Matrix Partners who has helped popularize the use of this report on his
blog, forEntrepreneurs.com.
2020 Private SaaS Company Survey
3
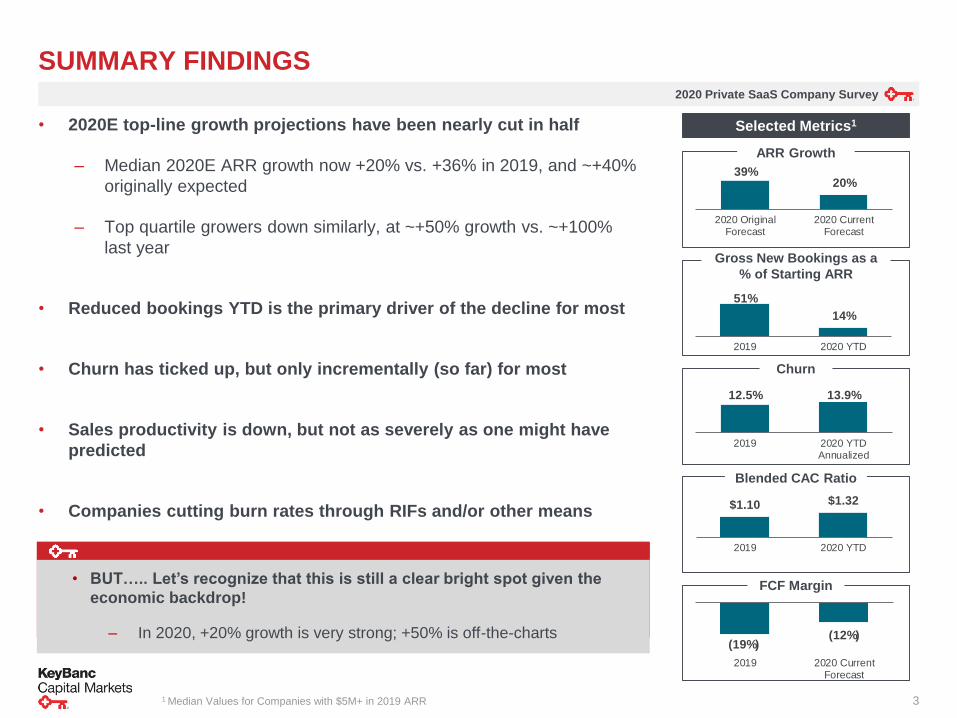
SUMMARY FINDINGS
Selected Metrics1• 2020E top-line growth projections have been nearly cut in half
– Median 2020E ARR growth now +20% vs. +36% in 2019, and ~+40%
originally expected
– Top quartile growers down similarly, at ~+50% growth vs. ~+100%
last year
• Reduced bookings YTD is the primary driver of the decline for most
• Churn has ticked up, but only incrementally (so far) for most
• Sales productivity is down, but not as severely as one might have
predicted
• Companies cutting burn rates through RIFs and/or other means
ARR Growth
39%20%
2020 OriginalForecast
2020 CurrentForecast
51%
14%
2019 2020 YTD
12.5% 13.9%
2019 2020 YTDAnnualized
Gross New Bookings as a
% of Starting ARR
Churn
Blended CAC Ratio
FCF Margin
1 Median Values for Companies with $5M+ in 2019 ARR
• BUT….. Let’s recognize that this is still a clear bright spot given the
economic backdrop!
‒ In 2020, +20% growth is very strong; +50% is off-the-charts(19%)
(12%)
2019 2020 CurrentForecast
$1.10 $1.32
2019 2020 YTD
2020 Private SaaS Company Survey
4
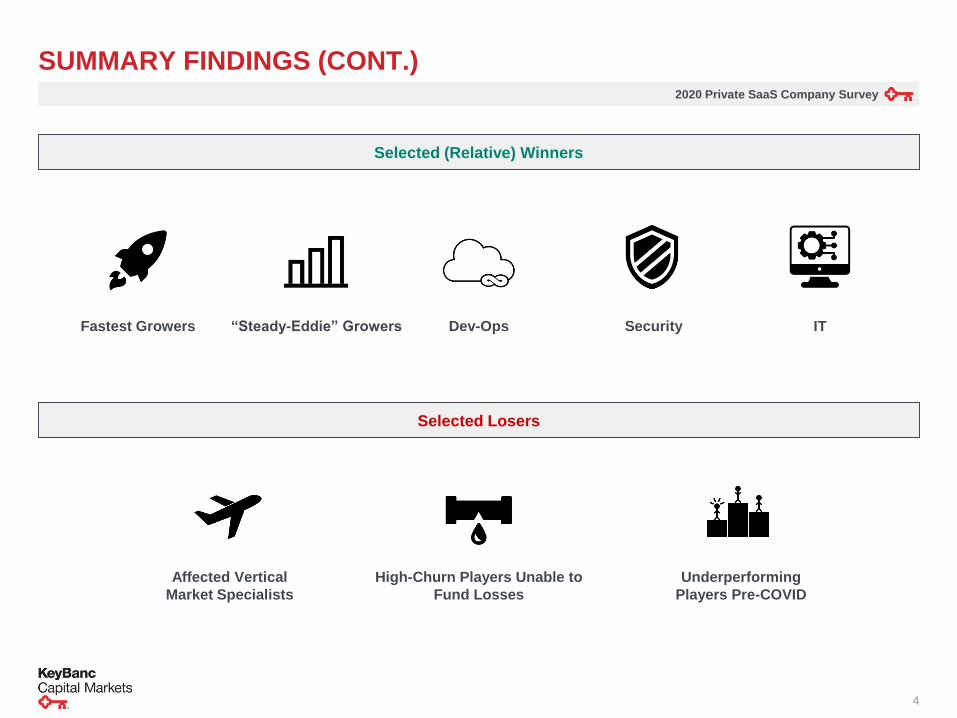
SUMMARY FINDINGS (CONT.)
Selected (Relative) Winners
Fastest Growers ITSecurityDev-Ops“Steady-Eddie” Growers
Affected Vertical
Market Specialists
Underperforming
Players Pre-COVID
High-Churn Players Unable to
Fund Losses
Selected Losers
2020 Private SaaS Company Survey
5
LAST YEAR VS. THIS YEAR – DIFFERENT WORLDS!
2020 Private SaaS Company Survey
6
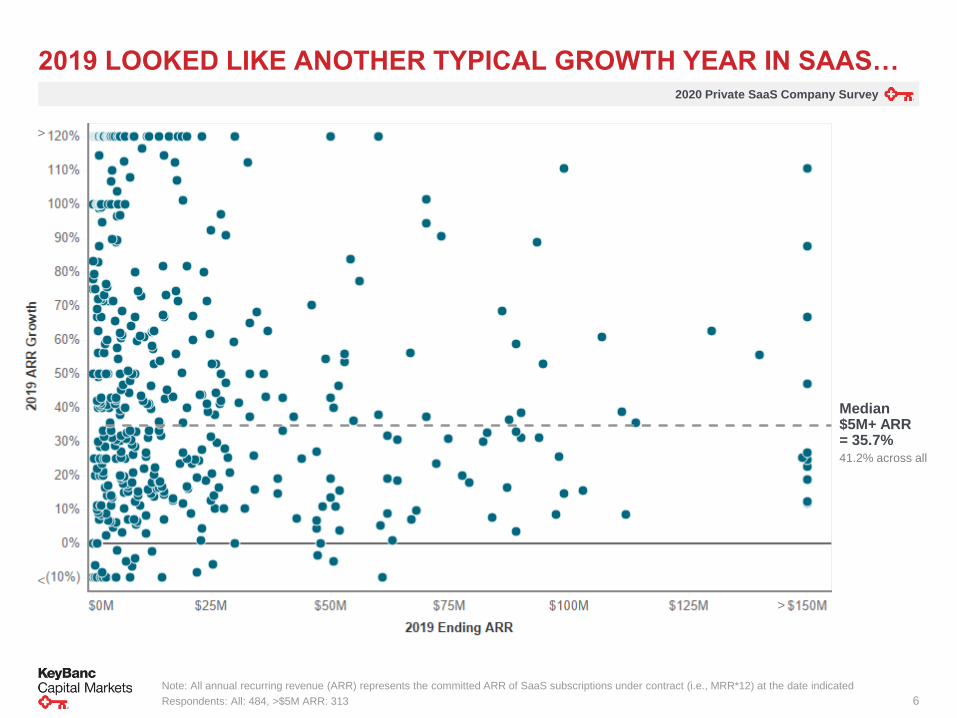
2019 LOOKED LIKE ANOTHER TYPICAL GROWTH YEAR IN SAAS…
Median $5M+ ARR = 35.7%41.2% across all
>
Note: All annual recurring revenue (ARR) represents the committed ARR of SaaS subscriptions under contract (i.e., MRR*12) at the date indicated
Respondents: All: 484, >$5M ARR: 313
>
<
2020 Private SaaS Company Survey
7
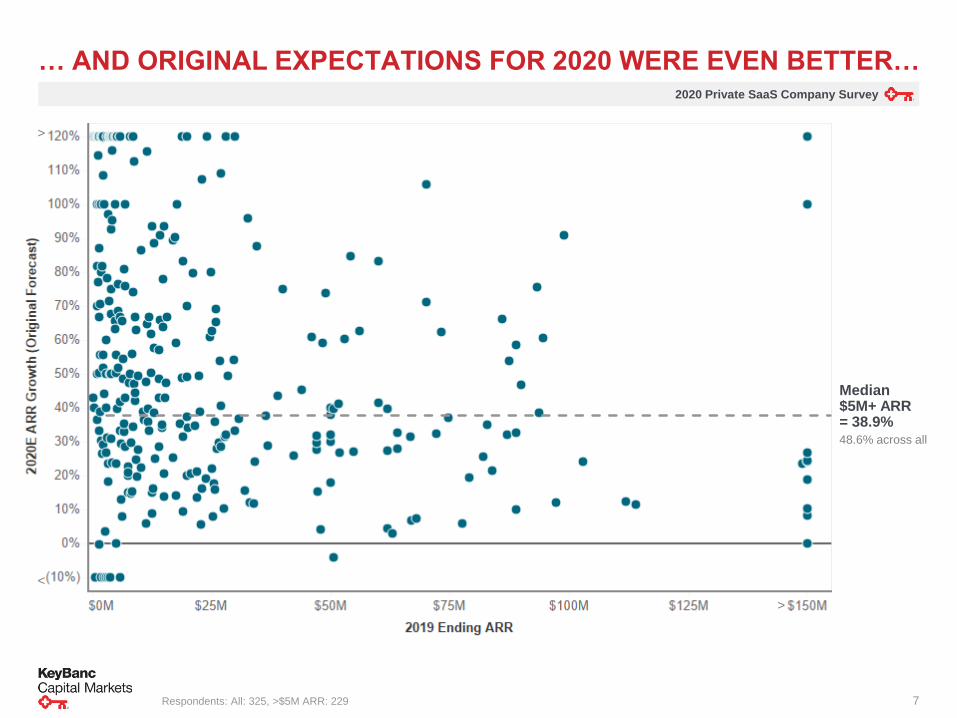
… AND ORIGINAL EXPECTATIONS FOR 2020 WERE EVEN BETTER…
Respondents: All: 325, >$5M ARR: 229
>
>
<
Median $5M+ ARR = 38.9%48.6% across all
2020 Private SaaS Company Survey
8
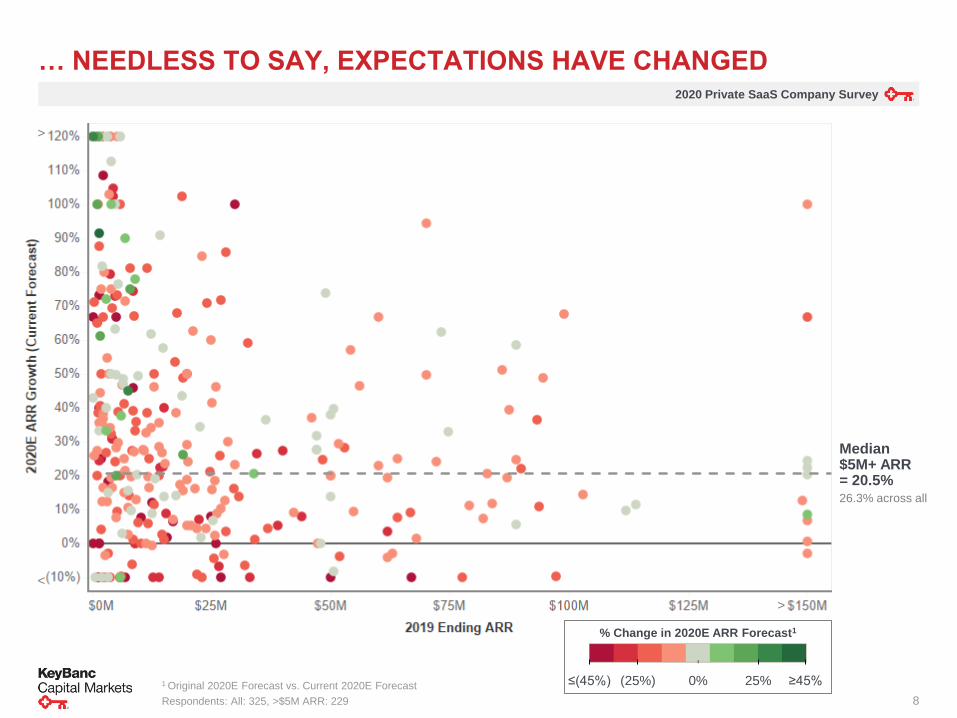
… NEEDLESS TO SAY, EXPECTATIONS HAVE CHANGED
1 Original 2020E Forecast vs. Current 2020E Forecast
Respondents: All: 325, >$5M ARR: 229
>
>
<
% Change in 2020E ARR Forecast1
≤(45%) ≥45%0%(25%) 25%
Median $5M+ ARR = 20.5%26.3% across all
2020 Private SaaS Company Survey
9
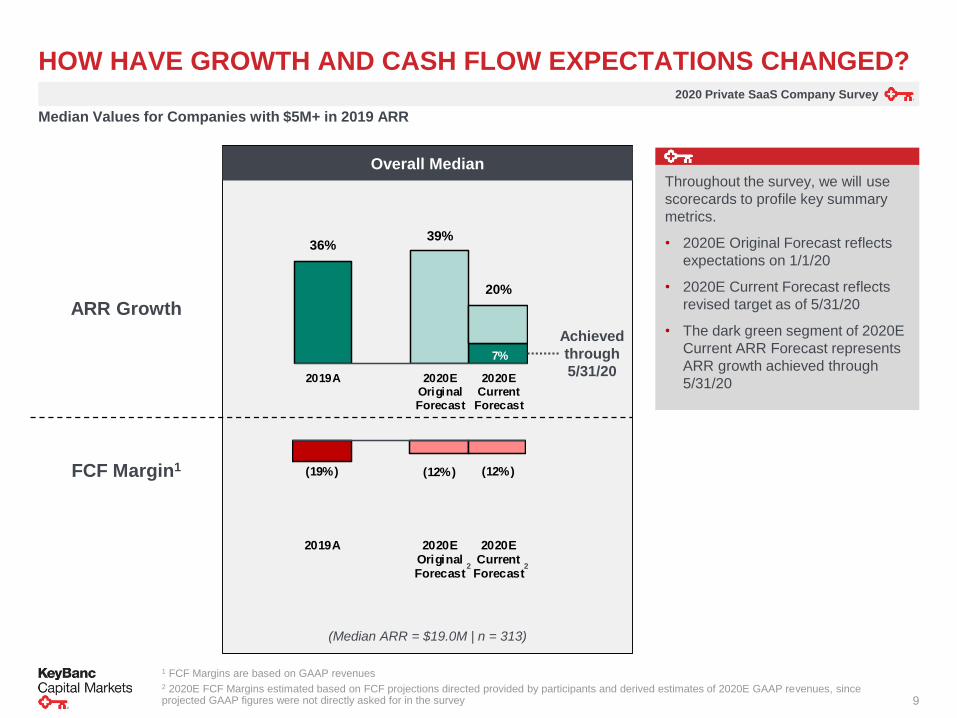
HOW HAVE GROWTH AND CASH FLOW EXPECTATIONS CHANGED?
Median Values for Companies with $5M+ in 2019 ARR
Overall Median
ARR Growth
(Median ARR = $19.0M | n = 313)
FCF Margin1
Achieved
through
5/31/20
(19%) (12%) (12%)
2019A 2020EOriginalForecast
2020ECurrent
Forecast
7%
36% 39%
20%
2019A 2020EOriginalForecast
2020ECurrent
Forecast
1 FCF Margins are based on GAAP revenues2 2020E FCF Margins estimated based on FCF projections directed provided by participants and derived estimates of 2020E GAAP revenues, since projected GAAP figures were not directly asked for in the survey
22
Throughout the survey, we will use
scorecards to profile key summary
metrics.
• 2020E Original Forecast reflects
expectations on 1/1/20
• 2020E Current Forecast reflects
revised target as of 5/31/20
• The dark green segment of 2020E
Current ARR Forecast represents
ARR growth achieved through
5/31/20
2020 Private SaaS Company Survey
10
WHAT IS IMPACTING PERFORMANCE?
2020 Private SaaS Company Survey
11
0%
5%
10%
15%
20%
25%
0% - 5% 5% - 10% 10% -
15%
15% -
20%
20% -
25%
25% -
30%
30% -
35%
35% -
40%
40% -
45%
45% -
50%
50% -
55%
55% -
60%
60%+
% o
f R
esp
on
de
nts
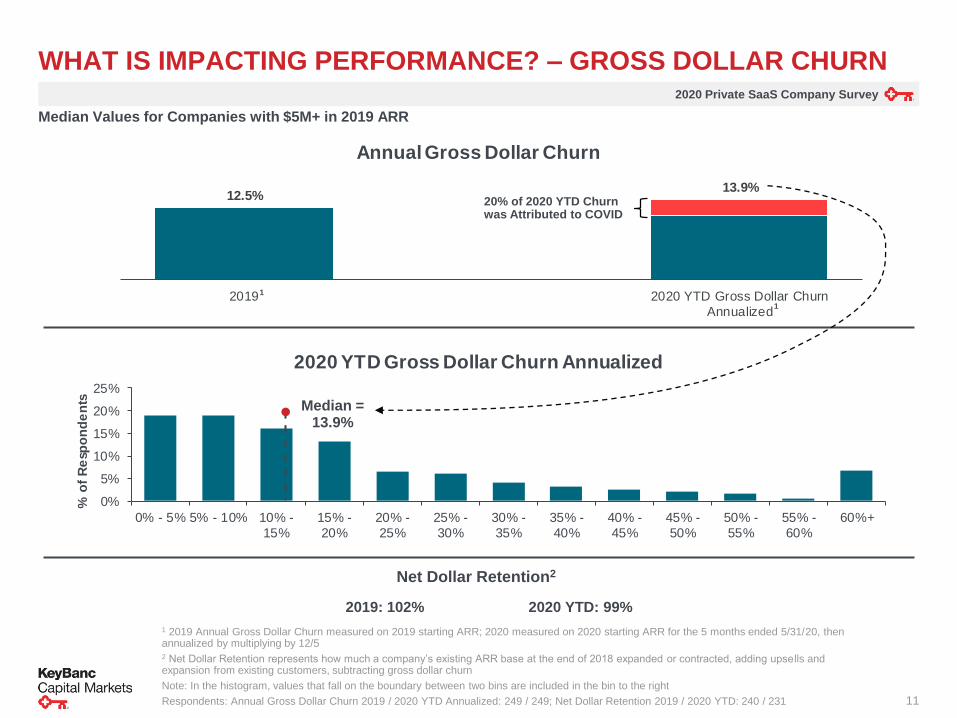
2020 YTD Gross Dollar Churn Annualized
12.5% 13.9%
2019 2020 YTD Gross Dollar Churn
Annualized
Annual Gross Dollar Churn
WHAT IS IMPACTING PERFORMANCE? – GROSS DOLLAR CHURN
1 2019 Annual Gross Dollar Churn measured on 2019 starting ARR; 2020 measured on 2020 starting ARR for the 5 months ended 5/31/20, then annualized by multiplying by 12/52 Net Dollar Retention represents how much a company’s existing ARR base at the end of 2018 expanded or contracted, adding upsells and expansion from existing customers, subtracting gross dollar churn
Note: In the histogram, values that fall on the boundary between two bins are included in the bin to the right
Respondents: Annual Gross Dollar Churn 2019 / 2020 YTD Annualized: 249 / 249; Net Dollar Retention 2019 / 2020 YTD: 240 / 231
20% of 2020 YTD Churn was Attributed to COVID
Median = 13.9%
Net Dollar Retention2
2019: 102% 2020 YTD: 99%
Median Values for Companies with $5M+ in 2019 ARR
1
1
2020 Private SaaS Company Survey
12
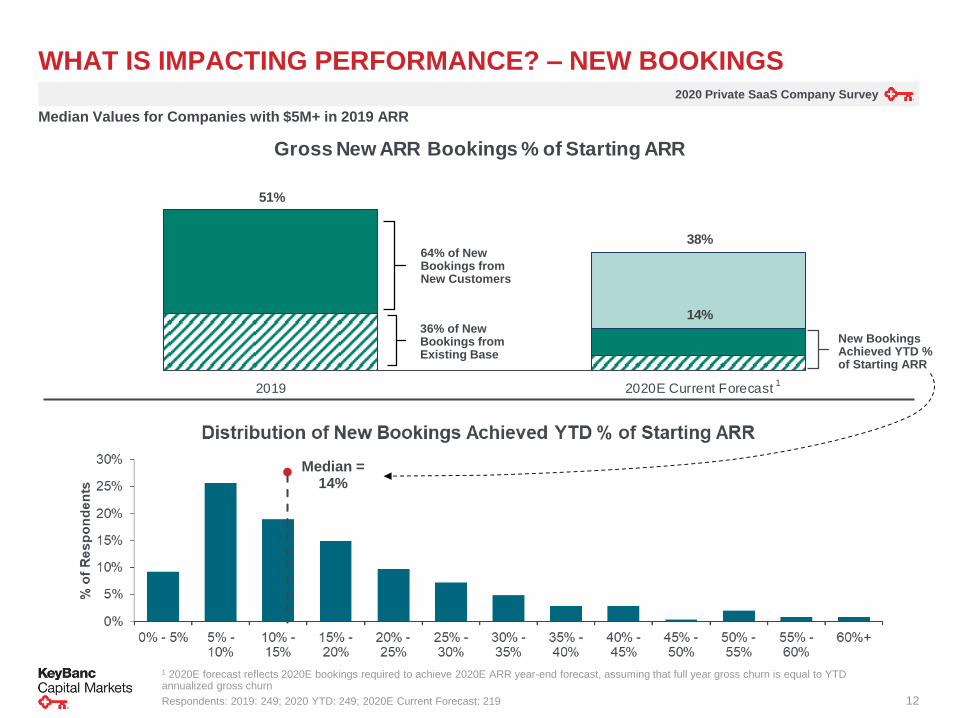
WHAT IS IMPACTING PERFORMANCE? – NEW BOOKINGS
Median = 14%
1 2020E forecast reflects 2020E bookings required to achieve 2020E ARR year-end forecast, assuming that full year gross churn is equal to YTD annualized gross churn
Respondents: 2019: 249; 2020 YTD: 249; 2020E Current Forecast: 219
Median Values for Companies with $5M+ in 2019 ARR
New Bookings Achieved YTD % of Starting ARR
64% of New Bookings from New Customers
36% of New Bookings from Existing Base
1
14%
51%
38%
2019 2020E Current Forecast
Gross New ARR Bookings % of Starting ARR
2020 Private SaaS Company Survey
13
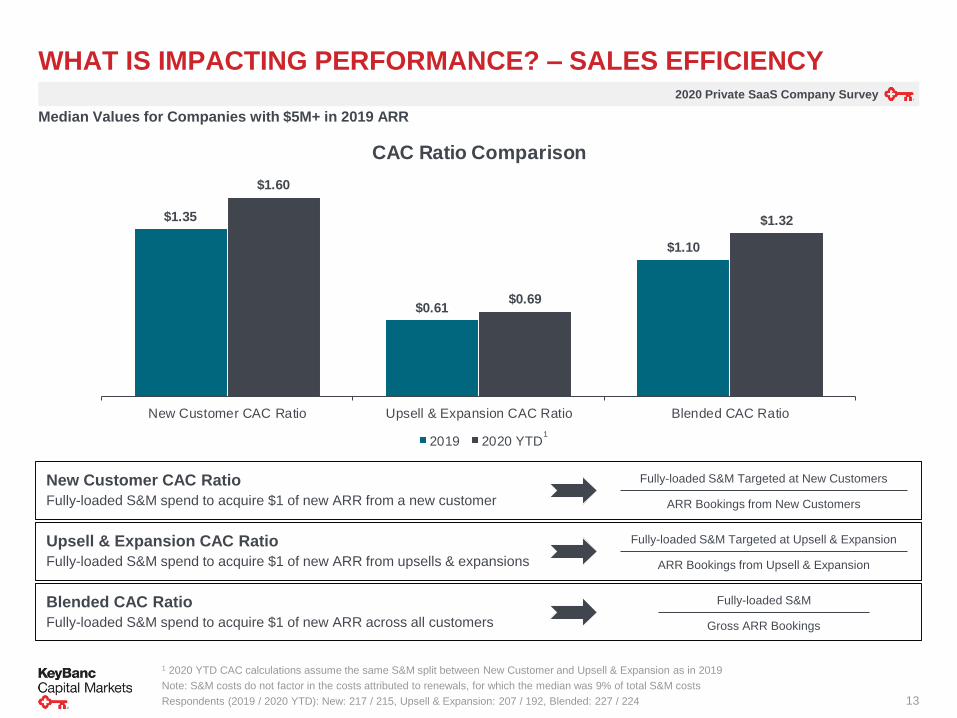
$1.35
$0.61
$1.10
$1.60
$0.69
$1.32
New Customer CAC Ratio Upsell & Expansion CAC Ratio Blended CAC Ratio
CAC Ratio Comparison
2019 2020 YTD
1 2020 YTD CAC calculations assume the same S&M split between New Customer and Upsell & Expansion as in 2019
Note: S&M costs do not factor in the costs attributed to renewals, for which the median was 9% of total S&M costs
Respondents (2019 / 2020 YTD): New: 217 / 215, Upsell & Expansion: 207 / 192, Blended: 227 / 224
1
Median Values for Companies with $5M+ in 2019 ARR
Upsell & Expansion CAC Ratio
Fully-loaded S&M spend to acquire $1 of new ARR from upsells & expansions
Fully-loaded S&M Targeted at Upsell & Expansion
ARR Bookings from Upsell & Expansion
New Customer CAC Ratio
Fully-loaded S&M spend to acquire $1 of new ARR from a new customer
Fully-loaded S&M Targeted at New Customers
ARR Bookings from New Customers
Blended CAC Ratio
Fully-loaded S&M spend to acquire $1 of new ARR across all customers
Fully-loaded S&M
Gross ARR Bookings
WHAT IS IMPACTING PERFORMANCE? – SALES EFFICIENCY
2020 Private SaaS Company Survey
14
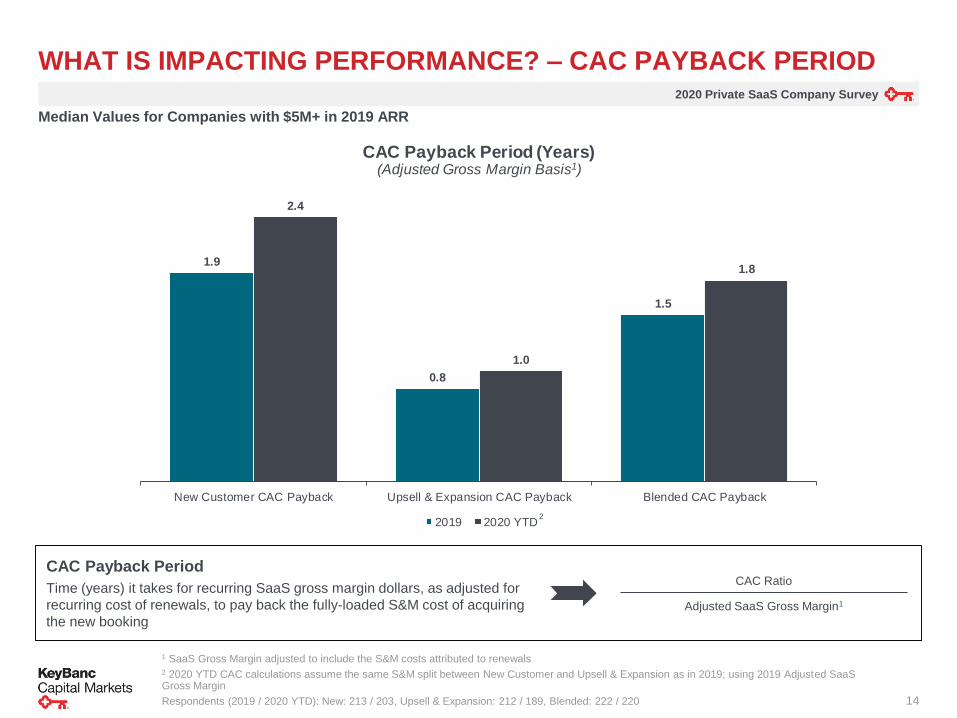
1.9
0.8
1.5
2.4
1.0
1.8
New Customer CAC Payback Upsell & Expansion CAC Payback Blended CAC Payback
CAC Payback Period (Years) (Adjusted Gross Margin Basis1)
2019 2020 YTD
WHAT IS IMPACTING PERFORMANCE? – CAC PAYBACK PERIOD
2
1 SaaS Gross Margin adjusted to include the S&M costs attributed to renewals2 2020 YTD CAC calculations assume the same S&M split between New Customer and Upsell & Expansion as in 2019; using 2019 Adjusted SaaS Gross Margin
Respondents (2019 / 2020 YTD): New: 213 / 203, Upsell & Expansion: 212 / 189, Blended: 222 / 220
Median Values for Companies with $5M+ in 2019 ARR
CAC Payback Period
Time (years) it takes for recurring SaaS gross margin dollars, as adjusted for
recurring cost of renewals, to pay back the fully-loaded S&M cost of acquiring
the new booking
CAC Ratio
Adjusted SaaS Gross Margin1
2020 Private SaaS Company Survey
15
WHICH COMPANIES ARE MOST IMPACTED?
2020 Private SaaS Company Survey
16
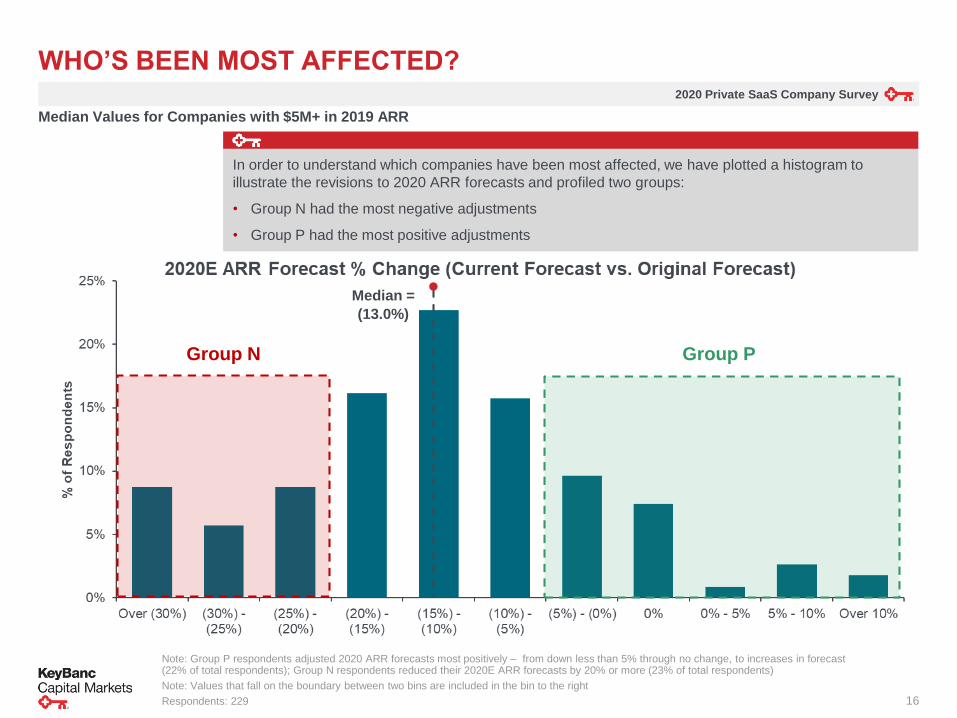
WHO’S BEEN MOST AFFECTED?
Group N Group P
Note: Group P respondents adjusted 2020 ARR forecasts most positively – from down less than 5% through no change, to increases in forecast (22% of total respondents); Group N respondents reduced their 2020E ARR forecasts by 20% or more (23% of total respondents)
Note: Values that fall on the boundary between two bins are included in the bin to the right
Respondents: 229
Median =
(13.0%)
Median Values for Companies with $5M+ in 2019 ARR
In order to understand which companies have been most affected, we have plotted a histogram to
illustrate the revisions to 2020 ARR forecasts and profiled two groups:
• Group N had the most negative adjustments
• Group P had the most positive adjustments
2020 Private SaaS Company Survey
17
1 Reflects 23% of respondents2 Reflects 22% of respondents3 2020 YTD4 Across all customers
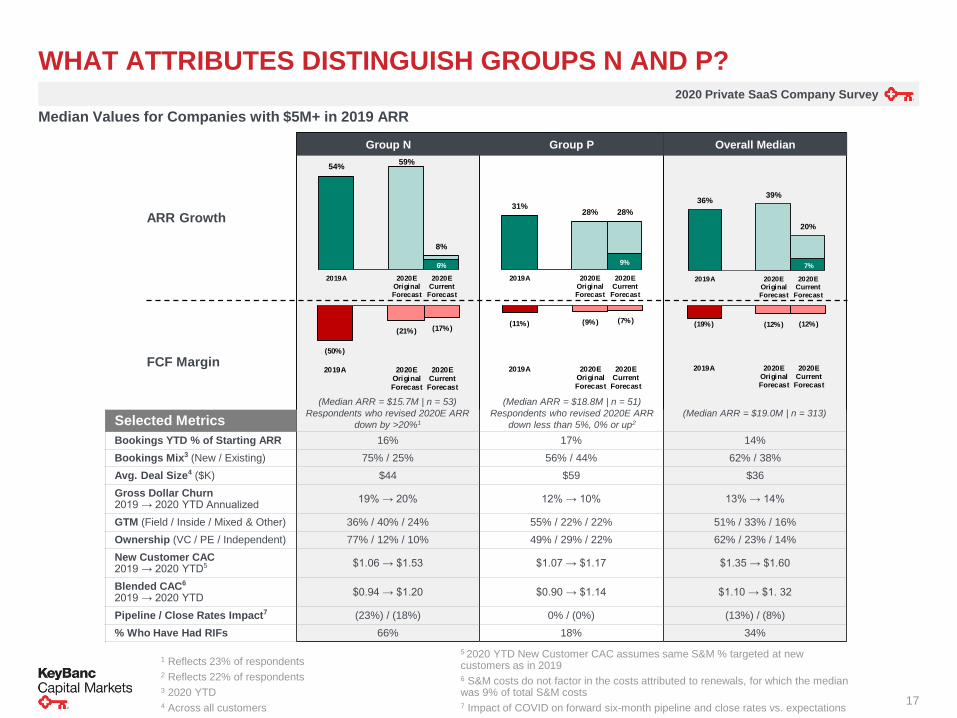
WHAT ATTRIBUTES DISTINGUISH GROUPS N AND P?
Group N Group P Overall Median
ARR Growth
FCF Margin
Selected Metrics
Bookings YTD % of Starting ARR 16% 17% 14%
Bookings Mix3 (New / Existing) 75% / 25% 56% / 44% 62% / 38%
Avg. Deal Size4 ($K) $44 $59 $36
Gross Dollar Churn2019 → 2020 YTD Annualized
19% → 20% 12% → 10% 13% → 14%
GTM (Field / Inside / Mixed & Other) 36% / 40% / 24% 55% / 22% / 22% 51% / 33% / 16%
Ownership (VC / PE / Independent) 77% / 12% / 10% 49% / 29% / 22% 62% / 23% / 14%
New Customer CAC2019 → 2020 YTD5 $1.06 → $1.53 $1.07 → $1.17 $1.35 → $1.60
Blended CAC6
2019 → 2020 YTD$0.94 → $1.20 $0.90 → $1.14 $1.10 → $1. 32
Pipeline / Close Rates Impact7 (23%) / (18%) 0% / (0%) (13%) / (8%)
% Who Have Had RIFs 66% 18% 34%
(Median ARR = $15.7M | n = 53)
Respondents who revised 2020E ARR
down by >20%1
(Median ARR = $18.8M | n = 51)
Respondents who revised 2020E ARR
down less than 5%, 0% or up2
(Median ARR = $19.0M | n = 313)
9%
31% 28% 28%
2019A 2020EOriginalForecast
2020ECurrentForecast
(11%) (9%) (7%)
2019A 2020EOriginalForecast
2020ECurrentForecast
6%
54% 59%
8%
2019A 2020EOriginalForecast
2020ECurrent
Forecast
(50%)
(21%) (17%)
2019A 2020EOriginalForecast
2020ECurrentForecast
(19%) (12%) (12%)
2019A 2020EOriginalForecast
2020ECurrentForecast
7%
36% 39%
20%
2019A 2020EOriginalForecast
2020ECurrent
Forecast
Median Values for Companies with $5M+ in 2019 ARR
5 2020 YTD New Customer CAC assumes same S&M % targeted at new customers as in 20196 S&M costs do not factor in the costs attributed to renewals, for which the median was 9% of total S&M costs7 Impact of COVID on forward six-month pipeline and close rates vs. expectations
2020 Private SaaS Company Survey
18
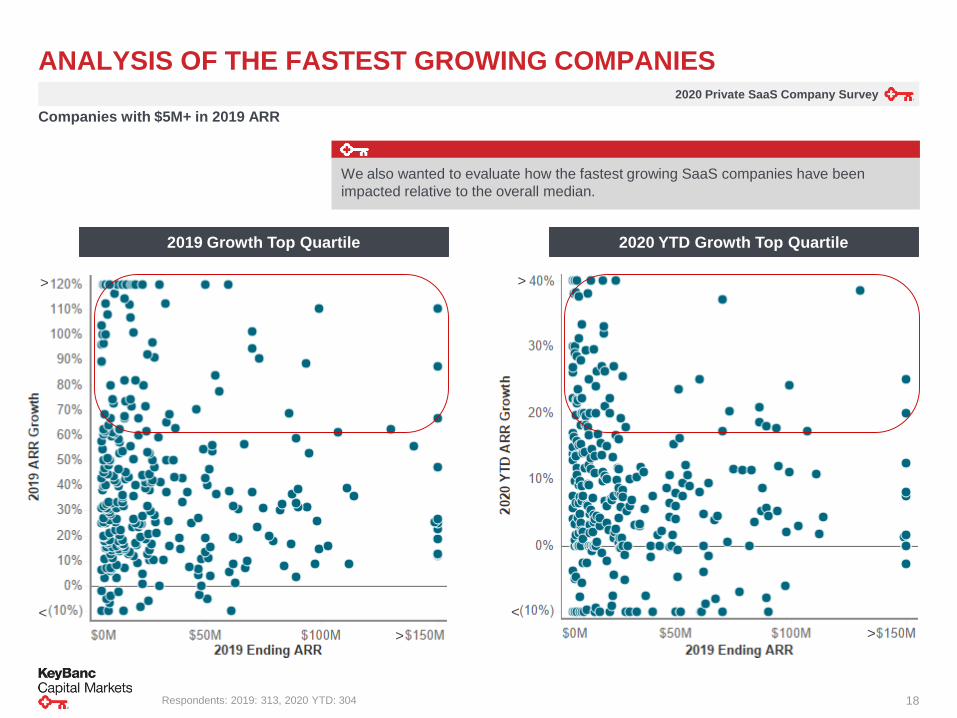
ANALYSIS OF THE FASTEST GROWING COMPANIES
Companies with $5M+ in 2019 ARR
Respondents: 2019: 313, 2020 YTD: 304
>
<
>
>
<
>
2019 Growth Top Quartile 2020 YTD Growth Top Quartile
We also wanted to evaluate how the fastest growing SaaS companies have been
impacted relative to the overall median.
2020 Private SaaS Company Survey
19
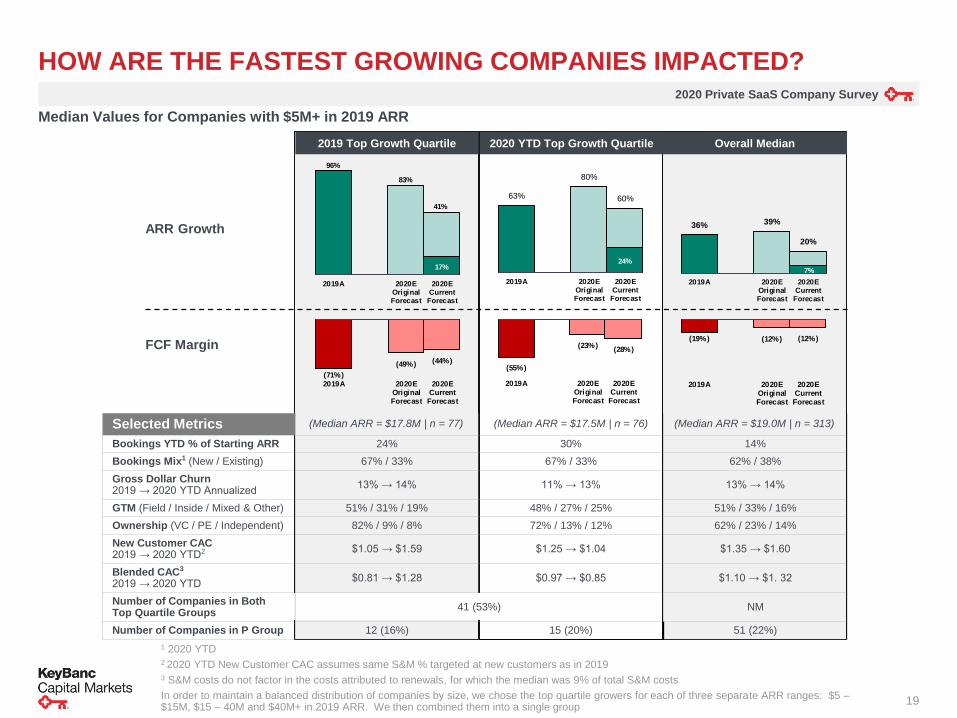
HOW ARE THE FASTEST GROWING COMPANIES IMPACTED?
2019 Top Growth Quartile 2020 YTD Top Growth Quartile Overall Median
ARR Growth
FCF Margin
Selected Metrics
Bookings YTD % of Starting ARR 24% 30% 14%
Bookings Mix1 (New / Existing) 67% / 33% 67% / 33% 62% / 38%
Gross Dollar Churn2019 → 2020 YTD Annualized
13% → 14% 11% → 13% 13% → 14%
GTM (Field / Inside / Mixed & Other) 51% / 31% / 19% 48% / 27% / 25% 51% / 33% / 16%
Ownership (VC / PE / Independent) 82% / 9% / 8% 72% / 13% / 12% 62% / 23% / 14%
New Customer CAC2019 → 2020 YTD2 $1.05 → $1.59 $1.25 → $1.04 $1.35 → $1.60
Blended CAC3
2019 → 2020 YTD$0.81 → $1.28 $0.97 → $0.85 $1.10 → $1. 32
Number of Companies in Both Top Quartile Groups
41 (53%) NM
Number of Companies in P Group 12 (16%) 15 (20%) 51 (22%)
1 2020 YTD2 2020 YTD New Customer CAC assumes same S&M % targeted at new customers as in 20193 S&M costs do not factor in the costs attributed to renewals, for which the median was 9% of total S&M costs
In order to maintain a balanced distribution of companies by size, we chose the top quartile growers for each of three separate ARR ranges: $5 –$15M, $15 – 40M and $40M+ in 2019 ARR. We then combined them into a single group
(Median ARR = $17.8M | n = 77) (Median ARR = $17.5M | n = 76) (Median ARR = $19.0M | n = 313)
(19%) (12%) (12%)
2019A 2020EOriginalForecast
2020ECurrentForecast
(71%)
(49%) (44%)
2019A 2020EOriginalForecast
2020ECurrentForecast
(55%)
(23%)(28%)
2019A 2020EOriginalForecast
2020ECurrentForecast
17%
96%
83%
41%
2019A 2020EOriginalForecast
2020ECurrentForecast
24%
63%
80%
60%
2019A 2020EOriginalForecast
2020ECurrent
Forecast
7%
36% 39%
20%
2019A 2020EOriginalForecast
2020ECurrent
Forecast
Median Values for Companies with $5M+ in 2019 ARR
2020 Private SaaS Company Survey
20
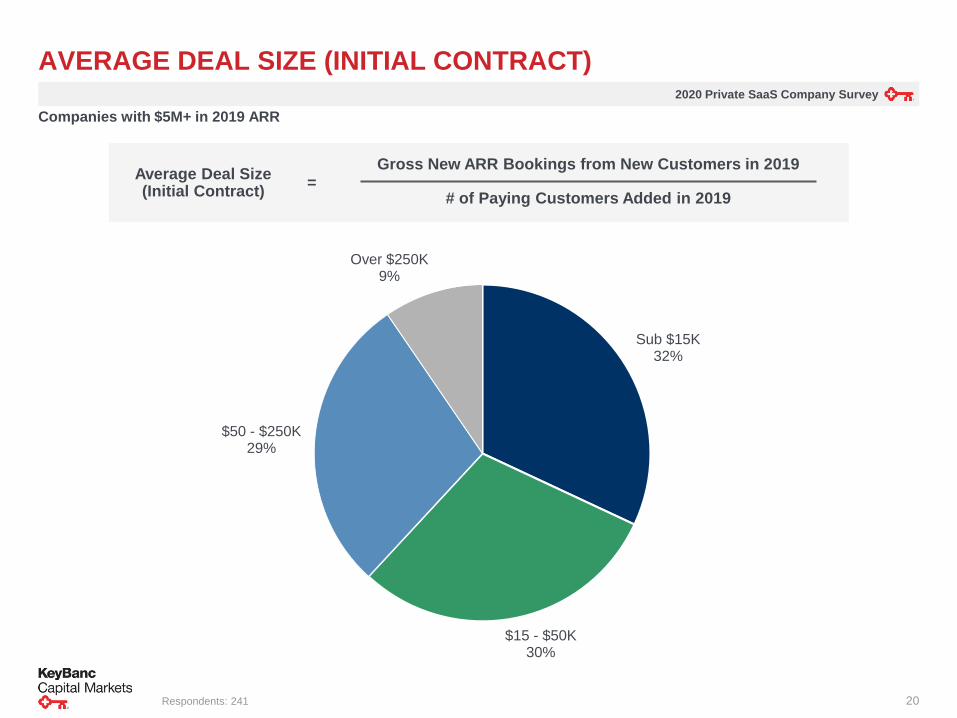
AVERAGE DEAL SIZE (INITIAL CONTRACT)
Sub $15K32%
$15 - $50K30%
$50 - $250K29%
Over $250K9%
Gross New ARR Bookings from New Customers in 2019
# of Paying Customers Added in 2019=
Average Deal Size(Initial Contract)
Respondents: 241
Companies with $5M+ in 2019 ARR
2020 Private SaaS Company Survey
21
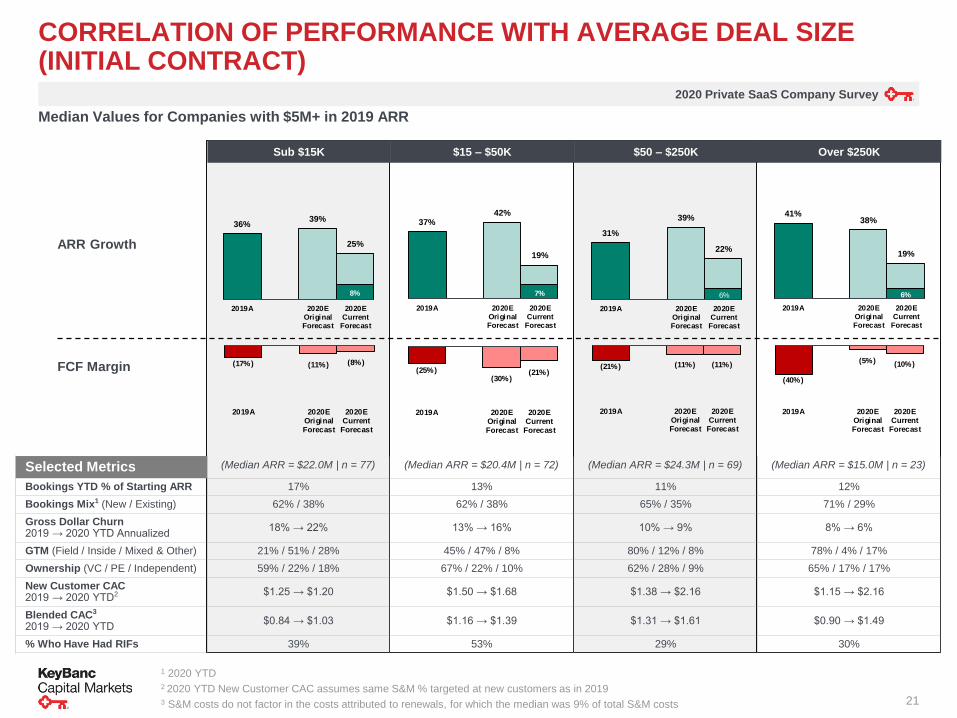
CORRELATION OF PERFORMANCE WITH AVERAGE DEAL SIZE (INITIAL CONTRACT)
Sub $15K $15 – $50K $50 – $250K Over $250K
ARR Growth
FCF Margin
Selected Metrics
Bookings YTD % of Starting ARR 17% 13% 11% 12%
Bookings Mix1 (New / Existing) 62% / 38% 62% / 38% 65% / 35% 71% / 29%
Gross Dollar Churn2019 → 2020 YTD Annualized
18% → 22% 13% → 16% 10% → 9% 8% → 6%
GTM (Field / Inside / Mixed & Other) 21% / 51% / 28% 45% / 47% / 8% 80% / 12% / 8% 78% / 4% / 17%
Ownership (VC / PE / Independent) 59% / 22% / 18% 67% / 22% / 10% 62% / 28% / 9% 65% / 17% / 17%
New Customer CAC2019 → 2020 YTD2 $1.25 → $1.20 $1.50 → $1.68 $1.38 → $2.16 $1.15 → $2.16
Blended CAC3
2019 → 2020 YTD$0.84 → $1.03 $1.16 → $1.39 $1.31 → $1.61 $0.90 → $1.49
% Who Have Had RIFs 39% 53% 29% 30%
1 2020 YTD2 2020 YTD New Customer CAC assumes same S&M % targeted at new customers as in 20193 S&M costs do not factor in the costs attributed to renewals, for which the median was 9% of total S&M costs
(Median ARR = $22.0M | n = 77) (Median ARR = $20.4M | n = 72) (Median ARR = $24.3M | n = 69) (Median ARR = $15.0M | n = 23)
8%
36% 39%
25%
2019A 2020EOriginalForecast
2020ECurrentForecast
(17%) (11%) (8%)
2019A 2020EOriginalForecast
2020ECurrentForecast
7%
37% 42%
19%
2019A 2020EOriginalForecast
2020ECurrentForecast
(25%)(30%)
(21%)
2019A 2020EOriginalForecast
2020ECurrentForecast
6%
31%
39%
22%
2019A 2020EOriginalForecast
2020ECurrentForecast
(21%) (11%) (11%)
2019A 2020EOriginalForecast
2020ECurrentForecast
6%
41% 38%
19%
2019A 2020EOriginalForecast
2020ECurrentForecast
(40%)
(5%) (10%)
2019A 2020EOriginalForecast
2020ECurrentForecast
Median Values for Companies with $5M+ in 2019 ARR
2020 Private SaaS Company Survey
22
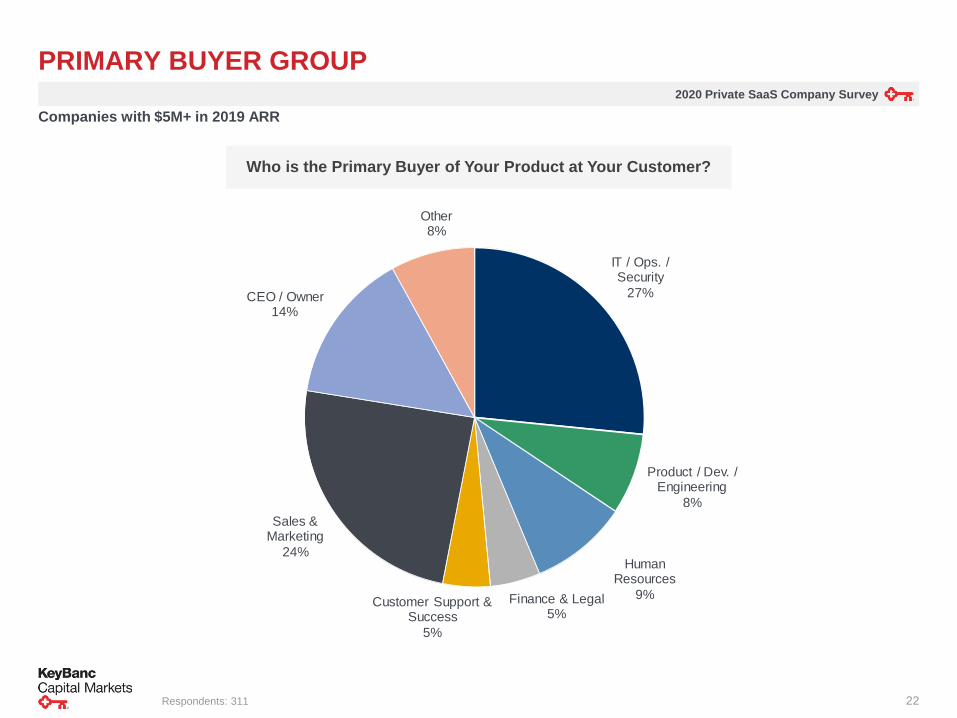
PRIMARY BUYER GROUP
Who is the Primary Buyer of Your Product at Your Customer?
Respondents: 311
Companies with $5M+ in 2019 ARR
IT / Ops. / Security
27%
Product / Dev. / Engineering
8%
Human Resources
9%Finance & Legal5%
Customer Support & Success
5%
Sales & Marketing
24%
CEO / Owner14%
Other8%
2020 Private SaaS Company Survey
23
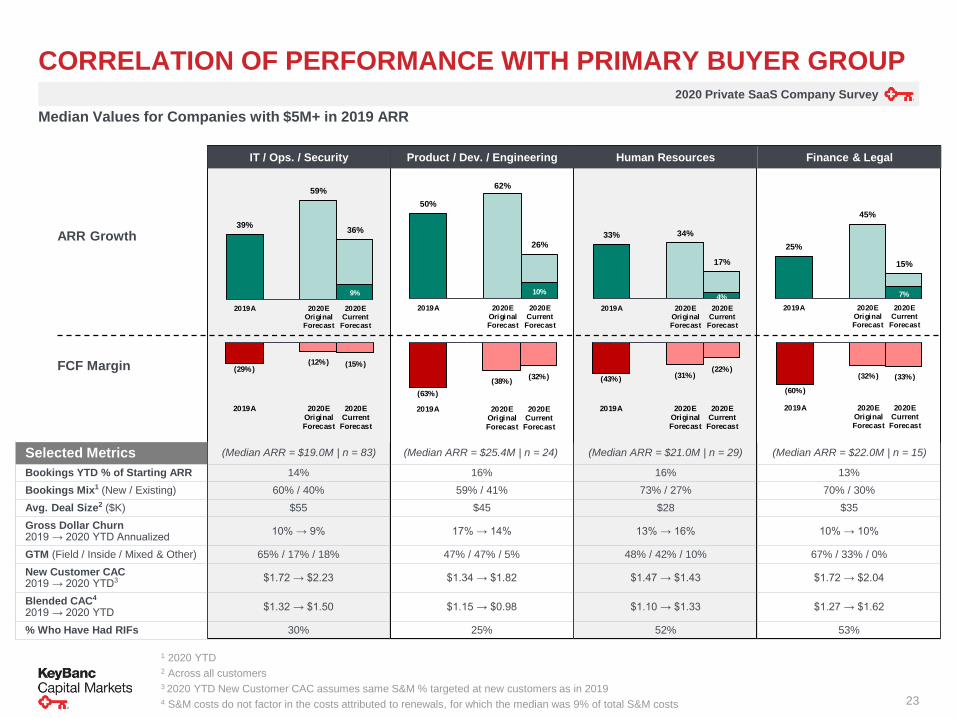
CORRELATION OF PERFORMANCE WITH PRIMARY BUYER GROUP
IT / Ops. / Security Product / Dev. / Engineering Finance & LegalHuman Resources
ARR Growth
FCF Margin
Selected Metrics
Bookings YTD % of Starting ARR 14% 16% 16% 13%
Bookings Mix1 (New / Existing) 60% / 40% 59% / 41% 73% / 27% 70% / 30%
Avg. Deal Size2 ($K) $55 $45 $28 $35
Gross Dollar Churn2019 → 2020 YTD Annualized
10% → 9% 17% → 14% 13% → 16% 10% → 10%
GTM (Field / Inside / Mixed & Other) 65% / 17% / 18% 47% / 47% / 5% 48% / 42% / 10% 67% / 33% / 0%
New Customer CAC2019 → 2020 YTD3 $1.72 → $2.23 $1.34 → $1.82 $1.47 → $1.43 $1.72 → $2.04
Blended CAC4
2019 → 2020 YTD$1.32 → $1.50 $1.15 → $0.98 $1.10 → $1.33 $1.27 → $1.62
% Who Have Had RIFs 30% 25% 52% 53%
1 2020 YTD2 Across all customers3 2020 YTD New Customer CAC assumes same S&M % targeted at new customers as in 20194 S&M costs do not factor in the costs attributed to renewals, for which the median was 9% of total S&M costs
Median Values for Companies with $5M+ in 2019 ARR
(Median ARR = $25.4M | n = 24)
(63%)
(38%)(32%)
2019A 2020EOriginalForecast
2020ECurrentForecast
(Median ARR = $19.0M | n = 83)
(29%)(12%) (15%)
2019A 2020EOriginalForecast
2020ECurrentForecast
(Median ARR = $21.0M | n = 29)
(43%) (31%)(22%)
2019A 2020EOriginalForecast
2020ECurrentForecast
(Median ARR = $22.0M | n = 15)
(60%)
(32%) (33%)
2019A 2020EOriginalForecast
2020ECurrentForecast
7%
25%
45%
15%
2019A 2020EOriginalForecast
2020ECurrent
Forecast
4%
33% 34%
17%
2019A 2020EOriginalForecast
2020ECurrent
Forecast
10%
50%
62%
26%
2019A 2020EOriginalForecast
2020ECurrent
Forecast
9%
39%
59%
36%
2019A 2020EOriginalForecast
2020ECurrent
Forecast
2020 Private SaaS Company Survey
24
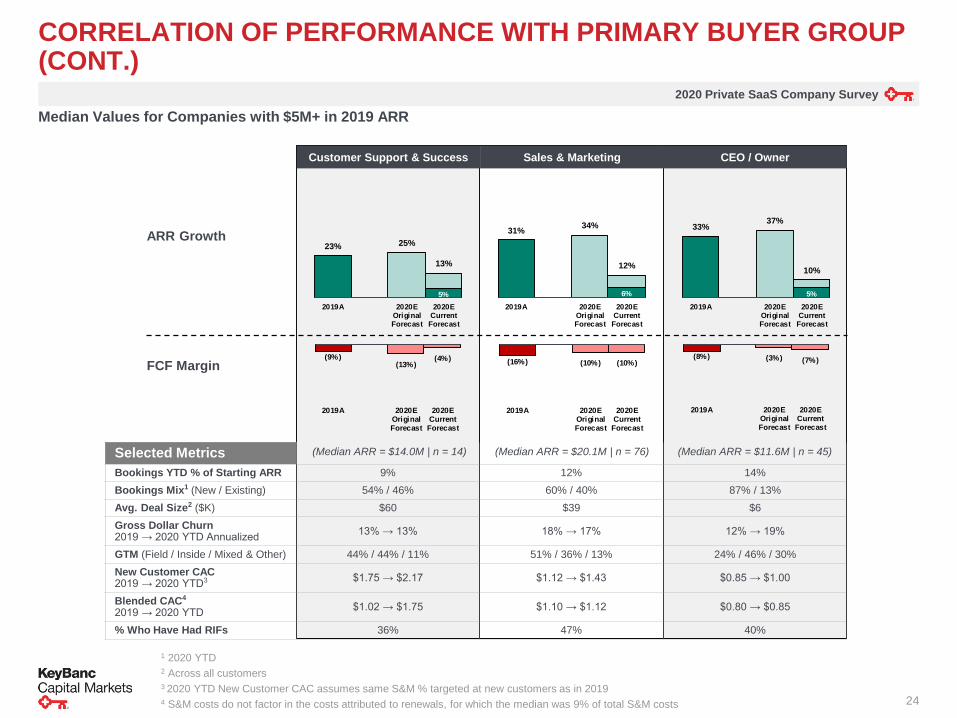
CORRELATION OF PERFORMANCE WITH PRIMARY BUYER GROUP (CONT.)
Customer Support & Success Sales & Marketing CEO / Owner
ARR Growth
FCF Margin
Selected Metrics
Bookings YTD % of Starting ARR 9% 12% 14%
Bookings Mix1 (New / Existing) 54% / 46% 60% / 40% 87% / 13%
Avg. Deal Size2 ($K) $60 $39 $6
Gross Dollar Churn2019 → 2020 YTD Annualized
13% → 13% 18% → 17% 12% → 19%
GTM (Field / Inside / Mixed & Other) 44% / 44% / 11% 51% / 36% / 13% 24% / 46% / 30%
New Customer CAC2019 → 2020 YTD3 $1.75 → $2.17 $1.12 → $1.43 $0.85 → $1.00
Blended CAC4
2019 → 2020 YTD$1.02 → $1.75 $1.10 → $1.12 $0.80 → $0.85
% Who Have Had RIFs 36% 47% 40%
Median Values for Companies with $5M+ in 2019 ARR
(Median ARR = $14.0M | n = 14)
5%
23% 25%
13%
2019A 2020EOriginalForecast
2020ECurrent
Forecast
(9%)(13%)
(4%)
2019A 2020EOriginalForecast
2020ECurrentForecast
6%
31% 34%
12%
2019A 2020EOriginalForecast
2020ECurrentForecast
(16%) (10%) (10%)
2019A 2020EOriginalForecast
2020ECurrentForecast
(Median ARR = $20.1M | n = 76)
5%
33% 37%
10%
2019A 2020EOriginalForecast
2020ECurrentForecast
(8%) (3%) (7%)
2019A 2020EOriginalForecast
2020ECurrentForecast
(Median ARR = $11.6M | n = 45)
1 2020 YTD2 Across all customers3 2020 YTD New Customer CAC assumes same S&M % targeted at new customers as in 20194 S&M costs do not factor in the costs attributed to renewals, for which the median was 9% of total S&M costs
2020 Private SaaS Company Survey
25
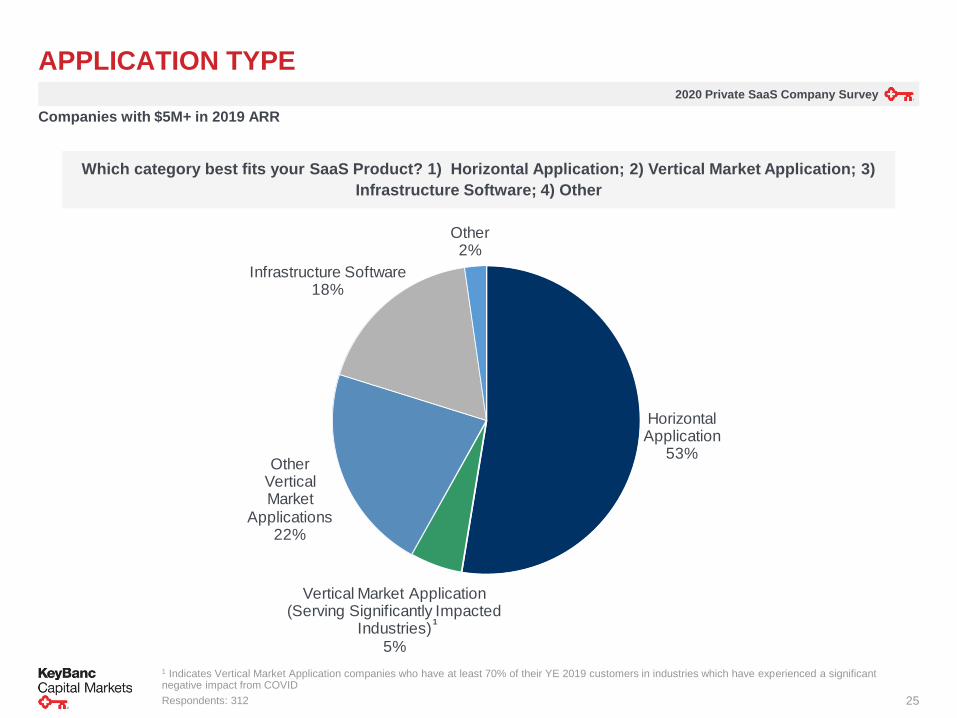
APPLICATION TYPE
Which category best fits your SaaS Product? 1) Horizontal Application; 2) Vertical Market Application; 3)
Infrastructure Software; 4) Other
1 Indicates Vertical Market Application companies who have at least 70% of their YE 2019 customers in industries which have experienced a significant negative impact from COVID
Respondents: 312
Companies with $5M+ in 2019 ARR
1
Horizontal Application
53%
Vertical Market Application (Serving Significantly Impacted
Industries)5%
Other Vertical Market
Applications22%
Infrastructure Software18%
Other2%
2020 Private SaaS Company Survey
26
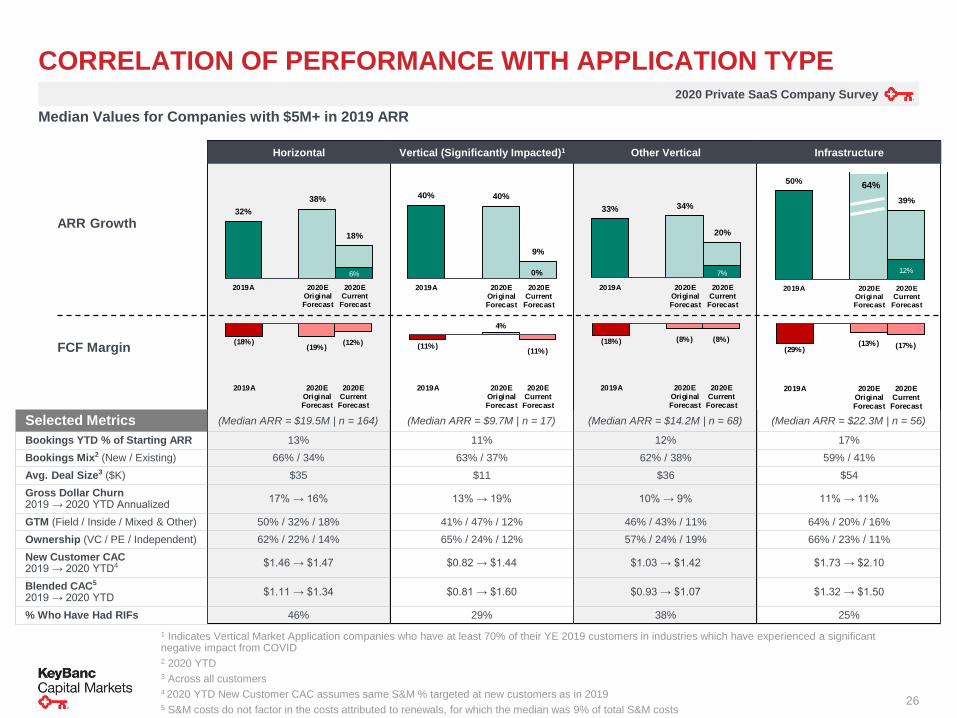
CORRELATION OF PERFORMANCE WITH APPLICATION TYPE
Horizontal Vertical (Significantly Impacted)1 Other Vertical Infrastructure
ARR Growth
FCF Margin
Selected Metrics
Bookings YTD % of Starting ARR 13% 11% 12% 17%
Bookings Mix2 (New / Existing) 66% / 34% 63% / 37% 62% / 38% 59% / 41%
Avg. Deal Size3 ($K) $35 $11 $36 $54
Gross Dollar Churn2019 → 2020 YTD Annualized
17% → 16% 13% → 19% 10% → 9% 11% → 11%
GTM (Field / Inside / Mixed & Other) 50% / 32% / 18% 41% / 47% / 12% 46% / 43% / 11% 64% / 20% / 16%
Ownership (VC / PE / Independent) 62% / 22% / 14% 65% / 24% / 12% 57% / 24% / 19% 66% / 23% / 11%
New Customer CAC2019 → 2020 YTD4 $1.46 → $1.47 $0.82 → $1.44 $1.03 → $1.42 $1.73 → $2.10
Blended CAC5
2019 → 2020 YTD$1.11 → $1.34 $0.81 → $1.60 $0.93 → $1.07 $1.32 → $1.50
% Who Have Had RIFs 46% 29% 38% 25%
1 Indicates Vertical Market Application companies who have at least 70% of their YE 2019 customers in industries which have experienced a significant negative impact from COVID2 2020 YTD3 Across all customers4 2020 YTD New Customer CAC assumes same S&M % targeted at new customers as in 20195 S&M costs do not factor in the costs attributed to renewals, for which the median was 9% of total S&M costs
(Median ARR = $19.5M | n = 164) (Median ARR = $9.7M | n = 17) (Median ARR = $14.2M | n = 68) (Median ARR = $22.3M | n = 56)
6%
32%
38%
18%
2019A 2020EOriginalForecast
2020ECurrent
Forecast
(18%)(19%)
(12%)
2019A 2020EOriginalForecast
2020ECurrentForecast
40% 40%
9%
2019A 2020EOriginalForecast
2020ECurrent
Forecast
(11%)
4%
(11%)
2019A 2020EOriginalForecast
2020ECurrentForecast
7%
33% 34%
20%
2019A 2020EOriginalForecast
2020ECurrentForecast
(18%) (8%) (8%)
2019A 2020EOriginalForecast
2020ECurrentForecast
12%
50%
39%
2019A 2020EOriginalForecast
2020ECurrentForecast
(29%)(13%) (17%)
2019A 2020EOriginalForecast
2020ECurrentForecast
64%
0%
Median Values for Companies with $5M+ in 2019 ARR
2020 Private SaaS Company Survey
27
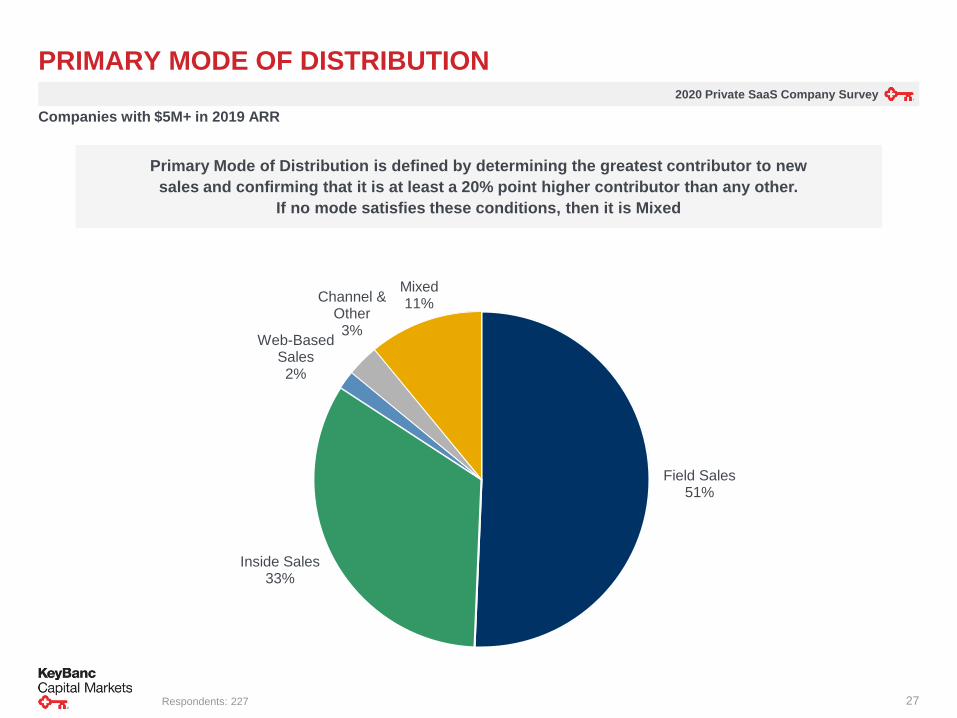
Field Sales51%
Inside Sales33%
Web-Based Sales2%
Channel & Other3%
Mixed11%
PRIMARY MODE OF DISTRIBUTION
Companies with $5M+ in 2019 ARR
Primary Mode of Distribution is defined by determining the greatest contributor to new
sales and confirming that it is at least a 20% point higher contributor than any other.
If no mode satisfies these conditions, then it is Mixed
Respondents: 227
2020 Private SaaS Company Survey
28
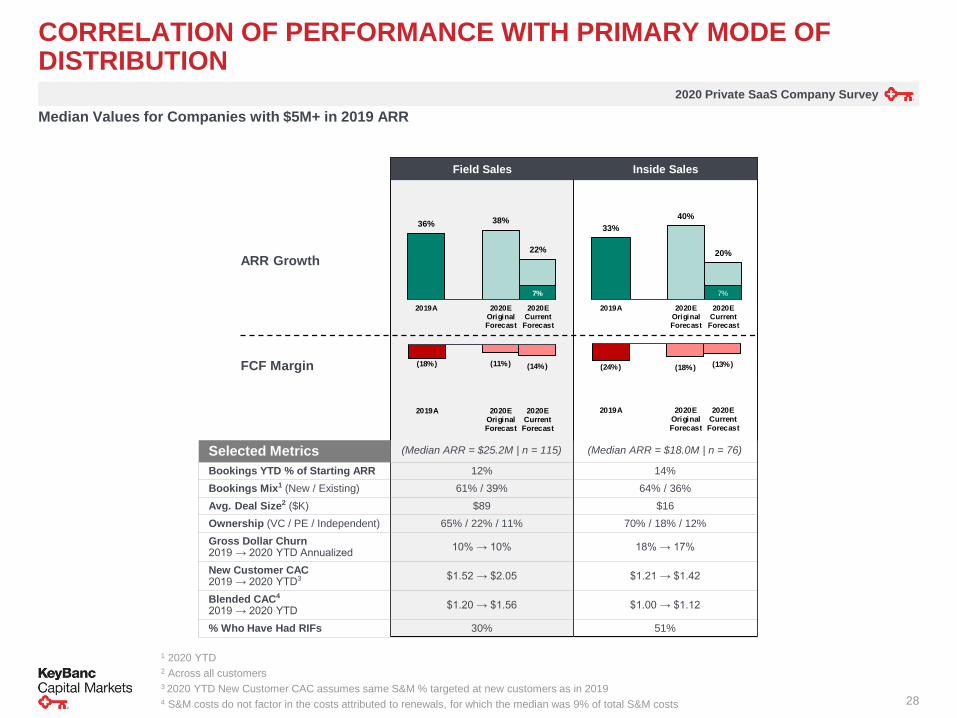
CORRELATION OF PERFORMANCE WITH PRIMARY MODE OF DISTRIBUTION
Field Sales Inside Sales
ARR Growth
FCF Margin
Selected Metrics
Bookings YTD % of Starting ARR 12% 14%
Bookings Mix1 (New / Existing) 61% / 39% 64% / 36%
Avg. Deal Size2 ($K) $89 $16
Ownership (VC / PE / Independent) 65% / 22% / 11% 70% / 18% / 12%
Gross Dollar Churn2019 → 2020 YTD Annualized
10% → 10% 18% → 17%
New Customer CAC2019 → 2020 YTD3 $1.52 → $2.05 $1.21 → $1.42
Blended CAC4
2019 → 2020 YTD$1.20 → $1.56 $1.00 → $1.12
% Who Have Had RIFs 30% 51%
1 2020 YTD2 Across all customers3 2020 YTD New Customer CAC assumes same S&M % targeted at new customers as in 20194 S&M costs do not factor in the costs attributed to renewals, for which the median was 9% of total S&M costs
(Median ARR = $25.2M | n = 115) (Median ARR = $18.0M | n = 76)
7%
36% 38%
22%
2019A 2020EOriginalForecast
2020ECurrentForecast
7%
33%
40%
20%
2019A 2020EOriginalForecast
2020ECurrentForecast
(18%) (11%) (14%)
2019A 2020EOriginalForecast
2020ECurrentForecast
(24%) (18%) (13%)
2019A 2020EOriginalForecast
2020ECurrentForecast
Median Values for Companies with $5M+ in 2019 ARR
2020 Private SaaS Company Survey
29
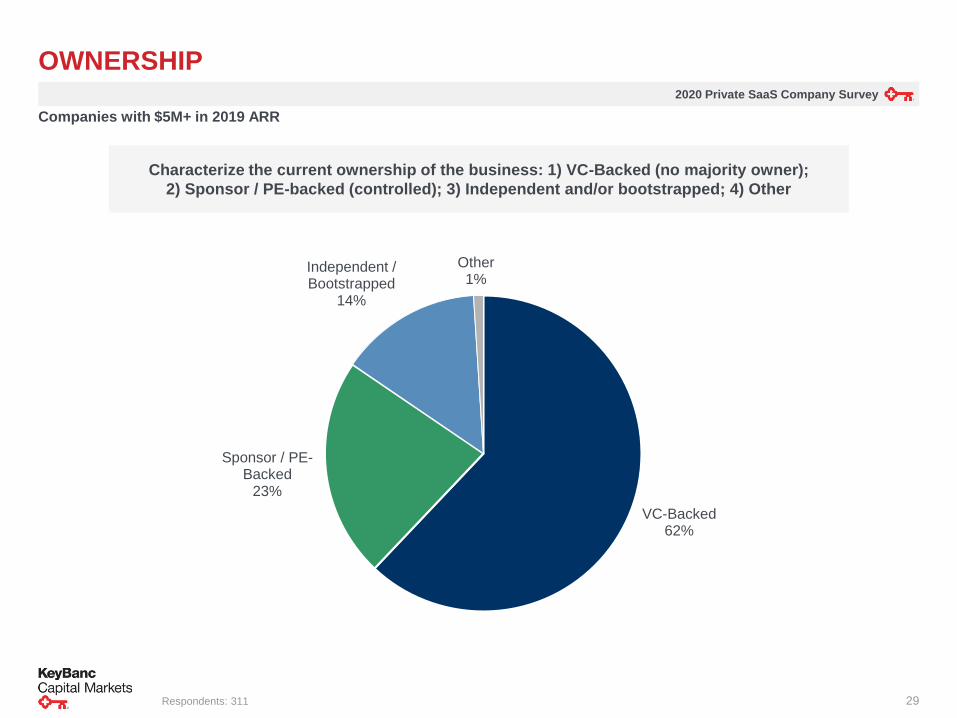
VC-Backed62%
Sponsor / PE-Backed
23%
Independent / Bootstrapped
14%
Other1%
OWNERSHIP
Characterize the current ownership of the business: 1) VC-Backed (no majority owner);
2) Sponsor / PE-backed (controlled); 3) Independent and/or bootstrapped; 4) Other
Respondents: 311
Companies with $5M+ in 2019 ARR
2020 Private SaaS Company Survey
30
1 2020 YTD2 Across all customers3 2020 YTD New Customer CAC assumes same S&M % targeted at new customers as in 20194 S&M costs do not factor in the costs attributed to renewals, for which the median was 9% of total S&M costs
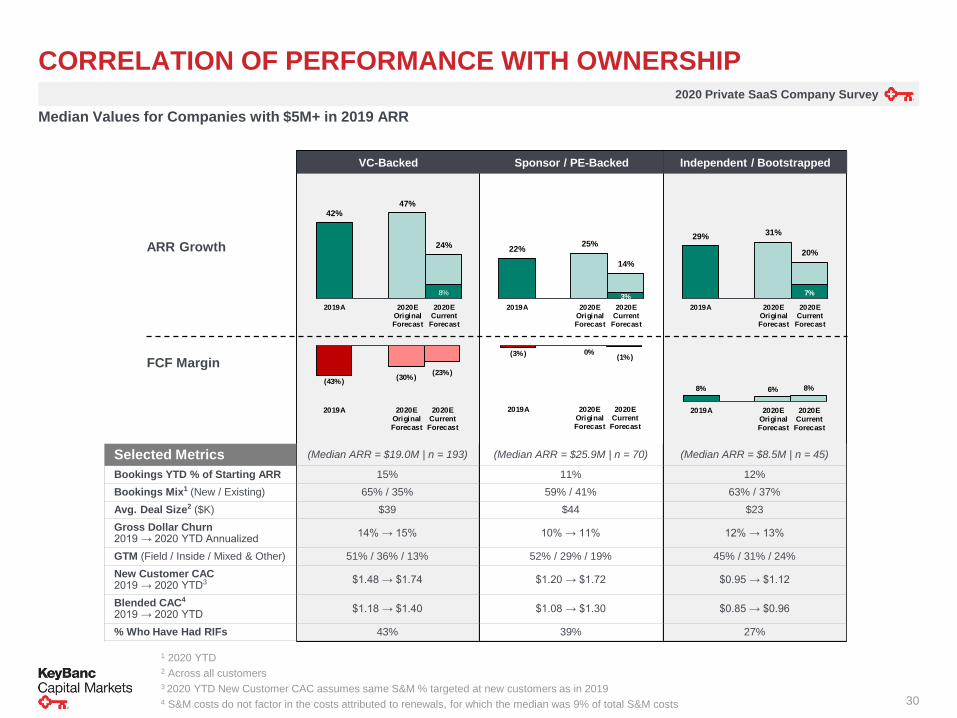
CORRELATION OF PERFORMANCE WITH OWNERSHIP
VC-Backed Sponsor / PE-Backed Independent / Bootstrapped
ARR Growth
FCF Margin
Selected Metrics
Bookings YTD % of Starting ARR 15% 11% 12%
Bookings Mix1 (New / Existing) 65% / 35% 59% / 41% 63% / 37%
Avg. Deal Size2 ($K) $39 $44 $23
Gross Dollar Churn2019 → 2020 YTD Annualized
14% → 15% 10% → 11% 12% → 13%
GTM (Field / Inside / Mixed & Other) 51% / 36% / 13% 52% / 29% / 19% 45% / 31% / 24%
New Customer CAC2019 → 2020 YTD3 $1.48 → $1.74 $1.20 → $1.72 $0.95 → $1.12
Blended CAC4
2019 → 2020 YTD$1.18 → $1.40 $1.08 → $1.30 $0.85 → $0.96
% Who Have Had RIFs 43% 39% 27%
(Median ARR = $19.0M | n = 193) (Median ARR = $25.9M | n = 70) (Median ARR = $8.5M | n = 45)
8%
42% 47%
24%
2019A 2020EOriginalForecast
2020ECurrentForecast
(43%)(30%)
(23%)
2019A 2020EOriginalForecast
2020ECurrentForecast
3%
22% 25%
14%
2019A 2020EOriginalForecast
2020ECurrent
Forecast
(3%) 0% (1%)
2019A 2020EOriginalForecast
2020ECurrentForecast
7%
29% 31%
20%
2019A 2020EOriginalForecast
2020ECurrentForecast
8% 6% 8%
2019A 2020EOriginalForecast
2020ECurrentForecast
Median Values for Companies with $5M+ in 2019 ARR
2020 Private SaaS Company Survey
31
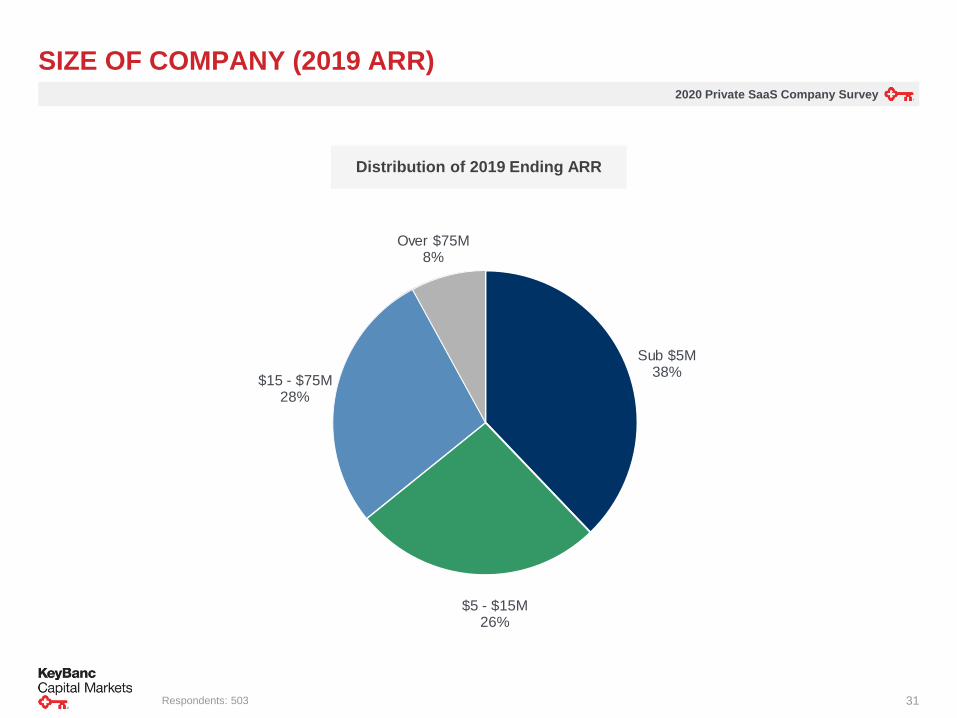
Sub $5M38%
$5 - $15M26%
$15 - $75M28%
Over $75M8%
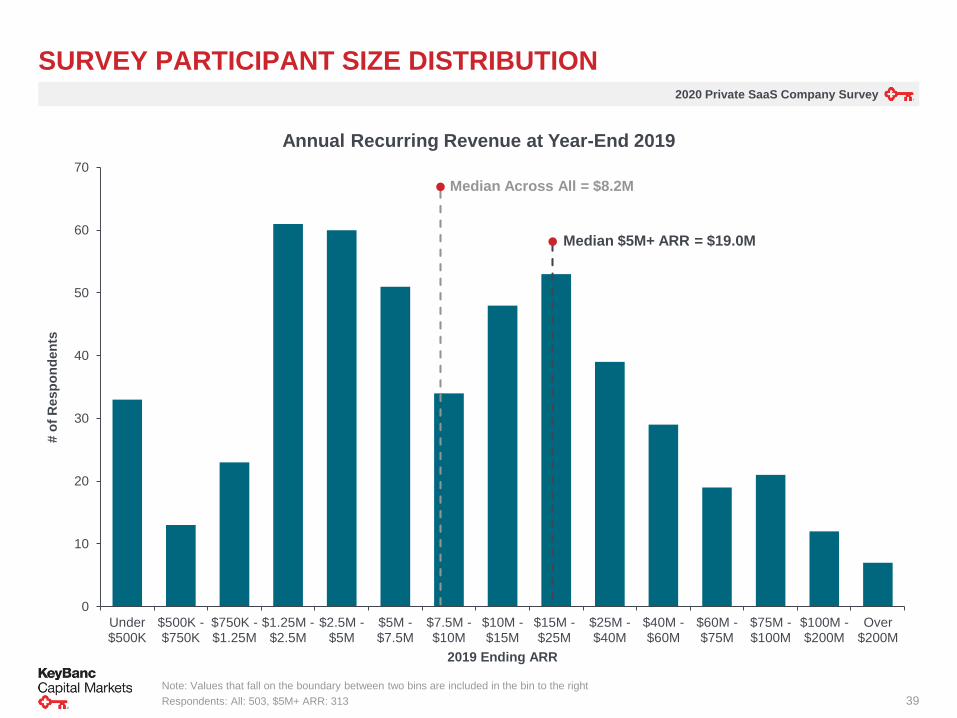
SIZE OF COMPANY (2019 ARR)
Respondents: 503
Distribution of 2019 Ending ARR
2020 Private SaaS Company Survey
32
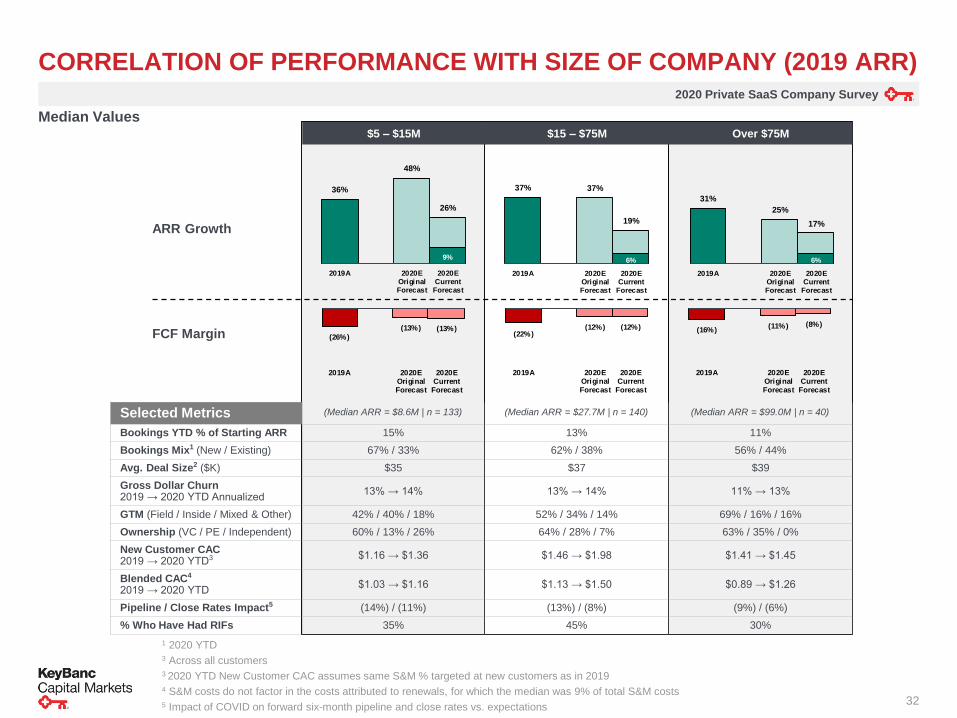
CORRELATION OF PERFORMANCE WITH SIZE OF COMPANY (2019 ARR)
$5 – $15M $15 – $75M Over $75M
ARR Growth
FCF Margin
Selected Metrics
Bookings YTD % of Starting ARR 15% 13% 11%
Bookings Mix1 (New / Existing) 67% / 33% 62% / 38% 56% / 44%
Avg. Deal Size2 ($K) $35 $37 $39
Gross Dollar Churn2019 → 2020 YTD Annualized
13% → 14% 13% → 14% 11% → 13%
GTM (Field / Inside / Mixed & Other) 42% / 40% / 18% 52% / 34% / 14% 69% / 16% / 16%
Ownership (VC / PE / Independent) 60% / 13% / 26% 64% / 28% / 7% 63% / 35% / 0%
New Customer CAC2019 → 2020 YTD3 $1.16 → $1.36 $1.46 → $1.98 $1.41 → $1.45
Blended CAC4
2019 → 2020 YTD$1.03 → $1.16 $1.13 → $1.50 $0.89 → $1.26
Pipeline / Close Rates Impact5 (14%) / (11%) (13%) / (8%) (9%) / (6%)
% Who Have Had RIFs 35% 45% 30%
9%
36%
48%
26%
2019A 2020EOriginalForecast
2020ECurrentForecast
(26%)
(13%) (13%)
2019A 2020EOriginalForecast
2020ECurrentForecast
6%
37% 37%
19%
2019A 2020EOriginalForecast
2020ECurrent
Forecast
(22%)(12%) (12%)
2019A 2020EOriginalForecast
2020ECurrentForecast
6%
31%
25%
17%
2019A 2020EOriginalForecast
2020ECurrent
Forecast
(16%)(11%) (8%)
2019A 2020EOriginalForecast
2020ECurrentForecast
(Median ARR = $99.0M | n = 40)(Median ARR = $27.7M | n = 140)(Median ARR = $8.6M | n = 133)
Median Values
1 2020 YTD3 Across all customers3 2020 YTD New Customer CAC assumes same S&M % targeted at new customers as in 20194 S&M costs do not factor in the costs attributed to renewals, for which the median was 9% of total S&M costs5 Impact of COVID on forward six-month pipeline and close rates vs. expectations

2020 Private SaaS Company Survey
33
WHAT’S HAPPENING IN THE FIELD AND WHAT’S BEEN THE RESPONSE?
2020 Private SaaS Company Survey
34
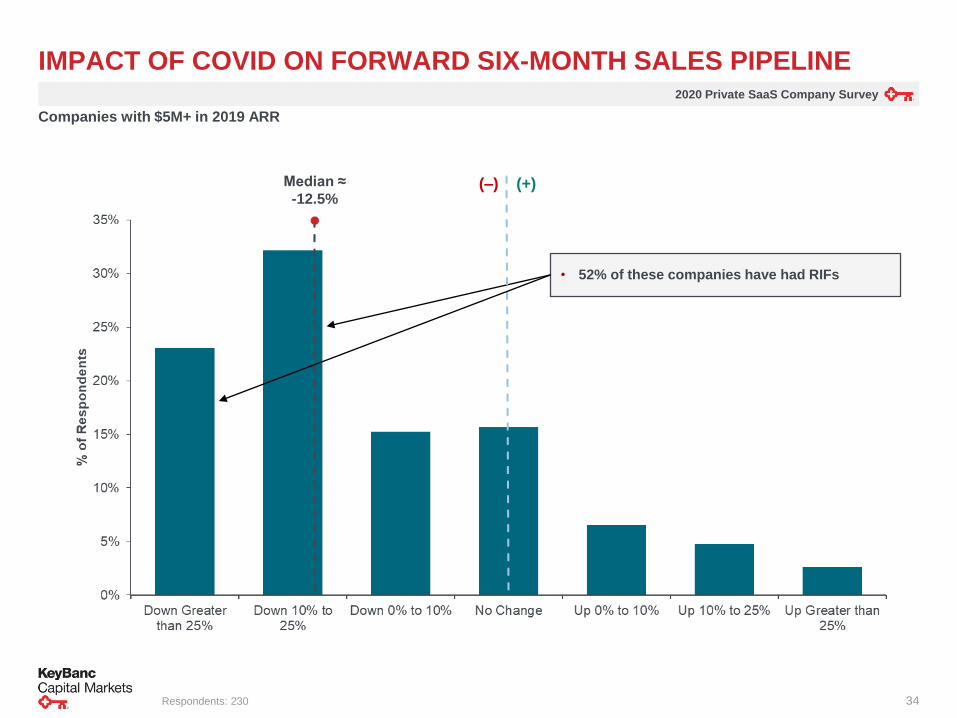
IMPACT OF COVID ON FORWARD SIX-MONTH SALES PIPELINE
Respondents: 230
Median ≈
-12.5%
• 52% of these companies have had RIFs
Companies with $5M+ in 2019 ARR
(–) (+)
2020 Private SaaS Company Survey
35
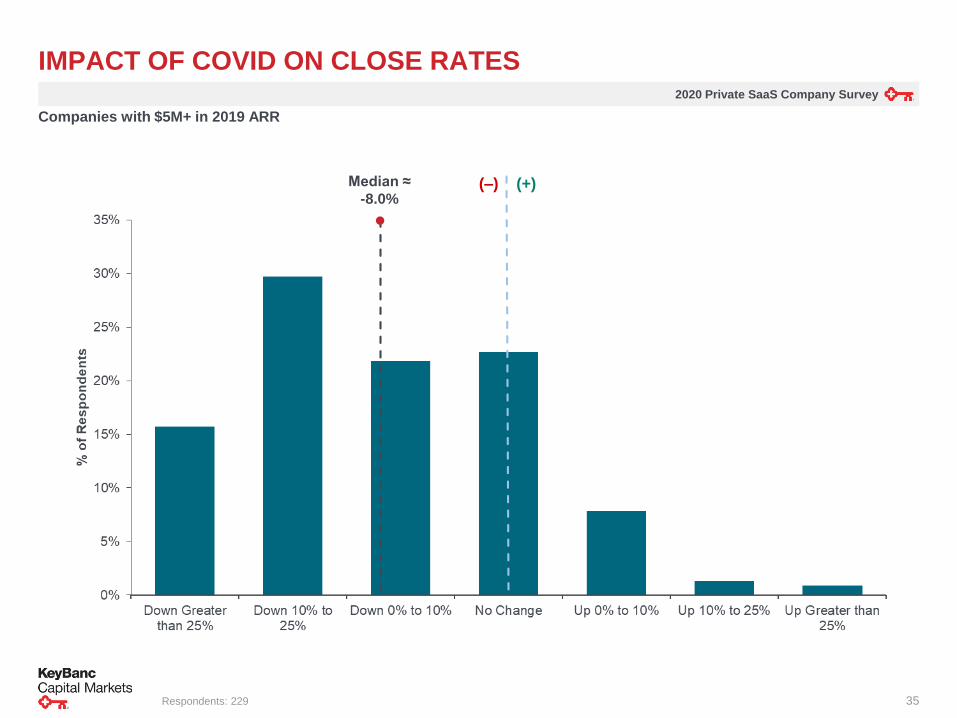
IMPACT OF COVID ON CLOSE RATES
Respondents: 229
Companies with $5M+ in 2019 ARR
Median ≈
-8.0%(–) (+)
2020 Private SaaS Company Survey
36
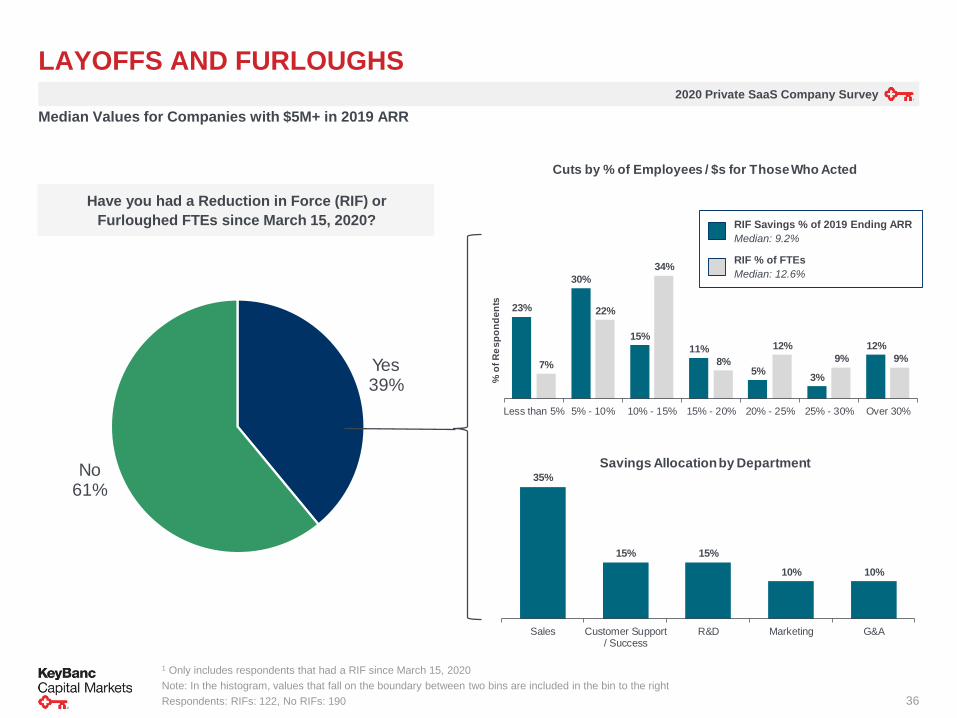
LAYOFFS AND FURLOUGHS
1 Only includes respondents that had a RIF since March 15, 2020
Note: In the histogram, values that fall on the boundary between two bins are included in the bin to the right
Respondents: RIFs: 122, No RIFs: 190
Have you had a Reduction in Force (RIF) or
Furloughed FTEs since March 15, 2020?
Yes39%
No61%
35%
15% 15%
10% 10%
Sales Customer Support/ Success
R&D Marketing G&A
Savings Allocation by Department
Median Values for Companies with $5M+ in 2019 ARR
23%
30%
15%
11%
5% 3%
12%
7%
22%
34%
8%
12%
9% 9%
Less than 5% 5% - 10% 10% - 15% 15% - 20% 20% - 25% 25% - 30% Over 30%
% o
f R
es
po
nd
en
ts
Cuts by % of Employees / $s for Those Who Acted
RIF Savings % of 2019 Ending ARR
Median: 9.2%
RIF % of FTEs
Median: 12.6%

2020 Private SaaS Company Survey
37
OTHER HIGHLIGHTS
2020 Private SaaS Company Survey
38
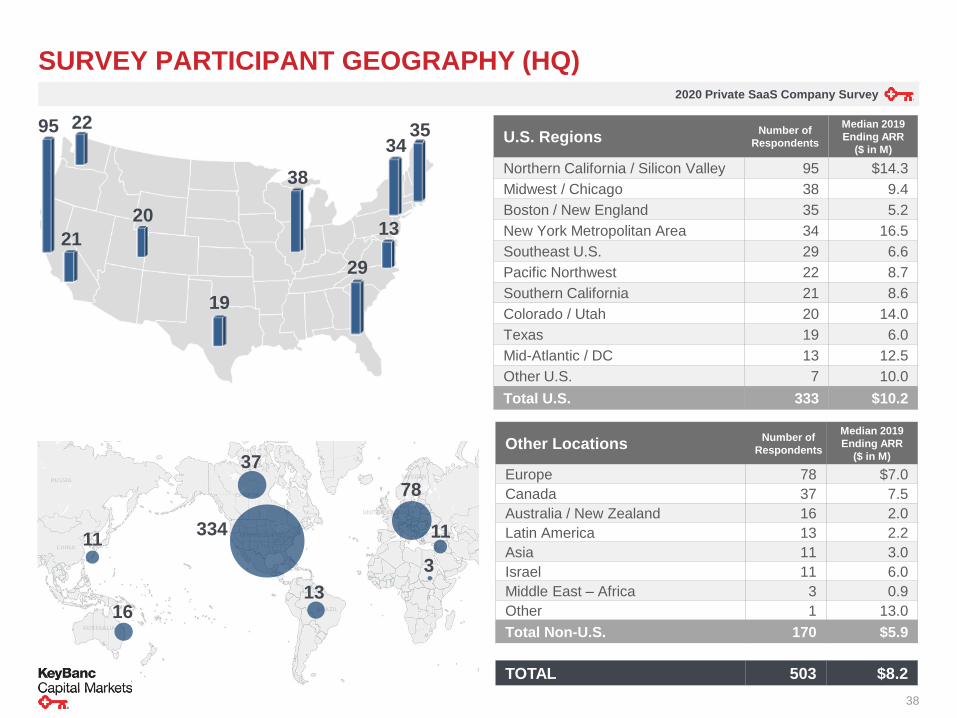
U.S. Regions Median 2019
Ending ARR
($ in M)
Northern California / Silicon Valley 95 $14.3
Midwest / Chicago 38 9.4
Boston / New England 35 5.2
New York Metropolitan Area 34 16.5
Southeast U.S. 29 6.6
Pacific Northwest 22 8.7
Southern California 21 8.6
Colorado / Utah 20 14.0
Texas 19 6.0
Mid-Atlantic / DC 13 12.5
Other U.S. 7 10.0
Total U.S. 333 $10.2
Other LocationsMedian 2019
Ending ARR
($ in M)
Europe 78 $7.0
Canada 37 7.5
Australia / New Zealand 16 2.0
Latin America 13 2.2
Asia 11 3.0
Israel 11 6.0
Middle East – Africa 3 0.9
Other 1 13.0
Total Non-U.S. 170 $5.9
TOTAL 503 $8.2
334
37
78
11
3
16
11
13
21
22
19
20
38
29
13
3435
SURVEY PARTICIPANT GEOGRAPHY (HQ)
Number of
Respondents
Number of
Respondents
95
2020 Private SaaS Company Survey
39
0
10
20
30
40
50
60
70
Under$500K
$500K -$750K
$750K -$1.25M
$1.25M -$2.5M
$2.5M -$5M
$5M -$7.5M
$7.5M -$10M
$10M -$15M
$15M -$25M
$25M -$40M
$40M -$60M
$60M -$75M
$75M -$100M
$100M -$200M
Over$200M
# o
f R
esp
on
den
ts
2019 Ending ARR
Annual Recurring Revenue at Year-End 2019
SURVEY PARTICIPANT SIZE DISTRIBUTION
Note: Values that fall on the boundary between two bins are included in the bin to the right
Respondents: All: 503, $5M+ ARR: 313
Median $5M+ ARR = $19.0M
Median Across All = $8.2M
2020 Private SaaS Company Survey
40
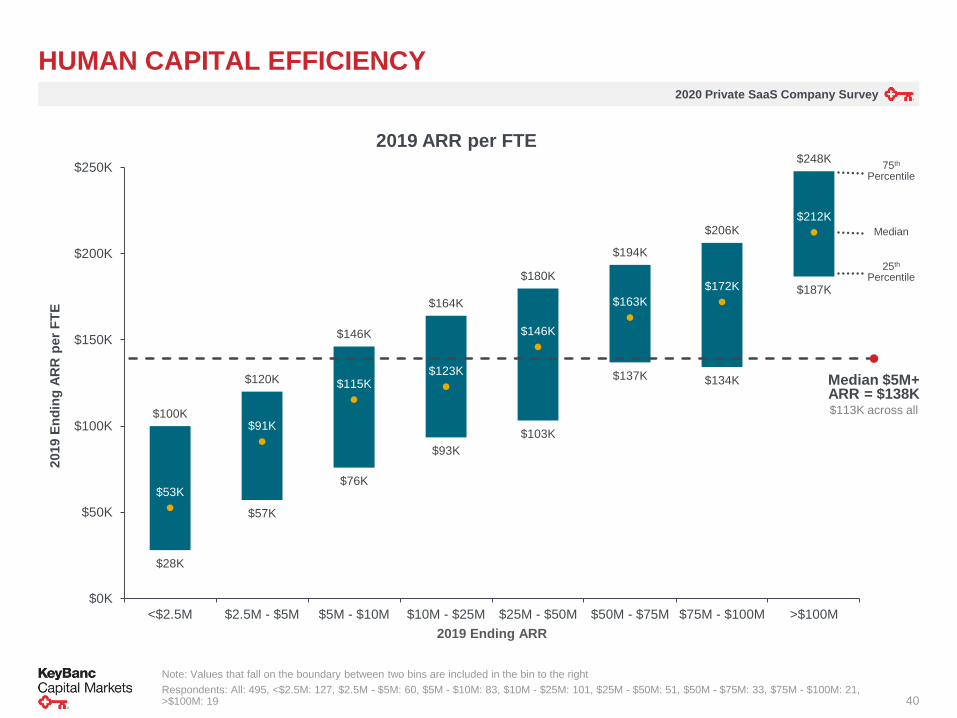
HUMAN CAPITAL EFFICIENCY
Note: Values that fall on the boundary between two bins are included in the bin to the right
Respondents: All: 495, <$2.5M: 127, $2.5M - $5M: 60, $5M - $10M: 83, $10M - $25M: 101, $25M - $50M: 51, $50M - $75M: 33, $75M - $100M: 21, >$100M: 19
$28K
$57K
$76K
$93K
$103K
$137K $134K
$187K
$100K
$120K
$146K
$164K
$180K
$194K
$206K
$248K
$53K
$91K
$115K$123K
$146K
$163K
$172K
$212K
$0K
$50K
$100K
$150K
$200K
$250K
<$2.5M $2.5M - $5M $5M - $10M $10M - $25M $25M - $50M $50M - $75M $75M - $100M >$100M
2019 E
nd
ing
AR
R p
er
FT
E
2019 Ending ARR
2019 ARR per FTE
Median $5M+ ARR = $138K$113K across all
75th
Percentile
25th
Percentile
Median
2020 Private SaaS Company Survey
41
0.6x
0.1x
0.6x
0.9x 1.0x0.9x
0.5x
2.3x
4.4x
2.1x
2.6x
2.0x1.8x
1.4x1.3x
1.8x
1.1x
1.6x
1.2x
1.5x
1.0x
0.0x
0.5x
1.0x
1.5x
2.0x
2.5x
3.0x
3.5x
4.0x
4.5x
5.0x
Overall ($5M+) $5M - $10M $10M - $20M $20M - $30M $30M - $50M $50M - $75M >$75M
Cap
ital
Co
nsu
mp
tio
n R
ati
o
2019 Ending ARR
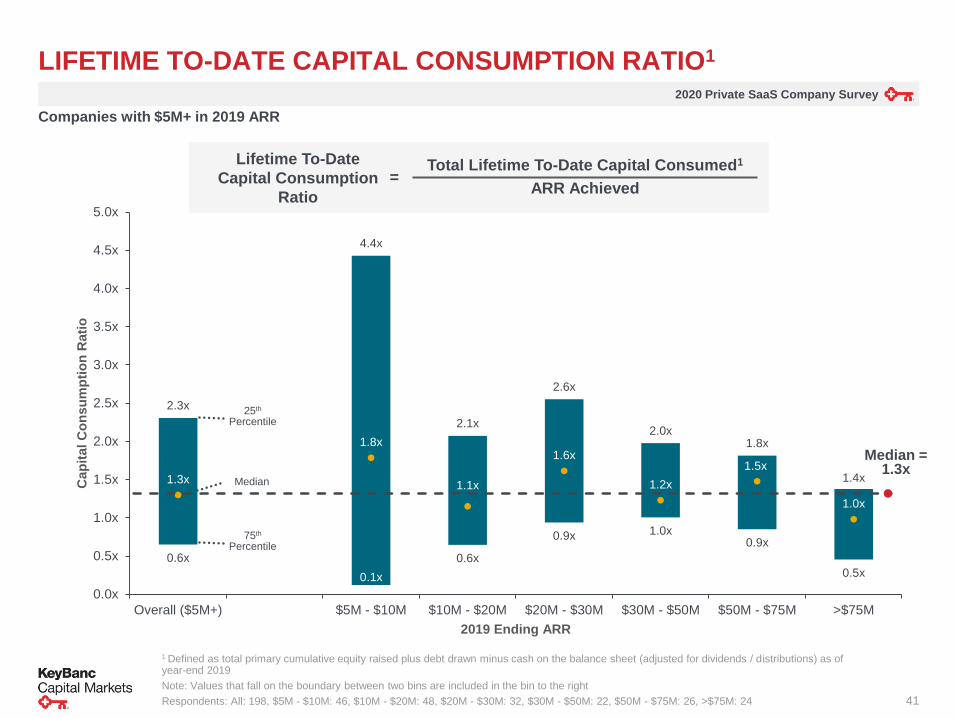
LIFETIME TO-DATE CAPITAL CONSUMPTION RATIO1
1 Defined as total primary cumulative equity raised plus debt drawn minus cash on the balance sheet (adjusted for dividends / distributions) as of year-end 2019
Note: Values that fall on the boundary between two bins are included in the bin to the right
Respondents: All: 198, $5M - $10M: 46, $10M - $20M: 48, $20M - $30M: 32, $30M - $50M: 22, $50M - $75M: 26, >$75M: 24
Median = 1.3x
Total Lifetime To-Date Capital Consumed1
ARR Achieved=
Lifetime To-Date
Capital Consumption
Ratio
Companies with $5M+ in 2019 ARR
25th
Percentile
75th
Percentile
Median
2020 Private SaaS Company Survey
42
0%
2%
4%
6%
8%
10%
12%
14%
16%
18%
20%
5x+ 4x 3x 2x 1x
% o
f R
esp
on
den
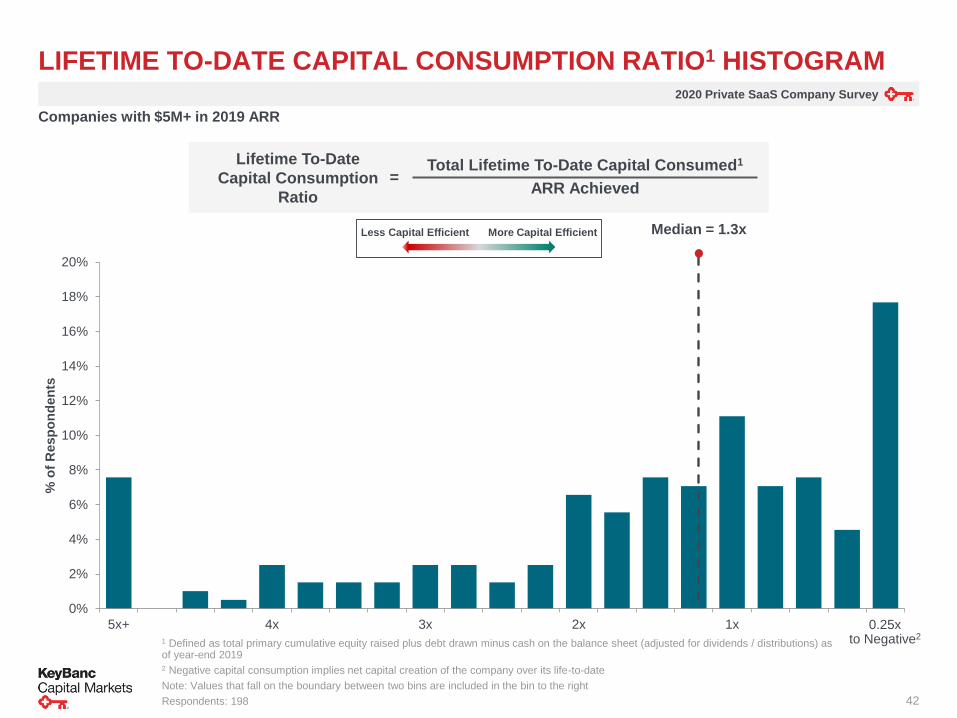
tsLIFETIME TO-DATE CAPITAL CONSUMPTION RATIO1 HISTOGRAM
1 Defined as total primary cumulative equity raised plus debt drawn minus cash on the balance sheet (adjusted for dividends / distributions) as of year-end 20192 Negative capital consumption implies net capital creation of the company over its life-to-date
Note: Values that fall on the boundary between two bins are included in the bin to the right
Respondents: 198
Median = 1.3x
0.25xto Negative2
Companies with $5M+ in 2019 ARR
Less Capital Efficient More Capital Efficient
Total Lifetime To-Date Capital Consumed1
ARR Achieved=
Lifetime To-Date
Capital Consumption
Ratio
2020 Private SaaS Company Survey
43
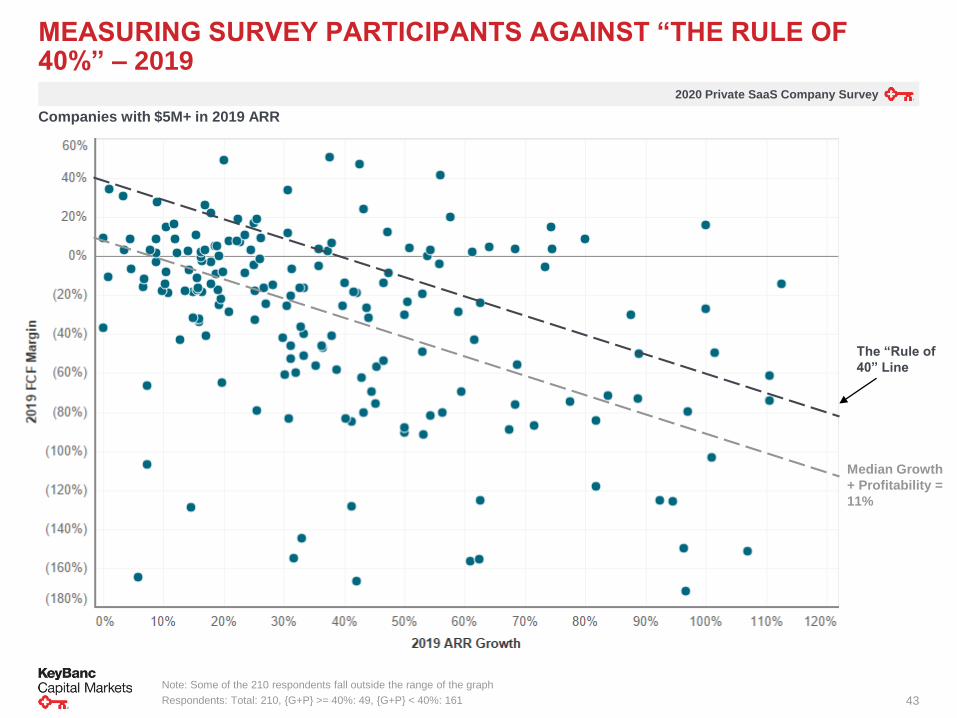
MEASURING SURVEY PARTICIPANTS AGAINST “THE RULE OF 40%” – 2019
Note: Some of the 210 respondents fall outside the range of the graph
Respondents: Total: 210, {G+P} >= 40%: 49, {G+P} < 40%: 161
The “Rule of
40” Line
Companies with $5M+ in 2019 ARR
Median Growth
+ Profitability =
11%
2020 Private SaaS Company Survey
44
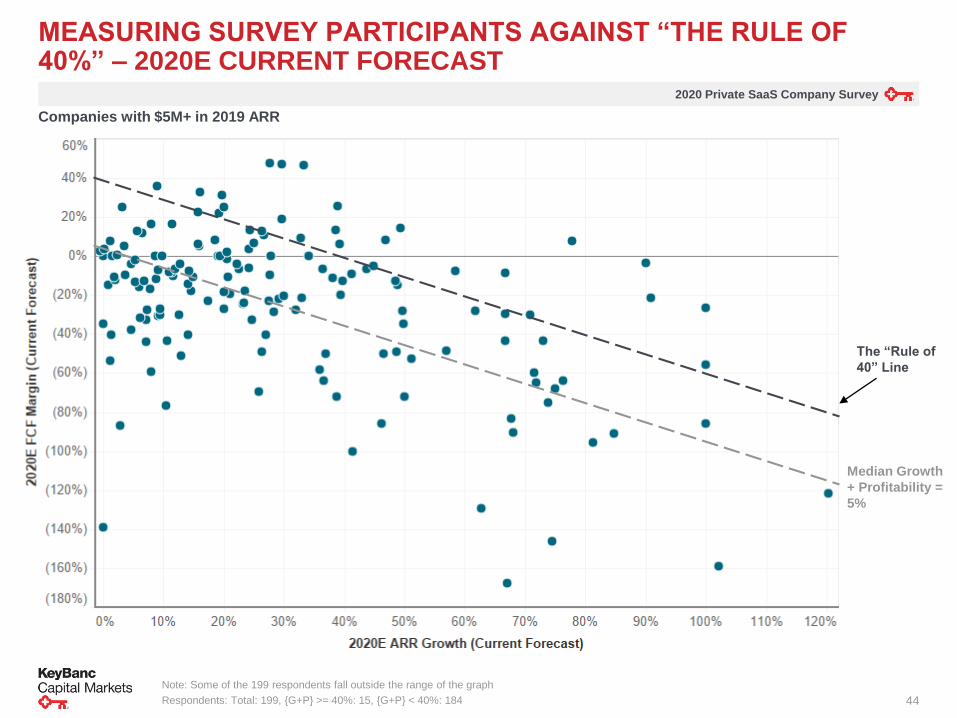
MEASURING SURVEY PARTICIPANTS AGAINST “THE RULE OF 40%” – 2020E CURRENT FORECAST
The “Rule of
40” Line
Companies with $5M+ in 2019 ARR
Note: Some of the 199 respondents fall outside the range of the graph
Respondents: Total: 199, {G+P} >= 40%: 15, {G+P} < 40%: 184
Median Growth
+ Profitability =
5%
2020 Private SaaS Company Survey
45
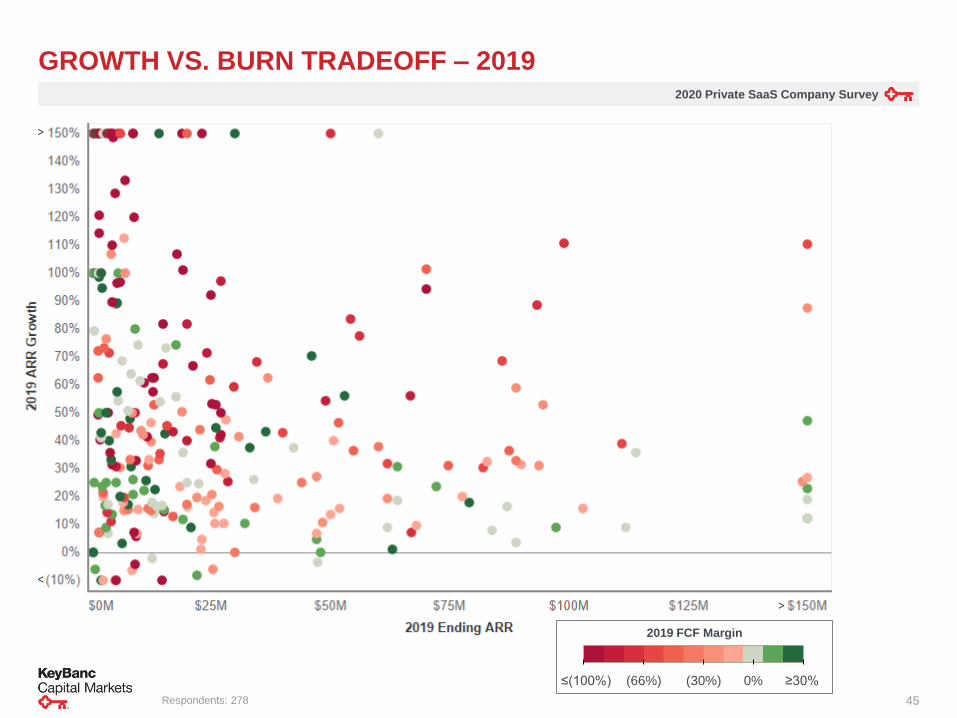
GROWTH VS. BURN TRADEOFF – 2019
Respondents: 278
2019 FCF Margin
≤(100%) ≥30%0%(66%) (30%)
>
<
>
2020 Private SaaS Company Survey
46
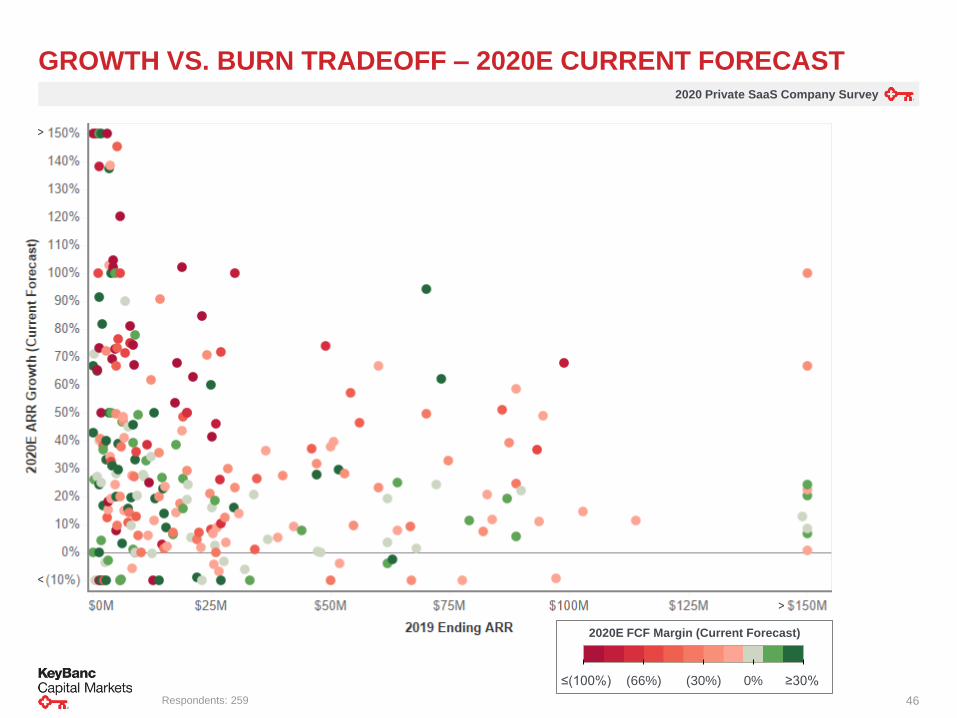
GROWTH VS. BURN TRADEOFF – 2020E CURRENT FORECAST
2020E FCF Margin (Current Forecast)
≤(100%) ≥30%0%(66%) (30%)
>
<
>
Respondents: 259
2020 Private SaaS Company Survey
47
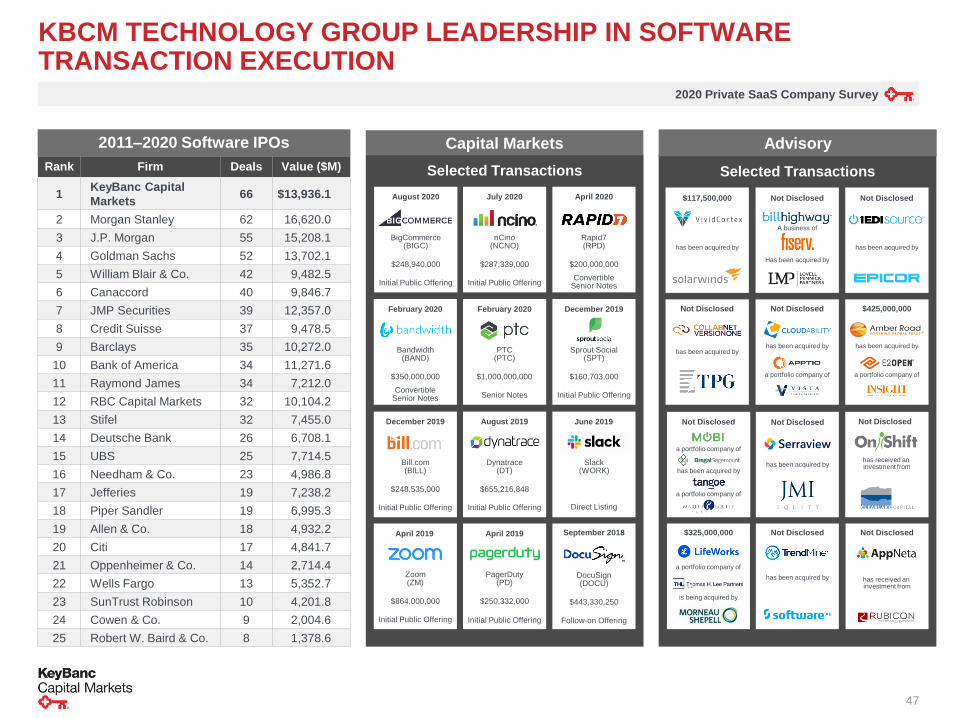
KBCM TECHNOLOGY GROUP LEADERSHIP IN SOFTWARE TRANSACTION EXECUTION
Advisory
Not Disclosed
has received an investment from
Not Disclosed
has been acquired by
Capital Markets2011–2020 Software IPOs
Rank Firm Deals Value ($M)
1KeyBanc Capital
Markets66 $13,936.1
2 Morgan Stanley 62 16,620.0
3 J.P. Morgan 55 15,208.1
4 Goldman Sachs 52 13,702.1
5 William Blair & Co. 42 9,482.5
6 Canaccord 40 9,846.7
7 JMP Securities 39 12,357.0
8 Credit Suisse 37 9,478.5
9 Barclays 35 10,272.0
10 Bank of America 34 11,271.6
11 Raymond James 34 7,212.0
12 RBC Capital Markets 32 10,104.2
13 Stifel 32 7,455.0
14 Deutsche Bank 26 6,708.1
15 UBS 25 7,714.5
16 Needham & Co. 23 4,986.8
17 Jefferies 19 7,238.2
18 Piper Sandler 19 6,995.3
19 Allen & Co. 18 4,932.2
20 Citi 17 4,841.7
21 Oppenheimer & Co. 14 2,714.4
22 Wells Fargo 13 5,352.7
23 SunTrust Robinson 10 4,201.8
24 Cowen & Co. 9 2,004.6
25 Robert W. Baird & Co. 8 1,378.6
Selected Transactions Selected Transactions
has received an investment from
Not Disclosed
$864,000,000
Zoom(ZM)
Initial Public Offering
April 2019
Slack(WORK)
Direct Listing
June 2019
$655,216,848
Dynatrace(DT)
Initial Public Offering
August 2019
September 2018
$443,330,250
DocuSign(DOCU)
Follow-on Offering
Not Disclosed
has been acquired by
a portfolio company of
$425,000,000
has been acquired by
a portfolio company of
Not Disclosed
has been acquired by
$325,000,000
is being acquired by
a portfolio company of
a portfolio company of
has been acquired by
a portfolio company of
Not Disclosed
$248,535,000
Bill.com(BILL)
Initial Public Offering
December 2019
$250,332,000
PagerDuty(PD)
Initial Public Offering
April 2019
$160,703,000
Sprout Social(SPT)
Initial Public Offering
December 2019
$287,339,000
nCino(NCNO)
Initial Public Offering
July 2020
$248,940,000
BigCommerce(BIGC)
Initial Public Offering
August 2020
Not Disclosed
has been acquired by
Not Disclosed
A business of
Has been acquired by
Not Disclosed
has been acquired by
$117,500,000
has been acquired by
$200,000,000
Rapid7(RPD)
Convertible Senior Notes
April 2020
$1,000,000,000
PTC(PTC)
Senior Notes
February 2020
$350,000,000
Bandwidth(BAND)
Convertible Senior Notes
February 2020

2020 Private SaaS Company Survey
48
DISCLOSURES
KeyBanc Capital Markets is a trade name under which corporate and investment banking products and services of KeyCorp and its subsidiaries, KeyBanc Capital Markets Inc., Member FINRA/SIPC (“KBCMI”), and KeyBank National Association (“KeyBank N.A.”), are marketed. Securities products and services are offered by KBCMI and its licensed securities representatives, who may also be employees of KeyBank N.A. Banking products and services are offered by KeyBank N.A.
The material contained herein is based on data from sources considered to be reliable; however, KeyBanc Capital Markets does not guarantee or warrant the accuracy or completeness of the information. This document is for informational purposes only. Neither the information nor any opinion expressed constitutes an offer, or the solicitation of an offer, to buy or sell any security. This document may contain forward-looking statements, which involve risk and uncertainty. Actual results may differ significantly from the forward-looking statements. This report is not intended to provide personal investment advice and it does not take into account the specific investment objectives, financial situation and the specific needs of any person or entity.
This communication is intended solely for the use by the recipient. The recipient agrees not to forward or copy the information to any other person outside their organization without the express written consent of KeyBanc Capital Markets Inc.
KBCMI IS NOT A BANK OR TRUST COMPANY AND IT DOES NOT ACCEPT DEPOSITS. THE OBLIGATIONS OF KBCMI ARE NOT OBLIGATIONS OF KEYBANK N.A. OR ANY OF ITS AFFILIATE BANKS, AND NONE OF KEYCORP’S BANKS ARE RESPONSIBLE FOR, OR GUARANTEE, THE SECURITIES OR SECURITIES-RELATED PRODUCTS OR SERVICES SOLD, OFFERED OR RECOMMENDED BY KBCMI OR ITS EMPLOYEES. SECURITIES AND OTHER INVESTMENT PRODUCTS SOLD, OFFERED OR RECOMMENDED BY KBCMI, IF ANY, ARE NOT BANK DEPOSITS OR OBLIGATIONS AND ARE NOT INSURED BY THE FDIC.
If you have questions or comments, please contact:
David Spitz
Adam Noily
Top Related