


Languages
Pages
Legal

April 24, 2017
IPO Review
ICICI Securities Ltd | Retail Equity Research
S Chand, incorporated in 1970, is India’s leading education content
company with a presence across the entire education lifecycle through K-
12 (73% of revenues), higher education (24% of revenues) and early
learning segments (3% of revenues). S Chand has a strong presence in
CBSE/ICSE affiliated schools. It offers 55 consumer brands across
knowledge products and services including ‘S Chand’, ‘Vikas’,
‘Madhubun’, ‘Saraswati’, ‘Destination Success’, and ‘Ingnitor’. Recently,
the company acquired 74% stake in Chhaya Prakashani to strengthen its
presence in Eastern India. Driven by a number of acquisitions, S Chand
posted revenue CAGR of 33% over FY12-16. In FY16, S Chand sold 35.5
million copies of a total of 11,144 titles.
Investment Rationale
Leading position in the K-12 market…
S Chand is India’s leading K-12 education content company in terms of
revenue, with a strong presence in CBSE/ICSE affiliated schools,
contributing 73% of consolidated revenues in FY16. From FY12-16, K-12
revenues grew at 46.83% CAGR. Initially, the company’s main foray was
into English grammar, science and maths subjects. In order to fill the
portfolio gaps with respect to individual subject strength, the company
acquired Madhubun and Vikas brands in FY13 (strong presence in Hindi
titles) and Saraswati brand (strength in French and arts & craft titles).
Through the Chhaya acquisition, S Chand expanded its presence in
eastern India. With a large number of students nowadays opting for CBSE
and ICSE boards, the company believes there is significant opportunity to
further increase market share in the K-12 segment.
Strong integrated in-housing printing and logistic capability…
S Chand has developed a robust supply chain ensuring optimisation of
back-end operations and processes. Over the last two years, the company
has spent ~| 45.3 crore capex to enhance its printing capacity from 15
tonnes of paper per day in FY14 to 55 tonnes of paper per day in FY16.
Captive requirements, to the extent of 85%, are fulfilled in-house.
Pan-India player…
S Chand has developed a strong distribution network consisting of 4932
distributors & dealers and an in-house sales team of 838 professionals
working from 52 branches and marketing offices. The company’s recent
acquisitions have helped it to diversify its geographical reach. Acquisition
of Saraswati (NSHPL) enhanced the distribution network in southern India
whereas acquisition of Vikas (VPHPL) added the distribution network in
north India. In addition, the Chhaya acquisition expanded its presence in
eastern India adding 771 more distributors.
Key risks and concerns
CBSE board advising schools to use only NCERT print content
High degree of seasonality in K-12 business
Obligation to acquire remaining 26% stake in Chhaya Prakashani
Priced at FY16 PE multiple of 50x (excluding Chhaya) on higher band
The standalone multiple on FY16 basis looks expensive at 50x. However,
accounting for the Chhaya merger, adjusted P/E appears at 34x FY16.
Completion of Chhaya acquisition would further strengthen S Chand’s
leadership position in the K-12 segment, which would enable it to post
15% revenue CAGR in the near term. We have a SUBSCRIBE
recommendation on the issue on the back of growth prospects.
S Chand Ltd
Price band | 660-670
Rating matrix
Rating : Subscribe
Issue Details
Issue Opens 26-Apr-17
Issue Closes 28-Apr-17
Issue Size (| Crore) 729
Fresh Issue 325
Offer for Sale 404
Price Band (|) 660-670
No of Shares on Offer (crore) 1.1
QIB (%) 50%
Non-Institutional (%) 15%
Retail (%) 35%
Minimum lot size (No. of shares) 22
Objects of issue
Amount
a) Repayment of loans availed by the company
and its subsidiaries, EPHL, which were utilized
towards funding the acquisition of Chhaya | 150.4 crore
b) Repayment/prepayment, in full or in part of
certain loans availed by the company and
certain of its subsidiaries, VPHL & NSHPL | 104.6 crore
c) General corporate purposes | 70 crore
20062006
Shareholding pattern (at upper price band: | 670)
Pre-Issue Post-Issue
Promoter & promoter group 58.3% 46.6%
Public 41.7% 53.4%
Financial Summary - EPS
| Crore FY14 FY15 FY16 9MFY17
Total Revenue 370.0 476.7 537.8 149.5
EBITDA 78.8 102.2 125.3 (84.9)
EBITDA Margin (%) 21.3 21.4 23.3 (56.8)
PAT 42.6 32.8 46.6 (88.5)
EPS* 12.3 9.4 13.4 (25.5)
* Considering post equity dilution
Valuation Summary (at upper price band: | 670)
(x) FY13 FY14 FY15 FY16
P/E 72.7 54.6 71.0 49.8
EV/EBITDA 43.5 31.6 24.4 19.9
Research Analyst
Bharat Chhoda
Ankit Panchmatia
Cheragh Sidhwa
Page 2 ICICI Securities Ltd | Retail Equity Research
Company Background
Incorporated in 1970, S Chand is India’s leading education content
company with a presence across the entire education lifecycle through K-
12 (73% of revenues), higher education (24% of revenues) and early
learning segments (3% of revenues). The company has a strong presence
in the CBSE/ICSE affiliated schools and increasing presence in state board
affiliated schools as well. S Chand offers 55 consumer brands across
knowledge products and services including ‘S Chand’, ‘Vikas’,
‘Madhubun’, ‘Saraswati’, ‘Destination Success’, and ‘Ingnitor’. Recently,
the company acquired a 74% stake in Chhaya Prakashani to strengthen in
presence in eastern India. In FY16, S Chand sold 35.47 million copies of a
total of 11,144 titles. Additionally Chhaya sold 9.88 million copies of 433
titles in FY16. The company has a contractual relationship with at least
1958 authors for over five years.
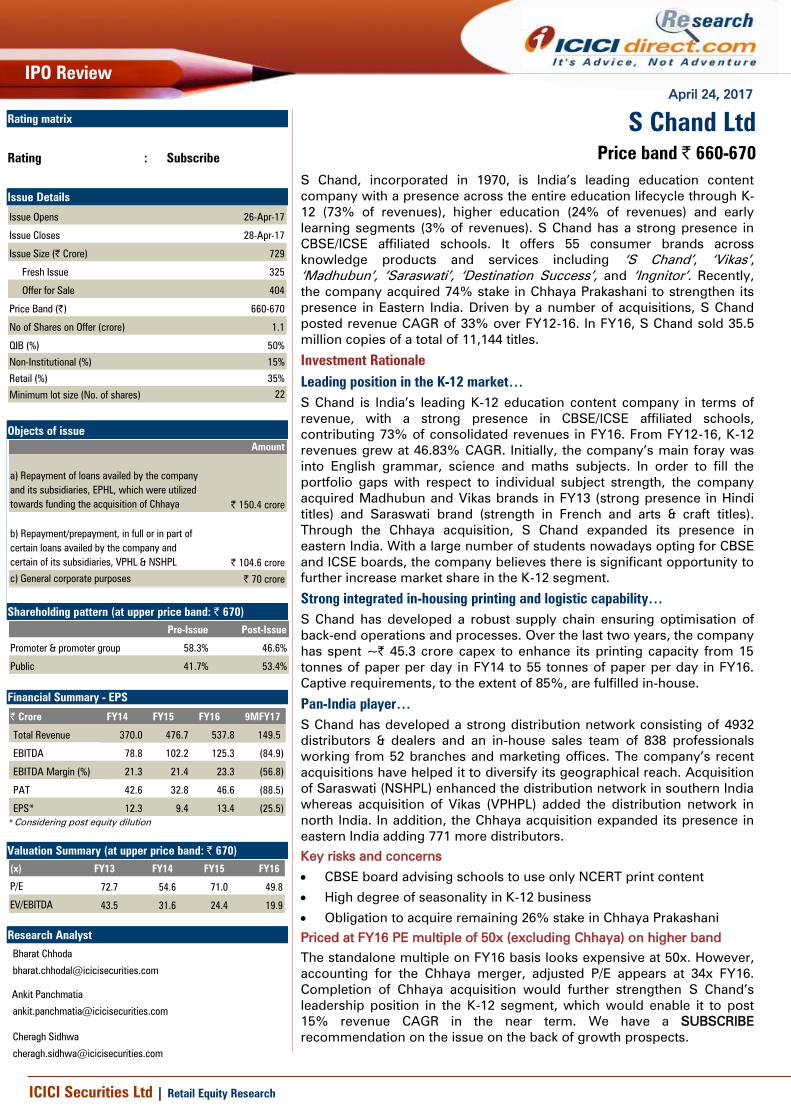
Exhibit 1: Sales mix trend
48.5%58.1% 58.7%
70.9% 72.5%
18.9%
13.3% 12.1%
9.2% 10.8%29.4% 24.8% 24.3%
16.8% 13.1%
0.0%
20.0%
40.0%
60.0%
80.0%
100.0%
120.0%
FY12 FY13 FY14 FY15 FY16
%
K-12 Test Preparation College & university Early learning
Source: DRHP, ICICIdirect.com Research
K-12 business: S Chand is India’s leading K-12 education content
company in terms of revenue, with a strong presence in the CBSE/ICSE
affiliated schools, contributing 73% of consolidated revenues in FY16.
Initially, the company’s main foray was into English grammar, science and
maths subjects. In order to fill the portfolio gaps with respect to individual
subject strength, S Chand acquired Madhubun and Vikas brands in FY13
(strong presence in Hindi titles) and Saraswati brand (strength in French
and arts & craft titles). Through the Chhaya acquisition, the company
expanded its presence in eastern India.
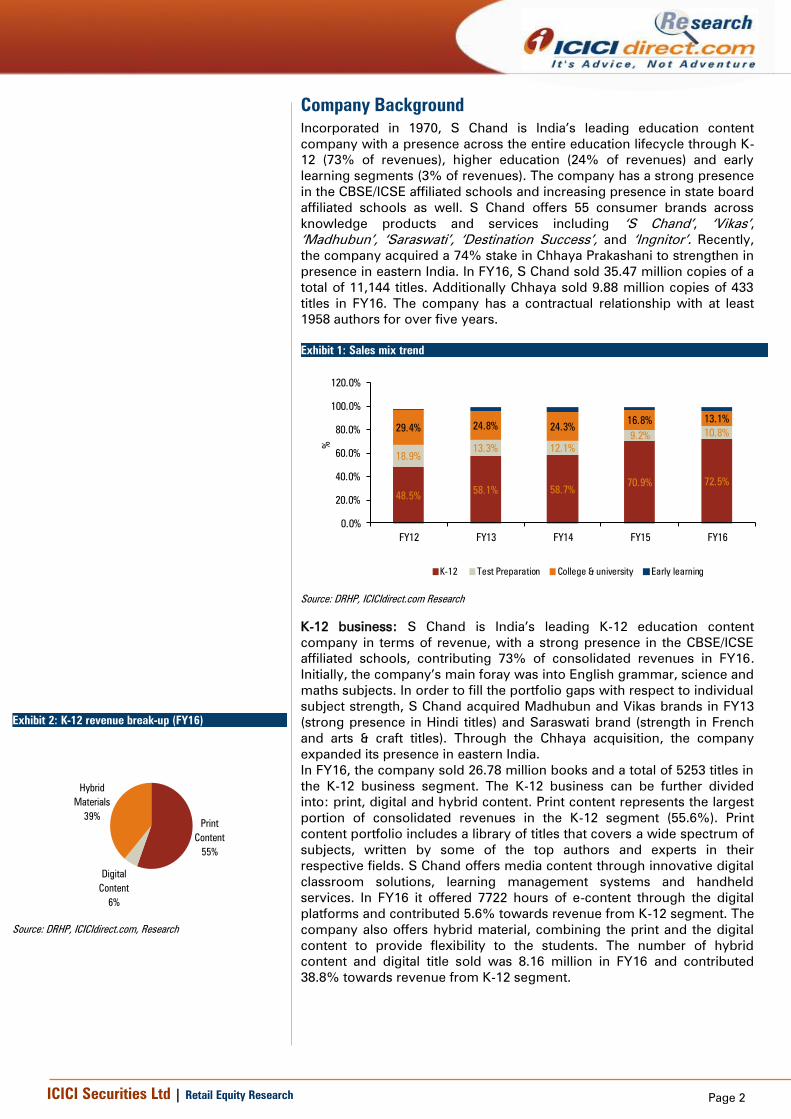
In FY16, the company sold 26.78 million books and a total of 5253 titles in
the K-12 business segment. The K-12 business can be further divided
into: print, digital and hybrid content. Print content represents the largest
portion of consolidated revenues in the K-12 segment (55.6%). Print
content portfolio includes a library of titles that covers a wide spectrum of
subjects, written by some of the top authors and experts in their
respective fields. S Chand offers media content through innovative digital
classroom solutions, learning management systems and handheld
services. In FY16 it offered 7722 hours of e-content through the digital
platforms and contributed 5.6% towards revenue from K-12 segment. The
company also offers hybrid material, combining the print and the digital
content to provide flexibility to the students. The number of hybrid
content and digital title sold was 8.16 million in FY16 and contributed
38.8% towards revenue from K-12 segment.
Exhibit 2: K-12 revenue break-up (FY16)
Hybrid
Materials
39%
Digital
Content
6%
Content
55%
Source: DRHP, ICICIdirect.com, Research

Page 3 ICICI Securities Ltd | Retail Equity Research
In FY12-16, K-12 consolidated revenues (excluding Chhaya) grew at
46.8% CAGR, which includes organic growth of 20.5%.
Exhibit 4: S Chand growth anchored by K-12 growth
83.9
162.0217.3
337.8389.8
123.1
0.0
100.0
200.0
300.0
400.0
500.0
600.0
FY12 FY13 FY14 FY15 FY16
| c
rore
K-12 Chhaya
Revenue contribution from
Chhaya acquired in
Dec,2016
Source: DRHP, ICICIdirect.com Research
Higher education business: This is the second largest segment by
consolidate revenues and comprises two components:
Test preparation
College & university/technical and professional
Test preparation: S Chand publishes niche test preparation titles in print
for popular professionals and entrance examinations in India, including
competitive and reference books for government and public sector
entrance examinations. The company has also started offering online test
preparation and assessment as well. In FY16, the company sold 1.98
million copies of 109 titles in test preparation and contributed 10.8%
towards consolidated revenues.
College & university/technical and professional: The company provides
content from graduation level to post graduation level in subjects such as
accounting, economics, physics, etc. The sales team works directly with
higher education institutions, from which they receive content
development requests. In FY16, the company sold 2.86 million copies and
contributed 13.1% towards consolidated revenues.
Early learning business: The early learning business caters to the
youngest customer market (0-4 years age), contributing 3.2% of
consolidated revenues.
Exhibit 3: K-12 book shelf…
Source: Company, ICICIdirect.com, Research
Source: DRHP, ICICIdirect.com, Research
Exhibit 5: Higher education book shelf…
Source: Company, ICICIdirect.com, Research
Exhibit 6: Higher education revenue break-up
50.969.2
89.979.9
70.4
32.7
37.1
44.6
43.9 57.9
0.0
20.0
40.0
60.0
80.0
100.0
120.0
140.0
160.0
FY12 FY13 FY14 FY15 FY16
| c
rore
College & university Test Preparation
Source: DRHP, ICICIdirect.com Research
Exhibit 7: Early learning book shelf…
Source: Company, ICICIdirect.com, Research
Page 4 ICICI Securities Ltd | Retail Equity Research
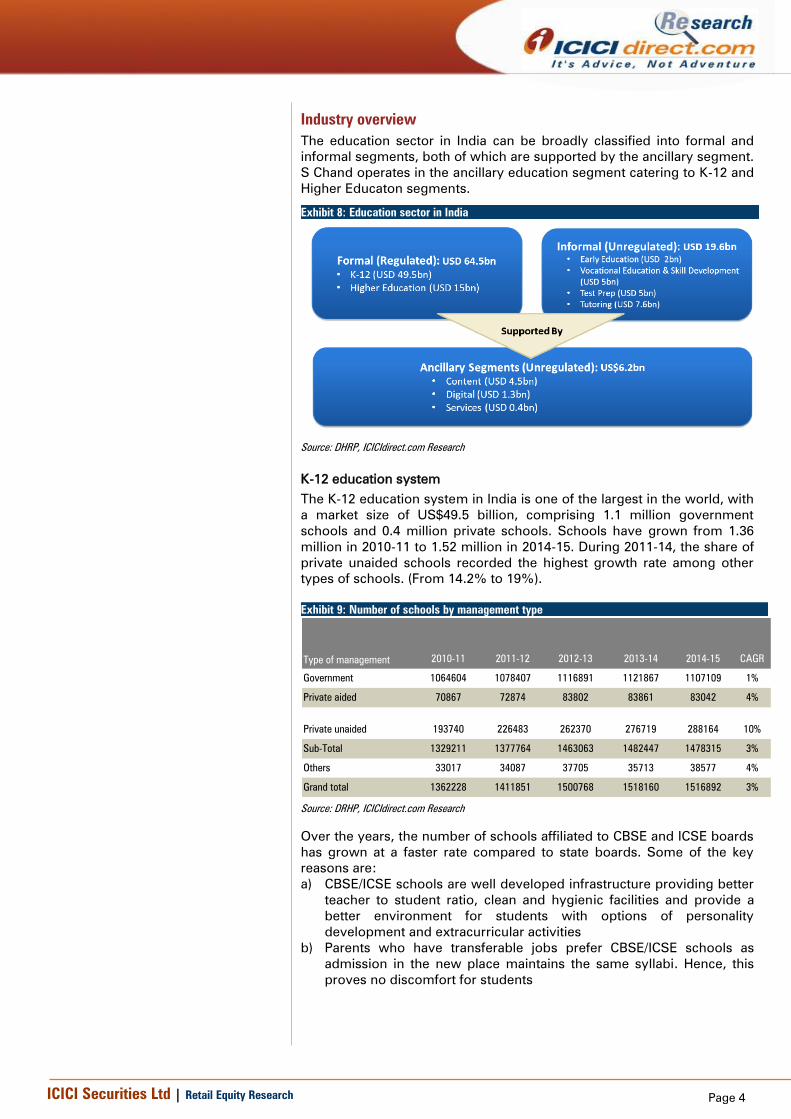
Industry overview
The education sector in India can be broadly classified into formal and
informal segments, both of which are supported by the ancillary segment.
S Chand operates in the ancillary education segment catering to K-12 and
Higher Educaton segments.
Exhibit 8: Education sector in India
Source: DHRP, ICICIdirect.com Research
K-12 education system
The K-12 education system in India is one of the largest in the world, with
a market size of US$49.5 billion, comprising 1.1 million government
schools and 0.4 million private schools. Schools have grown from 1.36
million in 2010-11 to 1.52 million in 2014-15. During 2011-14, the share of
private unaided schools recorded the highest growth rate among other
types of schools. (From 14.2% to 19%).
Exhibit 9: Number of schools by management type
2010-11 2011-12 2012-13 2013-14 2014-15 CAGR
Government 1064604 1078407 1116891 1121867 1107109 1%
Private aided 70867 72874 83802 83861 83042 4%
Private unaided 193740 226483 262370 276719 288164 10%
Sub-Total 1329211 1377764 1463063 1482447 1478315 3%
Others 33017 34087 37705 35713 38577 4%
Grand total 1362228 1411851 1500768 1518160 1516892 3%
Type of management
Source: DRHP, ICICIdirect.com Research
Over the years, the number of schools affiliated to CBSE and ICSE boards
has grown at a faster rate compared to state boards. Some of the key
reasons are:
a) CBSE/ICSE schools are well developed infrastructure providing better
teacher to student ratio, clean and hygienic facilities and provide a
better environment for students with options of personality
development and extracurricular activities
b) Parents who have transferable jobs prefer CBSE/ICSE schools as
admission in the new place maintains the same syllabi. Hence, this
proves no discomfort for students

Page 5 ICICI Securities Ltd | Retail Equity Research
The gradual shift of students from state board schools to CBSE/ICSE
school augurs well for the company, since it has a strong presence in
CBSE/ICSE affiliated schools.
Exhibit 10: Number of schools by affiliated boards
CAGR
2010-11 2011-12 2012-13 2013-14 2014-15
2010-11 to
2014-15 2015-16
CBSE 11349 12337 13898 14778 15933 8.9% 17474
ICSE 1461 1565 1678 1798 1927 7.2% 2181
State board 1316401 1363862 1447487 1465871 1460455 2.6% NA
Total 1329211 1377764 1463063 1482447 1478315 2.7% -
Boards
Source: DRHP, ICICIdirect.com Research
Ancillary segment
The ancillary segment of India’s education sector is estimated to be worth
~ US$6.2 billion in 2015, and is expected to grow at 21% CAGR up to
US$15.4 billion by 2020. The ancillary segment comprises the industries
related and supplementary to both formal and informal education
segments. Therefore, it is a direct beneficiary of growth in both education
segments. The K-12 education content market is estimated at US$3,366.2
million and has grown at 19.3% CAGR in 2011-15. With a large market
share, the state board affiliated school content market presents a large
opportunity for a pan-India content provider. Central board affiliated
schools (i.e. CBSE/ICSE schools) exhibited faster growth at 21.7% CAGR
in 2011-15, aided by participation of the private sector.
Exhibit 11: K-12 education content market (US$ million)
2010-11 2011-12 2012-13 2013-14 2014-15 CAGR
CBSE 203.1 251.5 304.6 371.8 445.2 21.7%
ICSE 28.1 34.4 40.6 50 59.4 20.5%
State board 1433.9 1718.2 2046.2 2477.7 2861.6 18.9%
Total 1665.1 2004.1 2391.4 2869.5 3366.2 19.3%
Total K-12
Source: DRHP, ICICIdirect.com Research
The school market segment is very fragmented. There are big national
content providers with a pan-India presence and several small national
content providers in addition to regional providers who are very strong in
their respective markets. There appears to be a consolidation opportunity
for large content providers who can acquire smaller providers with both a
national and, particularly, a regional presence. Such consolidation activity
would enable a better reach/brand equity and market share in Tier II cities
and towns where such regional content providers are already established
in their respective markets.
Page 6 ICICI Securities Ltd | Retail Equity Research
S Chand Strategies
Increasing share of the content spend in CBSE/ICSE schools
To compliment and diversify the home-grown product portfolio and S
Chand brand, over the years, the company has acquired various
education players to strengthen its offerings. As a result of such
acquisitions, the company has an expansive product range and strong
brands across multiple subject offerings. Going forward, S Chand is open
to further brand acquisitions, which would help it to provide
complementary content targeted at CBSE/ICSE affiliated schools. With the
growing middle class and emphasis on education, the company believes
there is significant opportunity to further increase the market share in
both volume and percentage.
Increasing presence in state board markets
According to Nielsen, the state board content is | 18320 crore and is the
largest part of the Indian K-12 market. To increase the market share in the
state board segment, the company intends to acquire leading regional
content houses in attractive markets. The company believes the regional
acquisitions would enable them to increase market share and acquire
distribution networks catering to state board affiliated schools.
Expanding presence in test preparation market
The company believes the test preparation market will continue to
expand as more government jobs become available that require
examinations at the national and state levels. In addition, many
examinations are now moving to the online format. The company intends
to build the online solution by investing in education technology
companies to leverage their innovative technologies and gain from the
company’s content and industry experience.
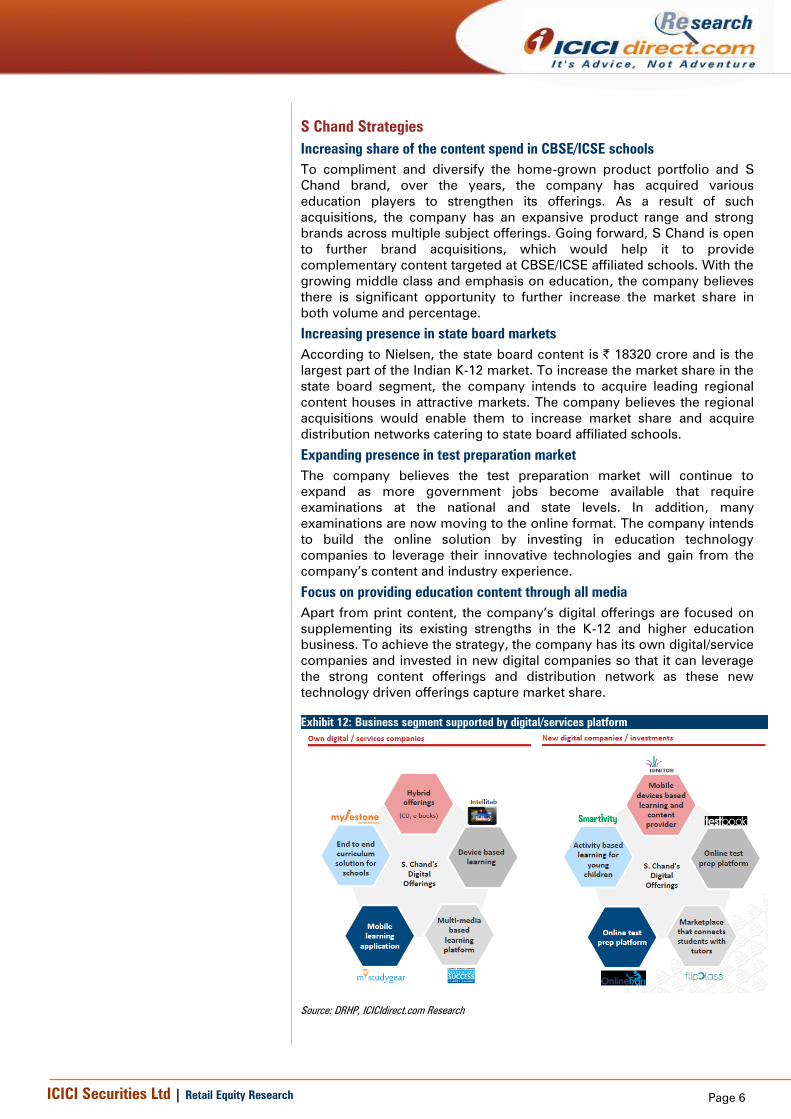
Focus on providing education content through all media
Apart from print content, the company’s digital offerings are focused on
supplementing its existing strengths in the K-12 and higher education
business. To achieve the strategy, the company has its own digital/service
companies and invested in new digital companies so that it can leverage
the strong content offerings and distribution network as these new
technology driven offerings capture market share.
Exhibit 12: Business segment supported by digital/services platform
Source: DRHP, ICICIdirect.com Research

Page 7 ICICI Securities Ltd | Retail Equity Research
Financial performance
S Chand clocked in a consolidated revenue growth of 33%CAGR in FY12-
16 to | 537.8 crore mainly anchored by growth in the K-12 segment. K-
12’s consolidated operating revenues grew at a CAGR of 47%, which
includes organic growth of 20%. In the same period, revenues from test
preparation and college/university segments grew at 15% and 8% to
| 57.9 crore and | 70.4 crore, respectively. Revenues from early learning
segment scaled up from | 10 lakh in FY12 to | 17.3 core in FY16. On a
consolidated basis, EBITDA during the period increased at 49% CAGR to
| 125.3 crore while PAT (after minority interest) grew at a CAGR of 33% to
| 46.6 crore.
The company’s business is linked to the academic cycle and is therefore,
seasonal. In the K-12 segment, the company’s sales season has
traditionally been the fourth quarter of the financial year, which
contributes ~75% of overall revenues and profitability. The first nine
months of the fiscal typically tend to be weak or have shown a loss.
Exhibit 13: Revenue trajectory- CAGR of 33% in FY12-16
173.0
279.0
370.0
476.7
537.8
149.5
0.0
100.0
200.0
300.0
400.0
500.0
600.0
FY12 FY13 FY14 FY15 FY16 9MFY17
| c
rore
Source: DRHP, ICICIdirect.com, Research
Exhibit 14: EBITDA growth- CAGR of 49% in FY12-16
25.5
57.3
78.8
102.2
125.3
-84.9
14.7
20.521.3 21.4
23.3
-100
-50
0
50
100
150
FY12 FY13 FY14 FY15 FY16 9MFY17
| cro
re
0
5
10
15
20
25
%
EBITDA EBITDA Margin
Source: DRHP, ICICIdirect.com, Research
Exhibit 15: Net profit- CAGR of 33% in FY12-16
14.7
32.0
42.6
32.8
46.6
-88.5
-100
-80
-60
-40
-20
0
20
40
60
FY12 FY13 FY14 FY15 FY16 9MFY17
| c
rore
Source: DRHP, ICICIdirect.com, Research
Exhibit 16: Return ratio trend
16.2
11.0 11.6
8.3 7.8
13.9
12.4
14.7
13.1 12.5
-
2.0
4.0
6.0
8.0
10.0
12.0
14.0
16.0
18.0
FY12 FY13 FY14 FY15 FY16
%
RoE RoCE
Source: DRHP, ICICIdirect.com, Research

Page 8 ICICI Securities Ltd | Retail Equity Research
Objects of issue
The offer consists of a fresh issue and an offer for sale (OFS) by selling
share holders with a total issue size ranging from | 722.5 crore to | 728.6
crore. The company intends to raise | 325 crore at a price band of | 660-
670 leading to a fresh issue of 48.5-49.2 lakh shares.
Objects of fresh issue:
The details of the proceeds of the fresh issue are summarised below:
a) The company intends to utilise | 150.4 crore of the net proceeds
towards repayment of loans availed by the company and one of its
subsidiaries, Eurasia (EPHL), which were utilised towards funding the
acquisition of Chhaya
b) The company intends to utilise | 104.6 crore of net proceeds towards
repayment/prepayment of loans availed by the company and certain
of its subsidiaries, VPHL and NSHPL
c) General corporate purpose, which includes payment of issue
expenses and other general expenses
Exhibit 17: Schedule of implementation and deployment of net proceeds
Total estimated costs
Amount to be funded from the net
proceeds FY18
Repayment of loans availed by the company, which was
utilised towards funding the acquisition of Chhaya | 100.0 | 100.0 | 100.0
Repayment of loans availed by Eurasia Publishing House Pvt
Ltd, one of the company's subsidiaries, which was utilised
towards funding the acquisition of Chhaya| 50.4 | 50.4 | 50.4
Repayment/prepayment in full or in part, of certain loans
availed by the company | 55.0 | 55.0 | 55.0
Repayment/prepayment in full or in part, of certain loans
availed by certain of the company's subsidiaries, VPHPL &
NSHPL | 49.6 | 49.6 | 49.6
General corporate purpose | 70.0 | 70.0 | 70.0
TOTAL | 325 crore
Particulars (|cr)
Estimated utilisation of net proceeds
Source: DRHP, ICICIdirect.com, Research
Offer for sale:
The OFS consists of to 60 lakh equity shares amounting to | 404 crore
from Everstone Capital, IFC and promoters. Post IPO, the stake dilution
will be as follows:
a) Promoters (From 58.3% to 46.7%)
b) Everstone Capital (From 32.3% to 13.9%)
c) IFC (From 9.4% to 8.1%)

Page 9 ICICI Securities Ltd | Retail Equity Research
Key risks and concerns
CBSE board advising schools to use only NCERT print content for all classes
The CBSE has issued circulars, dated April 12, 2016 and July 20, 2015,
recommending that schools affiliated to CBSE use only NCERT print
content for all classes, since all schools affiliated to the CBSE follow the
syllabi prescribed by NCERT up to K-8 and syllabi prescribed by the CBSE
from ninth grade to 12th grade. Further, the CBSE circulars also
recommended that schools affiliated to the CBSE should avoid insisting
that students purchase additional print content from private content
providers. These circulars may reduce demand for educational content
among CBSE affiliated schools and, accordingly, may adversely impact
the business, results of operations, cash flows and financial condition.
High degree of seasonality in K-12 business…
The company’s business is linked to the academic cycle and is therefore,
seasonal. In the K-12 segment, company’s sales season has traditionally
been the fourth quarter of the financial year. The first nine months of the
fiscal typically tends to be weak or have shown a loss. In addition, the
working capital cycle for print content in the CBSE/ICSE K-12 education
industry tends to be unduly high at the fiscal year end on account of high
sales in the last quarter, which then tapers down in subsequent quarters.
The company’s sales seasonality in its K-12 segment materially affects
operating revenue, margins and cash flows from quarter to quarter.
Heavy dependence on top authors to generate revenues…
A significant portion of the company’s revenues are derived from the top
20 authors. This concentration of revenues could potentially be a threat
with respect to negotiations regarding payment of royalties and other
terms. In FY16, the top 20 authors (in terms of revenue) contributed to
~48.94% of its total consolidated revenues from operations. The loss of
such authors could adversely affect the business, results of operation,
cash flows and financial condition.
Obligation to acquire remaining 26% stake in Chhaya Prakashani…
S Chand is obligated to acquire the remaining 26% outstanding share
capital of Chhaya Prakashani on or after November 15, 2018. The
company cannot assure that the business will generate sufficient cash
flow and may need to fund the remaining stake through additional debt.
Page 10 ICICI Securities Ltd | Retail Equity Research
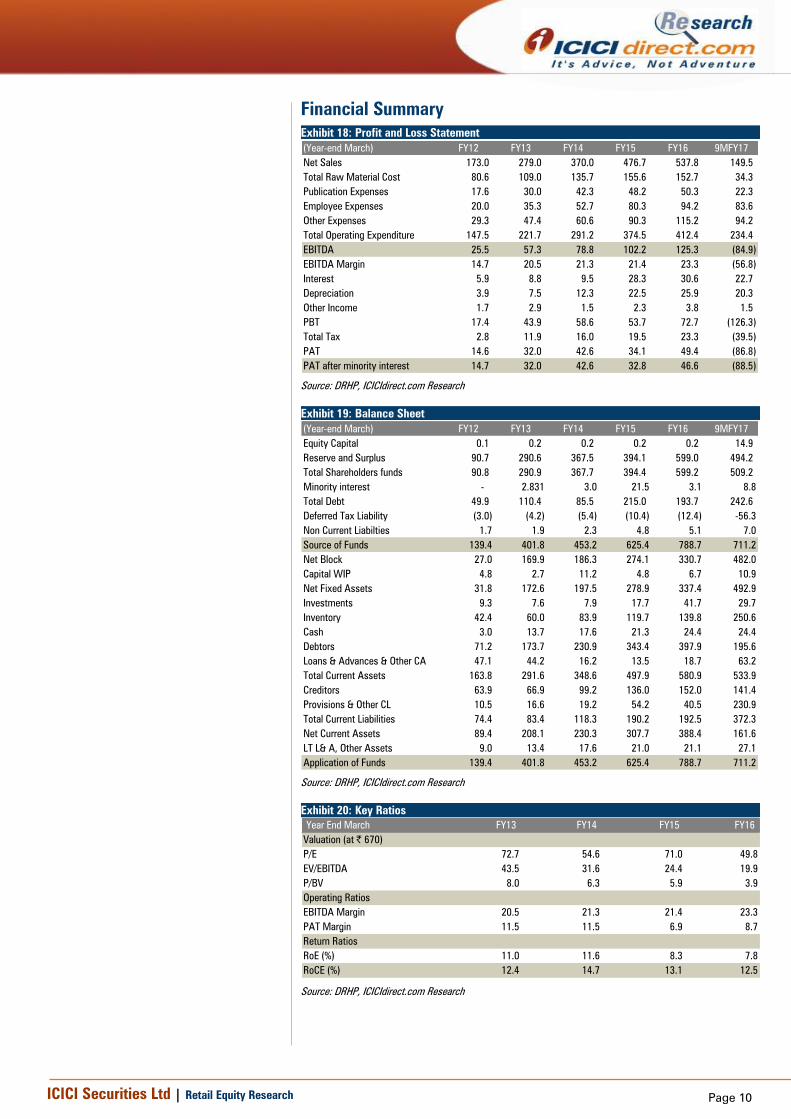
Financial Summary
Exhibit 18: Profit and Loss Statement
(Year-end March) FY12 FY13 FY14 FY15 FY16 9MFY17
Net Sales 173.0 279.0 370.0 476.7 537.8 149.5
Total Raw Material Cost 80.6 109.0 135.7 155.6 152.7 34.3
Publication Expenses 17.6 30.0 42.3 48.2 50.3 22.3
Employee Expenses 20.0 35.3 52.7 80.3 94.2 83.6
Other Expenses 29.3 47.4 60.6 90.3 115.2 94.2
Total Operating Expenditure 147.5 221.7 291.2 374.5 412.4 234.4
EBITDA 25.5 57.3 78.8 102.2 125.3 (84.9)
EBITDA Margin 14.7 20.5 21.3 21.4 23.3 (56.8)
Interest 5.9 8.8 9.5 28.3 30.6 22.7
Depreciation 3.9 7.5 12.3 22.5 25.9 20.3
Other Income 1.7 2.9 1.5 2.3 3.8 1.5
PBT 17.4 43.9 58.6 53.7 72.7 (126.3)
Total Tax 2.8 11.9 16.0 19.5 23.3 (39.5)
PAT 14.6 32.0 42.6 34.1 49.4 (86.8)
PAT after minority interest 14.7 32.0 42.6 32.8 46.6 (88.5)
Source: DRHP, ICICIdirect.com Research
Exhibit 19: Balance Sheet
(Year-end March) FY12 FY13 FY14 FY15 FY16 9MFY17
Equity Capital 0.1 0.2 0.2 0.2 0.2 14.9
Reserve and Surplus 90.7 290.6 367.5 394.1 599.0 494.2
Total Shareholders funds 90.8 290.9 367.7 394.4 599.2 509.2
Minority interest - 2.831 3.0 21.5 3.1 8.8
Total Debt 49.9 110.4 85.5 215.0 193.7 242.6
Deferred Tax Liability (3.0) (4.2) (5.4) (10.4) (12.4) -56.3
Non Current Liabilties 1.7 1.9 2.3 4.8 5.1 7.0
Source of Funds 139.4 401.8 453.2 625.4 788.7 711.2
Net Block 27.0 169.9 186.3 274.1 330.7 482.0
Capital WIP 4.8 2.7 11.2 4.8 6.7 10.9
Net Fixed Assets 31.8 172.6 197.5 278.9 337.4 492.9
Investments 9.3 7.6 7.9 17.7 41.7 29.7
Inventory 42.4 60.0 83.9 119.7 139.8 250.6
Cash 3.0 13.7 17.6 21.3 24.4 24.4
Debtors 71.2 173.7 230.9 343.4 397.9 195.6
Loans & Advances & Other CA 47.1 44.2 16.2 13.5 18.7 63.2
Total Current Assets 163.8 291.6 348.6 497.9 580.9 533.9
Creditors 63.9 66.9 99.2 136.0 152.0 141.4
Provisions & Other CL 10.5 16.6 19.2 54.2 40.5 230.9
Total Current Liabilities 74.4 83.4 118.3 190.2 192.5 372.3
Net Current Assets 89.4 208.1 230.3 307.7 388.4 161.6
LT L& A, Other Assets 9.0 13.4 17.6 21.0 21.1 27.1
Application of Funds 139.4 401.8 453.2 625.4 788.7 711.2
Source: DRHP, ICICIdirect.com Research
Exhibit 20: Key Ratios
Year End March FY13 FY14 FY15 FY16
Valuation (at | 670)
P/E 72.7 54.6 71.0 49.8
EV/EBITDA 43.5 31.6 24.4 19.9
P/BV 8.0 6.3 5.9 3.9
Operating Ratios
EBITDA Margin 20.5 21.3 21.4 23.3
PAT Margin 11.5 11.5 6.9 8.7
Return Ratios
RoE (%) 11.0 11.6 8.3 7.8
RoCE (%) 12.4 14.7 13.1 12.5
Source: DRHP, ICICIdirect.com Research
Page 11 ICICI Securities Ltd | Retail Equity Research
RATING RATIONALE
ICICIdirect.com endeavours to provide objective opinions and recommendations. ICICIdirect.com assigns
ratings to its stocks according to their notional target price vs. current market price and then categorises them
as Strong Buy, Buy, Hold and Sell. The performance horizon is two years unless specified and the notional
target price is defined as the analysts' valuation for a stock.
Strong Buy: >15%/20% for large caps/midcaps, respectively, with high conviction;
Buy: >10%/15% for large caps/midcaps, respectively;
Hold: Up to +/-10%;
Sell: -10% or more;
Pankaj Pandey Head – Research [email protected]
ICICIdirect.com Research Desk,
ICICI Securities Limited,
1st Floor, Akruti Trade Centre,
Road No 7, MIDC,
Andheri (East)
Mumbai – 400 093

Page 12 ICICI Securities Ltd | Retail Equity Research
Disclaimer
ANALYST CERTIFICATION
We /I, Bharat Chhoda, MBA, Ankit Panchmatia, MBA and Cheragh Sidhwa, MBA Research Analysts, authors and the names subscribed to this report, hereby certify that all of the views expressed in this
research report accurately reflect our views about the subject issuer(s) or securities. We also certify that no part of our compensation was, is, or wil l be directly or indirectly related to the specific
recommendation(s) or view(s) in this report.
Terms & conditions and other disclosures:
ICICI Securities Limited (ICICI Securities) is a full-service, integrated investment banking and is, inter alia, engaged in the business of stock brokering and distribution of financial products. ICICI Securities
Limited is a Sebi registered Research Analyst with Sebi Registration Number – INH000000990. ICICI Securities is a wholly-owned subsidiary of ICICI Bank which is India’s largest private sector bank and has
its various subsidiaries engaged in businesses of housing finance, asset management, life insurance, general insurance, venture capital fund management, etc. (“associates”), the details in respect of which
are available on www.icicibank.com.
ICICI Securities is one of the leading merchant bankers/ underwriters of securities and participate in virtually all securities trading markets in India. We and our associates might have investment banking
and other business relationship with a significant percentage of companies covered by our Investment Research Department. ICICI Securities generally prohibits its analysts, persons reporting to analysts
and their relatives from maintaining a financial interest in the securities or derivatives of any companies that the analysts cover.
The information and opinions in this report have been prepared by ICICI Securities and are subject to change without any notice. The report and information contained herein is strictly confidential and
meant solely for the selected recipient and may not be altered in any way, transmitted to, copied or distributed, in part or in whole, to any other person or to the media or reproduced in any form, without
prior written consent of ICICI Securities. While we would endeavour to update the information herein on a reasonable basis, ICICI Securitiesis under no obligation to update or keep the information current.
Also, there may be regulatory, compliance or other reasons that may prevent ICICI Securities from doing so. Non-rated securities indicate that rating on a particular security has been suspended
temporarily and such suspension is in compliance with applicable regulations and/or ICICI Securities policies, in circumstances where ICICI Securities might be acting in an advisory capacity to this
company, or in certain other circumstances.
This report is based on information obtained from public sources and sources believed to be reliable, but no independent verification has been made nor is its accuracy or completeness guaranteed. This
report and information herein is solely for informational purpose and shall not be used or considered as an offer document or solicitation of offer to buy or sell or subscribe for securities or other financial
instruments. Though disseminated to all the customers simultaneously, not all customers may receive this report at the same time. ICICI Securities will not treat recipients as customers by virtue of their
receiving this report. Nothing in this report constitutes investment, legal, accounting and tax advice or a representation that any investment or strategy is suitable or appropriate to your specific
circumstances. The securities discussed and opinions expressed in this report may not be suitable for all investors, who must make their own investment decisions, based on their own investment
objectives, financial positions and needs of specific recipient. This may not be taken in substitution for the exercise of independent judgment by any recipient. The recipient should independently evaluate
the investment risks. The value and return on investment may vary because of changes in interest rates, foreign exchange rates or any other reason. ICICI Securities accepts no liabilities whatsoever for any
loss or damage of any kind arising out of the use of this report. Past performance is not necessarily a guide to future performance. Investors are advised to see Risk Disclosure Document to understand the
risks associated before investing in the securities markets. Actual results may differ materially from those set forth in projections. Forward-looking statements are not predictions and may be subject to
change without notice.
ICICI Securities or its associates might have managed or co-managed public offering of securities for the subject company or might have been mandated by the subject company for any other assignment
in the past twelve months.
ICICI Securities or its associates might have received any compensation from the companies mentioned in the report during the period preceding twelve months from the date of this report for services in
respect of managing or co-managing public offerings, corporate finance, investment banking or merchant banking, brokerage services or other advisory service in a merger or specific transaction.
ICICI Securities or its associates might have received any compensation for products or services other than investment banking or merchant banking or brokerage services from the companies mentioned
in the report in the past twelve months.
ICICI Securities encourages independence in research report preparation and strives to minimize conflict in preparation of research report. ICICI Securities or its associates or its analysts did not receive any
compensation or other benefits from the companies mentioned in the report or third party in connection with preparation of the research report. Accordingly, neither ICICI Securities nor Research Analysts
and their relatives have any material conflict of interest at the time of publication of this report.
It is confirmed that Bharat Chhoda, MBA, Ankit Panchmatia, MBA and Cheragh Sidhwa, MBA Research Analysts of this report have not received any compensation from the companies mentioned in the
report in the preceding twelve months.
Compensation of our Research Analysts is not based on any specific merchant banking, investment banking or brokerage service transactions.
ICICI Securities or its subsidiaries collectively or Research Analysts or their relatives do not own 1% or more of the equity securities of the Company mentioned in the report as of the last day of the month
preceding the publication of the research report.
Since associates of ICICI Securities are engaged in various financial service businesses, they might have financial interests or beneficial ownership in various companies including the subject
company/companies mentioned in this report.
It is confirmed that Bharat Chhoda, MBA, Ankit Panchmatia, MBA and Cheragh Sidhwa, MBA Research Analysts do not serve as an officer, director or employee of the companies mentioned in the report.
ICICI Securities may have issued other reports that are inconsistent with and reach different conclusion from the information presented in this report.
Neither the Research Analysts nor ICICI Securities have been engaged in market making activity for the companies mentioned in the report.
We submit that no material disciplinary action has been taken on ICICI Securities by any Regulatory Authority impacting Equity Research Analysis activities.
This report is not directed or intended for distribution to, or use by, any person or entity who is a citizen or resident of or located in any locality, state, country or other jurisdiction, where such distribution,
publication, availability or use would be contrary to law, regulation or which would subject ICICI Securities and affiliates to any registration or licensing requirement within such jurisdiction. The securities
described herein may or may not be eligible for sale in all jurisdictions or to certain category of investors. Persons in whose possession this document may come are required to inform themselves of and
to observe such restriction.