


Languages
Pages
Legal


RPS Modeling RPS Modeling
ResultsResults
Second RoundSecond Round
Presentation to RPS Policy CommitteeBrian Gregor
Transportation Planning Analysis UnitJanuary 9, 2007
1

• Modeling objective and status
• Presentation of modeling results
• Conclusions and Next Steps
Presentation OutlinePresentation Outline
2

Modeling Objective and Modeling Objective and StatusStatus
3

Modeling ObjectiveModeling Objective
• Previous modeling showed that traffic growth from population doubling will result in large amounts of congestion if only the road improvements identified in the RTP are built.
• The committee asked us to model a more expansive road expansion plan.
– What problems would be solved and what remain?
– How do land use patterns affect the problems?
4

Modeling StatusModeling Status
• An enhanced road network was developed by the RPS TAC and coded into the model.
• Transportation modeling was done on the enhanced road network for the same land use growth scenarios modeled previously.
• High level evaluation of the modeling was done. More detailed examination still needs to be done.
5

TerminologyTerminology
• “RTP Network” - The 2030 financially constrained network adopted in the regional transportation plan.
• “Enhanced Network” - The RTP network plus a number of additional capacity improvements identified by the RPS TAC.
• “Land Use Scenarios” - 30 plausible land use patterns based on a population doubling, existing comprehensive plans and proposed growth areas.
6

Terminology ContinuedTerminology Continued
• “Vehicle Miles Traveled (VMT)” - A generalized measure of total vehicle travel. It is calculated by multiplying the daily traffic volume on each road section by the length of the section. VMT can be totaled for the whole road system or parts of the road system.
• “Lane-miles” - A generalized measure of the size of the roadway system. It is calculated by multiplying the number of lanes on a road section by the length of the road section. It may be totaled for the whole road system or parts of the road system.
7

Modeling Modeling ResultsResults
8

Total VMTTotal VMT• Total VMT grows substantially because of the
population doubling.
• VMT grows at a slightly lower rate than population. VMT per person declines slightly.– Base Year: 17.5
– RTP Network: 17.0 – 17.2
– Enhanced Network: 17.2 – 17.4
• Rising congestion is responsible for the declines in VMT per person. The decline is less for the enhanced network because congestion is lower.
• The variation in land use doesn’t result in much variation in VMT. For land use to have a significant effect on the amount of vehicle travel, development densities is much too low and is not focused in areas where travel by car is less necessary.
9

Where is Traffic Growing?Where is Traffic Growing?
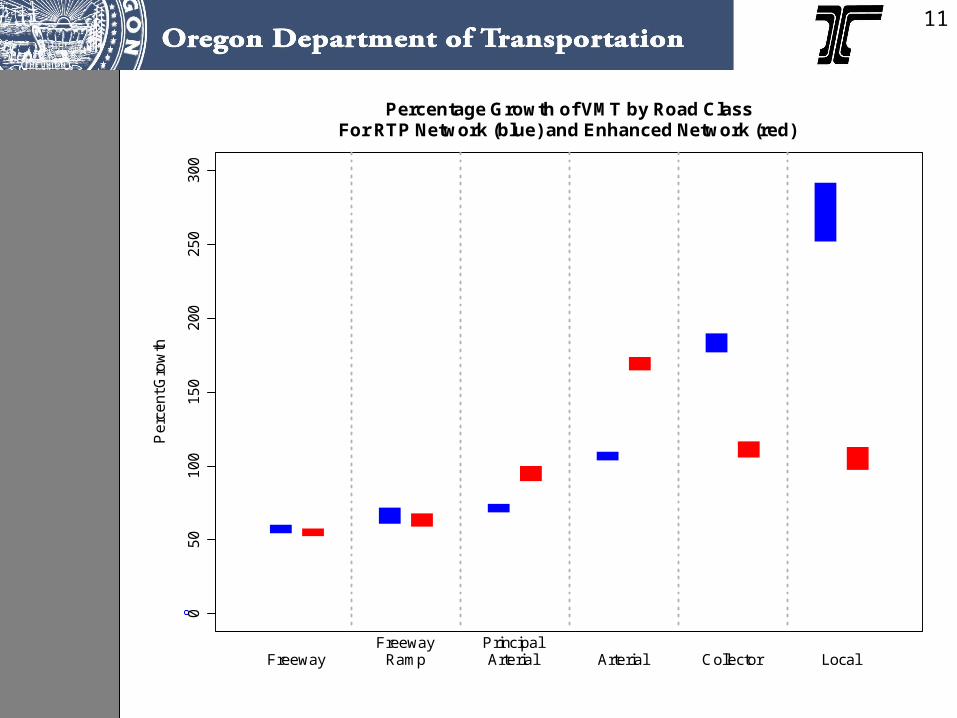
• With the RTP Network, traffic growth is greater on the lower order road classes (e.g. collector, local). High levels of congestion on arterials encourages a shift towards more travel on collectors and locals.
• The greatest variability in traffic growth occurs on the local roads because they are most directly affected by differences in land use patterns.
• The Enhanced Network greatly reduces the growth of traffic on collectors and locals, and increases it on arterials.
10
11
Percentage Growth of VMT by Road ClassFor RTP Network (blue) and Enhanced Network (red)
Pe
rce
nt G
row
th
FreewayFreeway
RampPrincipalArterial Arterial Collector Local
05
01
00
15
02
00
25
03
00

12
Percentage Growth of VMT by Road ClassFor RTP Network (blue) and Enhanced Network (red)
Pe
rce
nt G
row
th
FreewayFreeway
RampPrincipalArterial Arterial Collector Local
05
01
00
15
02
00
25
03
00
Traffic grows most rapidly on the lower functional class roads with the RTP Network. Growth of traffic on the local roads is most sensitive to land use patterns.

13
Percentage Growth of VMT by Road ClassFor RTP Network (blue) and Enhanced Network (red)
Pe
rce
nt G
row
th
FreewayFreeway
RampPrincipalArterial Arterial Collector Local
05
01
00
15
02
00
25
03
00
Congestion on major roads dampens traffic growth on them. The Enhanced Network does not significantly change the growth rate. Growth of traffic on freeway ramps is relatively sensitive to land use.

14
Percentage Growth of VMT by Road ClassFor RTP Network (blue) and Enhanced Network (red)
Pe
rce
nt G
row
th
FreewayFreeway
RampPrincipalArterial Arterial Collector Local
05
01
00
15
02
00
25
03
00
Enhanced network increases traffic growth on arterials and reduces on collectors and locals. It does the reverse to variability.

Traffic DistributionTraffic Distribution• The largest percentage of VMT occurs on
freeways.
• The percentage of VMT on freeways drops with both the RTP and Enhanced networks, but still remains the biggest component.
• The percentage of VMT on principal arterials also drops, but by a lesser amount.
• The percentage of VMT on arterials, collectors and locals increases.
• The Enhanced Network increases (relative to RTP Network) the percentage of traffic on arterials and reduces the percentages on collectors and locals.
15

16
Comparison of Percent of VMT by Road ClassRTP Network (blue), Enhanced Network (red), Base Year (black)
Pe
rce
nt o
f To
tal V
eh
icle
Mile
s T
rave
led
(V
MT
)
FreewayFreeway
RampPrincipalArterial Arterial Collector Local
01
02
03
04
0

17
Comparison of Percent of VMT by Road ClassRTP Network (blue), Enhanced Network (red), Base Year (black)
Pe
rce
nt o
f To
tal V
eh
icle
Mile
s T
rave
led
(V
MT
)
FreewayFreeway
RampPrincipalArterial Arterial Collector Local
01
02
03
04
0The freeway carries most of the traffic in the region. It cannot keep accommodating this percentage in the face of rising traffic. Even though the percentages drop, it still is the most important component of the road network.

18
Comparison of Percent of VMT by Road ClassRTP Network (blue), Enhanced Network (red), Base Year (black)
Pe
rce
nt o
f To
tal V
eh
icle
Mile
s T
rave
led
(V
MT
)
FreewayFreeway
RampPrincipalArterial Arterial Collector Local
01
02
03
04
0The percent of traffic carried on principal arterials declines a small amount. The Enhanced Network allows these roads to continue carrying the current percentage.
19
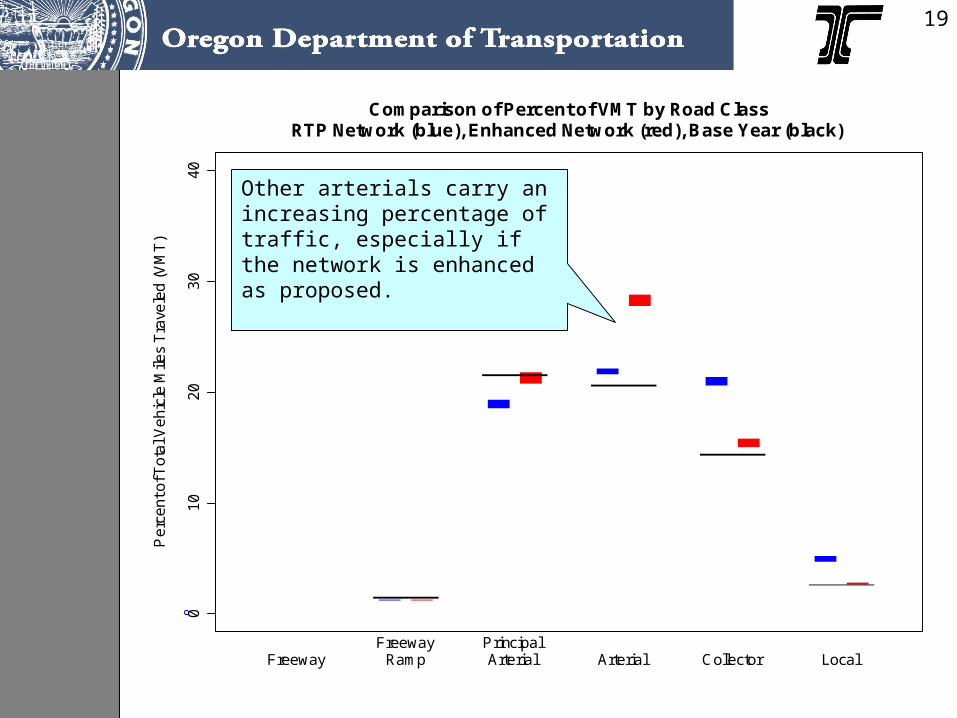
Comparison of Percent of VMT by Road ClassRTP Network (blue), Enhanced Network (red), Base Year (black)
Pe
rce
nt o
f To
tal V
eh
icle
Mile
s T
rave
led
(V
MT
)
FreewayFreeway
RampPrincipalArterial Arterial Collector Local
01
02
03
04
0Other arterials carry an increasing percentage of traffic, especially if the network is enhanced as proposed.

20
Comparison of Percent of VMT by Road ClassRTP Network (blue), Enhanced Network (red), Base Year (black)
Pe
rce
nt o
f To
tal V
eh
icle
Mile
s T
rave
led
(V
MT
)
FreewayFreeway
RampPrincipalArterial Arterial Collector Local
01
02
03
04
0
Collectors and locals also carry an increased percentage, but with the Enhanced Network, the percentages are close to current levels.

Congested RoadsCongested Roads
• The percentage of VMT on arterials, collectors and locals increases. That occurs because congestion on the higher order roads makes it relatively more attractive for drivers to use these roads that would be slower in less congested conditions.
• The Enhanced network increases the percentage of traffic on arterials and reduces the percentages on collectors and locals relative to the RTP network. Improvements to the arterial system make it more attractive for drivers to stay on that part of the system and stay off the lower volume roads.
21

22
Freeway
Per
cent
of L
ane
Mile
s
LowCongestion Congestion
HighCongestion
020
4060
8010
0
Freeway Ramp
Per
cent
of L
ane
Mile
s
LowCongestion Congestion
HighCongestion
020
4060
8010
0
Principal Arterial
Per
cent
of L
ane
Mile
s
LowCongestion Congestion
HighCongestion
020
4060
8010
0
Arterial
Per
cent
of L
ane
Mile
s
LowCongestion Congestion
HighCongestion
020
4060
8010
0
CollectorPer
cent
of L
ane
Mile
s
LowCongestion Congestion
HighCongestion
020
4060
8010
0
Local
Per
cent
of L
ane
Mile
sLow
Congestion CongestionHigh
Congestion
020
4060
8010
0
Comparison of Percent of Lane Miles by Congestion LevelRTP Network (blue), Enhanced Network (red), Base Year (black)

23
Freeway
Per
cent
of L
ane
Mile
s
LowCongestion Congestion
HighCongestion
020
4060
8010
0
Freeway Ramp
Per
cent
of L
ane
Mile
s
LowCongestion Congestion
HighCongestion
020
4060
8010
0
Principal Arterial
Per
cent
of L
ane
Mile
s
LowCongestion Congestion
HighCongestion
020
4060
8010
0
Arterial
Per
cent
of L
ane
Mile
s
LowCongestion Congestion
HighCongestion
020
4060
8010
0
CollectorPer
cent
of L
ane
Mile
s
LowCongestion Congestion
HighCongestion
020
4060
8010
0
Local
Per
cent
of L
ane
Mile
sLow
Congestion CongestionHigh
Congestion
020
4060
8010
0
Comparison of Percent of Lane Miles by Congestion LevelRTP Network (blue), Enhanced Network (red), Base Year (black)
•The percentage of the freeway system that is congested or highly congested increases in the future.
•The percentage that is highly congested in the future equals the percentage that has low congestion today.
•The Enhanced Network does not significantly improve the condition over the RTP Network.

24
Freeway
Per
cent
of L
ane
Mile
s
LowCongestion Congestion
HighCongestion
020
4060
8010
0
Freeway Ramp
Per
cent
of L
ane
Mile
s
LowCongestion Congestion
HighCongestion
020
4060
8010
0
Principal Arterial
Per
cent
of L
ane
Mile
s
LowCongestion Congestion
HighCongestion
020
4060
8010
0
Arterial
Per
cent
of L
ane
Mile
s
LowCongestion Congestion
HighCongestion
020
4060
8010
0
CollectorPer
cent
of L
ane
Mile
s
LowCongestion Congestion
HighCongestion
020
4060
8010
0
Local
Per
cent
of L
ane
Mile
sLow
Congestion CongestionHigh
Congestion
020
4060
8010
0
Comparison of Percent of Lane Miles by Congestion LevelRTP Network (blue), Enhanced Network (red), Base Year (black)
•The percentage of freeway ramps that are congested or very congested increases significantly.
•The Enhanced Network reduces the amount of congested sections, but does not have much effect on the amount of very congested sections.
•Ramp congestion is significantly affected by land use patterns.
•Ramp congestion measures are very approximate. More detailed analysis is needed.
25
Freeway
Per
cent
of L
ane
Mile
s
LowCongestion Congestion
HighCongestion
020
4060
8010
0
Freeway Ramp
Per
cent
of L
ane
Mile
s
LowCongestion Congestion
HighCongestion
020
4060
8010
0
Principal Arterial
Per
cent
of L
ane
Mile
s
LowCongestion Congestion
HighCongestion
020
4060
8010
0
Arterial
Per
cent
of L
ane
Mile
s
LowCongestion Congestion
HighCongestion
020
4060
8010
0
CollectorPer
cent
of L
ane
Mile
s
LowCongestion Congestion
HighCongestion
020
4060
8010
0
Local
Per
cent
of L
ane
Mile
sLow
Congestion CongestionHigh
Congestion
020
4060
8010
0
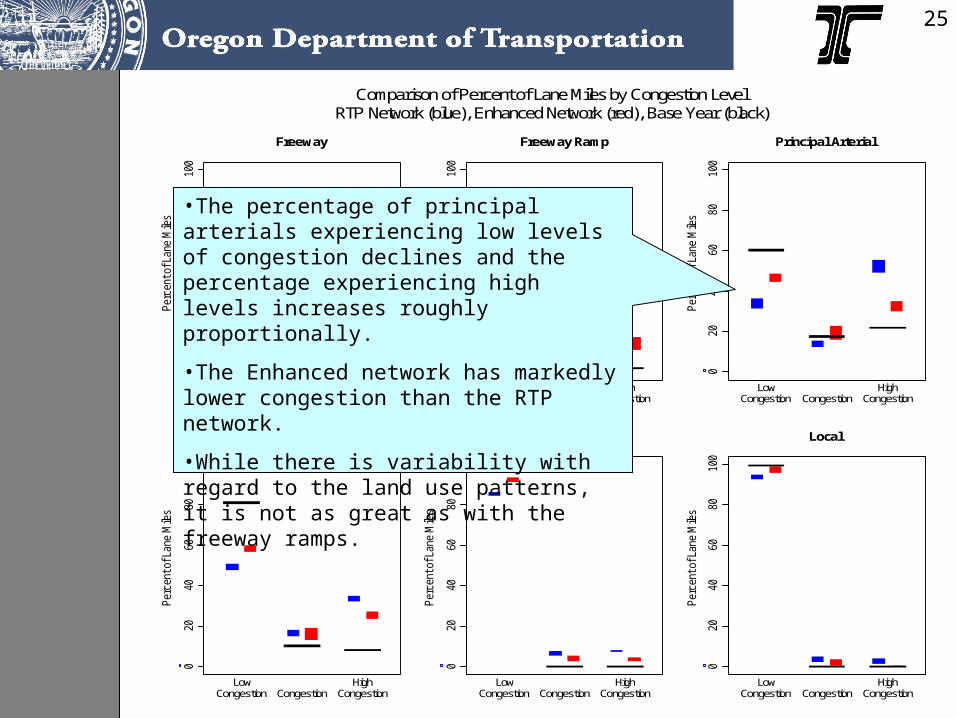
Comparison of Percent of Lane Miles by Congestion LevelRTP Network (blue), Enhanced Network (red), Base Year (black)
•The percentage of principal arterials experiencing low levels of congestion declines and the percentage experiencing high levels increases roughly proportionally.
•The Enhanced network has markedly lower congestion than the RTP network.
•While there is variability with regard to the land use patterns, it is not as great as with the freeway ramps.
26
Freeway
Per
cent
of L
ane
Mile
s
LowCongestion Congestion
HighCongestion
020
4060
8010
0
Freeway Ramp
Per
cent
of L
ane
Mile
s
LowCongestion Congestion
HighCongestion
020
4060
8010
0
Principal Arterial
Per
cent
of L
ane
Mile
s
LowCongestion Congestion
HighCongestion
020
4060
8010
0
Arterial
Per
cent
of L
ane
Mile
s
LowCongestion Congestion
HighCongestion
020
4060
8010
0
CollectorPer
cent
of L
ane
Mile
s
LowCongestion Congestion
HighCongestion
020
4060
8010
0
Local
Per
cent
of L
ane
Mile
sLow
Congestion CongestionHigh
Congestion
020
4060
8010
0
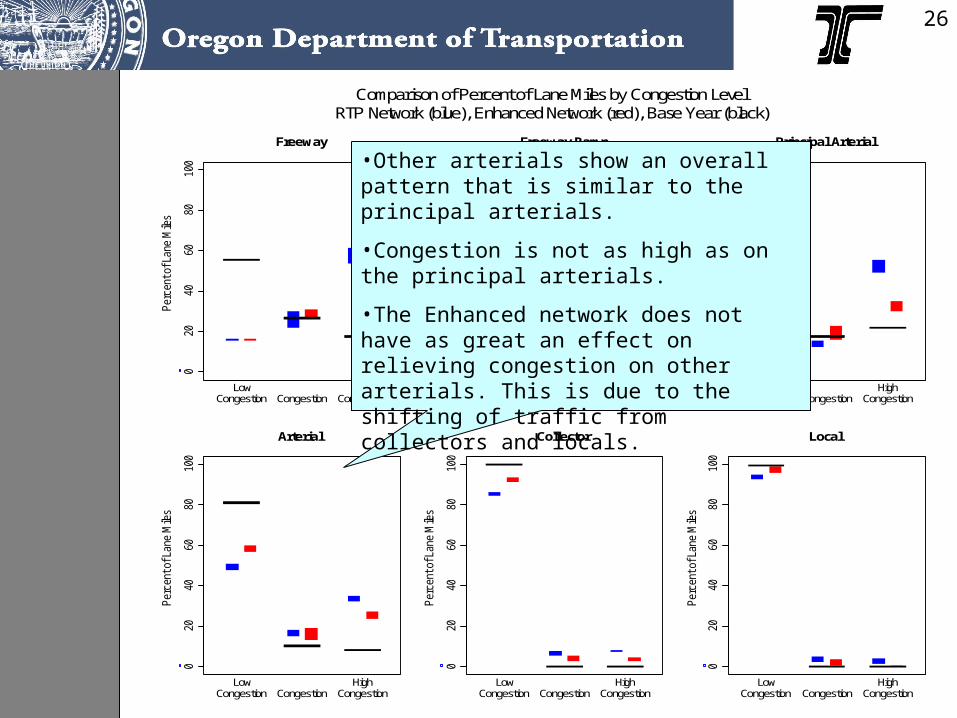
Comparison of Percent of Lane Miles by Congestion LevelRTP Network (blue), Enhanced Network (red), Base Year (black)
•Other arterials show an overall pattern that is similar to the principal arterials.
•Congestion is not as high as on the principal arterials.
•The Enhanced network does not have as great an effect on relieving congestion on other arterials. This is due to the shifting of traffic from collectors and locals.

27
Freeway
Per
cent
of L
ane
Mile
s
LowCongestion Congestion
HighCongestion
020
4060
8010
0
Freeway Ramp
Per
cent
of L
ane
Mile
s
LowCongestion Congestion
HighCongestion
020
4060
8010
0
Principal Arterial
Per
cent
of L
ane
Mile
s
LowCongestion Congestion
HighCongestion
020
4060
8010
0
Arterial
Per
cent
of L
ane
Mile
s
LowCongestion Congestion
HighCongestion
020
4060
8010
0
CollectorPer
cent
of L
ane
Mile
s
LowCongestion Congestion
HighCongestion
020
4060
8010
0
Local
Per
cent
of L
ane
Mile
sLow
Congestion CongestionHigh
Congestion
020
4060
8010
0
Comparison of Percent of Lane Miles by Congestion LevelRTP Network (blue), Enhanced Network (red), Base Year (black)
•Congestion on collectors and locals does not increase much because these are lower volume streets that tend to have a lot of capacity in reserve.
•Congestion does not vary much with land use patterns, because it is low to begin with.

Congested TravelCongested Travel
• The amount of travel affected by congestion (VMT) increases more than the amount of the road system (lane-miles) that experiences congestion.
• The Enhanced Network does not have as great an effect on congested travel.
• Freeway ramp congestion is a looming problem and is very sensitive to land use patterns.
28

29
Freeway
Per
cent
of V
MT
LowCongestion Congestion
HighCongestion
020
4060
8010
0
Freeway Ramp
Per
cent
of V
MT
LowCongestion Congestion
HighCongestion
020
4060
8010
0
Principal Arterial
Per
cent
of V
MT
LowCongestion Congestion
HighCongestion
020
4060
8010
0
Arterial
Per
cent
of V
MT
LowCongestion Congestion
HighCongestion
020
4060
8010
0
CollectorPer
cent
of V
MT
LowCongestion Congestion
HighCongestion
020
4060
8010
0
Local
Per
cent
of V
MT
LowCongestion Congestion
HighCongestion
020
4060
8010
0
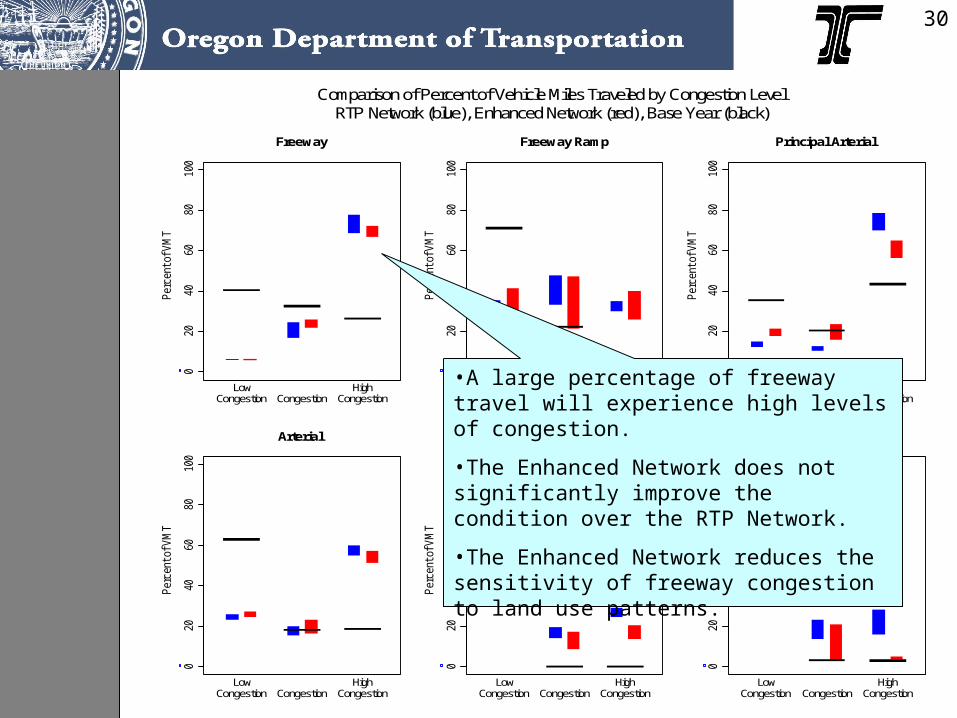
Comparison of Percent of Vehicle Miles Traveled by Congestion LevelRTP Network (blue), Enhanced Network (red), Base Year (black)
30
Freeway
Per
cent
of V
MT
LowCongestion Congestion
HighCongestion
020
4060
8010
0
Freeway Ramp
Per
cent
of V
MT
LowCongestion Congestion
HighCongestion
020
4060
8010
0
Principal Arterial
Per
cent
of V
MT
LowCongestion Congestion
HighCongestion
020
4060
8010
0
Arterial
Per
cent
of V
MT
LowCongestion Congestion
HighCongestion
020
4060
8010
0
CollectorPer
cent
of V
MT
LowCongestion Congestion
HighCongestion
020
4060
8010
0
Local
Per
cent
of V
MT
LowCongestion Congestion
HighCongestion
020
4060
8010
0
Comparison of Percent of Vehicle Miles Traveled by Congestion LevelRTP Network (blue), Enhanced Network (red), Base Year (black)
•A large percentage of freeway travel will experience high levels of congestion.
•The Enhanced Network does not significantly improve the condition over the RTP Network.
•The Enhanced Network reduces the sensitivity of freeway congestion to land use patterns.

31
Freeway
Per
cent
of V
MT
LowCongestion Congestion
HighCongestion
020
4060
8010
0
Freeway Ramp
Per
cent
of V
MT
LowCongestion Congestion
HighCongestion
020
4060
8010
0
Principal Arterial
Per
cent
of V
MT
LowCongestion Congestion
HighCongestion
020
4060
8010
0
Arterial
Per
cent
of V
MT
LowCongestion Congestion
HighCongestion
020
4060
8010
0
CollectorPer
cent
of V
MT
LowCongestion Congestion
HighCongestion
020
4060
8010
0
Local
Per
cent
of V
MT
LowCongestion Congestion
HighCongestion
020
4060
8010
0
Comparison of Percent of Vehicle Miles Traveled by Congestion LevelRTP Network (blue), Enhanced Network (red), Base Year (black)
•A large percentage of freeway ramp travel will experience congestion.
•The Enhanced Network does not significantly improve the condition over the RTP Network.
•The sensitivity to land use patterns is very high. The Enhanced Network increases the sensitivity.
•Note that freeway ramps can have major effects on freeway congestion and that their operation depends on details of configuration and land use. More detailed study is needed.

32
Freeway
Per
cent
of V
MT
LowCongestion Congestion
HighCongestion
020
4060
8010
0
Freeway Ramp
Per
cent
of V
MT
LowCongestion Congestion
HighCongestion
020
4060
8010
0
Principal Arterial
Per
cent
of V
MT
LowCongestion Congestion
HighCongestion
020
4060
8010
0
Arterial
Per
cent
of V
MT
LowCongestion Congestion
HighCongestion
020
4060
8010
0
CollectorPer
cent
of V
MT
LowCongestion Congestion
HighCongestion
020
4060
8010
0
Local
Per
cent
of V
MT
LowCongestion Congestion
HighCongestion
020
4060
8010
0
Comparison of Percent of Vehicle Miles Traveled by Congestion LevelRTP Network (blue), Enhanced Network (red), Base Year (black)
•Although significantly lower amounts of principal arterial travel is exposed to high levels of congestion with the Enhanced Network (relative to the RTP Network), the amount is still an increase over today.
•Much of the effect of the Enhanced Network is to shift travel from highly congested to congested conditions.
•There is some sensitivity to land use patterns, but not nearly as great as with the freeway ramps.

33
Freeway
Per
cent
of V
MT
LowCongestion Congestion
HighCongestion
020
4060
8010
0
Freeway Ramp
Per
cent
of V
MT
LowCongestion Congestion
HighCongestion
020
4060
8010
0
Principal Arterial
Per
cent
of V
MT
LowCongestion Congestion
HighCongestion
020
4060
8010
0
Arterial
Per
cent
of V
MT
LowCongestion Congestion
HighCongestion
020
4060
8010
0
CollectorPer
cent
of V
MT
LowCongestion Congestion
HighCongestion
020
4060
8010
0
Local
Per
cent
of V
MT
LowCongestion Congestion
HighCongestion
020
4060
8010
0
Comparison of Percent of Vehicle Miles Traveled by Congestion LevelRTP Network (blue), Enhanced Network (red), Base Year (black)
•There will be a large increase in travel exposed to congestion on other arterials.
•The Enhanced Network does little to reduce the exposure of arterial traffic to congestion because of the shift away from the collector and local streets.
•There is little sensitivity to land use patterns.

Major PointsMajor Points1. The freeway system carries the largest
portion of travel will be most heavily congested.
2. The Enhanced Network helps the principal arterial system, but does little to help freeway system. Other solutions are needed.
3. Freeway ramps are critical to the operation of freeways. They are very sensitive to land development patterns. The Enhanced Network increases their sensitivity.
4. Ramp congestion and the effects on the freeway mainline depend on many details that are not captured by the model. More detailed analysis is needed.
34

Land Use Patterns Related to Ramp Land Use Patterns Related to Ramp CongestionCongestion
• The land scenarios vary more with respect to employment location than with household location. Also businesses tend to be more concentrated attractors. Therefore, focus on employment patterns.
– Look at where employment tends to be more focused when ramp congestion is higher vs. where it is more focused when ramp congestion is lower.
• The results indicate that a more detailed examination is needed.
35

36
Employment Growth TendenciesRelated to Enhanced Network Freeway Ramp Congestion
RPS Growth AreasUrban Growth BoundariesWhite City Growth Area
RPS Growth AreasUrban Growth BoundariesWhite City Growth Area
Relatively More EmploymentWith More Ramp Congestion
Relatively More EmploymentWith Less Ramp Congestion

37
Employment Growth TendenciesRelated to Enhanced Network Freeway Ramp Congestion
RPS Growth AreasUrban Growth BoundariesWhite City Growth Area
RPS Growth AreasUrban Growth BoundariesWhite City Growth Area
Relatively More EmploymentWith More Ramp Congestion
Relatively More EmploymentWith Less Ramp Congestion
In general, increased employment in the north part of Medford is associated with lower levels of freeway ramp congestion.

38
Employment Growth TendenciesRelated to Enhanced Network Freeway Ramp Congestion
RPS Growth AreasUrban Growth BoundariesWhite City Growth Area
RPS Growth AreasUrban Growth BoundariesWhite City Growth Area
Relatively More EmploymentWith More Ramp Congestion
Relatively More EmploymentWith Less Ramp Congestion
In general, increased employment in the South Medford and Phoenix area is associated with higher levels of freeway ramp congestion. Specific land use patterns and ramp and other road configurations are important too. More detailed analysis is needed.

39
Employment Growth TendenciesRelated to Enhanced Network Freeway Ramp Congestion
RPS Growth AreasUrban Growth BoundariesWhite City Growth Area
RPS Growth AreasUrban Growth BoundariesWhite City Growth Area
Relatively More EmploymentWith More Ramp Congestion
Relatively More EmploymentWith Less Ramp Congestion
There are mixed messages regarding the effects of the distribution of employment on ramp congestion at the northwestern end of the region. This may relate to the effects on particular ramp movements and interactions with more than one interchange. More detailed study is needed to evaluate the effects.
Conclusions and Conclusions and Next StepsNext Steps
40
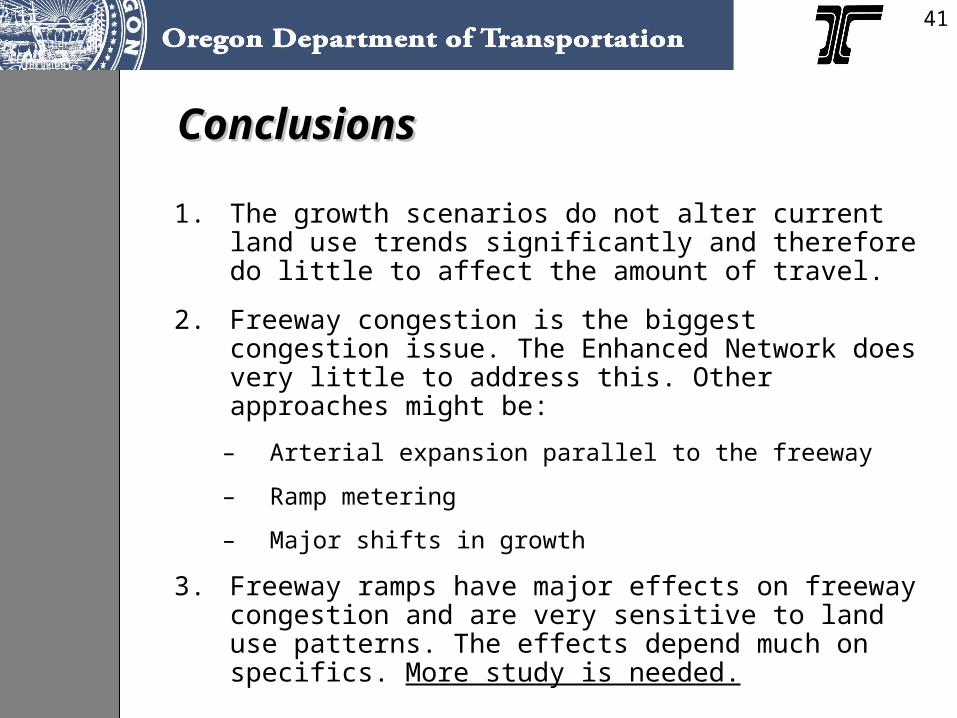
ConclusionsConclusions
1. The growth scenarios do not alter current land use trends significantly and therefore do little to affect the amount of travel.
2. Freeway congestion is the biggest congestion issue. The Enhanced Network does very little to address this. Other approaches might be:
– Arterial expansion parallel to the freeway
– Ramp metering
– Major shifts in growth
3. Freeway ramps have major effects on freeway congestion and are very sensitive to land use patterns. The effects depend much on specifics. More study is needed.
41

Possible Next StepsPossible Next Steps
• Examine more significant changes in land use development trends?
– Less land for development in fringe areas and higher densities?
– More redevelopment of downtown and TODs?
• More detailed analysis of freeway interchange areas?
– More detailed analysis of ramp capacities?
– More detailed analysis of the impact of ramp congestion on mainline congestion?
– More detailed analysis of land use patterns related to ramp congestion?
• Modeling of arterial expansion parallel to freeway?
• Modeling of ramp metering program?
42

Questions?Questions?
43

Bonus Bonus SlidesSlides

Enhanced Network Improvements
Top Related