


Languages
Pages
Legal


Ross Pruitt
Extension Livestock Economist

Summary
Recap of Overall Meat Complex in 2009 Beef Situation and Outlook Poultry Situation and Outlook Dairy Outlook Aquaculture Outlook


2009 Recap
Lower production in 2009First time ever that red meat and poultry
production declined in the same year
Lower production costs didn’t come soon enough
Slack demandH1N1 flu virusExports remained “strong”

U S BEEF AND VEAL EXPORTSCarcass Weight, Monthly
70
90
110
130
150
170
190
210
230
JAN FEB MAR APR MAY JUN JUL AUG SEP OCT NOV DEC
Mil. Pounds
Avg.2003-07
2008
2009
I-N-1601/13/10Livestock Marketing Information Center

TOTAL RED MEAT IN COLD STORAGEEnd of the Month
800
850
900
950
1,000
1,050
1,100
1,150
JAN MAR MAY JUL SEP NOV
Mil. Pounds
Avg.2003-07
2008
2009
M-S-1112/23/09
Livestock Marketing Information Center
Data Source: USDA/NASS

CHICKEN IN COLD STORAGEEnd of the Month
625
645
665
685
705
725
745
765
785
805
825
JAN MAR MAY JUL SEP NOV
Mil. Pounds
Avg.2003-07
2008
2009
P-S-0512/23/09
Livestock Marketing Information Center
Data Source: USDA/NASS

Livestock Marketing Information Center
COMMERCIAL MEAT & POULTRY PRODUCTION
By Type of Meat, Annual
0
10
20
30
40
50
60
70
80
90
100
1986 1988 1990 1992 1994 1996 1998 2000 2002 2004 2006 2008 2010
Bil. Pounds
Turkey
Chicken
Lamb &Veal
Pork
Beef
M-S-03A01/07/10

Livestock Marketing Information Center
U S RED MEAT & POULTRY CONSUMPTIONPer Capita, Retail Weight, Annual
0
50
100
150
200
1986 1989 1992 1995 1998 2001 2004 2007 2010
Pounds
Red Meat
TotalPoultry
M-C-0701/07/10


2009 Beef Review Continued reduction in national beef
herd numbers Ideal growing conditions for forage in
2009Hay production affected in LA due to dry
summer and wet fall Increased carcass weights Lower byproduct values Continued feedlot losses of $90/head

Winter Grazing Costs

Louisiana Steer Prices

Louisiana Steer Prices

Price Slides Remain Highly Variable

BOXED BEEF CUTOUT VALUEChoice 600-900 Lbs. Carcass, Weekly
130
135
140
145
150
155
160
165
170
175
180
JAN APR JUL OCT
$ Per Cwt.
Avg.2003-07
2008
2009
C-P-6201/04/10
Livestock Marketing Information Center
Data Source: USDA/AMS

CHOICE MINUS SELECT BEEF PRICESCarcass Cutout Value 600-900 Lbs., Weekly
-2
0
2
4
6
8
10
12
14
16
18
20
JAN APR JUL OCT
$ Per Cwt.
Avg.2003-07
2008
2009
C-P-6801/04/10Livestock Marketing Information Center

2010 Outlook
Stronger prices across the boardFed cattle: $86-89 (2009 Avg: $83.25)Feeder cattle: $98-104 (2009 Avg: $97.28)LA 500 lb steers: $100 (2009 Avg: $94.60)Cull cows: $40-50 (2009 Avg: $41.97)
Expect prices to remain volatileNarrowing of price slides againEconomical grass-fed gains

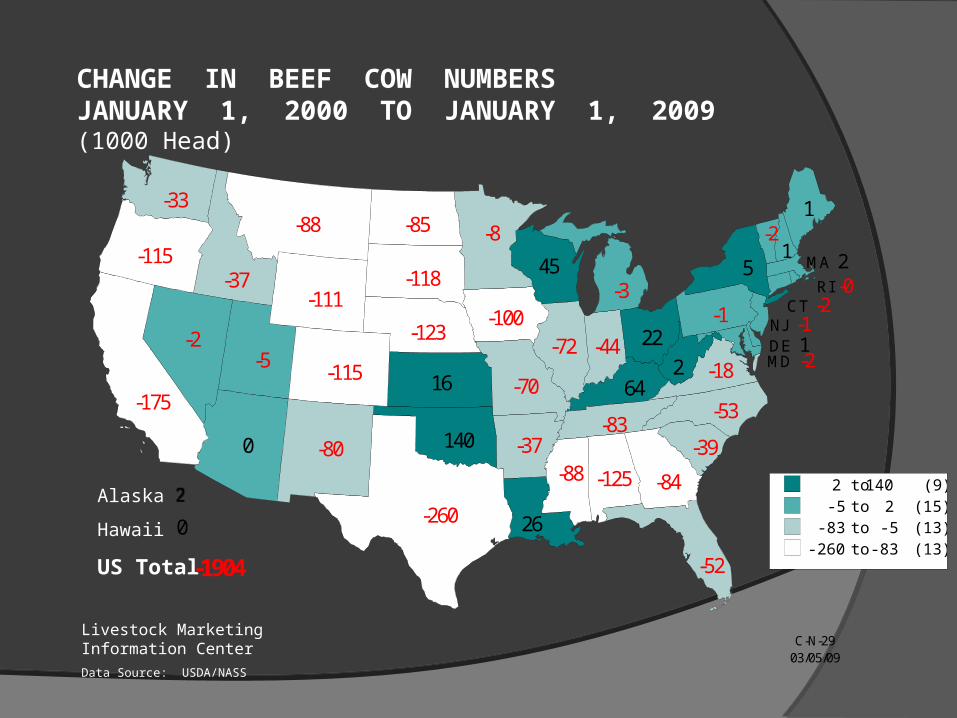
CHANGE IN BEEF COW NUMBERSJANUARY 1, 2000 TO JANUARY 1, 2009(1000 Head)
2 to 140 (9)-5 to 2 (15)
-83 to -5 (13)-260 to -83 (13)
C-N-2903/05/09
Alaska
Hawaii
US Total
-125
0 -37
-175-115
CT -2
DE 1
-52
-84
0
-37
-72 -44
16 64
26
1
MD -2
MA 2-3
-8
-88
-70
-88
-123-2
1
NJ -1
-80
5
-53
-85
22
140
-115
RI -0
-39
-118
-83
-260
-5
-2
-18
-33
2
45
-111
-1904
Livestock Marketing Information Center
Data Source: USDA/NASS
-100 -1

HEIFERS HELD AS BEEF COW REPLACEMENTS
July 1, U.S.
3
4
5
6
7
1979 1982 1985 1988 1991 1994 1997 2000 2003 2006 2009
Mil. Head
C-N-3707/24/09
-2.2 %
Livestock Marketing Information Center
Data Source: USDA/NASS

Livestock Marketing Information Center
BEEF COW SLAUGHTERFederally Inspected, Weekly
40
45
50
55
60
65
70
75
80
85
90Thou. Head
Avg.2003-07
2008
2009
C-S-3412/31/09

Longer Term Summary
Expansion in the beef herd unlikely till 2012
Prices still may recover quickly with a healthy economy
Rising input costs will negate some of the higher returns

Poultry on the Upswing
Returned to profitability after loss filled 2008Production even with year ago levels
Exports not as strong in 2009Production cutbacks restored profitabilityLowered feedstuff & energy prices improved
outlookByproduct values are higher than 2008

WHOLESALE CHICKEN BREAST PRICESSkinless/Boneless, Northeast, Truckload, Weekly
90
100
110
120
130
140
150
160
170
180Cents Per Pound
Avg.2003-07
2008
2009
P-P-0201/04/10
Livestock Marketing Information Center
Data Source: USDA/AMS

BROILER CHICKS PLACEDWeekly
150
155
160
165
170
175
180
185Mil. Birds
Avg.2003-07
2008
2009
Livestock Marketing Information Center
Data Source: USDA/NASS
P-S-1112/31/09

2010 Poultry Outlook
Projected 2% production increaseSlight increase in consumption
Trade issues with Russia Acquisition/merger impacts? Competition seminars Lending concerns?


Dairy Outlook
Demand is slowly starting to returnExport demand
Cold storage supplies need to decrease CWT buyouts provided positive
momentumSmaller dairy herds in the west

Livestock Marketing Information Center
DAIRY COW SLAUGHTERFederally Inspected, Weekly
30
35
40
45
50
55
60
65
70
75Thou. Head
Avg.2003-07
2008
2009
C-S-3512/31/09
CWT Buyouts

Livestock Marketing Information Center
MILK - FEED PRICE RATIOUS, Monthly
1.4
1.6
1.8
2.0
2.2
2.4
2.6
2.8
3.0
3.2
Jan Mar May Jul Sep Nov
Ratio
Avg.2003-07
2008
2009
12/31/09

Aquaculture

Aquaculture
Weaker dollar will not prevent increased imports
Consumer spending in 2010? Favorable supply conditions aid
productionSize of crawfish may be issue
○ Persistent cold weather ○ Overpopulation

Livestock Summary
Worst is likely behind the livestock industry2010 will not be a cakewalk however
Lower production will aid pricesEconomic recovery will increase impact of
lower productionChasing fewer consumer dollars?
How fast will input costs rise?

Email Newsletter
Sign up for twice a month marketing newsletter
Includes production tips, market news, and economic insight
Send email to [email protected] or contact your local extension agent

Questions?
Top Related