


Languages
Pages
Legal

Romania – 10 years after
EU accession
Florian Neagu
Deputy Director, Financial Stability Department
National Bank of Romania
80th East Jour Fixe of the Oesterreichische Nationalbank, March 2017
2
1. Macroeconomic developments
2. Financial sector and monetary policy evolutions
3. What next?
4. Conclusions
Outline

3
1.Macroeconomic developments
2. Financial sector and monetary policy evolutions
3. What next?
4. Conclusions
Outline
North-West
(+8pp)
> 50% (45%; 50%] <= 45%
West (+11pp)
Center (+11pp)
North-East
(+8pp)
South-East
(+16pp) South
(+10pp) South-West
(+9pp)
Bucharest-Ilfov (+32pp)
4
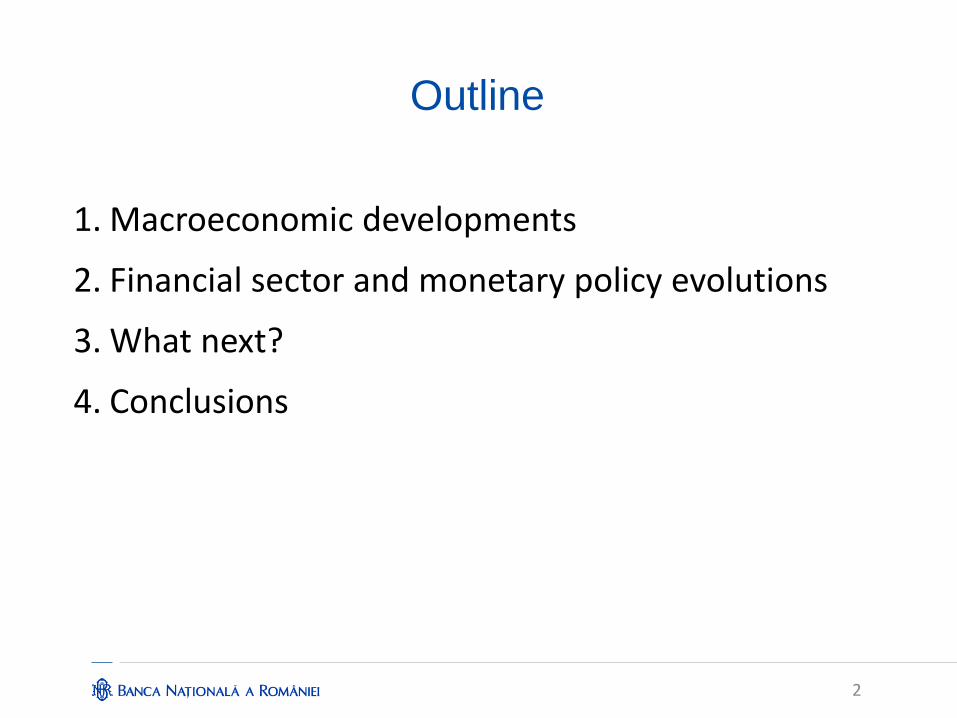
GDP per capita in PPS (EU28 = 100) GDP per capita in PPS (percentage of the EU average)
Source: Eurostat Source: National Bank of Romania, own calculations
The catching-up process advanced rapidly after the
accession, but developments were highly uneven
across Romanian regions
Note: The values in brackets show the change between 2007-2014

5
Non-financial companies’ gross value added contribution, by technological intensity
Source: Ministry of Public Finance (MPF), National Trade Register Office, National Bank of Romania (NBR)
Romania fully opened up its economy to foreign capital
(also by privatizing its top companies), but the structure
of the economy has not shifted towards
more value-added and innovative sectors

Source: MPF, NBR, own calculations
Profits and losses of non-financial companies, by ownership
One lesson of the last decade is to preserve an
adequate balance of power in the economy between
foreign- and domestically-owned companies
Source: MPF, NBR, own calculations
Structure of banks’ corporate portfolio, by ownership of the firms

7
1. Macroeconomic developments
2.Financial sector and monetary policy
evolutions
3. What next?
4. Conclusions
Outline

8
The banking sector remains less developed, although
the market share of foreign capital is among the highest
Bank assets in GDP (percent)
Source: Eurostat, ECB Source : ECB (Consolidated Banking Data)
Market share of foreign banks (percent in total assets)

9
The soundness of the banking sector consolidated in
the last decade…
Overview of main risk indicators for the banking sector
Source: IMF, World Bank, National Bank of Hungary
Note: Thresholds according to EBA methodology
RO BG PL HU RO BG PL HU EU
Solvency
>15%
[12%-15%] 10.65 10.83 11.13 8.33 16.21 20.40 15.70 14.30 15.3
<12%
Asset Quality
<3%
[3%-8%] 2.59 2.10 5.20 2.30 9.46 10.10 4.35 9.97 5.4
>8%
Profitability
>10%
[6%-10%] 10.47 24.80 24.90 21.76 10.67 13.10 8.40 19.60 5.4
<6%
Balance Sheet Structure
<100%
[100%-150%] 69.18 89.12 72.38 109.53 77.13 72.76 91.50 72.86 120.1
>150%
Risk Indicators Threshold
Tier 1 Capital Ratio
Loan-to-Deposit Ratio
2007 2016
NPL Ratio
ROE
2007 2008 2009 2010 2011 2012 2013 2014 2015
A B A B A B A B A B A B A B A B A B
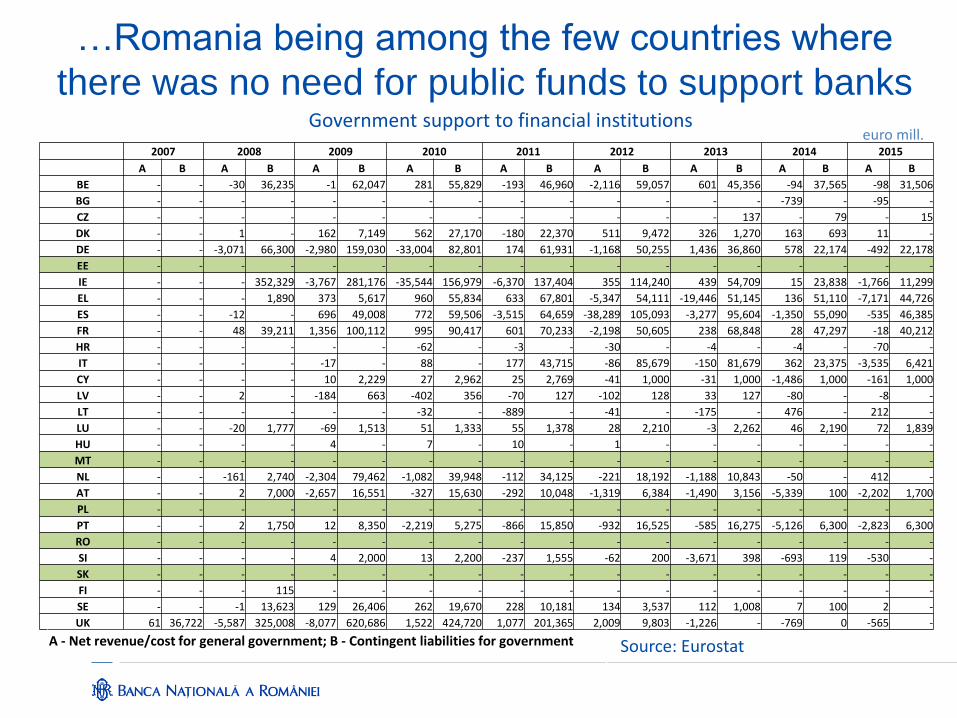
BE - - -30 36,235 -1 62,047 281 55,829 -193 46,960 -2,116 59,057 601 45,356 -94 37,565 -98 31,506
BG - - - - - - - - - - - - - - -739 - -95 -
CZ - - - - - - - - - - - - - 137 - 79 - 15
DK - - 1 - 162 7,149 562 27,170 -180 22,370 511 9,472 326 1,270 163 693 11 -
DE - - -3,071 66,300 -2,980 159,030 -33,004 82,801 174 61,931 -1,168 50,255 1,436 36,860 578 22,174 -492 22,178
EE - - - - - - - - - - - - - - - - - -
IE - - - 352,329 -3,767 281,176 -35,544 156,979 -6,370 137,404 355 114,240 439 54,709 15 23,838 -1,766 11,299
EL - - - 1,890 373 5,617 960 55,834 633 67,801 -5,347 54,111 -19,446 51,145 136 51,110 -7,171 44,726
ES - - -12 - 696 49,008 772 59,506 -3,515 64,659 -38,289 105,093 -3,277 95,604 -1,350 55,090 -535 46,385
FR - - 48 39,211 1,356 100,112 995 90,417 601 70,233 -2,198 50,605 238 68,848 28 47,297 -18 40,212
HR - - - - - - -62 - -3 - -30 - -4 - -4 - -70 -
IT - - - - -17 - 88 - 177 43,715 -86 85,679 -150 81,679 362 23,375 -3,535 6,421
CY - - - - 10 2,229 27 2,962 25 2,769 -41 1,000 -31 1,000 -1,486 1,000 -161 1,000
LV - - 2 - -184 663 -402 356 -70 127 -102 128 33 127 -80 - -8 -
LT - - - - - - -32 - -889 - -41 - -175 - 476 - 212 -
LU - - -20 1,777 -69 1,513 51 1,333 55 1,378 28 2,210 -3 2,262 46 2,190 72 1,839
HU - - - - 4 - 7 - 10 - 1 - - - - - - -
MT - - - - - - - - - - - - - - - - - -
NL - - -161 2,740 -2,304 79,462 -1,082 39,948 -112 34,125 -221 18,192 -1,188 10,843 -50 - 412 -
AT - - 2 7,000 -2,657 16,551 -327 15,630 -292 10,048 -1,319 6,384 -1,490 3,156 -5,339 100 -2,202 1,700
PL - - - - - - - - - - - - - - - - - -
PT - - 2 1,750 12 8,350 -2,219 5,275 -866 15,850 -932 16,525 -585 16,275 -5,126 6,300 -2,823 6,300
RO - - - - - - - - - - - - - - - - - -
SI - - - - 4 2,000 13 2,200 -237 1,555 -62 200 -3,671 398 -693 119 -530 -
SK - - - - - - - - - - - - - - - - - -
FI - - - 115 - - - - - - - - - - - - - -
SE - - -1 13,623 129 26,406 262 19,670 228 10,181 134 3,537 112 1,008 7 100 2 -
UK 61 36,722 -5,587 325,008 -8,077 620,686 1,522 424,720 1,077 201,365 2,009 9,803 -1,226 - -769 0 -565 -
A - Net revenue/cost for general government; B - Contingent liabilities for government
Source: Eurostat
Government support to financial institutions
…Romania being among the few countries where
there was no need for public funds to support banks
euro mill.

11
Capital flows (% of GDP)
Source: Eurostat
Monetary policy faced big challenges due to large
capital inflows that also triggered material FX lending
(putting pressure on financial stability as well)…
Source: ECB, National Bank of Hungary
Share of FX loans in total loans (percent)

12
Harmonised index of consumer prices
Source: Bloomberg, own calculations Source: Eurostat
Volatility of exchange rate against the euro
…but managed to bring down inflation and to
preserve exchange rate stability
13
1. Macroeconomic developments
2. Financial sector and monetary policy evolutions
3.What next?
4. Conclusions
Outline
14
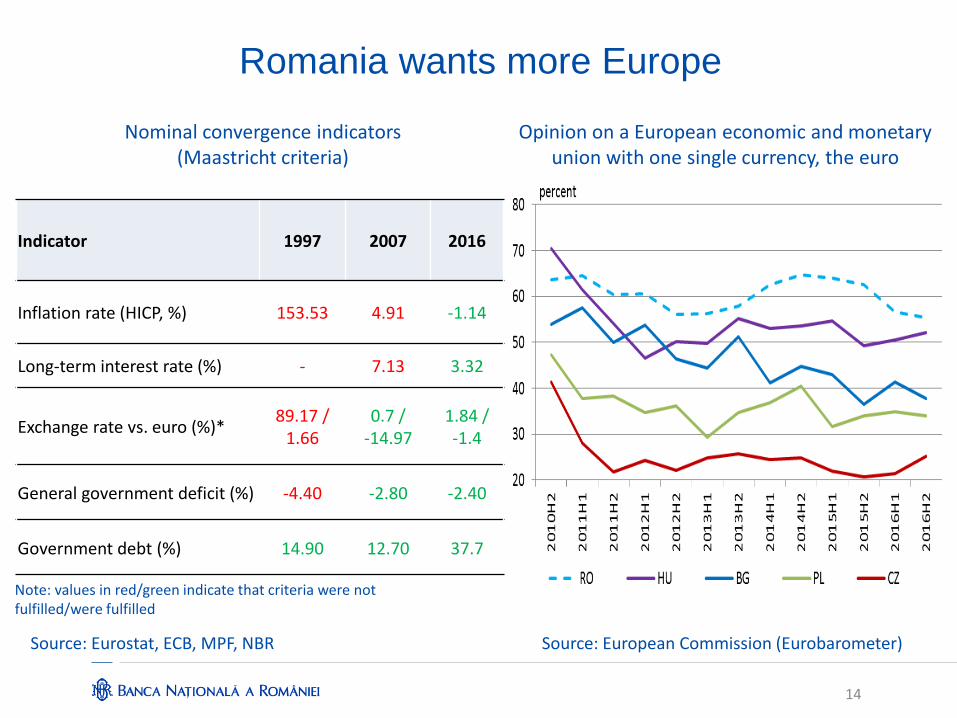
Nominal convergence indicators (Maastricht criteria)
Source: European Commission (Eurobarometer)
Indicator 1997 2007 2016
Inflation rate (HICP, %) 153.53 4.91 -1.14
Long-term interest rate (%) - 7.13 3.32
Exchange rate vs. euro (%)* 89.17 /
1.66 0.7 /
-14.97 1.84 / -1.4
General government deficit (%) -4.40 -2.80 -2.40
Government debt (%) 14.90 12.70 37.7
Source: Eurostat, ECB, MPF, NBR
Romania wants more Europe
Opinion on a European economic and monetary union with one single currency, the euro
Note: values in red/green indicate that criteria were not fulfilled/were fulfilled

15
EU funds (2005 - 2016)
Source: MPF
Structural reforms are needed to counteract the risk
of medium income trap; EU funds might be better
tailored to support the economy
Source: Georgescu (2015), based on Eichengreen, Park and Shin, 2013

16
There is plenty of room for the banking sector to
better fulfill real sector needs and manage risks
o Europe is overbanked, but Romania is well below average. How to deal with this?
o Central bank flagged the need for change in the banks’ business model to focus more on lending to the corporate sector
o Lessons from NPL drama or European sovereign debt crisis should not be forgotten (it is better to have subsidiaries than branches, domestic supervision should remain strong, etc.)
17
Conclusions
o EU accession was a very positive event for Romania
o Although big challenges occurred after the accession (including the Great Financial Crisis), the central bank has reached all three goals: price stability, financial stability and exchange rate stability
o Romania wants more Europe and is aware that without consistent structural reforms, the catching-up process might be at risk
o Foreign capital and EU funds are welcomed into the real sector, but the current structure proved suboptimal

Thank you!
Top Related