


Languages
Pages
Legal

1
Engineering Geology and Seismology
Role of Geology in site selection for Engineering
Structures
(Dams, Tunneling, Reservoirs and Highways)
Instructor:
Prof. Dr. Attaullah Shah
Lecture # 9
Department of Civil Engineering
City University of Science and IT Peshawar
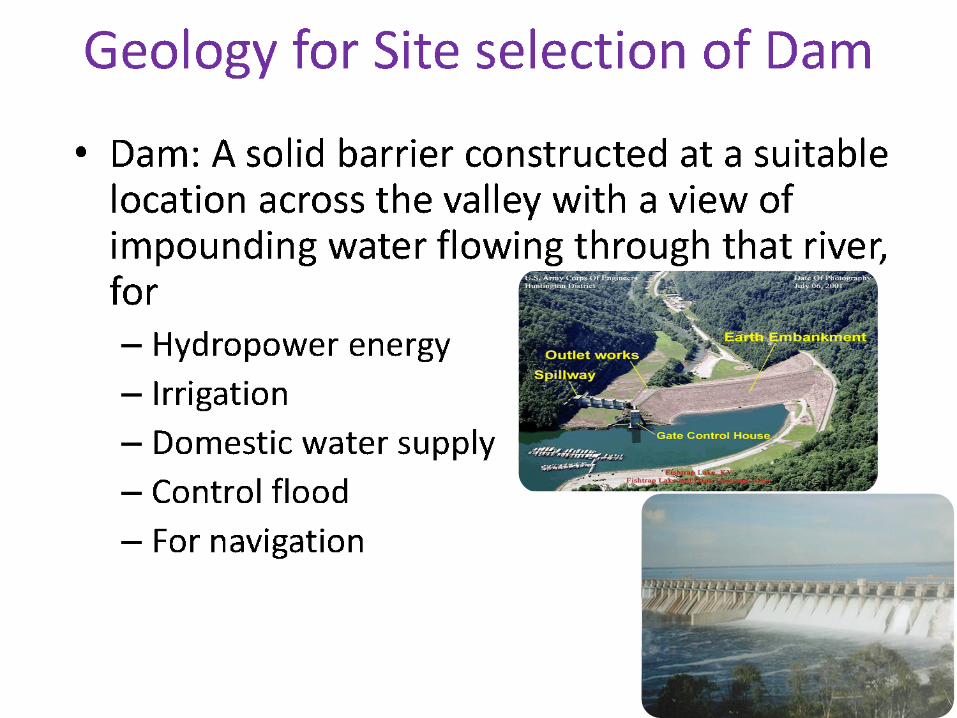
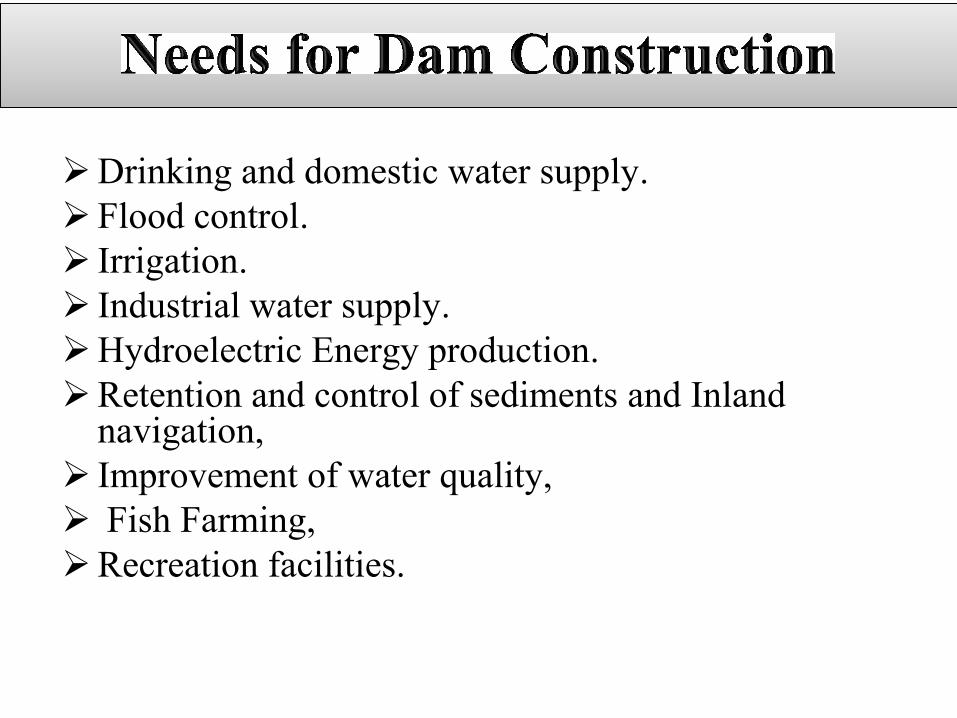
Drinking and domestic water supply.
Flood control.
Irrigation.
Industrial water supply.
Hydroelectric Energy production.
Retention and control of sediments and Inland navigation,
Improvement of water quality,
Fish Farming,
Recreation facilities.
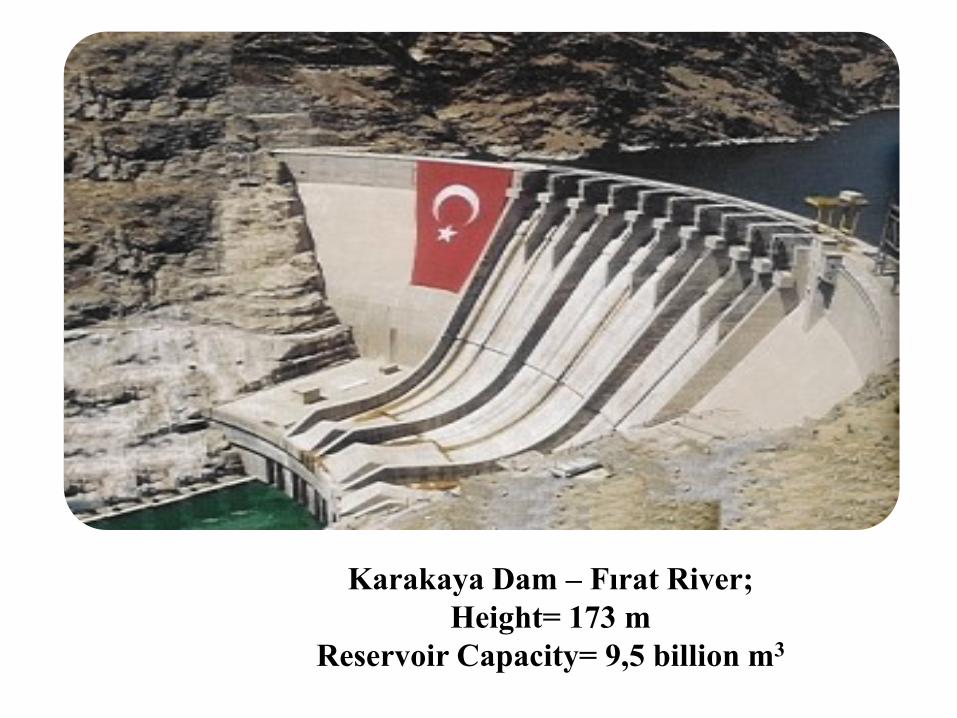
Karakaya Dam – Fırat River;
Height= 173 m
Reservoir Capacity= 9,5 billion m3

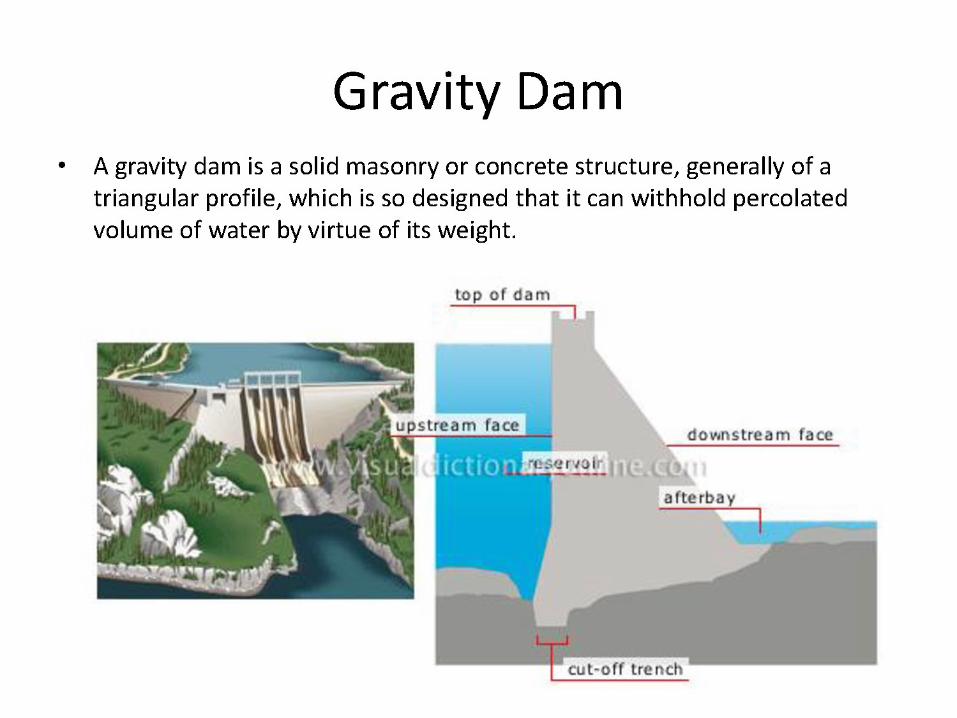
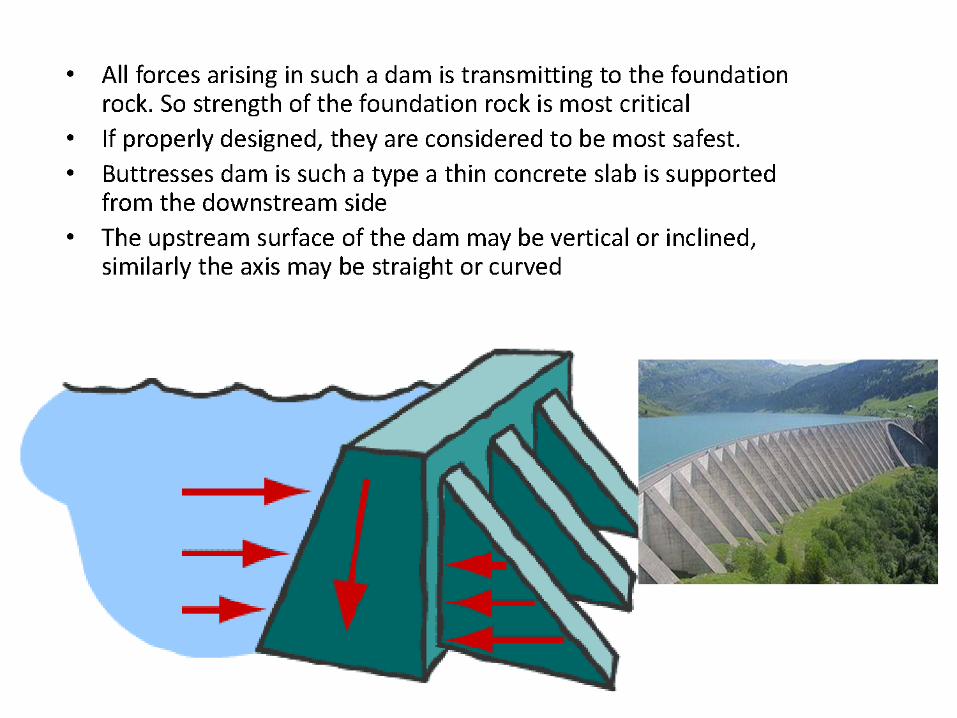
Buttress Dams use multiple reinforced columns to support a dam that
has a relatively thin structure. Because of this, these dams often use
half as much concrete as gravity dams.
Elmalı II – Göksu River;
Height= 42.5 m
Reservoir Capacity= 10 million m3

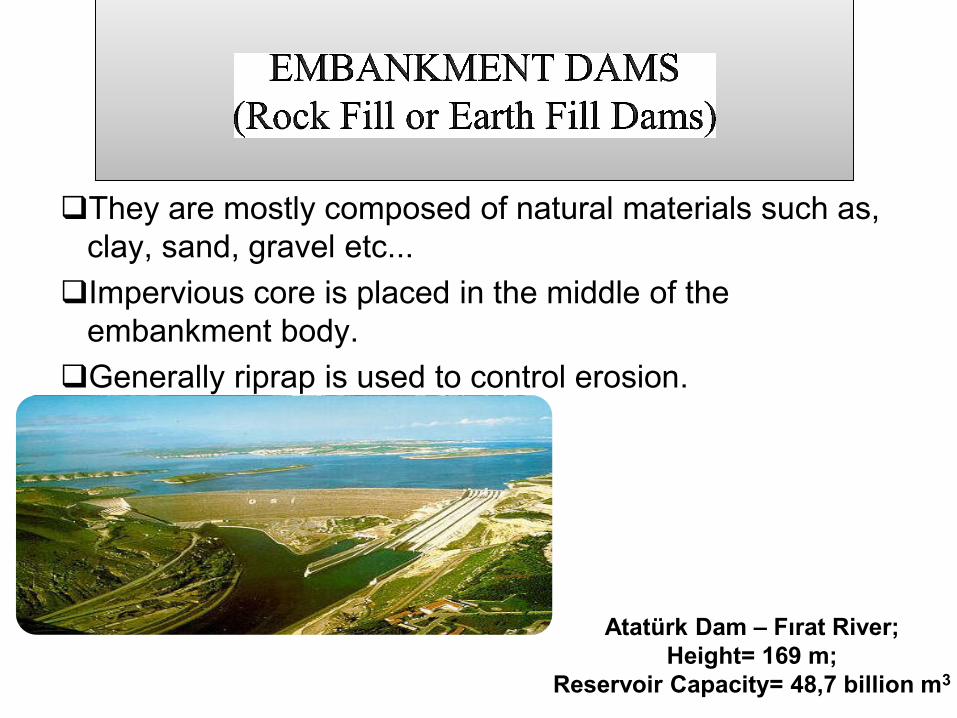
They are mostly composed of natural materials such as,
clay, sand, gravel etc...
Impervious core is placed in the middle of the
embankment body.
Generally riprap is used to control erosion.
Atatürk Dam – Fırat River;
Height= 169 m;
Reservoir Capacity= 48,7 billion m3

Tarbela Dam-Earth Rock filled Dam
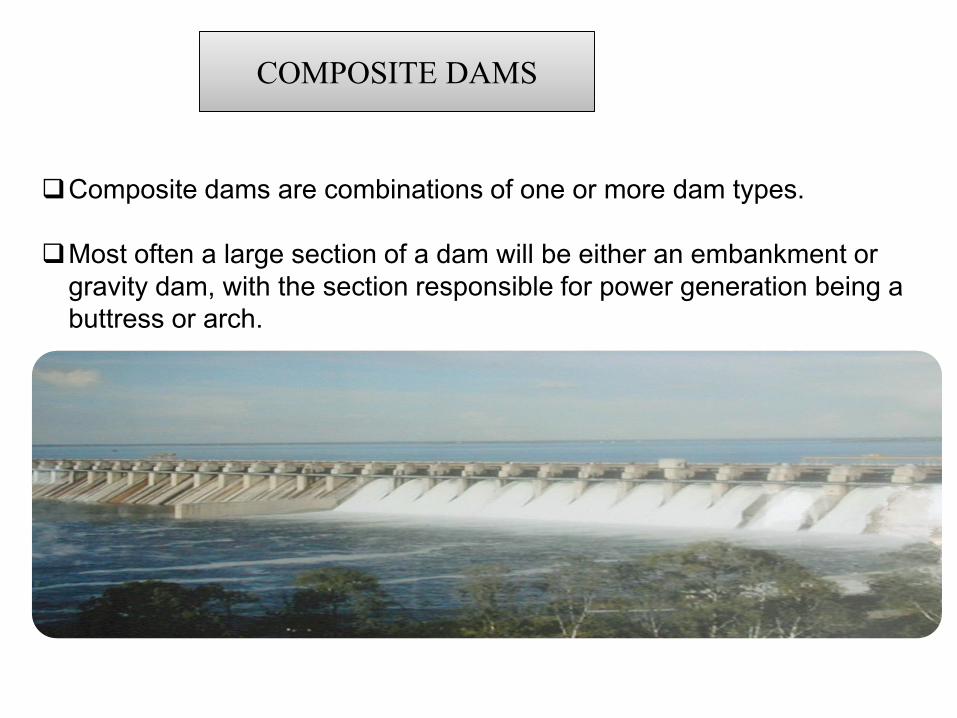
COMPOSITE DAMS COMPOSITE DAMS
Composite dams are combinations of one or more dam types.
Most often a large section of a dam will be either an embankment or
gravity dam, with the section responsible for power generation being a
buttress or arch.


GEOLOGICAL CHARACTERS FOR DAM SITE
INVESTIGATION
GEOLOGICAL CHARACTERS FOR DAM SITE
INVESTIGATION1. GEOLOGY OF THE AREA -
The area should reveal the following:-
main topographic features
natural drainage patterns
general characters and structures of rock formations such as their
stratification , folding and faulting
2. GEOLOGY OF THE SITE -
LITHOLOGY -
Surface and subsurface studies using the conventional and latest
techniques of geological and geophysical investigations are carried
out.
IT REVEALS WHAT TYPE OF ROCKS MAKE UP THAT AREA:
IGNEOUS,SEDIMENTARY OR METAMORPHIC.
STRUCUTRES -
THIS INVOLVES DETAILED MAPPING OF PLANES OF WEAKNESS
LIKE BEDDING PLANES,CLEAVAGE,JOINTS,FOLDING,FAULT
ZONES
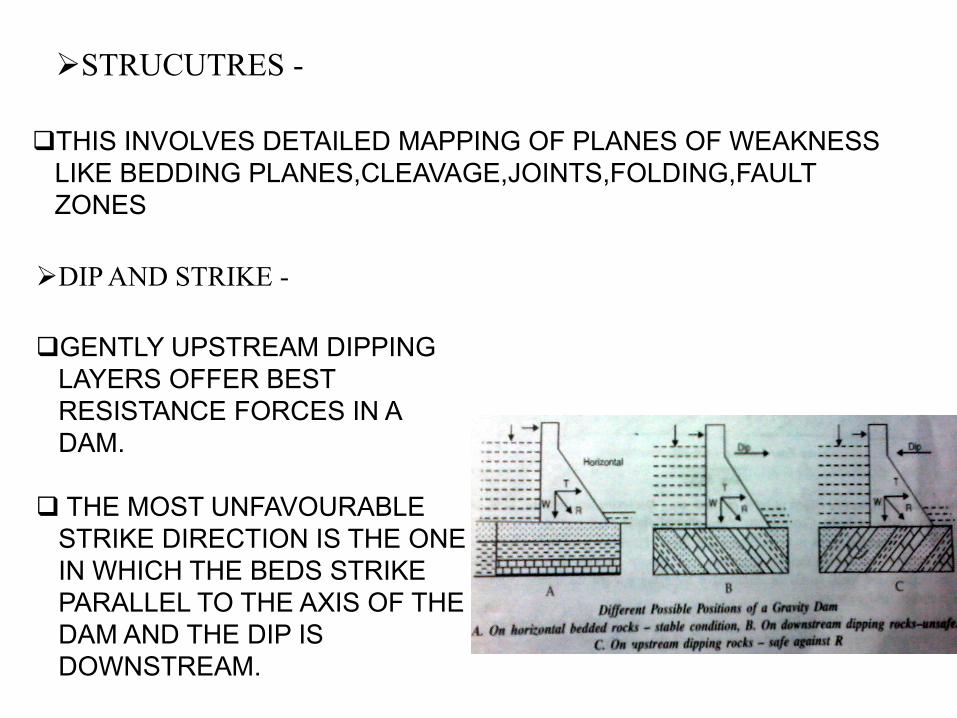
DIP AND STRIKE -
GENTLY UPSTREAM DIPPING
LAYERS OFFER BEST
RESISTANCE FORCES IN A
DAM.
THE MOST UNFAVOURABLE
STRIKE DIRECTION IS THE ONE
IN WHICH THE BEDS STRIKE
PARALLEL TO THE AXIS OF THE
DAM AND THE DIP IS
DOWNSTREAM.
FAULTS (CAN BE A SOURCE OF DANGER) -
FAULTED ROCKS ARE GENERALLY SHATTERED ALONG THE RUPTURE OF THE
SURFACES
DAMS FOUNDED ON THE BEDS TRAVERSED BY FAULT ZONES AND ON MAJOR FAULT
ZONES ARE MORE LIABLE TO SHOCKS DURING AN EARTHQUAKE.
ALWAYS DESIRABLE TO AVOID RISK BY REJECTING SITES TRAVERSED BY
FAULTS,FAULT ZONES AND SHEAR ZONES FOR DAM FOUNDATION.
FOLDS
THE MOST NOTABLE EFFECTS OF FOLDS ON ROCKS ARE: SHATTERING AND
JOINTING ALONG THE AXIAL PLANES AND STRESSING OF THE LIMBS.
JOINTS -
NO SITES ARE FREE FROM JOINTING.
OCCURRENCE OF MICROJOINTS SHOULD BE DEALT WITH GREAT CARE.
BECAUSE IF IT IS LEFT UNTREATED ,COULD BECOME A SOURCE OF MANY
RISKS.
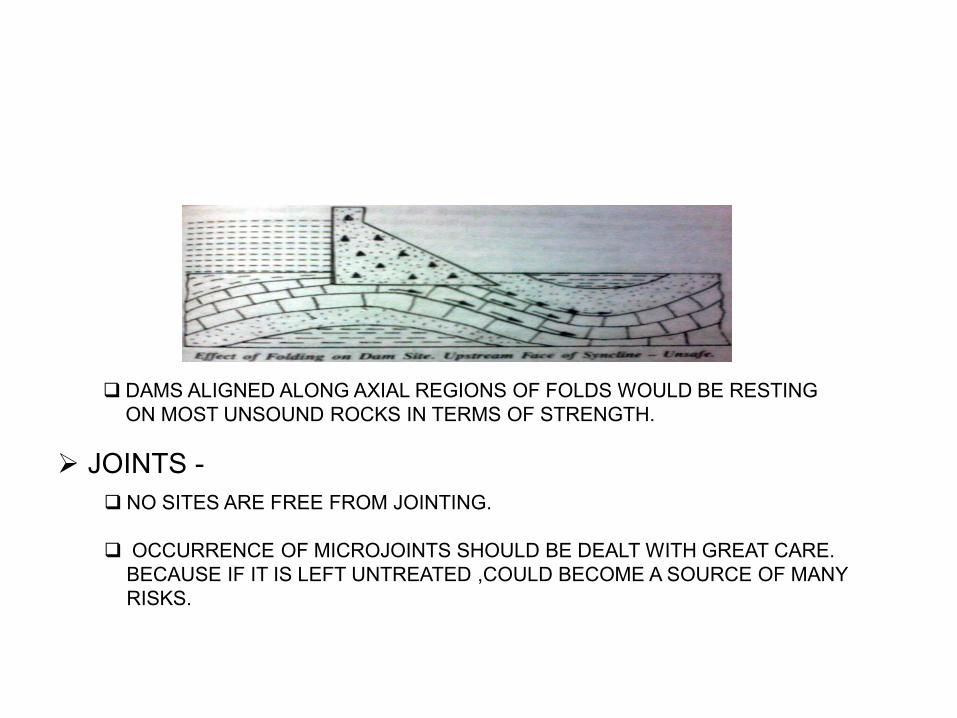
DAMS ALIGNED ALONG AXIAL REGIONS OF FOLDS WOULD BE RESTING
ON MOST UNSOUND ROCKS IN TERMS OF STRENGTH.

ENGINEERING PROPERTIES OF ROCKENGINEERING PROPERTIES OF ROCK
STRENGTH PARAMETER -
IT CONSIST OF THREE INVESTIGATIONS – LABORATORY, IN-SITU STATIC AND
DYNAMIC.
THE COMPRESSIVE AND SHEARING STRENGTH OF THE ROCKS ARE ESTIMATED BY
LABORATORY TEST.
THE SHOCK WAVE VELOCITY RELATES TO THE DENSITY, RIGIDITY, POROSITY AND
PERMEABILITY OF THE ROCKS AT THE SITE.
STATIC STUDY: BY THIS TEST SETTLEMENTS AND STRAINS ARE RECORDED WITH
DIFFERENT LOADINGS WHICH IS USED TO ESTIMATE THE BEARING STRENGTH,
MODULUS OF ELASTICITY AND POISSON'S RATIO.

POROSITY AND PERMEABILITY:-
POROSITY AND PERMEABILITY OF THE ROCKS ARE TESTED BOTH IN LABORATORY
AND IN-SITU. ARTIFICIAL TREATMENT IS GIVEN TO THE CRITICAL ZONES SUCH AS
GROUTING TO MAKE THE ROCKS WATER TIGHT.


HYDEL POWER DEVELOPMENT
BEST REMEDIAL MEASURES
FOR
ELECTRICAL & WATER CRISES

Energy the lifeline of, industrial economic,development and quality of life.
Pakistan is the poorest of the poor as far as energyconsumption per capita is concerned.
Pakistan ranks 25th in World Energy consumption and31s t in Electricity production.
Per Capita electrical consumption per year of Pakistanis 470kWh, of Malaysia 2,708 & of Singapore 6,775kWh
Pakistan has developed 12% of total hydel potentials,India has 30% & rich countries 75% of hydelpotential
Hydel power supplies 715,000 MW or 19% of WorldElectricity.
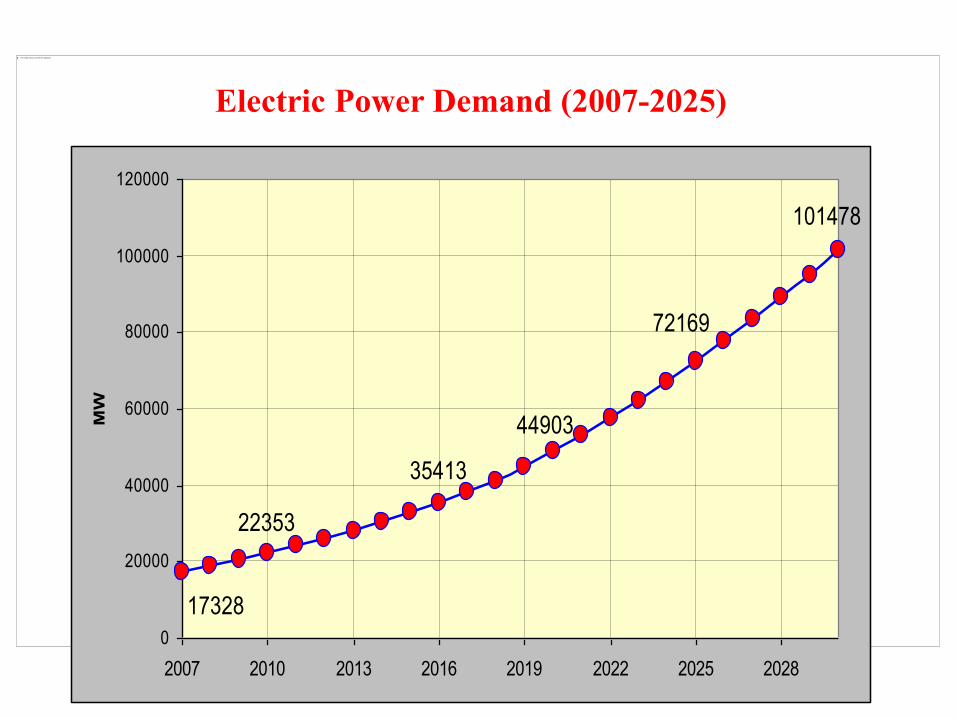
44903
35413
22353
17328
72169
101478
0
20000
40000
60000
80000
100000
120000
2007 2010 2013 2016 2019 2022 2025 2028
MW
Electric Power Demand (2007-2025)
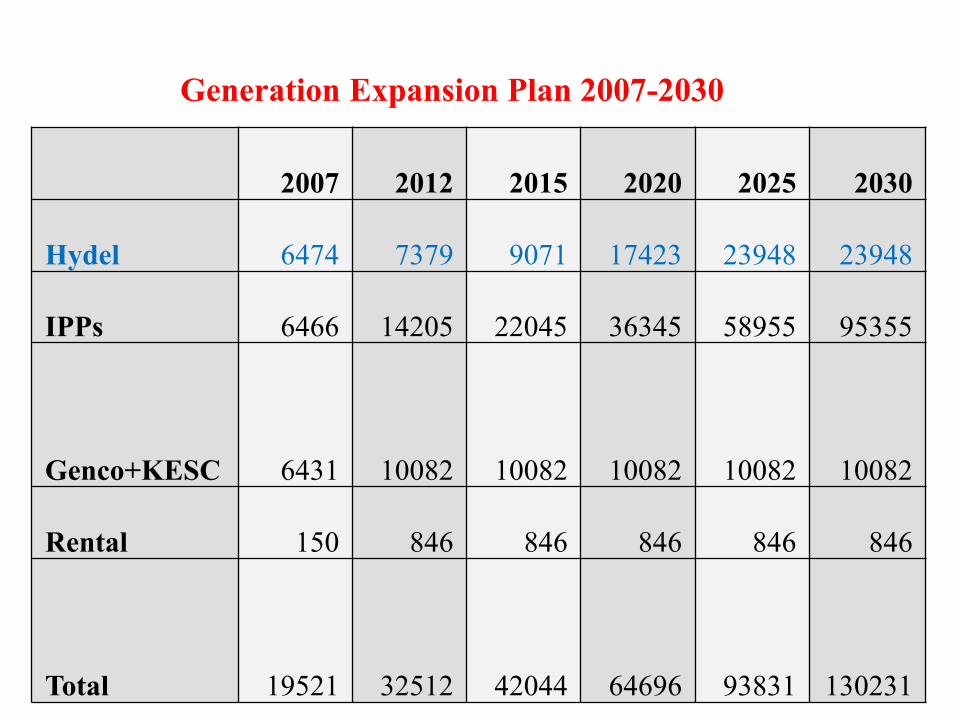
2007 2012 2015 2020 2025 2030
Hydel 6474 7379 9071 17423 23948 23948
IPPs 6466 14205 22045 36345 58955 95355
Genco+KESC 6431 10082 10082 10082 10082 10082
Rental 150 846 846 846 846 846
Total 19521 32512 42044 64696 93831 130231
Generation Expansion Plan 2007-2030

130231
64696
93831
19521
3251242044
0
20000
40000
60000
80000
100000
120000
140000
2007 2010 2013 2016 2019 2022 2025 2028
MW
As per generation expansion plan system needs
additions of 32512 MW and 93831 MW by years 2012 and
by 2025, respectively.
Generation Expansion Plan (2007-2030)

2394823948
17423
9071
7379
6464
0
5000
10000
15000
20000
25000
30000
2007 2010 2013 2016 2019 2022 2025 2028
MW
Hydropower Generation Expansion Plan
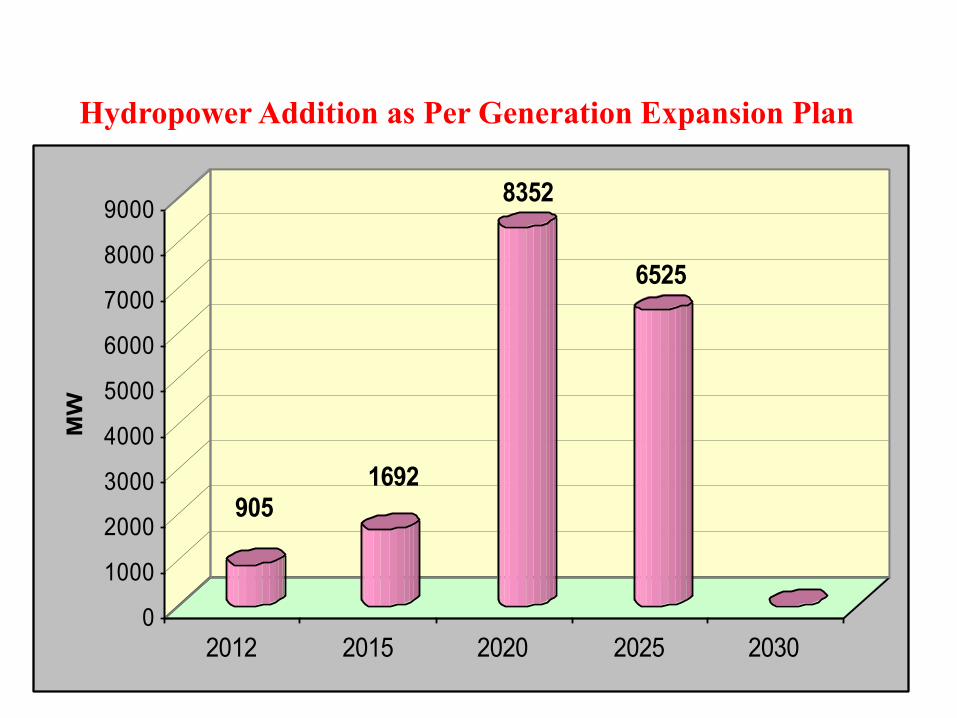
9051692
8352
6525
0
1000
2000
3000
4000
5000
6000
7000
8000
9000
MW
2012 2015 2020 2025 2030
Hydropower Addition as Per Generation Expansion Plan
MUNDA
WARSAK
KALABAGH
TARBELA
DASU
NEELUM-JHELUM
KOHALA
MANGLA
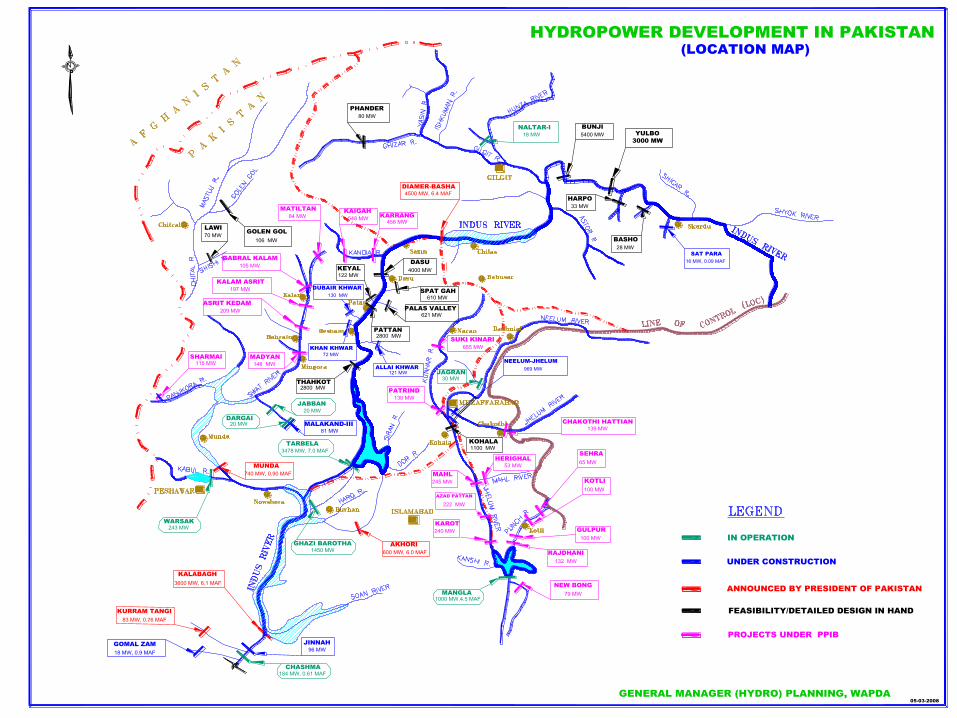
HYDROPOWER DEVELOPMENT IN PAKISTAN
DIAMER-BASHA
DUBAIR KHWAR
KHAN KHWAR
ALLAI KHWAR
GOLEN GOL
NEW BONG
JINNAH
KEYAL
GHAZI BAROTHA
PHANDER
IN OPERATION
UNDER CONSTRUCTION
LAWI
PALAS VALLEY
SPAT GAH
BUNJI
CHASHMA
(LOCATION MAP)
GULPUR
RAJDHANI
FEASIBILITY/DETAILED DESIGN IN HAND
ANNOUNCED BY PRESIDENT OF PAKISTAN
JABBAN
SAT PARA
NALTAR-I
KOTLI
AKHORI
KURRAM TANGI
HARPO
BASHO
184 MW, 0.61 MAF
96 MW
3600 MW, 6.1 MAF
83 MW, 0.76 MAF
1000 MW,4.5 MAF
1450 MW
243 MW
600 MW, 6.0 MAF
79 MW
132 MW
100 MW
100 MW
3478 MW, 7.0 MAF
740 MW, 0.90 MAF
20 MW
72 MW
70 MW106 MW
122 MW
130 MW
621 MW
121 MW969 MW
1100 MW
16 MW, 0.09 MAF
28 MW
4500 MW, 6.4 MAF
80 MW
610 MW
4000 MW
5400 MW18 MW
33 MW
HERIGHAL
53 MW
SHARMAI
115 MW
N
MATILTAN
84 MW
JAGRAN
30 MW
PATRIND
130 MW
SUKI KINARI
655 MW
MALAKAND-III
81 MW
DARGAI
20 MW
MADYAN
148 MW
GABRAL KALAM
105 MW
PROJECTS UNDER PPIB
KAROT
240 MW
AZAD PATTAN
222 MW
SEHRA
65 MW
ASRIT KEDAM
209 MW
KARRANG
458 MW
KAIGAH
548 MW
MAHL
245 MW
CHAKOTHI HATTIAN
139 MW
KALAM ASRIT
197 MW
PATTAN
2800 MW
THAHKOT
2800 MW
05-03-2008
GENERAL MANAGER (HYDRO) PLANNING, WAPDA
YULBO
3000 MW
GOMAL ZAM
18 MW, 0.9 MAF

DASU
KOHALA
HYDROPOWER PROJECTS
GOLEN GOL
KEYAL
LAWI
PALAS VALLEY
SPAT GAH
BUNJI
70 MW
106 MW
130 MW
621 MW
1100 MW
610 MW
4000 MW
5400 MW
BASHO
28 MW
PHANDAR
80 MW
PATTAN
2800 MW
THAKOT
2800 MW
HARPO
33 MW
UNDER STUDIES
N
HYDROPLANNING ORGANIZATION (HPO) WAPDA
FIG-2
YULBO
3000 MW

Sr.
No.Project River
Locati
on
Installed
Capacity
(MW)
Tentative
completion
month of
the study
Present Status
Estimated
Construction
Cost
Millen (US$)
1 Kohala Jhelum Kohala 1100 Aug, 2009 Feasibility Study, Detailed
Design and Tender
Documents in progress.
2,115
2 Dasu Indus Dasu 4320 Mar, 2011 Feasibility Study completed
Design being started
7,800
3 Spat Gah Spat Gah Patan 567 Oct, 2009 Feasibility Study in progress. 614
4 Palan
Vally
Chor
Nullah
Patan 621 Nov 2009 Feasibility Study in progress. 667
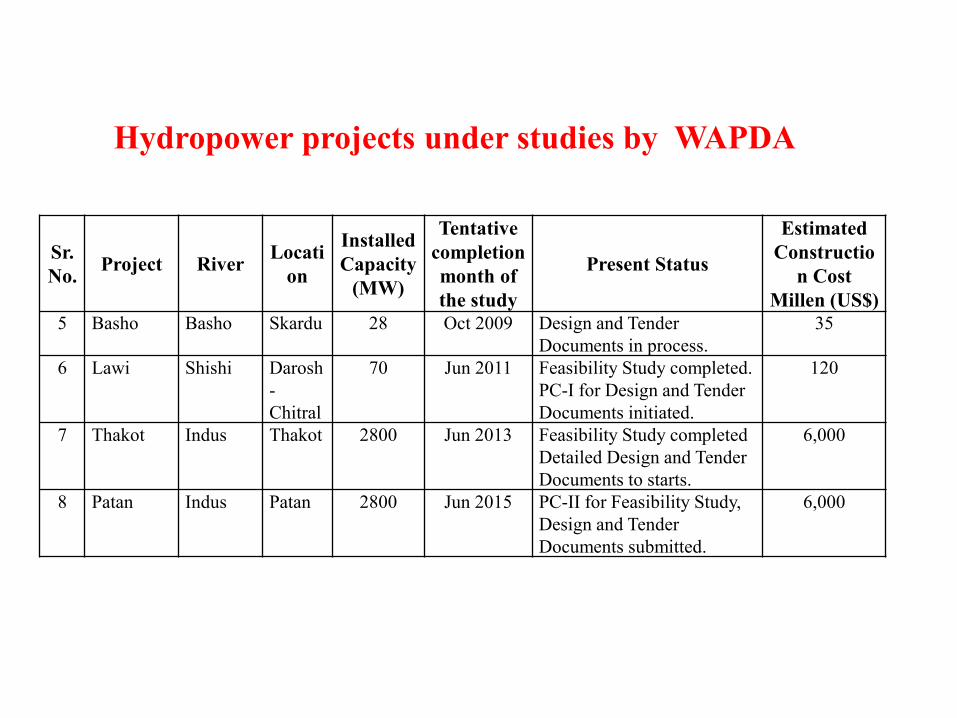
Hydropower projects under studies by WAPDA
Sr.
No.Project River
Locati
on
Installed
Capacity
(MW)
Tentative
completion
month of
the study
Present Status
Estimated
Constructio
n Cost
Millen (US$)
5 Basho Basho Skardu 28 Oct 2009 Design and Tender
Documents in process.
35
6 Lawi Shishi Darosh
-
Chitral
70 Jun 2011 Feasibility Study completed.
PC-I for Design and Tender
Documents initiated.
120
7 Thakot Indus Thakot 2800 Jun 2013 Feasibility Study completed
Detailed Design and Tender
Documents to starts.
6,000
8 Patan Indus Patan 2800 Jun 2015 PC-II for Feasibility Study,
Design and Tender
Documents submitted.
6,000
Hydropower projects under studies by WAPDA
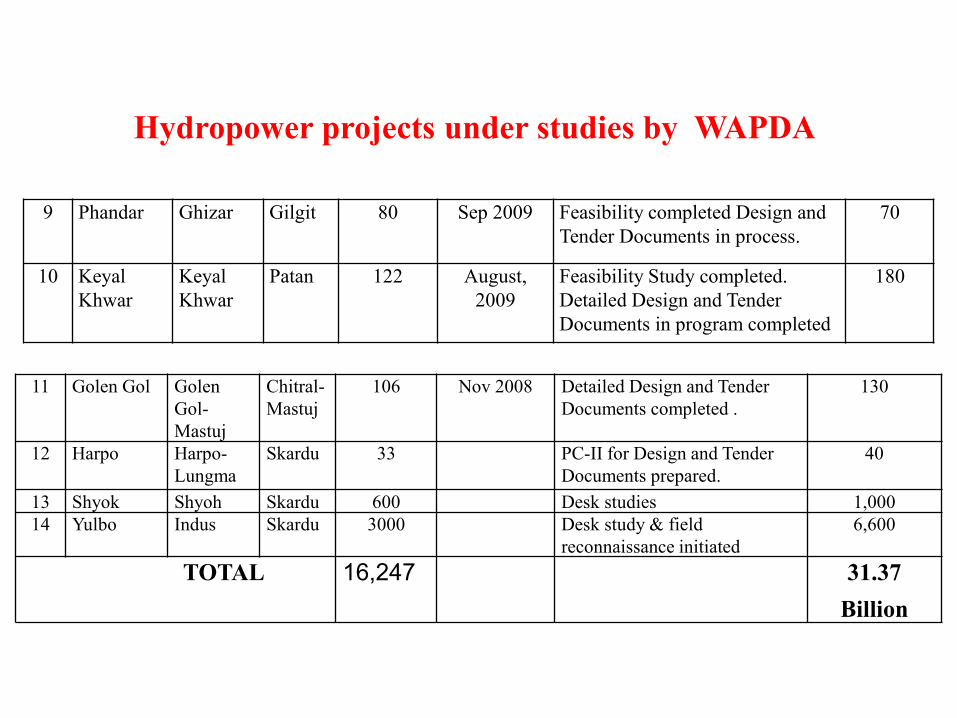
9 Phandar Ghizar Gilgit 80 Sep 2009 Feasibility completed Design and
Tender Documents in process.
70
10 Keyal
Khwar
Keyal
Khwar
Patan 122 August,
2009
Feasibility Study completed.
Detailed Design and Tender
Documents in program completed
180
11 Golen Gol Golen
Gol-
Mastuj
Chitral-
Mastuj
106 Nov 2008 Detailed Design and Tender
Documents completed .
130
12 Harpo Harpo-
Lungma
Skardu 33 PC-II for Design and Tender
Documents prepared.
40
13 Shyok Shyoh Skardu 600 Desk studies 1,000
14 Yulbo Indus Skardu 3000 Desk study & field
reconnaissance initiated
6,600
TOTAL 16,247 31.37
Billion
Hydropower projects under studies by WAPDA
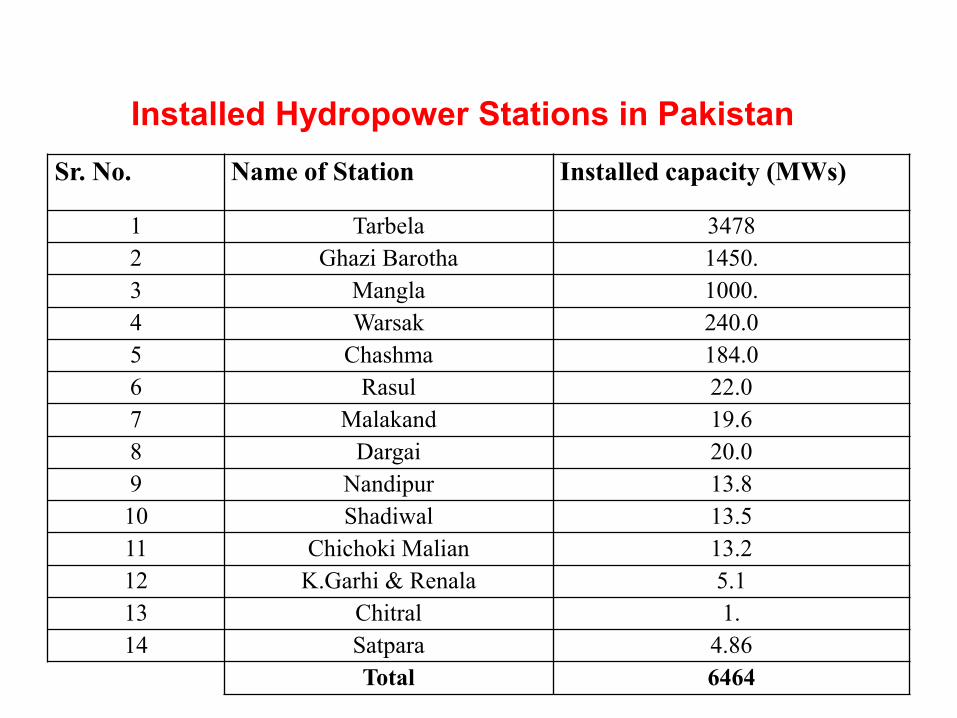
Sr. No. Name of Station Installed capacity (MWs)
1 Tarbela 3478
2 Ghazi Barotha 1450.
3 Mangla 1000.
4 Warsak 240.0
5 Chashma 184.0
6 Rasul 22.0
7 Malakand 19.6
8 Dargai 20.0
9 Nandipur 13.8
10 Shadiwal 13.5
11 Chichoki Malian 13.2
12 K.Garhi & Renala 5.1
13 Chitral 1.
14 Satpara 4.86
Total 6464
Installed Hydropower Stations in Pakistan
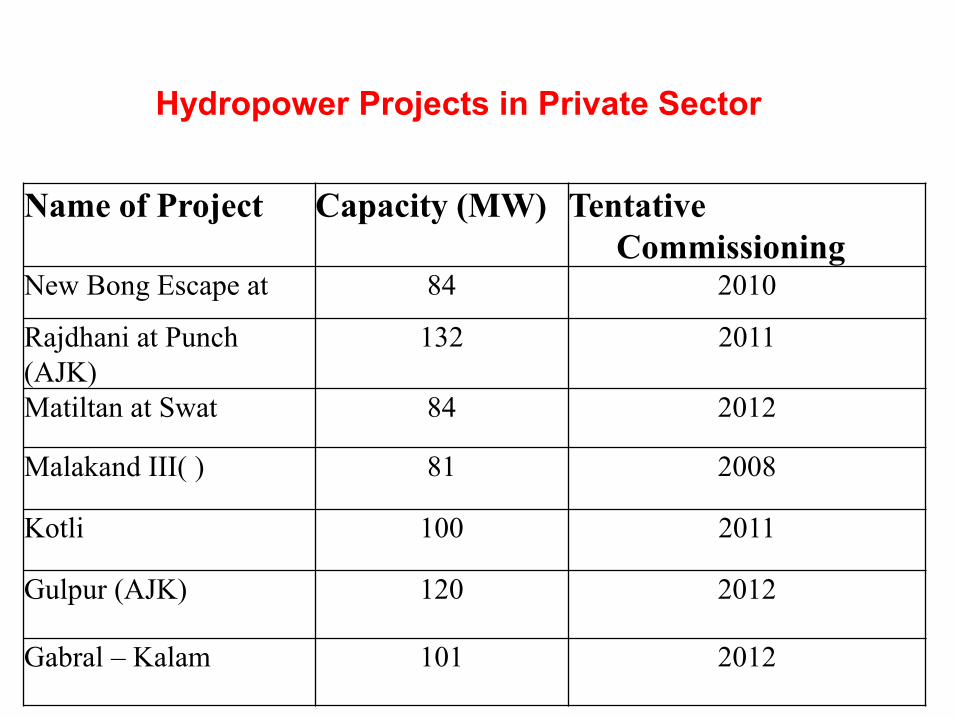
Name of Project Capacity (MW) Tentative
CommissioningNew Bong Escape at 84 2010
Rajdhani at Punch
(AJK)
132 2011
Matiltan at Swat 84 2012
Malakand III( ) 81 2008
Kotli 100 2011
Gulpur (AJK) 120 2012
Gabral – Kalam 101 2012
Hydropower Projects in Private Sector

Total 19403 MW
Oil6497 MW
(34%)
Hydel6489 MW
(33%)
Nuclear452 MW
(2%)Coal
150 MW(1%)
Gas5815 MW
(30%)
OVERVIEW OF PAKISTAN POWER SECTORGENERATION PATTERN

Barriers in the Development of
Hydel Power1. To achieve consensus among people &
provinces.2. Technology and Information Barriers. 3. Policy Barriers.4. Regulatory Barriers.5. Institutional Barriers.6. Financial Barriers.7. Interconnection Barriers.8. Tariff. 9. Procedural impediments.
9. Risksa. Hydrological Risksb. Geological Risks. c. Environment Risks.d. Miscellaneous.

Technology and information Barriers.
We lack knowledge & information about the Technology of hydel. Need for education of hydel power technology not only for the Engineers but also for general public & decision makers.
Strategy to achieve five E’s
E----- EducationE----- EnergyE----- EmploymentE----- EquityE----- Enterprise
UET Taxila has taken a lead in starting the classes for post graduate students about Hydel Power to implement the most important “Es” of Education in Energy & for Employment on Equity basics for Enterprises.

56
PAKISTAN’S HYDROPOWER POTENTIAL (SUMMARY)
Sr.
No.
River/ Tributary Power
(MW)
1. Indus River 35760
2. Tributaries of Indus (Northern Areas) of NWFP 5558
Sub Total (1+2) 41318
3. Jhelum River 3143
4, Kunhar River 1250
5. Neelum River & its Tributaries 2459
6. Poonch River 397
Sub Total (3+4+5+6) 7249
7. Swat River & its Tributaries 2388
8. Chitral River & its Tributaries 2282
Sub Total (7+8) 4670
9. Schemes below 50 MW on Tributaries 1290
TOTAL 54, 527

57
76.2
8.3
13.2
2.4
Indus River Basin
Jhelum River Basin
Swat & Chitral River
Small Hydel
PAKISTAN’S HYDROPOWER POTENTIAL
41816 MW
7249 MW
4528 MW
1290 MW
Swat & Chitral
River
Jhelum
River
Basin
Small Hydel
Indus
River
Basin
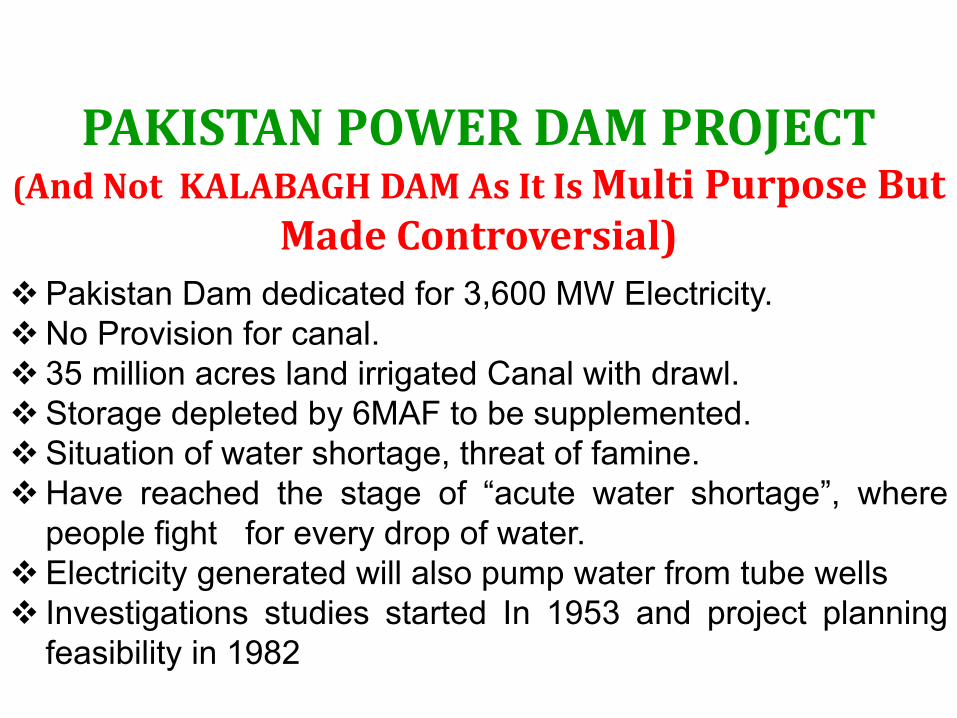
PAKISTAN POWER DAM PROJECT(And Not KALABAGH DAM As It Is Multi Purpose But
Made Controversial)
Pakistan Dam dedicated for 3,600 MW Electricity.
No Provision for canal.
35 million acres land irrigated Canal with drawl.
Storage depleted by 6MAF to be supplemented.
Situation of water shortage, threat of famine.
Have reached the stage of “acute water shortage”, where
people fight for every drop of water.
Electricity generated will also pump water from tube wells
Investigations studies started In 1953 and project planning
feasibility in 1982

Reservoir of Pakistan Dam
Live storage 6.1 MAF
Gross storage 7.9 MAF
Maximum Retention level 915 ft
Minimum reservoir level 825 ft
Average Flow 123,000 cusec
Main Dam
Crest elevation 940 ft
Maximum height 260 ft
Length 4,375 ft
Installed Capacity 3600 MW+600=4200
Yearly generation 12 Billion kWh
Annual Benefits Rs. 88 Billion
Estimated Cost US$6.2 Billion

BENEFITS OF PAKISTAN DAM
The benefits to be derived from Pakistan Dam are enormous. On
average, every year they will be higher than as given below
(Rs in Billion)
Average annual power benefits 64.64
Average annual irrigation benefits 12.53
Average annual flood alleviation benefits 1.44
Additional power from Tarbela 8.97
Average yearly benefits 87.58
NATIONAL LOSS IF PAKISTAN DAM IS NOT
BUILT
The Annual energy generated would be equivalent to 20 million barrels of oil
otherwise needed to produce thermal power.
National food needs would be jeopardized.
38% loss of storage capacity of the existing reservoirs due to
sedimentation, results in shortage of committed irrigation supplies.
Industrial, Commercial, Economic & quality of life will deteriorate further.
For implementation of Water Apportionment Accord 1991, new
storages are essential. it would give rise in bitter inter-provincial
disputes,

Salient Features of
Pakistan(AS OF 1993)
Irrigated Area 34.5 M.Acres
Cultivated Area 51 M.Acres
Total Area 197 M.Acres
Total Surface Flow 151 M.Acre Ft
Canals Withdrawals 106 MAF
Ground Water Pumps 43 MAF
Total length of Canals 58,500 KM
Agricultural Produce 26% of GDP
WATER STORAGE CAPACITIES
OF SOME COUNTRIES
Pakistan can store only 30 days of water.
India can store 120-220 days of water
South Aferica can store 500 days of water
Eygpt Aswan dam can store upto 700 days
of water

APPREHENSIONS OF SINDH
(1) No surplus water to fill Pakistan Dam reservoir
• ® Annual average of 35 MAF escape below Kotri to Sea.
• ® Pakistan Dam reservoir will be filled up by only 6MAF, which
will gradually be released to the provinces.
• ® Indus River System Authority (IRSA) has studied and confirmed
that sufficient water is available for further storage
• ® Surface flow annual 151 MAF
(2) Anxiety the project would render Sindh into desert.
® Dams don’t consume water! These only store water
during flood season and make it available on crop demand
basis
® After Pakistan Dam, the canal withdrawals for Sindh
would further increase by about 2.25 MAF.
(3) Outlets would be used to divert water from the
reservoir
® The project design must not include any provision for
canals.
® Telemetric system are working well which are installed at
each barrage and flow control points to monitor discharge in
various canals commands, on real time basis under the
auspices of Indus Water River System Authority (IRSA) and in
all provinces.

(4) Cultivation in “Sailaba” areas would be
effected
® Flood peaks above 300,000 cusecs would still be
coming after construction of Pakistan Dam, without
detriment to the present agricultural practices, while
large floods would be effectively controlled. This would,
in fact, be conducive to installation of permanent tube
wells to provide perennial irrigation facility in rive rain
areas. The farmer can have two crops annually instead
of the present one crop.
(5) Sea Water intrusion estuary would accentuate.
® Data shows that sea water intrusion, seems to be
at its maximum even now, and it is unlikely to be
aggravated further by Pakistan Dam.

APPREHENSION OF NWFP (KPK)
1. flooding of Peshawar Valley including Nowshera
• ®Backwater effect of Dam lake would end about 10 miles
downstream of Nowshera.
2. Area of Mardan, Pabbi and Swabi plains would be adversely
affected creating water logging and salinity.
• ® Lowest ground levels at Mardan, Pabbi and Swabi areas are 970,
960 and 1000 feet above MSL respectively, as compared to the
maximum conservation level of 915 ft for dam, Operation pattern of
reservoir cannot block the land drainage and cause water logging or
salinity
4. Operation of Mardan SCARP would be adversely
affected.
® The invert levels of main drains of Mardan SCARP are
higher than reservoir elevation of 915 feet and the back water
level in Kabul River. These drains would keep on functioning
without any obstruction.
5. Fertile cultivable land would be submerged.
® Total cultivable affected land under the reservoir is only
35,000 acres,(24,500 acres in Punjab 3,000 acres in
NWFP).irrigated land would be only 3,000 acres (2,900 acres in
Punjab and 100 acres in NWFP).
6. Population Dislocation
® Total population to be relocated is 120320 of which
78,170 shall be from Punjab and 42,150 from NWFP.
Resettlement of Affected Population will be properly
compensated

BENEFITS OF HYDEL POWER DEVELOPMENT
Hydel Potential of 54,000MW to be harnessed to avoid
load shedding
To reduce dependency on oil import
Hydel power a stimulator for the socio-economic
growth
Highly reliable, cheap operation and maintenance
Able to respond to rapidly changing loads without loss
of efficiency
The plants have a long life so highly economical

BENEFITS OF HYDEL POWER DEVELOPMENT
No nuisance of smoke, exhaust gases, soot, as
environment, friendly
Multipurpose to give additional advantages of
irrigation, flood control
Optimal Utilization for development of
Hydropower Projects in cascade
Cheap Electricity, food security, drinking water,
flood control, drought mitigation,
environment control, carbon credit

Challenges in Hydropower Projects
To achieve consensus among people & provinces.
Generally located in remote area, lack of basic infrastructure
(access roads, tunnels, electricity, telephone, colony, potable
water, manpower)
Dedicated and expensive delivery infrastructure required
Extra thermal capacity for backup in low water season
Hydel Generation varies with availability of water & head
Limited International experience in Private Hydropower
Projects71
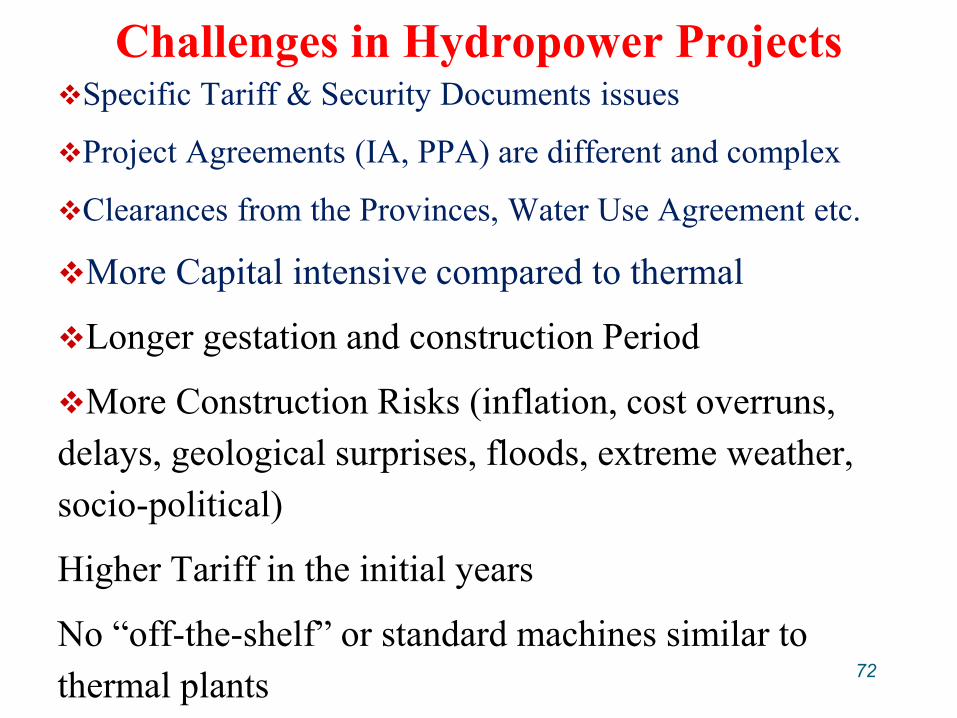
Challenges in Hydropower ProjectsSpecific Tariff & Security Documents issues
Project Agreements (IA, PPA) are different and complex
Clearances from the Provinces, Water Use Agreement etc.
More Capital intensive compared to thermal
Longer gestation and construction Period
More Construction Risks (inflation, cost overruns,
delays, geological surprises, floods, extreme weather,
socio-political)
Higher Tariff in the initial years
No “off-the-shelf” or standard machines similar to
thermal plants72
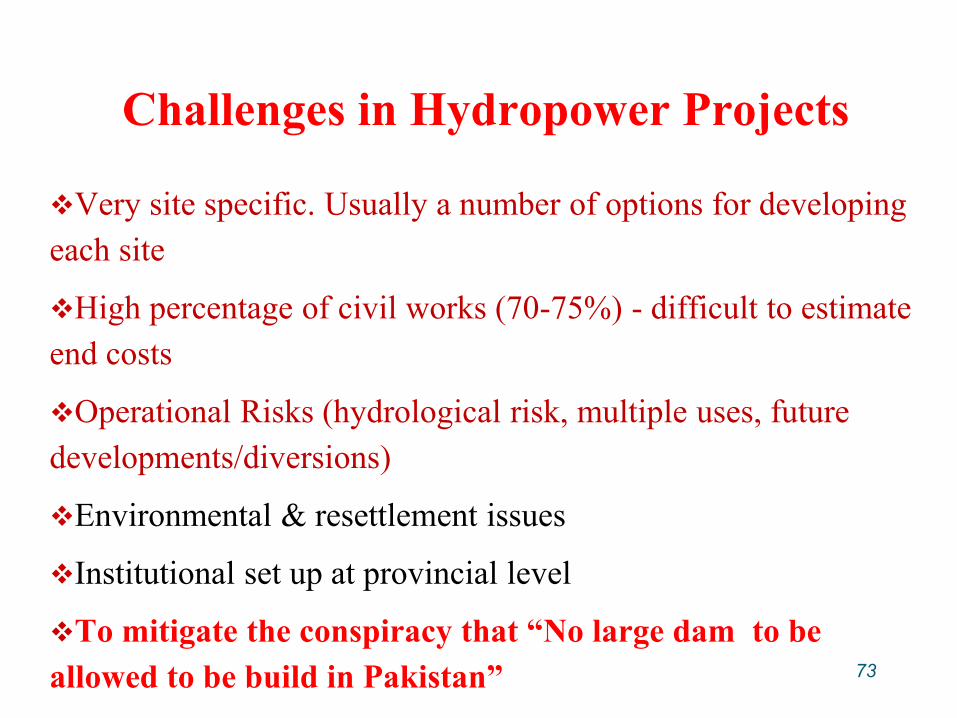
Challenges in Hydropower Projects
Very site specific. Usually a number of options for developing
each site
High percentage of civil works (70-75%) - difficult to estimate
end costs
Operational Risks (hydrological risk, multiple uses, future
developments/diversions)
Environmental & resettlement issues
Institutional set up at provincial level
To mitigate the conspiracy that “No large dam to be
allowed to be build in Pakistan” 73
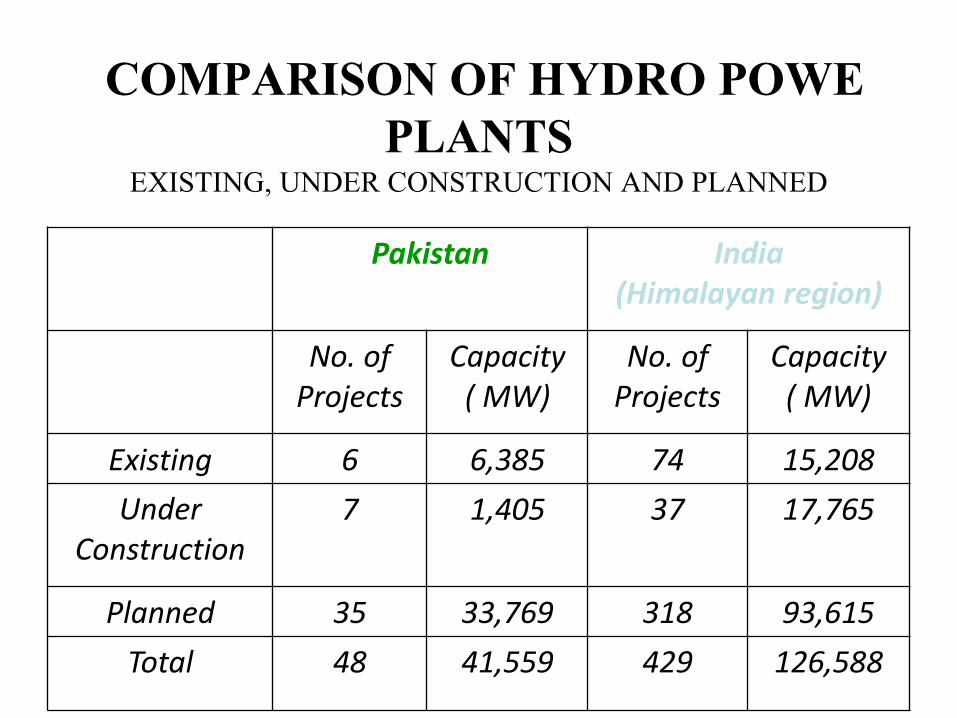
COMPARISON OF HYDRO POWE
PLANTSEXISTING, UNDER CONSTRUCTION AND PLANNED
Pakistan India(Himalayan region)
No. of Projects
Capacity( MW)
No. of Projects
Capacity( MW)
Existing 6 6,385 74 15,208
Under Construction
7 1,405 37 17,765
Planned 35 33,769 318 93,615
Total 48 41,559 429 126,588
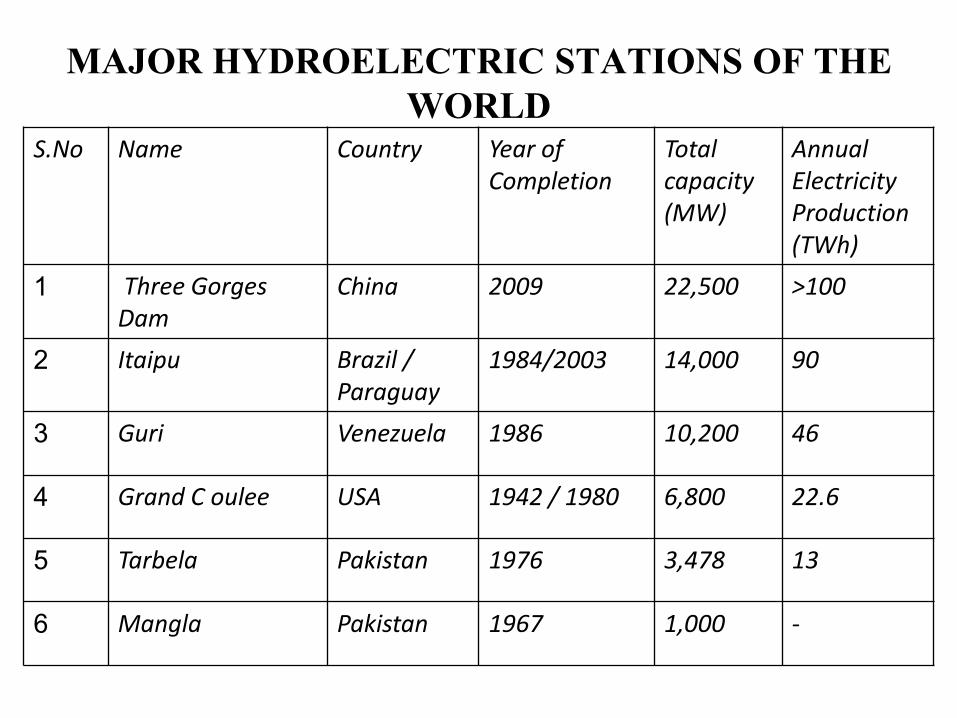
MAJOR HYDROELECTRIC STATIONS OF THE
WORLDS.No Name Country Year of
CompletionTotal capacity (MW)
Annual Electricity Production (TWh)
1 Three Gorges Dam
China 2009 22,500 >100
2 Itaipu Brazil / Paraguay
1984/2003 14,000 90
3 Guri Venezuela 1986 10,200 46
4 Grand C oulee USA 1942 / 1980 6,800 22.6
5 Tarbela Pakistan 1976 3,478 13
6 Mangla Pakistan 1967 1,000 -
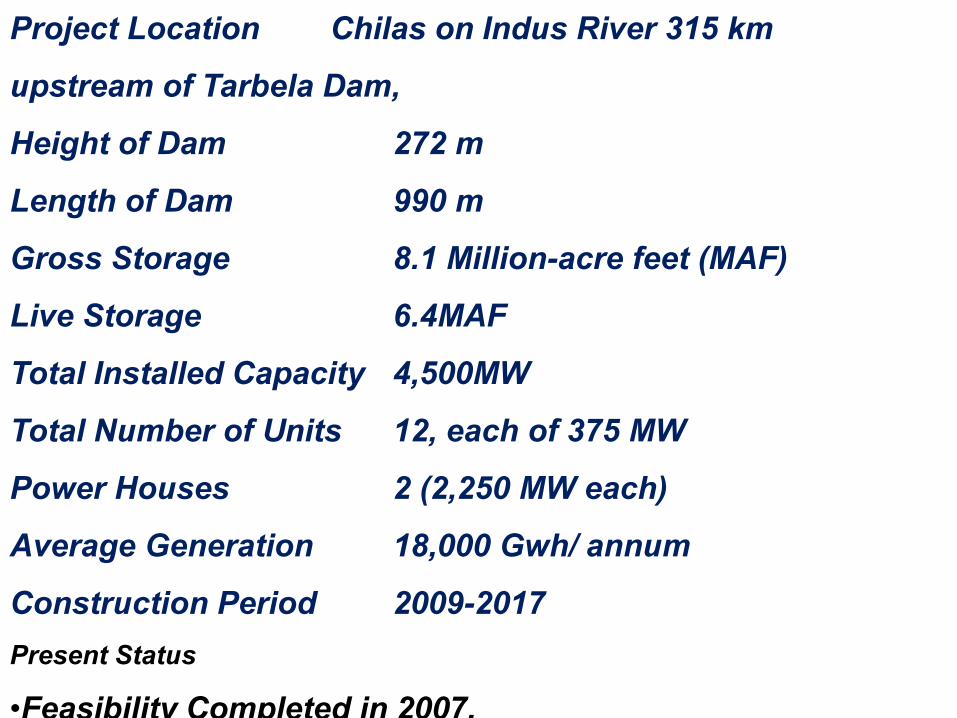
(PROFILE OF PROJECT UNDER EXECUTION)
Project Location Chilas on Indus River 315 km
upstream of Tarbela Dam,
Height of Dam 272 m
Length of Dam 990 m
Gross Storage 8.1 Million-acre feet (MAF)
Live Storage 6.4MAF
Total Installed Capacity 4,500MW
Total Number of Units 12, each of 375 MW
Power Houses 2 (2,250 MW each)
Average Generation 18,000 Gwh/ annum
Construction Period 2009-2017
Present Status
•Feasibility Completed in 2007.
Top Related