


Languages
Pages
Legal


8/6/2019 Rohail Finance
http://slidepdf.com/reader/full/rohail-finance 1/32
8/6/2019 Rohail Finance
http://slidepdf.com/reader/full/rohail-finance 2/32
Introduction
Basically our project is about Investment portf olio. As It is defined
as the investment in an assortment or range of secur ities to spread
the risk of possible loss due to below expectations perf ormance of
one or a f ew of them.
In itially we are given an amount of Rs.15000 to invest in the stock
market. T he stock market gives us the inf ormation abou t the
analysis of macro-economic, political and other vital inf ormation
that lead to influence investment decisions. We have to invest Rs.15000 hy pothetically twice a week. We can only trade twice a
day . We have to invest in at least five to six companies. T hen it
depends on us that which share to bu y and which to sell. We must
have a reason behind that why are we bu ying this share. Our
trading days were fixed we can trade on the respective dates. It was
a mon th project comprising of eight readings. But dur ing rest of the
days we have to be keep in touch with the changing trends in
economy and how are the y influencing the stock market rates.
Fur ther more in the end we have to make pie-cha rts f or each reading. Means eight pie-cha rts with their analysis as well. A
separate trend chart f or each compan y should be made along with
the analysis. And at last a conclusion must be drawn to interpret
that what we have gained f rom this investment por tf olio project.

8/6/2019 Rohail Finance
http://slidepdf.com/reader/full/rohail-finance 3/32
P IE CHARTS ANALYSIS
Pie chart as per readings day 1:
T he above chart indicates that 11% of total amount invested in bu ying the
shares of ICI PAKISTAN, 37% in UNILIEVER FOODS, 17%
inSEMINES,9%BATA PAKISTAN,1% inKOHINOOR MILLS, 1% inGULL
AHMAD, 7% in abbot, 10% inSEARL PAKISTAN , 2% in FAYSAL BANK, 5%
in PAKISTAN CABLES. While the total of all sum up to 100%.We selected all
these companies on the basis their big-name and well reputation keeping in
mind that it would lead us to gain profit.
ICI Pakistan
11%
Uniliver Food
37%
Faysal bank
2%
Pakisatan
Cables
5%
Searl Pakistan
10%
Abbot
7%
Gull Ahmad
1%
Kohenor Mills
1%
Bata Pakistan
9%
semines
17%
Day 1

8/6/2019 Rohail Finance
http://slidepdf.com/reader/full/rohail-finance 4/32
Pie chart as per readings of day 2:
T he share price of Gull Ahmad remains the same, and due to f ear of loss we
sell 5 share of its. T hus by gaining the amount of 129.38 we purchased
NATIONAL FOODS and MICHELLES FOODS as their share prices are
increasing day by day . As there is no eff ect on our investment so a ma jor
portion of investment is distributed in UNILIEVER FOODS.
ICI Pakistan
10%
Uniliver Food
37%
national
food
0%
mitchalls fruit
0%
Faysal
bank
2%
Pakisatan
Cables
5%
Searl Pakistan
10%
Abbot
7%
Gull
Ahmad
1%
Kohenor Mills
2%
Bata Pakistan
9%
semines
17%
DAY 2

8/6/2019 Rohail Finance
http://slidepdf.com/reader/full/rohail-finance 5/32
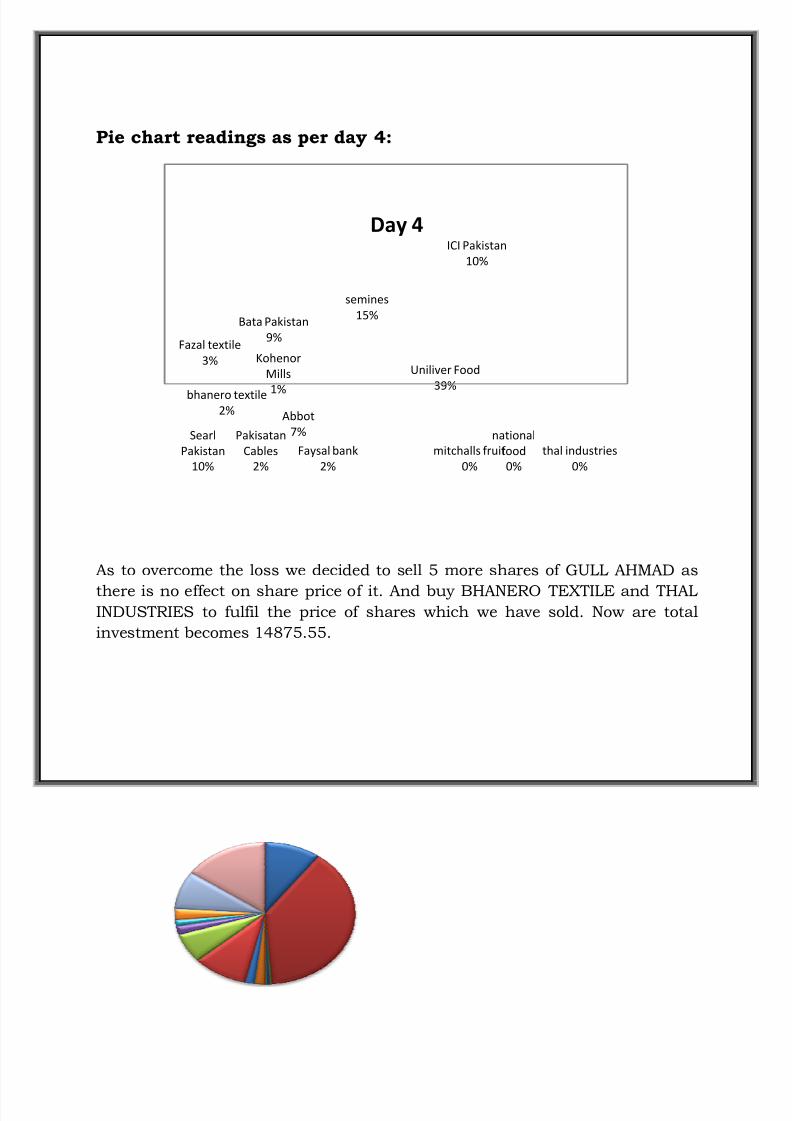
Pie chart readings as per day 3:
In day three there is a little increase in UNILIEVER FOODS as by 38%.we
decided to sell 10 shares of Pakistan cables. And bu y 1 share of FAZAL
TEXTILE to gain more profit.
ICI Pakistan
10%
Uniliver Food
38%
national food
0%
mitchalls fruit
0%
Faysal
bank
2%
Pakisatan
Cables
2%
Searl Pakistan
10%
Abbot
7%
Gull
Ahmad
1%
Kohenor
Mills2%
Fazal
textile
3%
Bata Pakistan
9%
semines
16%
DAY 3
8/6/2019 Rohail Finance
http://slidepdf.com/reader/full/rohail-finance 6/32

8/6/2019 Rohail Finance
http://slidepdf.com/reader/full/rohail-finance 7/32
T he share price of UNILIEVER FOODS is increasing day by day as it is good to
have it. T here is no change in THAL Industries, National Foods etc. We decided
to sell the share of BHANERO textile as it share price increases. In order toovercome the loss of BHANERO we bu y 2 shares of MCB. Now the total
investment becomes 14635.17.
Pie chart as per readings of day 6:
ICI
Pakistan
10%
Uniliver Food
39%
national food
0%
thal industries
0%
mitchalls fruit
1%
Faysal bank
2%
MCB Ltd
3%
Pakisatan Cables
2%
Searl Pakistan
10%
Abbot
7%
Kohenor Mills
1%
Fazal textile
2%
Bata Pakistan
8%
semines
15%
Day 5

8/6/2019 Rohail Finance
http://slidepdf.com/reader/full/rohail-finance 8/32
As there is little change in the total investment, so we have decided to sell 1
share of MICHELLES, 5 shares of Pakistan cables and 5 shares of UNILIVER
f oods. So the total selling amount becomes 10134.05. And we bu y 6 shares of
SHELL GAS LPG, 6 shares of nestle Pakistan,1 share of FAZAL TEXTILE and 1
share of THAL INDUSTRIES. So the total investment becomes 182675.7
ICI Pakistan
8%
nestle pak
51%
national
food
0%
thal industries
1%Faysal bank
1%
MCB Ltd
2%
Searl Pakistan
8%
Abbot
5%
Kohenor
Mills
1%
Fazal textile
3%
Bata Pakistan
6%
semines
12%
shell gas LPG2%
day 6

8/6/2019 Rohail Finance
http://slidepdf.com/reader/full/rohail-finance 9/32
Pie chart as per readings day 7:
AS nestle is covering 50% of our total investment there is no such increase in
the investment so we decided to sell 2 shares of fazal textile and 2 shares of
semiens. In order to f ulfil gape we bu y the 2 shares of rafhan maize and 1
share of thal industries.
ICI
Pakistan
8%
nestle pak
50%
national food
0%
rafhan maize
16%
thal industries
1%
Faysal
bank
1%
MCB Ltd
2%
Searl Pakistan
8%
Abbot
5%
Kohenor Mills
1%
Bata Pakistan
6%
shell gas LPG
2%DAY 7

8/6/2019 Rohail Finance
http://slidepdf.com/reader/full/rohail-finance 10/32
Pie chart as per readings day 8:
T his was our last trading day,here we had to sold all shares in order to judge
wether we gain profit or loss overall.T his activity reaped us a total of amont Rs.18227.45.T hat means we gained an overall profit of Rs.3227.45 during the
whole trading period.
Trend Chart Analysis
ICI
Pakistan
8%
nestle pak
50%
national food
0%
rafhan maize
16%
thal industries
1%
Faysal
bank
1%
MCB Ltd
2%Searl Pakistan
8%
Abbot
5% Kohenor Mills
1%
Bata Pakistan
6%
shell
gas
LPG
2%
Day 8

8/6/2019 Rohail Finance
http://slidepdf.com/reader/full/rohail-finance 11/32
We bu y ICI Pakistan Share because we read in their final report that their
shares are exist in the top 10 KSE. T he share price decrees whole the period
because ICI Pakistan declare bonus to their shares holder because of this the
investors sell the shares in the market and because of this the price of ICI
Pakistan shares go down. But if we bu y it f or long time period it would be thegood investment f or us.
130
135
140
145
150
155
160
ICI Pakistan
ICI Pakistan
ICI PAKISTAN
DATE PRICE
20-4-2010 158.04
22-4-2010 154
27-4-2010 153.42
29-4-2010 149.92
11/5/2010 144.98
13-5-2010 142.6218-5-2010 141.16
20-5-2010 140.7

8/6/2019 Rohail Finance
http://slidepdf.com/reader/full/rohail-finance 12/32
We bu y the Unilever Food Shares at a price of RS.1100 because the compan y
have a ver y good reputation in the market. T ill 27-4-2010 the price remain
same and it increase to RS.1150 and when it goes to the RS.1958.01 we sell
the shares because we gain the max profit f rom this share.
0
500
1000
1500
2000
2500
Unilever Food
Unilever Food
UNILIVER FOOD
DATE PRICE
20-4-2010 1100
22-4-2010 1100
27-4-2010 1100
29-4-2010 1150
11/5/2010 1150
13-5-2010 1958.01

8/6/2019 Rohail Finance
http://slidepdf.com/reader/full/rohail-finance 13/32
As FAYSAL bank is well reputed bank in Pakistan so we bu y its shares. At 1st
day its share price was 18.79. During the whole time period some variationcomes in share price because of market instability . We retain this till the end of
the days because we thought that share price will go up but it gradually
decreases.
0
24
6
810
12
14
16
18
20
Faysal Bank
Faysal Bank
FAYSAL BANK
DATE PRICE
20-4-2010 18.79
22-4-2010 18.51
27-4-2010 18.19
29-4-2010 18.69
11/5/2010 18.62
13-5-2010 16.65
18-5-2010 16.04
20-5-2010 15.35

8/6/2019 Rohail Finance
http://slidepdf.com/reader/full/rohail-finance 14/32
Pakistan cable is a good reputed compan y in Pakistan because of this we bu y it
shares. We think that Copper price will goes up and because of this the price of the shares will also goes up. But as graph shows man y variation that at 20th
the price was 53.85.after some time when we get our principle amount we sell
the shares because we think that now the price will not goes up.
50
50.5
51
51.5
52
52.5
53
53.5
54
54.5
Pakistan Cable
Pakistan Cable
PAKISTAN CABLE
DATE PRICE
20-4-2010 53.85
22-4-2010 52.88
27-4-2010 53.82
29-4-2010 51.62
11-52010 51.55
13-5-2010 53.88

8/6/2019 Rohail Finance
http://slidepdf.com/reader/full/rohail-finance 15/32
T he SEARL Pakistan has a good reputation in the medical compan y because of
this we bu y the shares of this compan y . When we bu y the shares the prices of
medicines was going up and we think when the price will goes up the share
price will also goes up. But this did not happen and we sell the shares of
SEARL Pakistan at the last day .
55.5
56
56.5
57
57.5
58
58.5
59
59.5
Searl Pakistan
Searl Pakistan
SEARL PAKISTAN
DATE PRICE
20-4-2010 58.98
22-4-2010 58
27-4-2010 58.22
29-4-2010 58.5
11/5/2010 57.78
13-5-2010 59.0118-5-2010 58.5
20-5-2010 56.69

8/6/2019 Rohail Finance
http://slidepdf.com/reader/full/rohail-finance 16/32
Abbott Compan y is a well known compan y in medical sector so we bu y its
shares. When we bu y the shares the prices of medicines was going up and we
think when the price will goes up the share price will also goes up. But this didnot happen and we sell the shares of SEARL Pakistan at the last day at the
price of RS.95.9.
92
94
96
98
100
102
104
Abbott
Abbott
ABBOTT
DATE PRICE
20-4-2010 102.29
22-4-2010 101.66
27-4-2010 101.03
29-4-2010 99.12
11/5/2010 99.08
13-5-2010 99.12
18-5-2010 98.06
20-5-2010 95.9

8/6/2019 Rohail Finance
http://slidepdf.com/reader/full/rohail-finance 17/32
We bu y the shares of gul Ahmed at the price of RS.20.75 and we retain its
shares f or 2 days and sell its shares on 29 April at the price of RS.23.5.
19
19.5
20
20.5
21
21.5
22
22.5
23
23.5
24
20-4-2010 22-4-2010 27-4-2010 29-4-2010
Gul Ahmed
Gul Ahmed
GUL AHMED
DATE PRICE
20-4-2010 20.75
22-4-2010 21.01
27-4-2010 22.39
29-4-2010 23.5

8/6/2019 Rohail Finance
http://slidepdf.com/reader/full/rohail-finance 18/32
Although Kohinoor is a good compan y but due to the economic recession its
price continuously falls thus giving us a loss in investment.
0
123456789
10
Kohinoor
Kohinoor
KOHINOOR
DATE PRICE
20-4-2010 8.12
22-4-2010 8.97
27-4-2010 9.28
29-4-2010 8.26
######## 7.55
13-5-2010 7.63
18-5-2010 7.44
20-5-2010 7.26

8/6/2019 Rohail Finance
http://slidepdf.com/reader/full/rohail-finance 19/32
8/6/2019 Rohail Finance
http://slidepdf.com/reader/full/rohail-finance 20/32
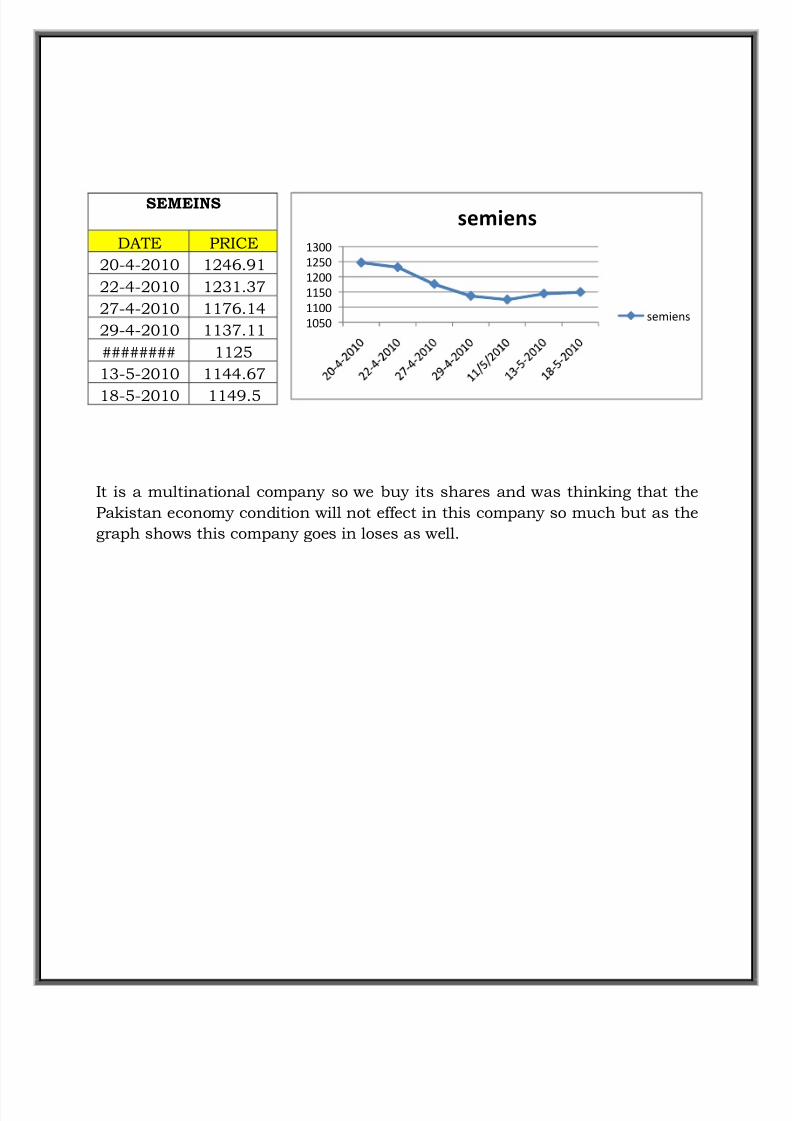
It is a multinational compan y so we bu y its shares and was thinking that the
Pakistan economy condition will not eff ect in this compan y so much but as the
graph shows this compan y goes in loses as well.
1050
1100
1150
1200
1250
1300
semiens
semiens
SEMEINS
DATE PRICE
20-4-2010 1246.91
22-4-2010 1231.37
27-4-2010 1176.14
29-4-2010 1137.11
######## 1125
13-5-2010 1144.67
18-5-2010 1149.5

8/6/2019 Rohail Finance
http://slidepdf.com/reader/full/rohail-finance 21/32

8/6/2019 Rohail Finance
http://slidepdf.com/reader/full/rohail-finance 22/32
We bu y its shares at RS.74. its share price remain stable f or some period after
that it goes down and as it goes up we sell the shares at RS 72.25.
64
66
68
70
72
74
76
mitcheles foods
mitcheles foods
MITCHELES FRUIT
DATE PRICE
22-4-2010 74
27-4-2010 74
29-4-2010 73.78
######## 68
13-5-2010 72.25

8/6/2019 Rohail Finance
http://slidepdf.com/reader/full/rohail-finance 23/32
We did not hear about fazal textile but when we see in news paper the
compan y shares price goes in a positive way so we bu y this shares at the price
of RS.392 ant sell it at the price of RS.324.99.
0
100
200
300
400
500
fazal textile
fazal textile
FAZAL TEXTILES
DATE PRICE
27-4-2010 392
29-4-2010 389
######## 346.41
13-5-2010 316.195
18-5-2010 324.99

8/6/2019 Rohail Finance
http://slidepdf.com/reader/full/rohail-finance 24/32
T his compan y gives us the profit. We bu y its share at RS148.32 and sell on
RS.208.67
0
50
100
150
200
250
29-4-2010 11/5/2010
bhanero textile
bhanero textile
BHANERO TEXTILE
DATE PRICE
29-4-2010 148.32
######## 208.67
8/6/2019 Rohail Finance
http://slidepdf.com/reader/full/rohail-finance 25/32
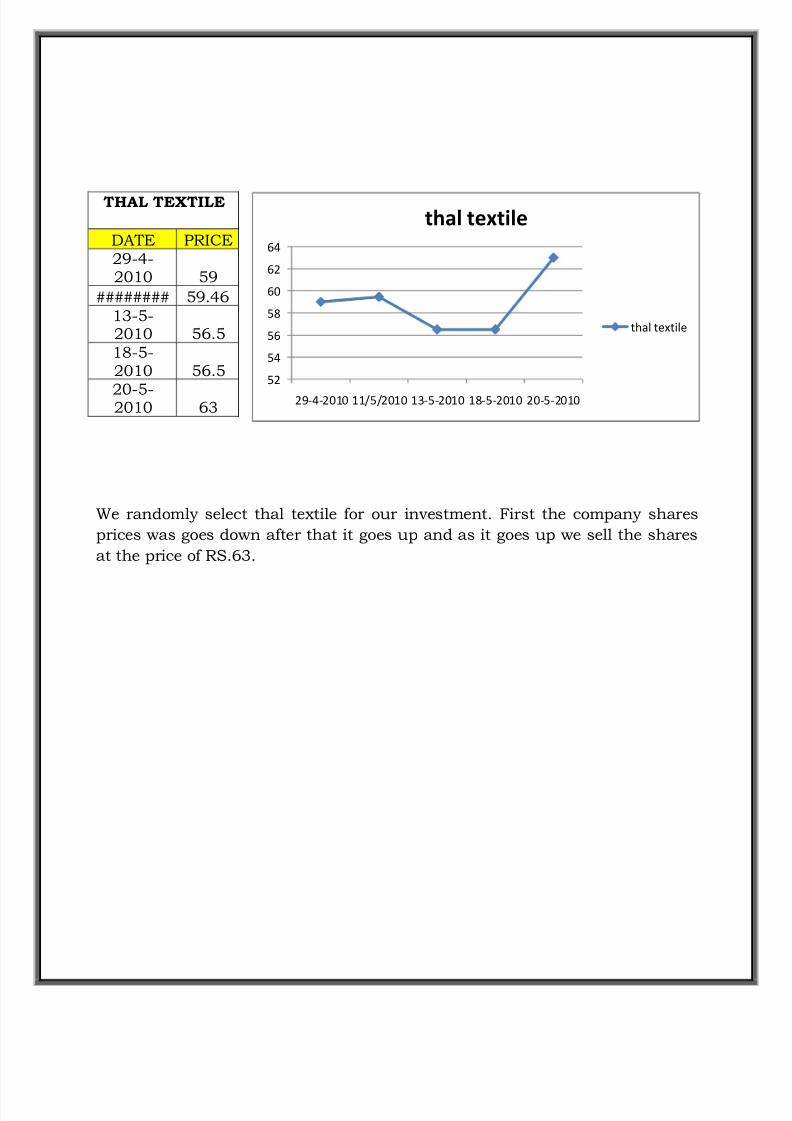
We randomly select thal textile f or our investment. First the compan y shares
prices was goes down after that it goes up and as it goes up we sell the shares
at the price of RS.63.
52
54
56
58
60
62
64
29-4-2010 11/5/2010 13-5-2010 18-5-2010 20-5-2010
thal textile
thal textile
THAL TEXTILE
DATE PRICE29-4-2010 59
######## 59.46
13-5-2010 56.518-5-2010 56.5
20-5-2010 63
8/6/2019 Rohail Finance
http://slidepdf.com/reader/full/rohail-finance 26/32
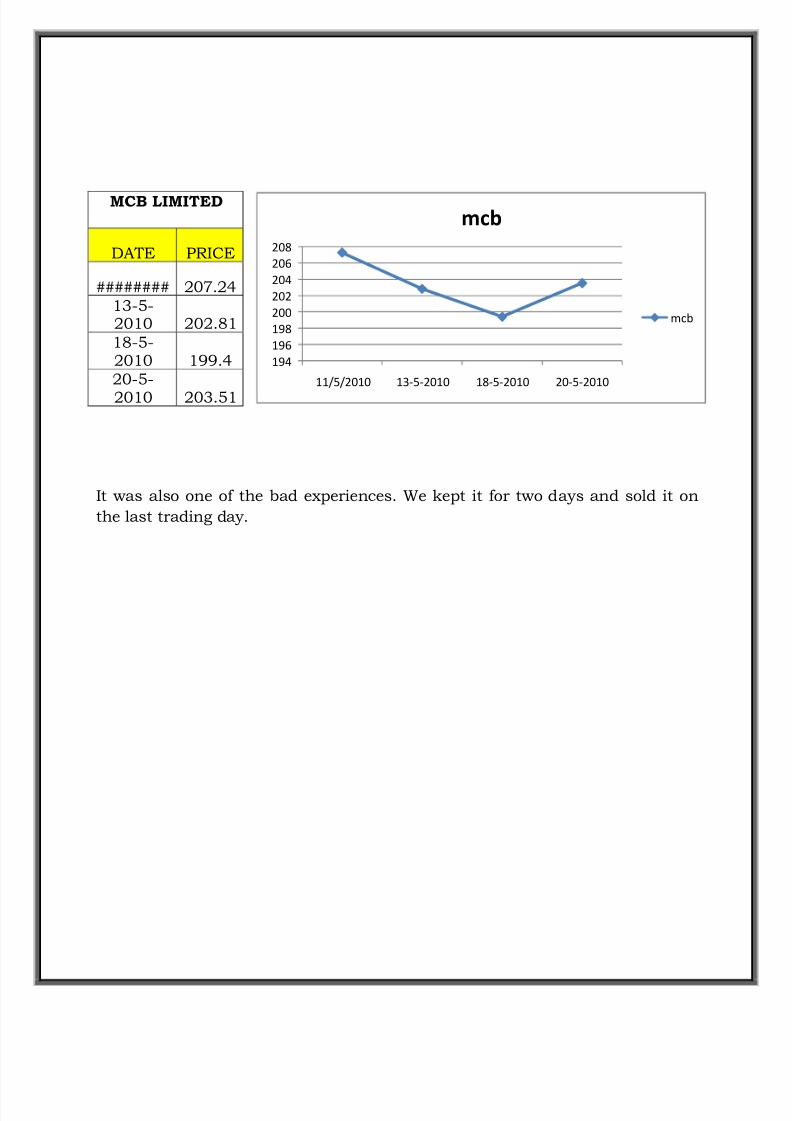
It was also one of the bad experiences. We kept it f or two days and sold it on
the last trading day .
194
196
198
200
202
204
206
208
11/5/2010 13-5-2010 18-5-2010 20-5-2010
mcb
mcb
MCB LIMITED
DATE PRICE
######## 207.24
13-5-2010 202.81
18-5-2010 199.420-5-
2010 203.51

8/6/2019 Rohail Finance
http://slidepdf.com/reader/full/rohail-finance 27/32
We randomly select Sheell Gas LPG f or our investment. T he compan y shares
price goes down whole the time period and we sell it at RS.52.
51
51.5
52
52.5
53
53.5
54
54.5
13-5-2010 18-5-2010 20-5-2010
Sheell Gas LPG
Sheell Gas LPG
SHEELL GAS LPG
DATE PRICE
13-5-2010 53.94
18-5-2010 52.74
20-5-2010 52
8/6/2019 Rohail Finance
http://slidepdf.com/reader/full/rohail-finance 28/32
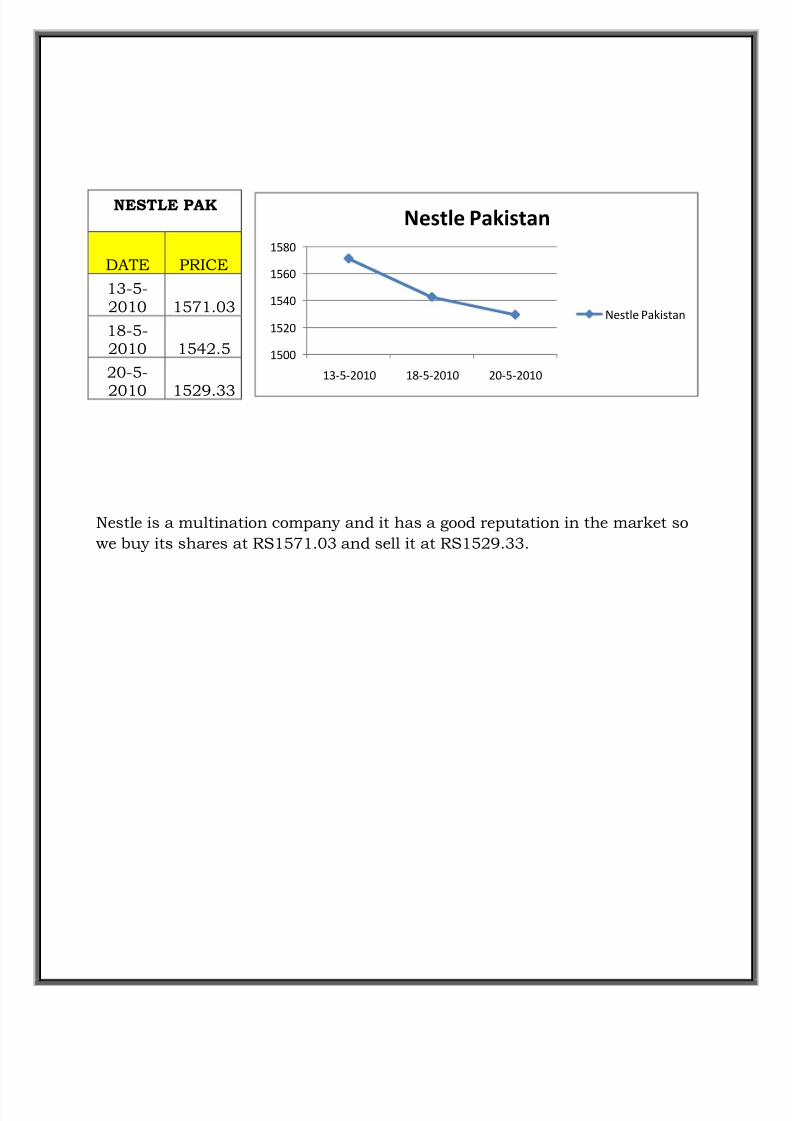
Nestle is a multination compan y and it has a good reputation in the market so
we bu y its shares at RS1571.03 and sell it at RS1529.33.
1500
1520
1540
1560
1580
13-5-2010 18-5-2010 20-5-2010
Nestle Pakistan
Nestle Pakistan
NESTLE PAK
DATE PRICE
13-5-2010 1571.03
18-5-2010 1542.5
20-5-
2010 1529.33

8/6/2019 Rohail Finance
http://slidepdf.com/reader/full/rohail-finance 29/32
T his compan y share price goes down. We bu y its share at RS1450 and sell on
RS.1449.99
STATISTICAL ANALYSIS OF DAY 2
1449.985
1449.99
1449.995
1450
1450.005
18-5-2010 20-5-2010
Rafhan Maize
Rafhan Maize
RAFHAN MAIZE
DATE PRICE
18-5-2010 1450
20-5-2010 1449.99

8/6/2019 Rohail Finance
http://slidepdf.com/reader/full/rohail-finance 30/32
DAY 1 DAY 2 K k-K^ (K-K^)^2
158.04 154 -2.56 -2.55 6.51
1100 1100 0.00 0.01 0.00
18.79 18.51 -1.49 -1.48 2.21
53.85 52.82 -1.91 -1.91 3.64
58.98 58 -1.66 -1.66 2.74
102.29 101.66 -0.62 -0.61 0.37
20.75 21.01 1.25 1.26 1.58
8.12 8.97 10.47 10.47 109.69
655 640 -2.29 -2.28 5.22 1246.91 1231.37 -1.25 -1.24 1.54
K^ -0.01
Total= 133.50
VARIENCE:-14.83
STANDARD DEVIATION:-3.85
STATISTICAL ANALYSIS OF DAY 8

8/6/2019 Rohail Finance
http://slidepdf.com/reader/full/rohail-finance 31/32
DAY 7 DAY 8 K k-K^ (K-K^)^2
141.16 140.7 -0.33 -0.38 0.14
1542.5 1529.33 -0.85 -0.91 0.83
50.05 51.13 2.16 2.10 4.42
1450 1449.99 0.00 -0.06 0.00
56.5 63 11.50 11.45 131.09
16.04 15.35 -4.30 -4.36 18.98
199.4 203.51 2.06 2.01 4.03
58.5 56.69 -3.09 -3.15 9.91
98.06 95.9 -2.20 -2.26 5.10
7.44 7.26 -2.42 -2.47 6.12
501 498.67 -0.47 -0.52 0.27
52.74 52 -1.40 -1.46 2.13
Total= 183.02
K^ 0.05
VARIENCE:-16.64
STANDARD DEVIATION:-4.08
ANALYSIS

8/6/2019 Rohail Finance
http://slidepdf.com/reader/full/rohail-finance 32/32
Top Related