


Languages
Pages
Legal

Risk Analysis of Cultural Resourcewithin Floodplains of Snoqualmie Valley
Presented By
Odra Cárdenas
Shweta Bhatia Gupta

The impacts of flooding in King County are far ranging and pose significant threats to public safety and regional economic viability, but it also threatens the continuity of cultural resources due to the devastating effects.
The cultural heritage along the fertile Snoqualmie river valley comprise quarter of the entire county is subjected to frequent and devastating floods as recently as in year 2006 seasonal flooding.
The Project
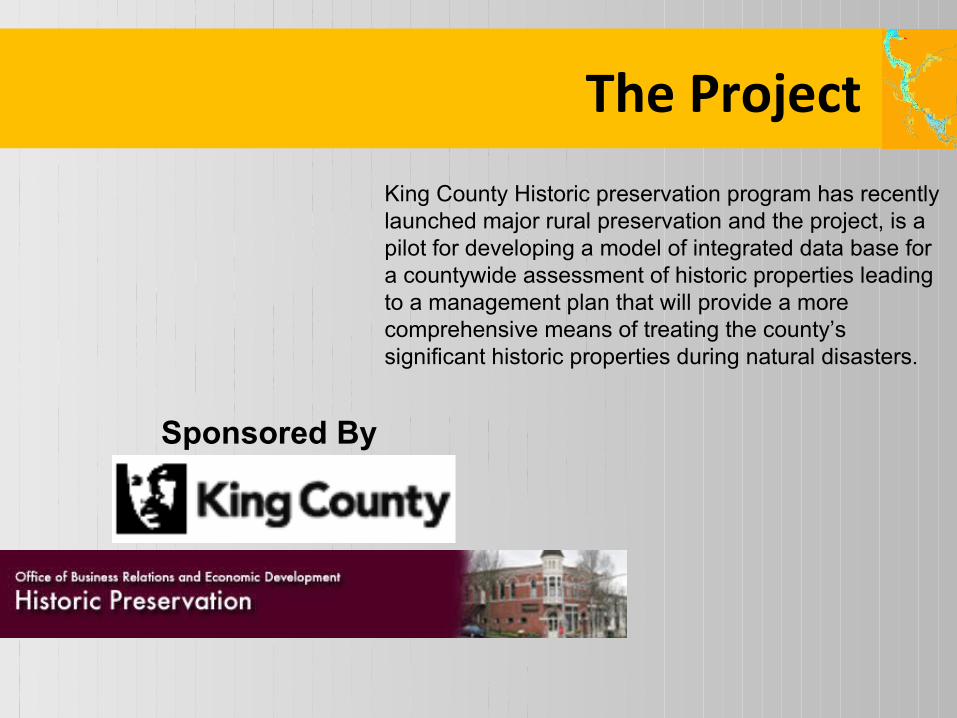
King County Historic preservation program has recently launched major rural preservation and the project, is a pilot for developing a model of integrated data base for a countywide assessment of historic properties leading to a management plan that will provide a more comprehensive means of treating the county’s significant historic properties during natural disasters.
Sponsored By
The Project

In the last 16 years, the Snoqualmie valleyhave experienced four of the worst floods on record,including November 06's record-breaking deluge.
Within the Snoqualmie River basin floodplainthere are a total of 1,880 parcels. This is approximately 40percent of the total number of parcels in King Countyfloodplains (4,738).
There are structures at risk from flooding on 867 of theseparcels. The depth of flooding varies depending onlocation.
Why Snoqualmie RiverThe Site
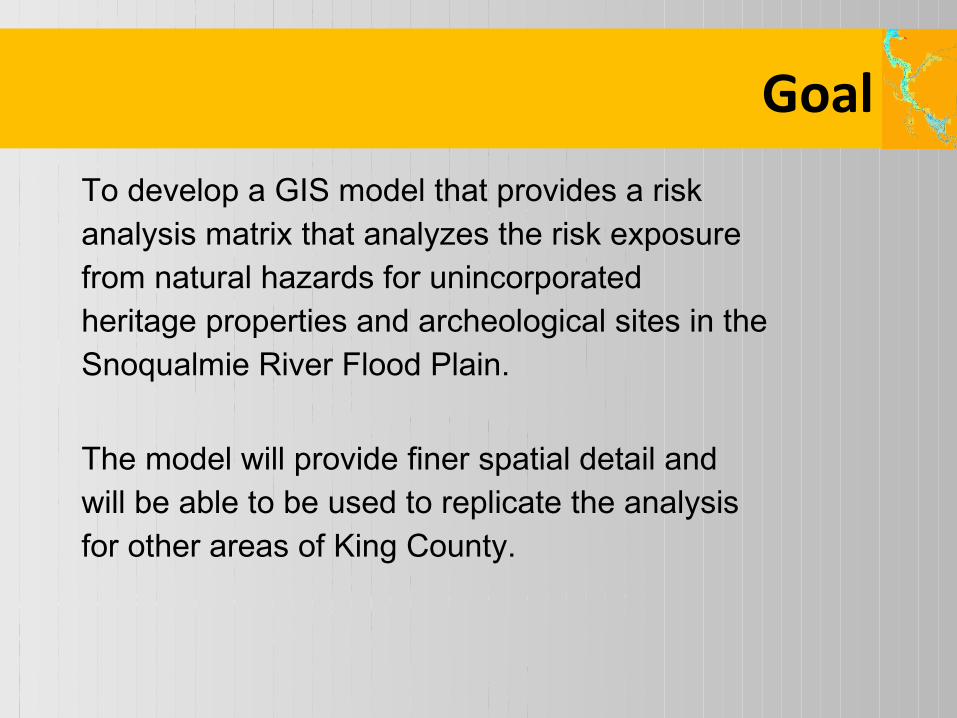
To develop a GIS model that provides a riskanalysis matrix that analyzes the risk exposurefrom natural hazards for unincorporatedheritage properties and archeological sites in theSnoqualmie River Flood Plain.
The model will provide finer spatial detail andwill be able to be used to replicate the analysisfor other areas of King County.
Goal

Phase I Objectives: Enrich the inventory (Data sets) of the cultural resource within unincorporated King
County area of Snoqualmie floodplains. Explore other datasets that may correlate with the mapped data. Correlate data sets and map the outfalls. Provide risk analysis matrix and create models to analyze risk exposure from natural
hazards for heritage properties. Create an integrated database. Phase II objectives: Manipulate data so that it can be used in future modeling applications and analysis; Mapping information about risk levels for each property. Formulate hypotheses regarding effects of the mapped outfalls; Provide report on approach and outcome of analysis.
Objectives

Methodology
Research Resource identification
Data Gathering Defining dataset
DefinitionOf Matrix
Data accumulation
Actual project plan
Work breakdown structure
Task Division
Monitoring the process
Status reports Work quality
Time schedule
Database design
Creating feature set Digitization
Reclassification
Analysis
Process
Model Building
Reporting
Management
Focus of today’s Presentation

A GIS Model for analyzing risk for unincorporated historical resources in theSnoqualmie River Floodplain of King County
A detailed Risk Analysis for the historical resources of King County (in theSnoqualmie River floodplain)
A Instructions on how to use the model and Results report on the approach,methodology and outcome of the analysis.
Scope

GIS Model Feature
Historic DistrictIDLocation Info Characteristics
HistPropretyID
HistoricDistrict
PolygonHistPropretyID HistDistrictIDHistMunicipleIDCharacteristics SummaryCharacteristicDetail
HistoricProperty
Point
HistPropPolygon
HistPropretyID
HistMunicipalityPolygon
PolygonHistPropretyIDHistStructureIDCharacteristics SummaryCharacteristicDetail
HistStructurePolygonPolygon
Polygon
HistElementIDHistPropretyIDLocation Info
HistElemPoint
Point
HistElementIDHistPropretyIDLocation Info
HistElemPolygon
Polygon
Object
Feature
HasSites
ArchSite Grid
¼ Mile grid
Historic Architecture
ArchPropertyIDLocation InfoCharacteristics
Archaeological District
Polygon
ArchPropertyID
ArchProperty Polygon
Polygon
ArchPropertyIDSmithsodianIDArchDistrictIDProperty NameLocation InfoCharacteristics SummaryCharacteristicDetail SiteDetails
Archaeological Property
Point
Feature
Feature
Archaeological Site

Project Scope
1 2
3 4
5
1. DATABASE2. DIGITIZATION3. MATRIX4. MODELS5. MAPS/ ANALYSIS
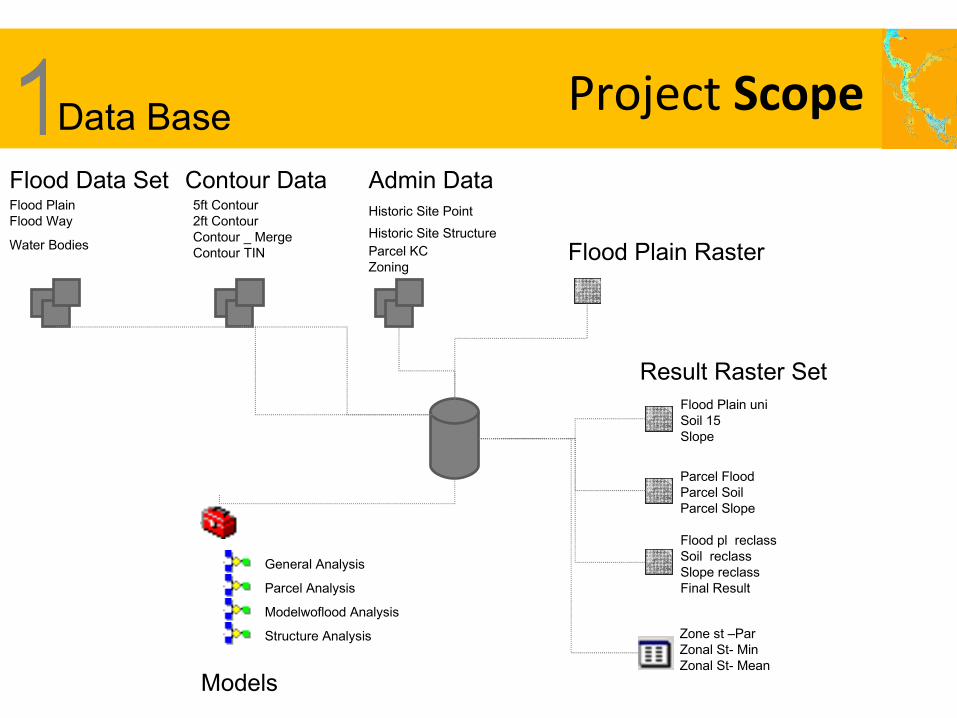
Project Scope Data Base 1Flood Data Set Flood Plain Flood Way
Water Bodies
Contour Data 5ft Contour 2ft Contour
Contour TINContour _ Merge
Historic Site Point
Historic Site Structure Parcel KCZoning
Admin Data
Models
Flood Plain Raster
General Analysis
Parcel Analysis
Modelwoflood Analysis
Structure Analysis
Result Raster Set
Parcel Flood Parcel Soil Parcel Slope
Flood Plain uniSoil 15Slope
Flood pl reclassSoil reclassSlope reclassFinal Result
Zone st –Par Zonal St- MinZonal St- Mean

Project Scope Digitization2A polygon shapefile replaced the existing point shapefile indicating the historic site, but not individual structure within the site.
The fields were decided on the bases of inventory documents provided for each site.
Point Feature Polygon Feature
Project Scope Matrix 3
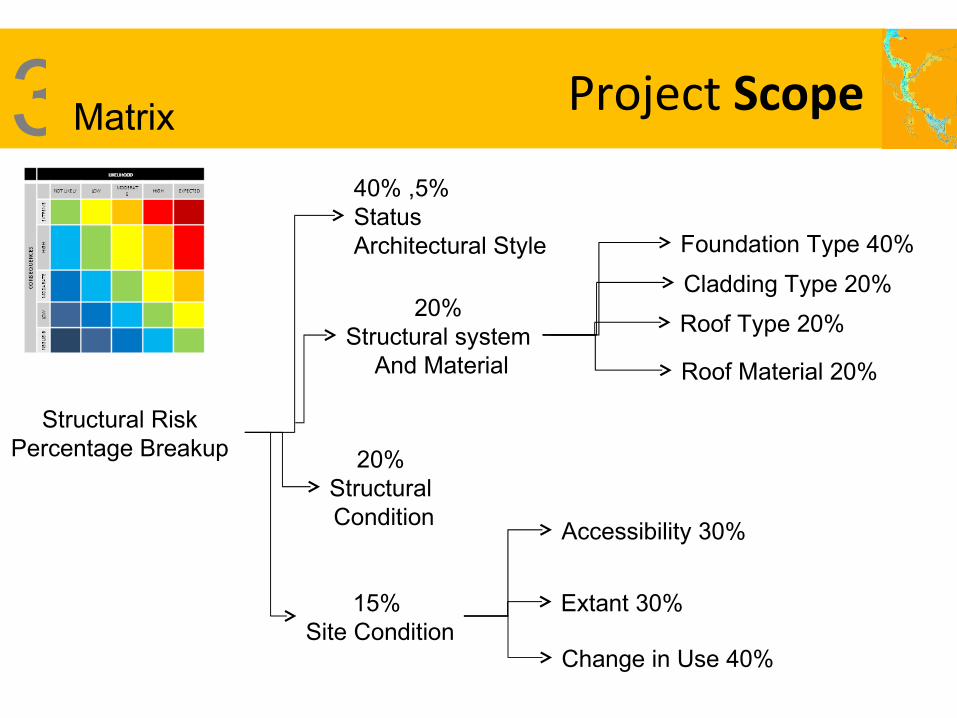
Structural Risk Percentage Breakup
40% ,5%StatusArchitectural Style
20% Structural system
And Material
20% Structural Condition
15% Site Condition
Foundation Type 40%
Cladding Type 20%
Roof Type 20%
Roof Material 20%
Accessibility 30%
Extant 30%
Change in Use 40%

Project Scope Matrix 3Structural Material and Construction Type 20 % Contribute Ranking ScoreFoundation Type (50%)Conc. Poured 1 10Post & Pier 2 20Conc. Block 3 30 Log 4 40 Stone 5 50
Cladding(30%)Stucco 1 6Brick, Stone 2 12Log, Hr.Wood siding, Rustic drop,Wood Shingles 3 18Board and Batten, Vertical Board, Asbestos/Asphalt 4 24Vinyl/Aluminium Siding,Metal 5 30
The Matrix was prepared based on the consequence and likelihood for each contributor,i.e. structural material (20%), This in turn provided a ranking defining the score of each sub-set i.e. foundation and cladding material.
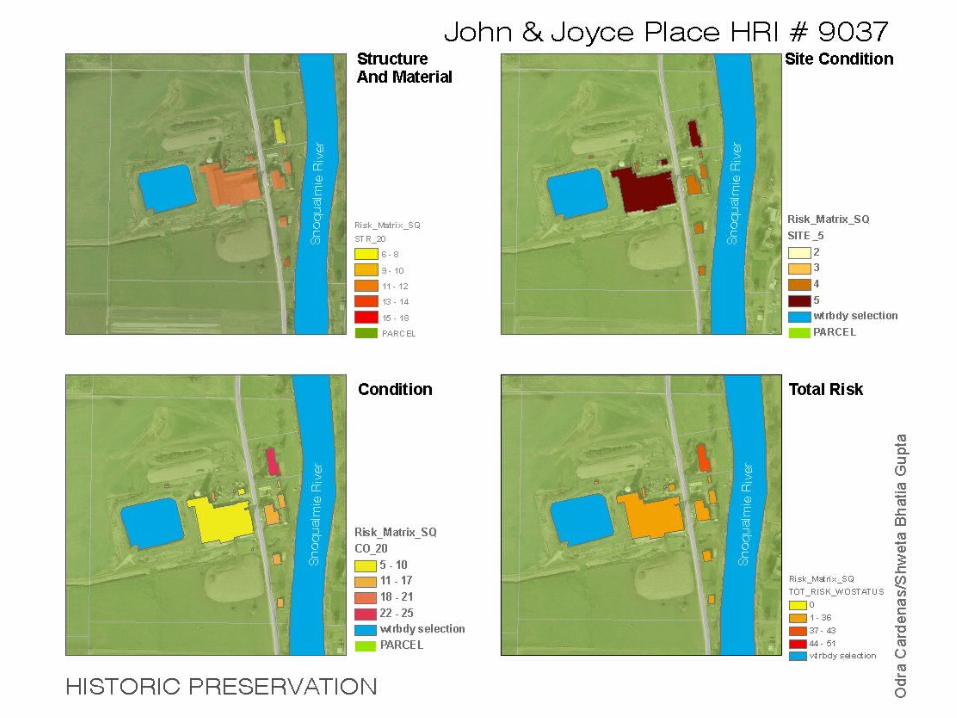

Project Scope Model4Mapped Results
Analysis Model With/without Floodplain consideration
Analysis Model At Parcel Level
Analysis Model At Structural Level
Mapped Results
Mapped Results

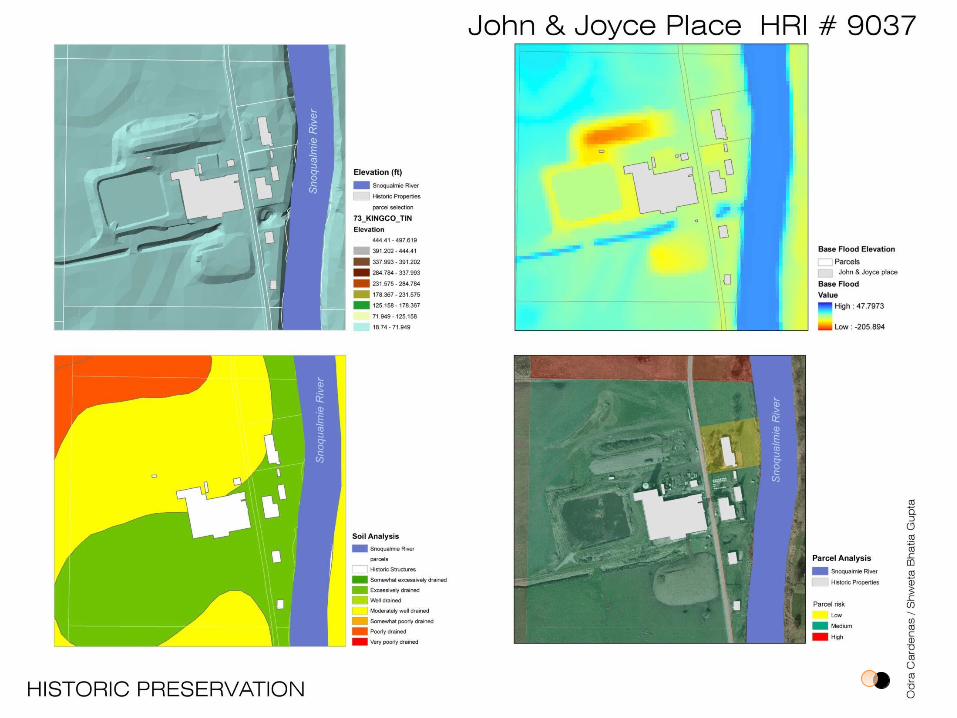
Detailed slope map Detailed soil map Detailed flood elevation map
Detailed results map
Back To Model

ResultsMaps5
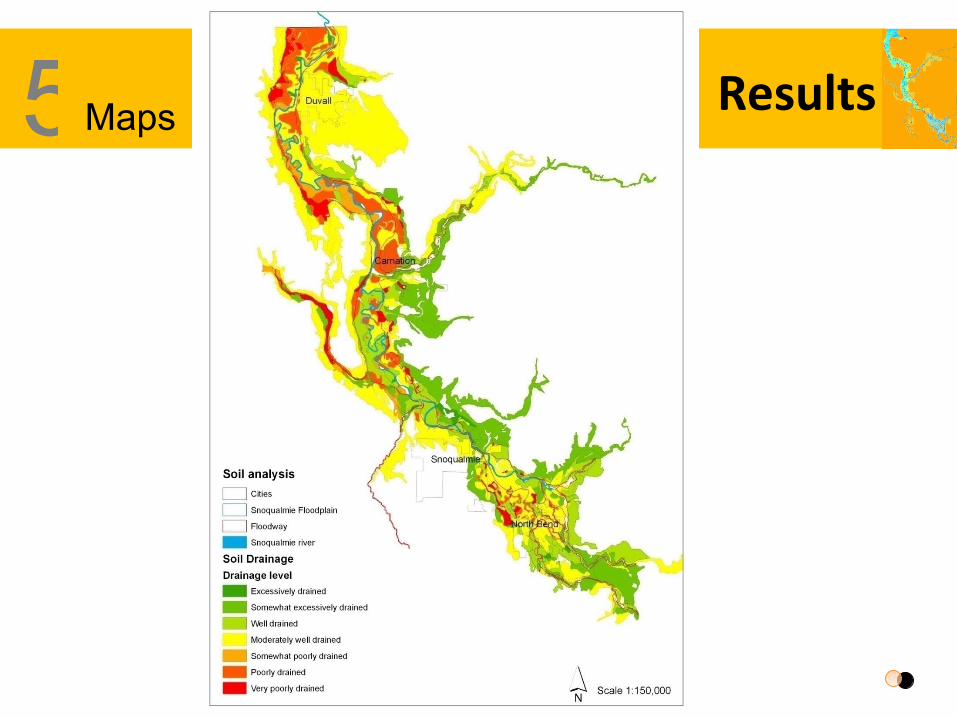
ResultsMaps5

ResultsMaps5
HEC2
HEC1

ResultsMaps5

Flood information HEC RAS
Model developed by the US Corps of EngineersHydrologic Engineering Center (HEC)River Analysis Systems (RAS)
TIN Flood elevation
Detailed survey informationUse of HEC RASReplicate information to verify data
HEC1

Flood information Geo RAS
HEC GeoRAS (extension for ArcMap) HEC2

Results Maps5John and Joyce Place HRI # 0937

Risk ImpactProb.
Mitigation Contingency
Field population must be done manually and is time consuming
High LowDistribute the work between
members. Reduce study area.
It is necessary to digitize polygons of the historic resources since they are currently in point form. To digitize we need reliable
aerial photographs.
High LowContact different resources to get
aerial photographs. Use the point dataset or parcel dataset,
but the results will be less accurate.
The results might not be significant Low HighTry to include a variety of historical
resources.
Talk to sponsor on the probability of this risk (the importance of the project resides
on the methodology and model, not so much on the results)
The sponsor shows little interest in the project.
Low HighConstant communication with the
sponsor.
The team will look for other sources of information aside the sponsor and will
make own decisions on the project.
Not finishing on time the phases of the critical path
Very High LowUse Microsoft Project.
Leave slack on the programmed activities.
Reduce study area.
Risk And Challenges

Risk And Challenges
Data Formats
Data Conversion
Data Generation
The Process
Keeping up with the Critical Path
Scale of the Analysis
Loosing a team mate !
Communication – Inside and Out
Combination: GIS – Other Tools High Data dependency: But better the data does not
guarantee better results
Data Verification
Importance of the Team……..
Lesson Learned
Top Related