


Languages
Pages
Legal


Risk analysis in information sys tems: A fuzzification of the MAGERIT methodology q
E. Vicente , A. Mateos, A. Jiménez-Martín
Decision Analysis and Statistics Group, Departamento de Inteligencia Artificial, Universidad Politécnica de Madrid, Campus de Montegancedo S/N, Boadilla del Monte, 28660 Madrid, Spain
a b s t r a c t
Several methodologies based on ISO/IEC 27000 international standard have been developed to deal with risk analysis in information systems (IS). These methodologies do not, however, consider imprecise val-uations, but use precise values on different, usually percentage, scales.
We propose an extension of the MAGERIT methodology based on classical fuzzy computational models. A linguistic term scale is used to represent asset values, their dependencies and frequency and asset deg-radation associated with threats. Computations are based on trapezoidal fuzzy numbers associated with linguistic terms. A similarity function is used to associate a linguistic term on the previously defined scale to the trapezoidal fuzzy numbers resulting from computations. Finally, regarding the selection of preven-tive safeguards to reduce risks in IS, we propose a dynamic programming-based method that incorpo-rates simulated annealing to tackle optimizations problems with the aim of minimizing costs while keeping the risk at acceptable levels.
An example of an administrative unit using in-house and third-party information systems internally and to provide public information services is used to illustrate the methodology.
1 . In t roduc t ion
Information systems (IS) are composed of a set of data management e lements designed to provide services and benefits in areas as far a part as public administration, industrial control, banking or geographical and weather information.
Technological developments and universal internet access have led to an increase in system vulnerabilities, since organizations have connected ISs to corporate and even public networks to which non-authorized personnel could have access unless appropriate action is taken. Besides, people within the organization have to be trained in and aware of IS support technology, as technology misuse can cause disastrous failures.
On top of these vulnerabilities caused by recent technological developments, there are other traditional issues, such as integrity facilities or the custody of not necessarily digital documents , on which new technologies have also had an impact. Therefore, ISs have to be analysed with a view to risk minimization by means of well-planned actions to protect information, processes and services from possible threats . Threats range from acts of terrorism, industrial espionage, etc. to a simple unintentional human error by an operator.
1685 and the Spanish Ministry of Science and Innovation Project MYTM2011-q The paper was supported by Madrid Regional Government Project S-2009/ESP-
28983-C03-03 Corresponding author. Tel.: +34 91 336 6596; fax: +34 91 352 4819.
E-mail addresses: [email protected] (E. Vicente), [email protected] (A. Mateos), [email protected] (A. Jiménez-Martín).
International s tandards establishing requirements for the certification of security information management systems (SIMS) originated in the BS 7799 security standard, proposed by the British Standards Institution (BSI). The first part of the standard (BS 7799-1), published in 1995, provided for the first t ime a set of best practices for managing the security of information to be used by any company or organization, whereas the second part (BS 7799-2) sets out SIMS requirements for certification by independent auditors.
In 1999, the ISO/IEC JTC 1 commit tee accepted the BS 7799-1 without major changes as ISO/IEC 17799, which was renumbered as ISO/IEC 27002 in 2005, whereas BS 7799-2 was adopted as ISO/IEC 27001 . This is the fundamental rule of all ISO/IEC 27000 standards, which in the number ranges 27,000–27,019 and 27,030–27,044 provide the security information management framework that underpins national or corporate adaptations, and different risk analysis and management methodologies for IS, respectively. Currently, both the ISO/IEC 27001 and ISO IEC

27002 are under review, and a n e w versions are expected to be published in 2013.
Quality management systems have traditionally used the plan-do-check-act cycle or continuous improvement model, which many international methodologies based on the ISO/IEC 27000 series have also tended to adopt. This model establishes a system of indicators and metrics that are comparable over t ime to quantify the organizational improvement progress and suggests a three-stage risk analysis and management methodology, see Fig. 1.
The planning stage establishes the necessary points for starting u p the project, defines objectives, and identifies participants and competencies. Risk analysis is the central part of SIMS and is included in the plan phase of the continuous improvement model. The purpose of risk identification is to determine the potential losses (impacts) that could occur in the organization if the threats to the IS components materialize, identifying such components (assets), as well as their relations (dependencies), the potential threats and their frequency and asset degradation levels. Finally, the risk management stage determines t he safeguards and s t ra tegies that reduce impact and risk.
The ISO/IEC 27000 [12,13] stipulations are adapted by each country leading to different methodologies, such as MAGERIT [16] (Ministerio de Administraciones Públicas, Spain), MEHARI [17] (Club de la Securit de l’Information Francais, France), CRAMM [8] (Central Computing and Telecommunications Agency, UK), OCTAVE and OCTAVE-S [1] (Carnegie Mellon University, USA) or NIST 800-30 [21] (National Institute of Standards and Technology, USA).
In Spain, the Consejo Superior de Administración Electrónica (Council for Electronic Administration) established the MAGERIT methodology (Methodology Analysis and Risk Management Information Systems) wi th the a im of deploying a common framework for risk analysis and management in IS on the basis of ISO/IEC 27000 standards. This methodology includes t he following milestones:
1. Identification and valuation of assets An asset is anything that is of value to the organization and therefore requires protection. A few data, information or business process assets often account for a total value of an organization’s assets. These assets are called terminal assets . Other assets (support assets such as hardware, software, personnel, and facilities) are valuable insofar as they are beneficial to the terminal assets, and they inherit the terminal asset value, according to the resulting benefit. Thus, support assets have no intrinsic value; they take their value from terminal assets. The identified assets of the organization are then valued. Some assets may have a monetary value (how much money the organization would lose if this asset s topped working), whereas others require a qualitative assessment (if an asset stops working the losses would be very high, low, medium, etc.).
Fig. 1. Risk analysis and management in information systems.
As mentioned above, the support assets inherit their values from terminal assets depending on how they influence each other. So, w e have to determine the dependency relationships of the terminal assets wi th respect to support assets, and also dependency relationships between support assets.
2 . Threat identification A threat is an event that can trigger an incident in the organization, causing damage or intangible material loss to assets. A threat may be of natural or human, accidental or deliberate origin. Some threats can affect more than one asset. In such cases, threats can cause different impacts depending on what assets are affected. A detailed list of threats is available in Annex C of ISO IEC 27005. MAGERIT suggests two threat assessment measures : degradation, the damage that the threat can cause to the asset, and frequency, how often the threat materializes.
3 . Identification and valuation of impact and risk indicators It is then necessary to qualitatively identify the consequences and establish impact and risk indicators for the valued assets and threats . The impact of a threat on an asset is the product of the asset value multiplied by the respective degradation. Risk is the product of the impact of the threat multiplied by the respective frequency.
4. Selection of safeguards Safeguards are measures for addressing threats . They can be procedures, personnel policies, technical solutions or physical security measures at the facilities. These safeguards can be preventive, if they reduce the frequency of threats ; or palliative, if they reduce the degradation of assets caused by threats [16].
The MAGERIT methodology provides two computational models : a quantitative model and an ordinal symbolic (qualitative) model. The quantitative model states precise values within the range [0,1] in order to measure magnitudes, whereas the qualitative model establishes an ordinal scale. In neither case is vague or imprecise information about the input parameters allowed. In our opinion, this is an important drawback of the methodology. Moreover, additional advantages could be gained using a classical fuzzy linguistic computational rather than the ordinal symbolic computational model provided by MAGERIT.
In this paper, w e propose an extension of t he methodology proposed by Vicente et al. [24], to adapt the MAGERIT methodology for risk analysis in IS to account for vague or imprecise information about t he input parameters on the basis of classical fuzzy linguistic computational models. A fuzzy linguistic t e rm scale is constructed to valuate the different risk analysis elements, the ari thmetic proposed by Xu et al. [32] based on trapezoidal fuzzy numbers is used to make computat ions and, finally, a similarity function is used to translate the resulting trapezoidal fuzzy numbers into a linguistic t e rm on the previously defined scale.
In Section 2, w e briefly introduce fuzzy computational models and describe the computational models included in the MAGERIT methodology and its drawbacks. Consequently, w e have decided to extend the MAGERIT computational model to solve these problems. Section 3 introduces the fuzzy extension of the MAGERIT methodology. First, w e review some operations on trapezoidal fuzzy numbers and introduce a fuzzy evaluation of asset dependencies. Second, w e provide a fuzzy five-component valuation of assets. Threats and asset risk impact indicators are then described. Then, w e introduce t he similarity function used to associate a linguistic t e rm from the previously defined set wi th t he resulting trapezoidal fuzzy numbers . Finally, w e tackle the selection of preventive safeguards to address threats . The methodology is illustrated in Section 4 using an example concerning an administration unit tha t uses its in-house and third-party ISs for internal operations and to provide public information services. Finally, some conclusions and future research are discussed in Section 5.

2. Fuzzy computational models and the MAGERIT methodology
Fuzzy logic introduced by Zadeh in 1965 [33] is a mathematical tool for modeling concepts using vague or imprecise measurements. This tool is especially interesting in computational models where experts are unable to give specific values to certain variables. Instead, it assigns linguistic terms of a previously defined scale from a total order.
For example, C = {l0 ~ VeryLow, l1 ss Low, l2 « Medium, l3 ~ High, l4 ~ VeryHigh} is a five-term linguistic scale in which we can imprecisely measure a given magnitude. The linguistic term scale must satisfy the following properties [10]:
1. There is a negation operator Neg(li) = lj such that j = n - i, where n is the cardinality of the linguistic scale.
2. There exists a total order li sg lj <^> i sg j .
These linguistic terms can be represented by functions fi •. 35 —> [0,1] to indicate the degree of membership of the value x e 35 to the corresponding linguistic term. This membership function is usually triangular, trapezoidal or Gaussian. For example, a normalized trapezoidal fuzzy number, which can be denoted by A = {a1,a2,a3,a4), has a membership function (see Fig. 2)
/eA x =
a 2 ^ 1 if a1 < x < a2
1 if a2 6 x 6 a3
a3-^4 if a3 < x < a4
0 otherwise
(1)
Two linguistic computational models can be used within fuzzy logic:
1. The classical linguistic computational model defines a fuzzy number arithmetic using operations with membership functions, as an extension of real arithmetic. These arithmetic operations on fuzzy numbers result in a new fuzzy number, which generally does not necessarily belong to the previously defined linguistic scale. Then, similarity measures of fuzzy numbers are used to decide which element on the scale is associated with the result of these operations. For examples of the classical linguistic computational model, see [31,4,6,27].
2. Ordinal symbolic computational models do not use membership functions, but identifies the given scale with an interval of length n - 1, where n is the cardinality of the linguistic scale, and make computations between linguistic terms whose results are real numbers in the associated interval:
cp •. {l0,.. .,ln_1}^^[0,n - 1], lii—><p(li) = i.
For example, {l0,... ,l4} ~ [0,4] c 35. Commonly used operators are the convex combination [10] (like the arithmetic or weighted average), minimum, maximum or the ordered weighted
aggregation (OWA), among others. As in the classical model, the real results of the operators may not belong to the linguistic scale, but one of the linguistic terms is associated with the result using an approximation function. The 2-tuple model [10] is an ordinal symbolic computational model designed to resolve the problem of discretizing the operation space on the linguistic term scale. The results of symbolic operations performed on the scale C = {l0,..., ln_1} ~ [0,n - 1] are given by tuple (li, a), where li is the linguistic term closest to the result and a e [-0.5,0.5) represents the distance to the term. For example, if an operation on the symbolic scale {l0,... ,l4} outputs the value 3.25, then that value is the tuple (l3,0.25). Then, we obtain the function
D: [ 0 , n - 1 ] - > £ x [-0.5,0.5), 0h->D(0) = (li,a),
with i = round(fl), the rounding operator, and a = /? - i. It is verified that D is bijective, and its inverse is D-1 (li, a) = i + a . This guarantees the preservation of information, however the 2-tuple method does not allow non-linear operators. Three linear operators are introduced in [10]: the arithmetic mean, the weighted average and the OWA operator, but it is not possible to multiply two linguistic terms in the 2-tuple symbolic model. The virtual language model [31] or the 2-tuples proportional model [27] propose other operators for the 2-tuple model, but they do not include the product of linguistic terms. Different applications of the 2-tuple model have been reported in the literature, such as [19] for multi-attribute decision-making under risk, [20] for security evaluation in computer networks, [20] in the educational field, [26] in market research or [2] in data mining. Two applications of the 2-tuple model to group decision-making can be found in [29,30].
There is a loss of information in both the classical and the symbolic models as a result of the approach to be performed either by the similarity function in the classical model or by using the approximation function in the symbolic model.
The MAGERIT methodology provides two computational models: a quantitative model and an ordinal symbolic (qualitative) model.
Quantitative model. This model directly measures each magnitude in the range [0,1] so that the minimum value corresponds to zero and the maximum to one. The main drawback of this model is that experts may find it difficult to assign precise values to the input parameters of the model, and the results are sensitive to these values.
Qualitative model. The ordinal symbolic model establishes an ordinal scale
<p V = {0,..., f n - 1 }~[0 ,n- 1].
The different risk magnitudes are measured on this scale, where V0 is a term under which the magnitude is considered negligible. The operators considered in this qualitative model are:
Fig. 2. Membership function.
1. max and min operators. 2. product by scalars in [0,1], which can represent magnitudes such
as the degradation associated with the materialization of a threat on an asset or the potential reduction of the impact of the threat thanks to a safeguard. For example, if a certain safeguard reduces impact vi by a%, then this impact is reduced to a level p=v ix (1 -100)^q>(Vi) x ( 1 - 1 0 0 ) = i x ( 1 - 1 0 0 ) e [0 ,n-1] .
As mentioned above, the result will not necessarily be a linguistic term on the given scale. In the MAGERIT methodology, a linguistic scale term is assigned to the result of these operators by rounding. This is computed in the example above as

4>: [ 0 , n - 1] —> {v 0, . . . , f„_1},
<£(/?) = round(fl) = roundli x (1 - 100 j j e [0, n - 1] n N
= {V0,...,Vn-1}.
For example, using the scale I>0,...,V4, let us assume that a threat implies an impact value v3 on an information asset and that the frequency of the threat is 0.4. Then, MAGERIT computes the risk associated with this threat on the asset as 0.4 x f3R±0.4x (p{v 3) = 0.4 x 3 = 1.2 and 4>{1.2) = t1.
This computational model has several drawbacks:
1. Some magnitudes, such as the degradation or the frequency of a threat, have to be assessed by means of precise percentages. Some operations, such as the product or the sum of linguistic terms, whose results may be outside the interval [0,n - 1], are prohibited. This may have unrealistic consequences for risk analysis. For example, if a threat has a very high impact, f4, and a frequency of 0.5, then the risk implied by this threat is v2 (medium), but, with this impact and frequency a risk is perceived to be very high. The problem is that a probability 0.5 is perceived as high in many real-life activities, particularly for activities that appear to be most important and have a major impact on our lives. Thus, it is not advisable to use the product by probabilities viewed as real numbers [0,1], as MAGERIT does.
2. A lot of information is lost through the rounding. Note that the function cp is not bijective.
3. Terms such as 0.5 x v 3 = 1.5 are somewhat ambiguous. We do not know whether this value should be assigned to t>1 or v2.
4. It does not take advantage of the properties associated with the membership function used in the classical model.
5. It needs symmetric and uniformly distributed linguistic terms scales.
Consequently, we have decided to extend the MAGERIT computational model from the classical linguistic fuzzy model perspective since it seems the better choice because it enables to model magnitudes using vague or imprecise measurements and because of the properties associated with the use of membership functions as well as because of drawbacks associated with ordinal symbolic computational models
Note that classical linguistic fuzzy models also result in a loss of information caused by the procedure enacted by the similarity function. However, the similarity function will not be applied until the end of the risk analysis of the IS, when a linguistic term is associated with the derived risk or impact fuzzy value, if required by the experts. In other words, unlike the ordinal symbolic model provided by MAGERIT, where the rounding operation is performed
after each computation, the trapezoidal fuzzy numbers output in the different computations (indirect dependences, etc.) will be propagated throughout the risk analysis stages in the risk analysis that we propose. Moreover, the similarity function is not used to select preventive safeguards. This constitutes a minor loss of information and, consequently, another advantage of the fuzzy extension that we propose.
3. Fuzzy extension of MAGERIT methodology
Let us consider the set of normalized trapezoidal fuzzy numbers with support in [0,1],IF[0,1], i.e. A = (a,b,c,d), with 0 < a < b < csgdsg1, together with a membership function /x~(x), see (1)
and Fig. 2. We use the following arithmetic proposed in [32] in IF[0,1]: If
A1 = (a1,i>1,C1,d1) and A2 = (a2,b2,C2,d2), then
A1 ©A2 = (a1 +a2-a1a2,b1 +b2 -b1b2,C1 + c2-C1C2,d1 + d2-d1d2),
A1 ®A2 = (a1a2,b1b2,C1C2,d1d2).
Both operations (© and <g>) are well defined. © and <g> are two internal composition laws in IF[0,1] that verify commutative and associative properties and have a neutral element.
3.1. Fuzzy valuation of dependencies
As cited in the introduction, the assets in IS are connected by dependency relationships, and a failure of one asset may affect other assets, forming an acyclic graph, as shown in Fig. 3.
Asset Aj depends on the asset A, (or A, influences A,), denoted by (Aj,Aj) (graphically A, —> A,), if a failure in asset A, causes a failure in the asset A, with any given probability. This probability is usually referred to as the degree of dependency of A, with respect to A, or the influence of A, over A,, which we denote by dd(Aj,A,).
Proposed IS risk analysis methodologies assign just a percentage to indicate the degree of dependency between two assets, and sometimes even propose the use of a Boolean value indicating whether or not this dependency exists regardless of the degree of dependency, see [16,17,8,1,21]. We propose the use of trapezoidal fuzzy numbers to represent these dependencies. Consequently,
dd(Aj,A,) e TF[0,1] and the experts can build a linguistic term set to intuitively define the dependency between two assets under uncertainty.
The dependency between assets in the dependency structure need not be direct but can be transitive. Namely, if (Aj,A,) and (AjjAj;), then (Aj,A )̂.
Fig. 3 . Asset dependencies structure in information systems.
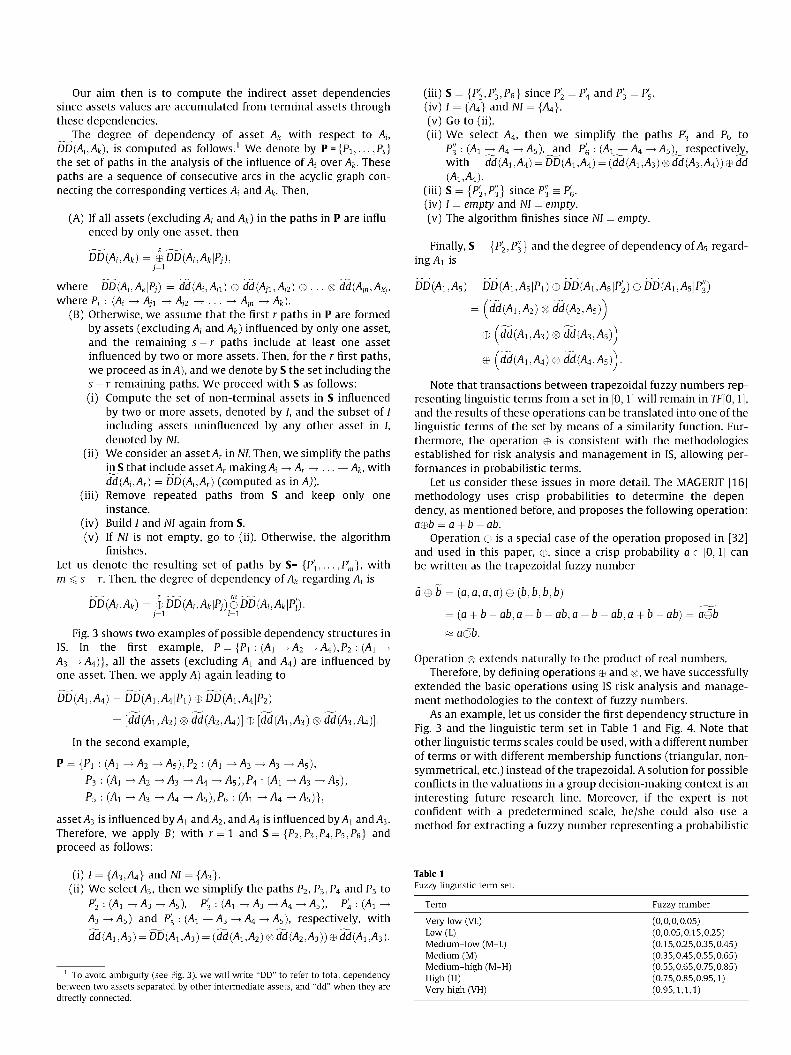
Our aim then is to compute the indirect asset dependencies since assets values are accumulated from terminal assets through these dependencies.
The degree of dependency of asset A with respect to A, DD{Ai,Ak), is computed as follows.1 We denote by P = {P1;... ,PS} the set of paths in the analysis of the influence of A over Ak. These paths are a sequence of consecutive arcs in the acyclic graph connecting the corresponding vertices A and Ak. Then,
(A) If all assets (excluding A, and A) in the paths in P are influenced by only one asset, then
P4 and P3 i 5 .
DD(A,,Ak) © DD(At,Ak\Pj),
where DD(A where P, : (A
Ak\Pj) = dd(At,Aj1) ® dd(Aj1,Aj2) ® . . . ® dd(A„A), A A A A).
(B) Otherwise, we assume that the first r paths in P are formed by assets (excluding A and A) influenced by only one asset, and the remaining s-r paths include at least one asset influenced by two or more assets. Then, for the r first paths, we proceed as in A), and we denote by S the set including the s-r remaining paths. We proceed with S as follows: (i) Compute the set of non-terminal assets in S influenced
by two or more assets, denoted by /, and the subset of / including assets uninfluenced by any other asset in /, denoted by M.
(ii) We consider an asset A in M. Then, we simplify the paths inS that include asset A making A —>A —> • • • —>A, with dd(A,A) = £>D(A,A) (computed as in A)).
(iii) Remove repeated paths from S and keep only one instance.
(iv) Build / and M again from S. (v) If M is not empty, go to (ii). Otherwise, the algorithm
finishes. Let us denote the resulting set of paths by S= {P\,... ,P'm}, with m sg s -r. Then, the degree of dependency of A regarding A is
DD(A,A) = ®DD(Ai,Ak\Pj)®DD(Ai,Ak\P'1). j=1 1=1
Fig. 3 shows two examples of possible dependency structures in IS. In the first example, P = {P1 : (A —> A2 —> A4),P2 : (A —> A —»A4)}, all the assets (excluding A and A4) are influenced by one asset. Then, we apply A) again leading to
DD(A A ) = DD(A,A4|P1) eDD(A,A4|P2)
= [dd(A A ) ffi dd(A2,A4)] ffi [dd(A,A3) ® dd(A A ) ] -
In the second example,
P = {P1 : (A —> A2 ^A5),P2 •. (A —> A2 —> A ^ A5),
P3 : (A —> A2 —* A3 —* A4 —> A5),P4 : (A —* A3 —*A5),
P5 : (A —> A —*A4 —*A5),P6 • (A —> A4 —*A5)},
asset A is influenced by A1 and A, and A is influenced by A1 and A . Therefore, we apply B) with r = 1 and S = {P2,P3,P4,P5,P6} and proceed as follows:
(iii) S = {P'2,P3,P6 since P2
(iv) / = {A} and NI = {A}. (v) Go to (ii). (ii) We select A4, then we simplify the paths P'3 and P6 to
P3': (A ^ A ^ A ) , _ a n d P'6 •. {A1^ A —»A ̂ respectively, with dd(A A ) = DD(A1 ,A4) = (dd(A A ) <S> dd(A3,A4)) © dd (AA).
(iii) S = {P'2,P3} since P"3 = P'6. (iv) / = empty and M = empty. (v) The algorithm finishes since M = empty.
Finally, S = {P'2,P3} and the degree of dependency of A regarding A1 is
D D ( A A ) = DD(A1,A5\P1) © DD(A1,A5\P'2) © DD(AA|P3 ')
= {dd(A1,A2)®dd(A2,A5)^
© (dd(A1,A) <8> dd(A A ) )
© (dd{A1,A4) © ddA)^5))-
Note that transactions between trapezoidal fuzzy numbers representing linguistic terms from a set in [0,1] will remain in TF[0,1], and the results of these operations can be translated into one of the linguistic terms of the set by means of a similarity function. Furthermore, the operation © is consistent with the methodologies established for risk analysis and management in IS, allowing performances in probabilistic terms.
Let us consider these issues in more detail. The MAGERIT [16] methodology uses crisp probabilities to determine the dependency, as mentioned before, and proposes the following operation: affib = a + b - ab.
Operation © is a special case of the operation proposed in [32] and used in this paper, ©, since a crisp probability a e [0,1] can be written as the trapezoidal fuzzy number
a ©fa = (a, a, a, a) © {b, b, b, b)
= (a + b - ab,a + b - ab,a + b - ab,a + b - ab) = a©b
~ affib.
Operation ® extends naturally to the product of real numbers. Therefore, by defining operations © and (g>, we have successfully
extended the basic operations using IS risk analysis and management methodologies to the context of fuzzy numbers.
As an example, let us consider the first dependency structure in Fig. 3 and the linguistic term set in Table 1 and Fig. 4. Note that other linguistic terms scales could be used, with a different number of terms or with different membership functions (triangular, nonsymmetrical, etc.) instead of the trapezoidal. A solution for possible conflicts in the valuations in a group decision-making context is an interesting future research line. Moreover, if the expert is not confident with a predetermined scale, he/she could also use a method for extracting a fuzzy number representing a probabilistic
(i) / = {A A } and M = {A}. (ii) We select A , then we simplify the paths P2, P3,P4 and P5 to
P2 : (A —>A3 —> A), P'3 A3 —> A ) and P5 •. (A —s
—> A3 —> A4 —> A) , P'4 : (A —> A ^ A ) , respectively, with
dd (A,A) = 55(A A ) = (dd (A,A) ® dd (A,A)) © dd(A A ) .
• (A
A
1 To avoid ambiguity (see Fig. 3), we will write ‘‘DD’’ to refer to total dependency between two assets separated by other intermediate assets, and ‘‘dd’’ when they are directly connected.
Table 1 Fuzzy linguistic term set.
Term Fuzzy number
Very low (VL) Low (L) Medium–low (M–L) Medium (M) Medium–high (M–H) High (H) Very high (VH)
(0,0,0,0.05) (0,0.05,0.15,0.25) (0.15,0.25,0.35,0.45) (0.35,0.45,0.55,0.65) (0.55,0.65,0.75,0.85) (0.75,0.85,0.95,1) (0.95,1,1,1)

Fig. 4. A seven-member linguistic term set.
judgment for each event, such as the one based on bettings and lotteries proposed in [25], which accounts for a group context, because individual conflicting views or judgments can be captured through imprecise responses.
On the other hand, experts have assigned the influences shown in Table 2. Then, the degree of dependency of A1 with respect to A4 is
DD(A1,A4) = \dd(A1,A2) ® dd(A2,A4)\ © \dd(A1,A3) ® dd(A3,A4)\
= [H®M]ffi[M—H<g>M] = (0.404,0.563,0.719,0.843).
3.2. Fuzzy valuation of assets
MAGERIT defines the value of an asset as the losses that would be sustained if the respective asset is no longer available. These can be losses of money, user confidence, the organizational prestige, etc. Assets are usually evaluated taking into account the following five components [16]:
• Confidentiality. How much damage would it cause if the asset is disclosed to someone it should not be? This is a typical data inspection.
• Integrity. How much damage would it cause if the asset is damaged or corrupt? This is a typical data inspection. Data can be manipulated, be wholly or partially false, or even missing.
• Authenticity. How much damage would it cause if we do not exactly know who has done what? This is a typical services (user authentication) and data (authenticity of the person accessing data to write or read) inspection.
• Traceability. How much damage would it cause if it is not known for whom the service is being provided?, i.e. who does what and when? How much damage would it cause if it is not known who accessed what data and what they did with them?
• Availability. How much damage would it cause if the asset is not available or cannot be used? This is a typical services inspection.
Only the terminal assets have an associated value for the above components. The other assets accumulate value from terminal assets on the basis of dependency relationships. We again use the set of linguistic terms that represent trapezoidal fuzzy numbers to represent uncertainty when valuating the terminal assets.
Let us denote assets by Vj = (Vj1,Vj2,Vj3,Vj4,Vj{5)), where Djm is a linguistic term assigned by an expert for the rth value component in asset Aj. If we denote by TAS the terminal asset set, then the value of asset Aj with respect to terminal assets is:
Table 2 Fuzzy degrees of dependency.
Influence
A1 —»A2
A2 —»A4
A1 —»A3
A3 —»A4
Term
High Medium Medium-High Medium
Fuzzy number
(0.75,0.85,0.95,1) (0.35,0.45,0.55,0.65) (0.55,0.65,0.75,0.85) (0.35,0.45,0.55,0.65)
%=£WD D(4A)®%)- (2) Note that the sums in the above expression are computed as fol
lows: A1 + A2 = (<31 +a2,b1 +b2,C1 +c2,d1 +d2).
3.3. Threats
A threat is an event that can trigger an incident in our organization, causing damage or intangible material loss to the assets, and an attack is any deliberate action aimed at violating the IS security mechanisms.
Once assets have been valuated, the next step in the risk analysis methodology is to assess threats and estimate indicators of the impact on and risk to assets. MAGERIT suggests two threat assessment measures: degradation, the damage that the threat can cause to the asset; and frequency, how often the threat materializes.
We will again use fuzzy linguistic terms rather than percentages and probabilities to represent degradation and frequency. A
threat is a vector T = (D,f) whose components are degradation and frequency. A degradation has to be established for each of the five asset components described in the Section 3.
Let us consider a threat on asset Aj whose degradation in each component is given by the vector
D = (d 1,d 2,d 3 , d 4,d 5 ) ,
i.e., the threat T causes a degradation d, in the !th component of the
asset. When the threat is realized, each component is affected by the
expression
where /,- is the impact on the rth component of the attacked asset (Aj).
We use (3) below to compute the risk to the asset
%)=X(i)®7- (3)
After computing the impact caused by a materialized threat on an asset, we can compute the impact transmitted from the attacked asset to its dependent assets. If A, is the asset on which the threat has materialized and the degree of dependency of Aj with respect to Ak is DD(Ak,Aj), then the attack on asset Aj has an impact on Ak of Ik = DD(Ak,Aj) <g> d, <g> Vj . Thus, the risk to asset Ak is
Rklfi =h{!) ®J = DD(Ak,Aj) <8) d, <8) Vj{!) ®J.
3.4. Similarity function
A similarity function is required to associate the resulting trapezoidal fuzzy number with an element in the linguistic term set. This function can also be used at any step of the methodology to derive the linguistic terms associated with the respective trapezoidal fuzzy numbers output to represent dependencies, accumulated values, etc.
Several authors have proposed different similarity functions, which are based on the centroid of a fuzzy number and the distance between the components of the fuzzy numbers in TF[0,1], [4,15,11,5,6,28,9]. A similarity function was proposed and 30 sets of linguistic value trapezoidal fuzzy numbers were used to compare the calculation results with other previously proposed functions in [7]. Finally, a more recent similarity function was proposed in [32] and compared with the proposal reported in [7].

However, the above similarity functions are unsuitable for use in TF[0,1]. We use the function proposed in [22,23], which considers another parameter consisting of the ratio between the common area and the joint area under the membership functions of trapezoidal fuzzy numbers [22,23].
Given A = (a1,a2,a3,a4) and B = {b1,b2,b3,b4) eTF[0,1], the similarity function can be defined as
if max{(a4 - a1), {b4 - b1)}^0, then
S(A, B) = 1 - (1 - a - /J) x 1 - 0 ^ n l ^ |
J0 ^ j W a x J
V) a,- - bA „ A' A' B' B V- P T 7
4 M
• otherwise,
S(A,B) = 1 1 - (X
a Ela.'-b.'l
2 4
M
where a + ji < 1, \i~ is the membership function of %,
M = max {d((x,y),(x',y'))}, [0,1] x 0 1
2
u—(x) = min{u~(x), «~(x)j, r AnB v ' 0 < « 1 L r A v ; " B V '"
U~ ~(X) r AuBv '
max{u~(x), «~(x)j,
(X~, Y~), (X~, Y~) are the centroids of A and B, respectively, and d is a distance in 9l2.
The use of this similarity measure is justified in [22,23]. Suffice
is to say that S(A,B) e [0,1], S(A,B) =S(B,A), S(A,B) = 1 if and
only if A = B, and S(/1,B) = 0 if and only if A = (0,0,0,0) and B = (1,1,1,1).
Looking at the first example in Fig. 3, the degree of dependency ofA4 with respect toA1 was computed in Section 2, leading to the trapezoidal fuzzy number (0.404,0.563,0.719,0.843), see Fig. 5. Applying the similarity function with equal weights for all three components the degree of dependency of A4 with respect to A1 is Medium-High (similarity 0.8081).
3.5. Preventive safeguards
Safeguards are measures for addressing threats. They can be procedures, such as incident management and documentation, personnel policies, technical solutions, or physical security measures at the facilities.
These safeguards can be preventive, if they reduce the frequency of threats; or palliative, if they reduce the degradation of assets caused by threats [16]. As the degree of dependency between two assets is the failure transmission probability, a special type of preventive safeguard is one that reduces dependencies between support and terminal assets.
The effect induced by a safeguard on the failure transmission probability between two assets Au and Av can also be defined as a linguistic term, which is represented by a fuzzy number e e TF[0,1]. So if the degree of direct dependency between the assets Au and Av is dd{Au,Av), then, when we implement a safeguard with effect e, the degree of direct dependency is reduced to
dd{Au,Av) s (T e e ) ,
where e denotes the usual subtraction operation between trapezoidal fuzzy numbers, i.e., {a1,a2,a3,a4) e (b1,b2,b3,b4) = (a1 - b4, a2 — f?3,fl3 — b2,a4 — b1).
We consider the set of safeguards that block direct failure transmission between Au and Av,SU,v. Each safeguard Su
fv e Su,v has a
monetary cost c^v and an effect e^v on dd{Au,Av). The problem of keeping the failure transmission probabilities
among support and terminal assets at an acceptable level with minimal costs can be represented as:
min
s.t.
cup ;v x u p ;
v
(4) DD(A{,A]i) ^ Ufa Vi, k
xu/ e {0,1 }W,v,p,
where i and k in the first set of constraints refer to non-terminal and
terminal assets, respectively, Uik is a residual value accepted by the
experts, xjj>v are the decision variables (xjj>v = 1 means that safe
guard SUp v is selected), and DD{At,Ak) is reassessed replacing values
dd{Au,Av) by the affected values regarding the selected safeguards:
dd{Au,Av) ig, <8)(1 p
Fig. 5. Fuzzy number (0.404,0.563,0.719, 0.843).
where Au and Av are two consecutive assets connected by an arc in some path between At and Ak.
Note that the fact that the usual order in TF[0,1] is a partial order constitutes a very restrictive constraint in our optimization problem, so we will use the similarity function, S, introduced in the previous section, to relax this constraint. ^ ^
If we define a threshold a e [0,1], the constraint DD{Ai,Ak) sg Uik \/i,k can be replaced by S{DD{At,Ak), Uik) P a in (4). Thus, the restrictiveness of the constraint increases proportionally to the threshold value and the feasible solution set will be composed of solutions that verify these softened/relaxed constraints.
Remember that indirect dependencies are recursively computed following the algorithm described in Section 3.1. Thus, the degree of dependency of the support assets further away from the terminals can be computed from the degree of dependency of the closest assets. Therefore, the problem can be solved in a stage-wise manner, and observes the principle of optimality as required in dynamic programming: given an optimal sequence of decisions, every subsequence is, in turn, optimal. Then, we proceed as follows:
• Let L0 be the set of terminal assets. Identify safeguards that minimize costs keeping the degrees of dependency between assets in L0 at an acceptable level.
• Consider L1 including support assets whose children belong to L0 only. Identify safeguards that minimize costs keeping the degrees of dependency on their children at an acceptable level.
• Consider L2 including support assets whose children belong to L0 u L1 only. Identify safeguards that minimize costs keeping the degrees of dependency over L0 under an

acceptable level. Note that the degrees of indirect dependency from the children of L2 to terminal assets have already been computed in the previous stage, so we just need to identify the direct degree of dependency on assets in L0 u L1.
• Consider Li including support assets whose children belong to L0 U L1 U ... U Li_1 only. Identify safeguards that minimize costs keeping the degrees of dependency on L0 under an acceptable level. Note that again we just need to identify the direct degree of dependency on assets of L0 u . . . u Li_1.
Simulated annealing (SA) [14,3] is applied in each step of the algorithm to derive the optimal selection of safeguards from optimization problems in (4).
The basic idea of SA is as follows. An initial feasible solution is randomly generated. In each iteration a new solution is randomly generated from the neighborhood of the current solution. If the new solution is better than the current one, then the algorithm moves to that solution, otherwise there is some probability of a movement to the new solution. Accepting worse solutions allows for a more extensive search for the optimal solution and avoids trapping in local optima in early iterations.
The probability of accepting a worse movement is a function of both a temperature factor (t) and the change in the cost function. The initial value of t is high, which leads to a diversified search, since practically all movements are allowed. As t decreases, the probability of accepting a worse movement falls. If t is zero, then only better movements will be accepted, which makes SA work like hill climbing.
4. An illustrative example
We consider an administrative unit that uses in-house and third-party information systems internally to provide public information services (electronic government) [16]. Alarmed by potential security threats existing in the internet and taking into account that a service failure would cause serious damage to the unit’s operation and prestige, a risk analysis and management project was launched.
The project scope was confined to the personal and remote electronic processing service, as well as the security of the information handled. With regard to the equipment, both machine and communications networks were analysed.
The service was provided by a computer database application accessed via a local user identification that controls access privileges. The processing includes a request (and data entry) phase and a response (and data delivery) phase. Users make their request and await a notification to collect the reply. The notification was sent by registered mail in the case of personal processing, and by email in the case of remote processing.
A centralised archive and document recovery service was provided by an intranet. Users accessed it through a local Web interface that connects via a private virtual network with a remote server, with users identified by their identity card number. This service was only available to the unit personnel and to the virtual employee who provides the remote formality service.
The unit had various PCs on its premises. The equipment had no removable media of any type: diskette, CD, DVD, USB, etc., and a medium-sized, general-purpose server was available as file, electronic mail, database and web server.
A local area network was available with an ADSL internet connection via a firewall that limited the communication. Remote processing, e-mail, information access and a private virtual network with the central archive services were provided via the internet connection.
A risk analysis stage revealed t he assets and the asset dependencies shown in Fig. 6. A more detailed description of this stage is provided in [16], where t he MAGERIT methodology is used to analyse the problem. Therefore, Boolean values were originally used to indicate whether or not any dependencies existed regardless of the degree of dependency. The computations were m a d e using PILAR [18] software that implements t he MAGERIT methodology.
The following 1 1 assets were considered: processing in person (presential-proc), remote processing (remote-proc), current files (current-f), e-mail (mail), central historical archive (archive), processing of files (files-proc), work stations (wrk-stat), server (server), firewall (firewall), local network (LAN), and internet connection (internet). Note that three out of the eight assets were terminal : current files, processing in person and remote processing.
Following the methodology proposed in this paper, we first consider the set of linguistic te rms wi th their respective trapezoidal fuzzy numbers shown in Table 1 and Fig. 4 . Next, experts give linguistic te rms to express the influences be tween IS assets, see Fig. 6. Note that only two dependencies are high, (server, archive) and (server, current-f), while two are medium-high (internet, archive) and (archive, current-f).
Then, we compute the degree of asset dependency on terminal assets. First, the degree of dependency for assets that directly influence terminal assets is immediate, see Table 3 . Table 4 shows computat ions to derive t he firewall, internet and server dependencies wi th respect to the three terminal assets, whereas Table 5 shows the resulting dependencies of non-terminal wi th respect to the three terminal assets.
Next, experts assign linguistic t e rms for each terminal asset component, see Table 6. Note that authenticity and traceability have been split into two new components in this example each, corresponding to data and services, respectively. Consequently, seven components will be considered for each asset, tha t is, confidentiality (Confid.), integrity (Integr.), data authenticity (D. Aut.), service
Fig. 6. Asset dependencies in an IS.
Table 3 Immediate dependency degree computation.
files-proc archive email wrk-stat LAN
presential-proc
M«iL
M-H®L
LigiL
M«iL
M-L«iL
current-f
M M-H L M M-L
remote-proc
M«iM
M - H ® M
L«iM
M«iM
M-L«iM
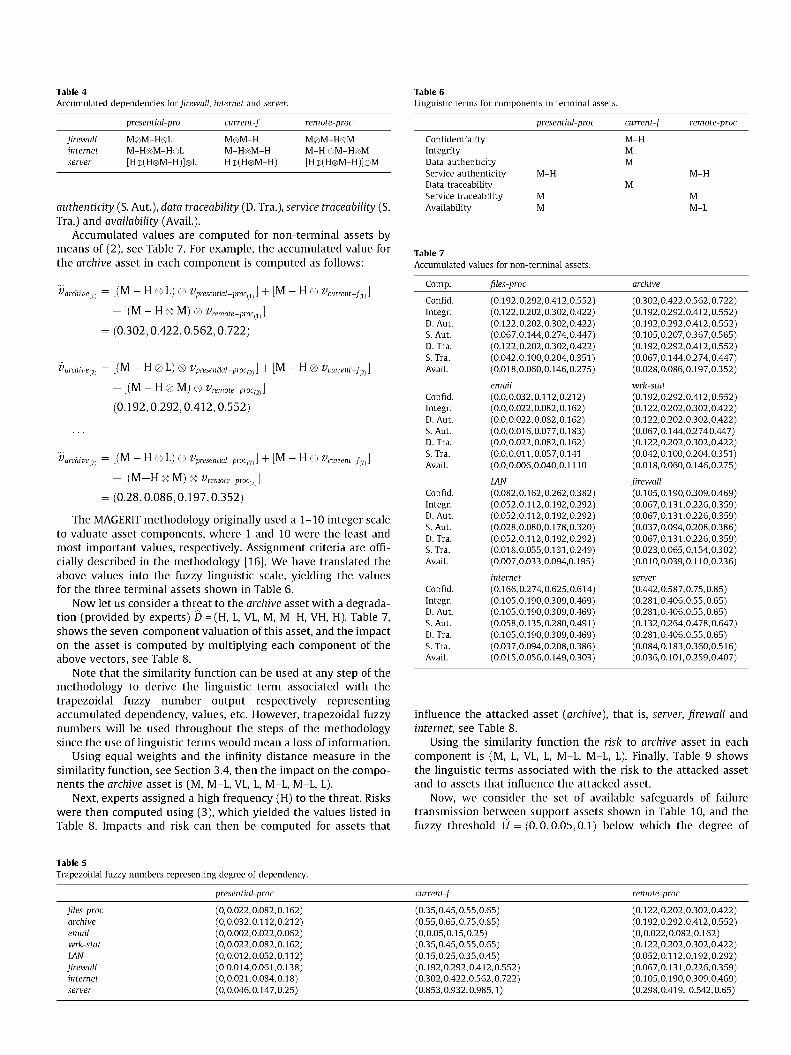
Table 4 Accumulated dependencies for firewall, internet and server.
presential-pro current-f remote-proc
firewall internet
M«iM-H«iL M-H®M-H«iL [He(H®M-H)]®L
M®M-H M-H8M-H He(H«iM-H)
M«iM-H«iM M-H ®M-H«iM [He(H«iM-H)]«iM
authenticity (S. Aut.), data traceability (D. Tra.), service traceability (S. Tra.) and availability (Avail.).
Accumulated values are computed for non-terminal assets by means of (2), see Table 7. For example, the accumulated value for the archive asset in each component is computed as follows:
Varchive1 = [(M - H g> L) g> Vpresential-proc(1} + [M - H g> VcurrenH{1]\
+ [ (M-H®M)®* r e m o t e _ p r o c ( 1 ) ]
= (0:302;0:422;0:562;0:722)
Varchivel2) = [(M - H g> L) g> Vpresential-proc2 ] + [M - H g) Vcurrent-f2 ]
+ [ (M-H®M)®z r e m o t e _ p r o c ( 2 ) ]
= (0:192;0:292;0:412;0:552)
Varchive7 = [(M - H g) L) g) Vpresential-proc7] + [M - H g) Vcurrent-f7]
+ [(M-H®M)®zremote_proc(7)]
= (0:28;0:086;0:197;0:352)
The MAGERIT methodology originally used a 1-10 integer scale to valuate asset components, where 1 and 10 were the least and most important values, respectively. Assignment criteria are officially described in the methodology [16]. We have translated the above values into the fuzzy linguistic scale, yielding the values for the three terminal assets shown in Table 6.
Now let us consider a threat to the archive asset with a degradation (provided by experts) D = (H, L, VL, M, M-H, VH, H). Table 7, shows the seven-component valuation of this asset, and the impact on the asset is computed by multiplying each component of the above vectors, see Table 8.
Note that the similarity function can be used at any step of the methodology to derive the linguistic term associated with the trapezoidal fuzzy number output respectively representing accumulated dependency, values, etc. However, trapezoidal fuzzy numbers will be used throughout the steps of the methodology since the use of linguistic terms would mean a loss of information.
Using equal weights and the infinity distance measure in the similarity function, see Section 3.4, then the impact on the components the archive asset is (M, M-L, VL, L, M-L, M-L, L).
Next, experts assigned a high frequency (H) to the threat. Risks were then computed using (3), which yielded the values listed in Table 8. Impacts and risk can then be computed for assets that
Table 6 Linguistic terms for components in terminal assets.
presential-proc current-f remote-proc
Confidentiality Integrity Data authenticity Service authenticity Data traceability Service traceability Availability
M-H
M M
M-H M M
M M-H
M M-L
Table 7 Accumulated values for non-terminal assets.
Comp. files-proc archive
Confid. Integr. D. Aut. S. Aut. D. Tra. S. Tra. Avail.
Confid. Integr. D. Aut. S. Aut. D. Tra. S. Tra. Avail.
Confid. Integr. D. Aut. S. Aut. D. Tra. S. Tra. Avail.
Confid. Integr. D. Aut. S. Aut. D. Tra. S. Tra. Avail.
(0.192,0.292,0.412,0.552) (0.122,0.202,0.302,0.422) (0.122,0.202,0.302,0.422) (0.067,0.144,0.274,0.447) (0.122,0.202,0.302,0.422) (0.042,0.100,0.204,0.351) (0.018,0.060,0.146,0.275)
email (0.0,0.032,0.112,0.212) (0.0,0.022,0.082,0.162) (0.0,0.022,0.082,0.162) (0.0,0.016,0.077,0.183) (0.0,0.022,0.082,0.162) (0.0,0.011,0.057,0.141 (0.0,0.006,0.040,0.1110
LAN (0.082,0.162,0.262,0.382) (0.052,0.112,0.192,0.292) (0.052,0.112,0.192,0.292) (0.028,0.080,0.178,0.320) (0.052,0.112,0.192,0.292) (0.018,0.055,0.131,0.249) (0.007,0.033,0.094,0.195)
internet (0.166,0.274,0.625,0.614) (0.105,0.190,0.309,0.469) (0.105,0.190,0.309,0.469) (0.058,0.135,0.280,0.491) (0.105,0.190,0.309,0.469) (0.037,0.094,0.208,0.386) (0.015,0.056,0.149,0.303)
(0.302,0.422,0.562,0.722) (0.192,0.292,0.412,0.552) (0.192,0.292,0.412,0.552) (0.105,0.207,0.367,0.565) (0.192,0.292,0.412,0.552) (0.067,0.144,0.274,0.447) (0.028,0.086,0.197,0.352)
wrk-stat (0.192,0.292,0.412,0.552) (0.122,0.202,0.302,0.422) (0.122,0.202,0.302,0.422) (0.067,0.144,0.2740.447) (0.122,0.202,0.302,0.422) (0.042,0.100,0.204,0.351) (0.018,0.060,0.146,0.275)
firewall (0.105,0.190,0.309,0.469) (0.067,0.131,0.226,0.359) (0.067,0.131,0.226,0.359) (0.037,0.094,0.208,0.386) (0.067,0.131,0.226,0.359) (0.023,0.065,0.154,0.302) (0.010,0.039,0.110,0.236)
server (0.442,0.587,0.75,0.85) (0.281,0.406,0.55,0.65) (0.281,0.406,0.55,0.65) (0.132,0.264,0.478,0.647) (0.281,0.406,0.55,0.65) (0.084,0.183,0.360,0.516) (0.036,0.101,0.259,0.407)
influence the attacked asset (archive), that is, server, firewall and internet, see Table 8.
Using the similarity function the risk to archive asset in each component is (M, L, VL, L, M-L, M-L, L). Finally, Table 9 shows the linguistic terms associated with the risk to the attacked asset and to assets that influence the attacked asset.
Now, we consider the set of available safeguards of failure transmission between support assets shown in Table 10, and the fuzzy threshold U = (0;0;0:05;0:1) below which the degree of
Table 5 Trapezoidal fuzzy numbers representing degree of dependency.
presential-proc current-f remote-proc
files-proc archive email wrk-stat LAN firewall internet
(0,0.022,0.082,0.162) (0,0.032,0.112,0.212) (0,0.002,0.022,0.062) (0,0.022,0.082,0.162) (0,0.012,0.052,0.112) (0 0.014,0.061,0.138) (0,0.021,0.084,0.18) (0,0.046,0.147,0.25)
(0.35,0.45,0.55,0.65) (0.55,0.65,0.75,0.85) (0,0.05,0.15,0.25) (0.35,0.45,0.55,0.65) (0.15,0.25,0.35,0.45) (0.192,0.292,0.412,0.552) (0.302,0.422,0.562,0.722) (0.853,0.932,0.985,1)
(0.122,0.202,0.302,0.422) (0.192,0.292,0.412,0.552) (0,0.022,0.082,0.162) (0.122,0.202,0.302,0.422) (0.052,0.112,0.192,0.292) (0.067,0.131,0.226,0.359) (0.105,0.190,0.309,0.469) (0.298,0.419, 0.542,0.65)
server
server

Table 8 Impacts on and risks to archive, server, firewall and internet assets.
Table 10 Available safeguards.
Comp. Impact (archive) Risk (archive)
Confid. (0.227, 0.359,0.534,0.722) Integr. (0,0.015,0.062,0.138) D. Aut. (0,0,0,0.028) S. Aut. (0.037,0.093,0.202,0.367) D. Tra. (0.106,0.190,0.309,0.469) S. Tra. (0.064,0.144,0.275,0.448) Avail. (0.022,0.074,0.187, 0.352)
Impact (server) Confid. (0.283, 0.465,0.702,0.85) Integr. (0,0.019,0.081,0.162) D. Aut. (0,0,0,0.0325) S. Aut. (0.040,0.111,0.259, 0.421) D. Tra. (0.132, 0.247,0.407,0.552) S. Tra. (0.068,0.171,0.355,0.516) Avail. (0.023,0.081,0.243, 0.407)
Impact (firewall) Confid. (0.028,0.073,0.1612,0.305) Integr. (0,0.002,0.019,0.058) D. Aut. (0,0,0,0.012) S. Aut. (0.005,0.019,0.063,0.163) D. Tra. (0.013,0.038,0.094,0.198) S. Tra. (0.008,0.029,0.085,0.196) Avail. (0.003,0.015,0.058,0.154)
Impact (internet) Confid. (0.069,0.152, 0.301, 0.522) Integr. (0,0.006,0.035,0.1) D. Aut. (0,0,0,0.02) S. Aut. (0.011,0.04,0.116,0.272) D. Tra. (0.032,0.080,0.174,0.339) S. Tra. (0.019,0.061,0.156, 0.329) Avail. (0.007,0.031,0.107,0.258)
(0.170, 0.305,0.508, 0.722) (0,0.012, 0.059,0.138) (0,0,0,0.028) (0.028, 0.079,0.192,0.367) (0.079, 0.162,0.294,0.470) (0.048, 0.123,0.261,0.448) (0.016, 0.063,0.178,0.352)
Risk (server) (0.212,0.396,0.667,0.85) (0,0.016, 0.077,0.162) (0,0,0,0.032) (0.030,0.094,0.246, 0.421) (0.099, 0.201,0.386,0.552) (0.051, 0.145,0.337,0.516) (0.017, 0.069,0.230, 0.407)
Risk (firewall) (0.021, 0.062,0.154,0.305) (0,0.002,0.018,0.058) (0,0,0,0.012) (0.003,0.016,0.06,0.163) (0.010,0.033,0.089,0.198) (0.006,0.025,0.081,0.196) (0.002,0.013,0.055,0.154)
Risk (internet) (0.051, 0.129,0.286,0.522) (0,0.005,0.033,0.01) (0,0,0,0.02) (0.008,0.034,0.11, 0.272) (0.024, 0.068,0.165,0.339) (0.015, 0.052,0.149,0.329) (0.005,0.027,0.101,0.258)
Table 9 Linguistic terms for risks to assets.
Component
Confidentiality Integrity Data authenticity Service authenticity Data traceability Service traceability Availability
archive
M L VL L M-L M-L L
firewall
L VL VL L L L L
internet
M-L VL VL L L L L
server
M L VL L M-L M-L L
dependency between all assets and terminal assets will be acceptable, and let a = 0.95.
Dynamic programming is then executed as follows. Stage 0: L0 = {presential-proc (Ai), remote-proc (A2), current-/
(A3)}, since there are three terminal assets in the IS. We identify
safeguards for (A3) that minimize costs keeping the degrees of
dependency on (Ai) and (A2) at acceptable levels, S{DD{A3,Ai),
U) P 0.95 and S{DD{A3,A2), U) P 0.95, respectively.
Regarding asset A3, solutions are represented by the vector
X3-1 = (x3 , 1 , . . . jXg-1), see Table 10, where x3-1 = 1 if the safeguard
S3;1 is selected. x3;2 (x3-2, p — V"i ,xfo) 's considered for asset A2. Both safeguards sets are independently selected by solving the following optimization problems:
J , l 3 , l min Cj' Xj' + . . . + CJQXJQ min Cj-x^' + ... + c s.t. s.t.
S(DD(A3,Ai), U) P 0.95 S(DD(A3,A2), U) P 0.95
x31 e {0,l},p = 1, . . . ,8 x3,2 e {0,l},q = 1, . . . ,10
The optimal solution output by using simulated annealing and the associated costs are x31* = (0,0,1,0,0,0,0,1) and
Asset Safeguards (Tag (Sup ;v ), effect (eu
p ;v ), cost (cu
p ;v ))
current-f
files-proc
firewall
internet
S3'1: {(S}'\M,250),(Sf'\L,120),(S|'\L,100), (SJ1,M-L, 179),
(S3/1,M,225),(S3'1,M-L160),(S3'1,L,100), (Sg1,M-L, 120)}
S3'2:{(S3'2,L,100),(S3'2,M-L127),(S3'2,M,234),
(S3'2,L180),(S3'2,L,147),
(S3'2,L127),(S3'2,M,234),(S3'2,M,178), (S3'2,L,220),
(S3b
2,M-L,170)}
S4'3: {(Sf'3,M-L,196),(^3,L,108),(Sj3,M,205), (Sj3,M-H,310),
(S5'3,M,245),(S^3,L,169),(S^'3,M-L,208), (Sg'3,M,254)}
S , r
(Sju'b,M-H,280),
c10,6
5,0,6
5,0,6
c , , ,6
{(S]0'6,M,234),(S20'6,M,267),(S30'6,M,215),
S"'b: {(S c , , ,6
,M-H,302),(S2I
c , , ,6 ,M-L,129),(S3
archive
wrk-stat
LAN
M, 235),
(Sj,'b,M,256),(Sj,'b,M,231),(S |;,'b,L,178), (S^'6,M-H,289)}
S5'3: {(S^'3,M,207),(S^'3,L,109),(S^'3,M-H,245), (S^3,M,267),
(S5l3,M-L,102)}
S5'6:{(S^'6,M,238),(S^6,L134),(S|6,M-L256),
(S;j'b,Llll),(Sfb,M,208)}
Sb'3:{(s5'3,M,248),(Sb'3,M,224),(S^'3,M,200),
(Sb'3,M-L,167), (Sb '3,LH0),(S[p,M-H,256)}
S8'3:{(S^3,M,257),(S2,3,M,234),(S3'3,L,189),
(SS/,M,236), (S5'3,M,204),(Sg'3,L,104)}
S9'3:{(S?'3,L,110),(S^'3,L,124),(^3,M-L143),
(S^3,M,206), (s!p,M,237),(S|?'3,L,170)}
S7'3:{(S7'3,M,234),(S7'3,L201),(S7'3,M,245),
(S7'3,L178), (S7'3,M,205),(S7'3,M,200)}
X32* = (0,0,1,0,0,0,1,1,0,0), with costs 220 and 646, respectively, see Table 11.
Stage 1: L, ={files-proc (A4), archive (A6), mail (A7), wrk-stat (A8), LAN (A9)}. We identify safeguards that minimize costs keeping the degrees of direct dependencies between assets in L, and terminal assets at, S(DD(Aj,Ai), U) P 0.95,S{DD{At,A2), U) P 0.95 and
S(DD(Aj,A3), U\P 0.95, with A, e L,. ^^ Note that DD(A4,Ai) = dd{A4,A3) <g> DD{A3,Ai) and the value of
DD{A3,Ai) was computed in the previous stage. Analogously,
DD(A4,A2) = dd{A4,A3) ®DD{A3,A2), and the value of DD{A3,A2) was also computed in the previous stage.
Five optimization problems have to be solved to select safeguards for each asset in Li. For instance, the optimization problem for files_proc (A4) is
Table 11 Optimal selection of safeguards and costs.
Asset
current-f
files-proc
archive mail wrk-stat LAN server
firewall internet
Optimal solution
x3'2' = (0,0,1,0,0,0,1,1,0,0) x3>r = (0,0,1,0,0,0,0,1)
x4'3* = (0,1,1,1,0,0,0,0) x6'3* = (0,1,1,0,0,1) x7>3' = (0,0,0,1,0,0) x8'3* = (0,1,0,1,1,0) y9,3* CO 0 0 1 1 1)
x53* = (1,0,1,1,1) x56* = (1,0,0,0,1)
x106* =(0,0,0,0,0,0,0,0) x11'6* =(0,0,0,0,0,0,0)
Cost
646
220
623
680 206 674 583
1267
Stage
0
0
1
1 1 1 1 2
2 0 2 0 2
4899
server

4 3 4 3 4 3 4 3
min q' X1' H h C8' X8' s.t.
S(UD(A4,
S(DD(A4,
S(DD(A4,
43 e {0.
A 1), U) P 0.95
A 2), U) P 0.95
A 3), U) P 0.95
1},p = 1, . . . ,8
Table 13 Safeguards and costs for the new thershold.
The optimal solution output by using simulated annealing and the associated costs are x4-3* = (0,1,1,1,0,0,0,0) and 623, respectively, see Table 11.
Stage 2: L2 ={server (A5), firewall (A10), internet (A11)}. Now, we identify safeguards that minimize costs keeping the degrees of direct dependencies between assets in L2 and terminal assets at levels obtained in Stage 1.
The degree of dependency of the server asset (A5) on terminal assets can be computed by
DD(A5,A1)= [(dd(A5,A6)®DD(A6,A3)) edd(A5,A3)] ®DD{A3,A1),
DD{A5,A2) = [(dd(A5,A6)®DD(A6,A3)) edd(A5,A3)] ®DD(A3,A2),
aD{A5,A3)=(dd{A5,A6)®DD{A6,A3))®dd{A5,A3),
respectively,and DD(A3,A1) and DDA3A2) were computed in Stage 0, whereas DD{A6A3) was computed in Stage 1.
The corresponding optimization problem for server {A5) is
min C1,3X1'3 + . . . + c553x553 + c516x516 + ... + d556x55'6
s.t.
S(DD(A5,A1), &) P 0.95
S{DD{A5,A2), U) P 0.95
S(DD(A5,A3), U) P 0.95 5,3 5,6 Xp" e {0, 1},p 1 , . . . , 5,
and the optimal solutions output using simulated annealing are X53* = (1,0,1,1,1) and x5-6* = (1,0,0,0,1) with a cost of 1267, see Table 11.
Table 11 shows the optimal solutions representing the selection of safeguards for assets throughout the application of dynamic programming and simulated annealing and the respective costs, whereas Table 12 shows the degree of dependency of assets on terminal assets after the implementation of the selected safeguards.
Note that no safeguards are selected for the firewall {A10) and internet {A11) assets, see Table 12. The reason is that the implementation of optimal safeguards for the archive asset (A6) in Stage 1 reduce the degree of dependency of that asset on terminal assets, see Table 12, row 3. Consequently, the degree of dependency of the firewall (A10) and internet {A11) assets, which are connected only to the archive asset (see Fig. 6), on terminal assets is so low at that point that it is unnecessary to implement any safeguards for those assets, and no money has to be spent.
Table 12 Degree of dependencies after the implementation of safeguards.
Asset Presential proc current f remote proc
current f files proc archive mail wrk-stat LAN server firewall internet
(0,0.002,0.08,0.16) (0,0.01,0.05,0.13) (0,0.01,0.05,0.13) (0,0,0.01,0.05) (0,0.01,0.05,0.13) (0,0,0.03,0.09) (0,0,0,0.03) (0,0,0.02,0.08) (0,0,0.03,0.11)
1 (0.01,0.04,0.10,0.19) (0.01,0.04,0.10,0.19) (0,0.02,0.08,0.16) (0.01,0.04,0.09,0.17) (0.01,0.04,0.10,0.19) (0,0.03,0.10 0.22) (0,0.01,0.05,0.12) (0,0.02,0.07,0.16)
(0,0.04,0.09,0.17) (0,0.01,0.05,0.11) (0,0.01,0.05,0.11) (0,0,0.01,0.04) (0,0.01,0.05,0.11) (0,0.01,0.03,0.08) (0,0,0,0.03) (0,0,0.02,0.07) (0,0,0.03,0.09)
Asset
current-f
files-proc archive mail wrk-stat LAN server
firewall internet
Optimal solution
x3'2* = (1 ,1 ,1 , 0, 0, 0, 0 , 1 , 0, 0) x31 = (0,0,0,0,0,0,0,1) x4'3* =(0,0,1,1,0,0,0,0) x6'3* =(0,1,1,0,0,1) x7'3* =(0,0,1,0,0,0) x8'3* =(0,1,0,1,1,0) y9,3* f0 0 0 0 1 1)
x5'3* =(1,0,1 ,1 ,1) x5'6* =(1,0,0,0,1) y1 0 ,6* / 0 0 0 0 0 0 0 0 )
x116* =(0,0,0,0,0,0,0)
Cost
639 120 515 680 143 674 405
1267
Stage
0 0 1 1 1 1 1 2
2 0 2 0 2
4443
If we consider that the fuzzy threshold for keeping the failure transmission probabilities among support and terminal assets at an acceptable level is now U = (0,0,0.075,0.15), then costs associated with selected safeguards would decrease to 4443, as was expected since a weaker threshold is used.
Table 13 shows the resulting selection of preventive safeguards and the respective costs. We have marked the differences regarding the solutions in Table 11 in bold. Note that the selection of safeguards is the same for archive, wrk-stat, server, firewall, and internet, five safeguards are no longer necessary and three additional safeguards are now selected for current-f and mail.
5. Conclusions and future research
We have developed a fuzzy risk analysis model for information systems that conforms to international standards, particularly the MAGERIT methodology. The model improves this methodology and other existing methodologies since it includes uncertainty about the assessments by means of linguistic terms, which correspond with trapezoidal fuzzy numbers. The proposed methodology makes computations on the basis of trapezoidal fuzzy numbers to accumulate dependencies between assets and asset valuations and to determine impacts and risk from threat-related degradation and threat frequency, respectively. Moreover, similarity functions can be used at any step in the methodology to derive a linguistic term for the trapezoidal fuzzy number output.
A model for selecting preventive safeguards to reduce risks based on the reduction of the degree of dependency between support assets and terminal assets has also been proposed. The aim is to select safeguards that minimize costs while keeping the risk at acceptable levels.
Dynamic programming combined with simulated annealing was used because of the special structure of the constraint set. This leads to a more computationally efficient solution to the safeguard selection problem.
We have assumed that the threat frequencies are represented by linguistic terms (trapezoidal fuzzy numbers). However, these frequencies might change depending on a number of variables in the context of the information system. In the future, we will intend to build a fuzzy control system to establish different alarm levels according to these variable values.
In the future, we also intend to consider the problem of selecting preventive safeguards that minimize risks to information systems in the line with a budget allocation.
References
[1] C. Alberts, A. Dorofee, Managing Information Security Risks: The OCTAVE Approach, Addison-Wesley, New York, 2002.

[2] J. Alcalá-Fernández, R. Alcalá, M.J. Gacto, F. Herrera, Learning the membership function contexts for mining fuzzy association rules by using genetic algorithms, Fuzzy Sets Syst. 160 (2009) 905–921.
[3] V. Cerny, Thermodynamical approach to the traveling salesman problem: an efficient simulation algorithm, J. Optim. Theor. Appl. 45 (1985) 41–51.
[4] S.-M. Chen, New methods for subjective mental workload assessment and fuzzy risk analysis, Cybernetics Syst. 27 (1996) 449–472.
[5] S.-J. Chen, S.-M. Chen, A new method to measure the similarity between fuzzy numbers, in: Proc. 10th IEEE Int. Conf. Fuzzy Syst., 2001, pp. 208–214.
[6] S.-J. Chen, S.-M. Chen, Fuzzy risk analysis based on similarity measures of generalized fuzzy numbers, IEEE Trans. Fuzzy Syst. 11 (2003) 45–56.
[7] S.-J. Chen, S.-M. Chen, Fuzzy risk analysis based on the ranking of generalized trapezoidal fuzzy numbers, Appl. Intell. 26 (2007) 1–11.
[8] CCTA Risk Analysis and Management Method (CRAMM), Version 5.0, Central Computing and Telecommunications Agency (CCTA), London.
[9] S.R. Hejazi, A. Doostparast, S.M. Hosseini, An improved fuzzy risk analysis based on a new similarity measures of generalized fuzzy numbers, Expert Syst. Appl. 38 (2011) 9179–9185.
[10] F. Herrera, L. Martínez, A 2-tuple fuzzy linguistic representation model for computing with words, IEEE Trans. Fuzzy Syst. 8 (2000) 746–752.
[11] C.H. Hsieh, S.H. Chen, Similarity of generalized fuzzy numbers with graded mean integration representation, in: Proc. 8th Int. Fuzzy Syst. Assoc. World Congress, 1999, pp. 551–555.
[12] ISO/IEC 17799:2005, Information Technology – Security Techniques – Code of Practice for Information Security Management, 2005, International Organization for Standardization, Geneva.
[13] ISO/IEC 27005:2011, Information Technology – Security Techniques – Information Security risk Management. 2005, International Organization for Standardization, Geneva.
[14] S. Kirkpatrick, C.D. Gelatt, M.P. Vecchi, Optimization by simulated annealing, Science 220 (1983) 671–680.
[15] H.S. Lee, An optimal aggregation method for fuzzy opinions of group decision, in: Proc. 1999 IEEE Int. Conf. Syst., Man. and Cybernetics, 1999, pp. 314–319.
[16] F. López Crespo, M.A. Amutio-Gómez, J. Candau, J.A. Mañas, Methodology for Information Systems Risk, Analysis and Management (MAGERIT version 2), Book I-The Method, Book II-Catalogue of Elements, Book III-The Techniques. Madrid: Ministerio de Administraciones Públicas, 2006a.
[17] Mehari 2010 – Risk Analysis and Treatment Guide, 2007, Club de la Sécurité de l’Information Francais (CSIF), Paris.
[18] A. Méndez Barco, J.A. Mañas, Manual del Usuario Pilar Basic versión 5.1, Centro Criptológico Nacional, Madrid, 2011.
[19] L. Peide, F. Jin, X. Zhang, Y. Su, M. Wang, Research on the multi-attribute decision-making under risk with interval probability based on prospect theory and the uncertain linguistic variables, Knowl.-Based Syst. 24 (2011) 554–561.
[20] J. Serrano-Guerrero, F.P. Romero, J.A. Olivas, Hiperion: a fuzzy approach for recommending educational activities based on the acquisition of competences, Inform. Sci. 248 (2013) 114–129.
[21] G. Stoneburner, A. Gougen, NIST 800-30 Risk Management, Guide for Information Technology Systems, National Institute of Standard and Technology, Gaithersburg, 2002.
[22] E. Vicente, A. Mateos, A. Jiménez, A new similarity function for generalized trapezoidal fuzzy numbers, artificial intelligence and soft computing, Lecture Notes Artificial Intelligence, vol. 7894, Springer, Berlin, 2013.
[23] E. Vicente, A. Mateos, A. Jiménez, Similarity functions for generalized trapezoidal fuzzy numbers: an improved comparative analysis, Comp. Math. Appl. (2013) (submitted for publication).
[24] E. Vicente, A. Jiménez, A. Mateos, A fuzzy extension on MAGERIT methodology for risk analysis in information systems, in: Proc. 6th IADIS Int. Conf. Inform. Syst., 2013, pp. 39–46.
[25] E. Vicente, A. Jiménez, A. Mateos, An interactive method of fuzzy probability elicitation in risk analysis, in: C. Huang, C. Karhaman (Eds.), Intelligent Systems and Decision Making for Risk Analysis and Crisis Response, CRC Press, 2013, pp. 223–228.
[26] W.P. Wang, Evaluating new product development performance by fuzzy linguistic computing, Expert Syst. Appl. 36 (2009) 9759–9766.
[27] J. Wang, J. Hao, A new version of 2-tuple fuzzy linguistic representation model for computing with words, IEEE Trans. Fuzzy Syst. 14 (2006) 435–445.
[28] S.H. Wei, S.M. Chen, A new approach for fuzzy risk analysis based on similarity measures of generalized fuzzy number, Expert Syst. Appl. 36 (2009) 589–598.
[29] G.-W. Wei, A method for multiple attribute group decision making based on the ET-WG and ET-OWG operators with 2-tuple linguistic information, Expert Syst. Appl. 37 (2010) 7895–7900.
[30] G.-W. Wei, X. Zhao, Some dependent aggregation operators with 2-tuple linguistic information and their application to multiple attribute group decision making, Expert Syst. Appl. 39 (2012) 5881–5886.
[31] Z.S. Xu, A method based on linguistic aggregation operators for group decision making with linguistic preference relations, Inform. Sci. 166 (2004) 19–30.
[32] Z.S. Xu, S. Shang, W. Qian, W. Shu, A method or fuzzy risk analysis based on the new similarity of trapezoidal fuzzy numbers, Expert Syst. Appl. 37 (2010) 1920–1927.
[33] L.A. Zadeh, Fuzzy sets, Inform. Control 8 (1965) 338–353.
Top Related