


Languages
Pages
Legal

RGI
B e r w i c k A c a d e m yInvesting in Excellence
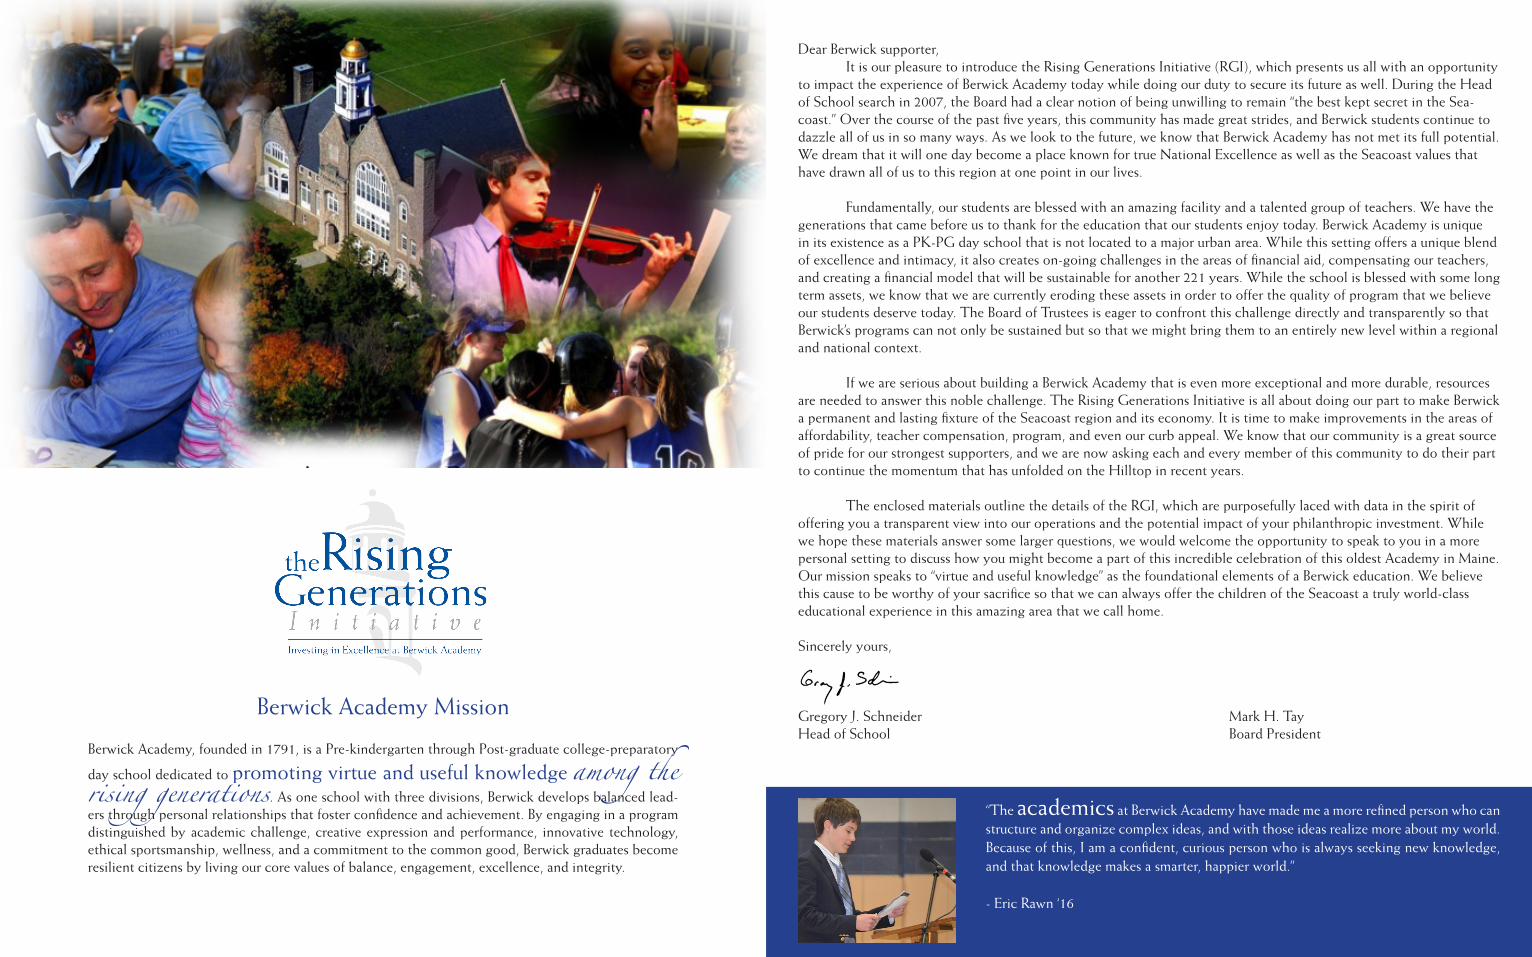
Berwick Academy, founded in 1791, is a Pre-kindergarten through Post-graduate college-preparatory
day school dedicated to promoting virtue and useful knowledge among the rising generations. As one school with three divisions, Berwick develops balanced lead-ers through personal relationships that foster confidence and achievement. By engaging in a program distinguished by academic challenge, creative expression and performance, innovative technology, ethical sportsmanship, wellness, and a commitment to the common good, Berwick graduates become resilient citizens by living our core values of balance, engagement, excellence, and integrity.
Berwick Academy Mission
Dear Berwick supporter, It is our pleasure to introduce the Rising Generations Initiative (RGI), which presents us all with an opportunity to impact the experience of Berwick Academy today while doing our duty to secure its future as well. During the Head of School search in 2007, the Board had a clear notion of being unwilling to remain “the best kept secret in the Sea-coast.” Over the course of the past five years, this community has made great strides, and Berwick students continue to dazzle all of us in so many ways. As we look to the future, we know that Berwick Academy has not met its full potential. We dream that it will one day become a place known for true National Excellence as well as the Seacoast values that have drawn all of us to this region at one point in our lives.
Fundamentally, our students are blessed with an amazing facility and a talented group of teachers. We have the generations that came before us to thank for the education that our students enjoy today. Berwick Academy is unique in its existence as a PK-PG day school that is not located to a major urban area. While this setting offers a unique blend of excellence and intimacy, it also creates on-going challenges in the areas of financial aid, compensating our teachers, and creating a financial model that will be sustainable for another 221 years. While the school is blessed with some long term assets, we know that we are currently eroding these assets in order to offer the quality of program that we believe our students deserve today. The Board of Trustees is eager to confront this challenge directly and transparently so that Berwick’s programs can not only be sustained but so that we might bring them to an entirely new level within a regional and national context.
If we are serious about building a Berwick Academy that is even more exceptional and more durable, resources are needed to answer this noble challenge. The Rising Generations Initiative is all about doing our part to make Berwick a permanent and lasting fixture of the Seacoast region and its economy. It is time to make improvements in the areas of affordability, teacher compensation, program, and even our curb appeal. We know that our community is a great source of pride for our strongest supporters, and we are now asking each and every member of this community to do their part to continue the momentum that has unfolded on the Hilltop in recent years.
The enclosed materials outline the details of the RGI, which are purposefully laced with data in the spirit of offering you a transparent view into our operations and the potential impact of your philanthropic investment. While we hope these materials answer some larger questions, we would welcome the opportunity to speak to you in a more personal setting to discuss how you might become a part of this incredible celebration of this oldest Academy in Maine. Our mission speaks to “virtue and useful knowledge” as the foundational elements of a Berwick education. We believe this cause to be worthy of your sacrifice so that we can always offer the children of the Seacoast a truly world-class educational experience in this amazing area that we call home.
Sincerely yours,
Gregory J. Schneider Mark H. TayHead of School Board President
“The academics at Berwick Academy have made me a more refined person who can structure and organize complex ideas, and with those ideas realize more about my world. Because of this, I am a confident, curious person who is always seeking new knowledge, and that knowledge makes a smarter, happier world.”
- Eric Rawn ‘16
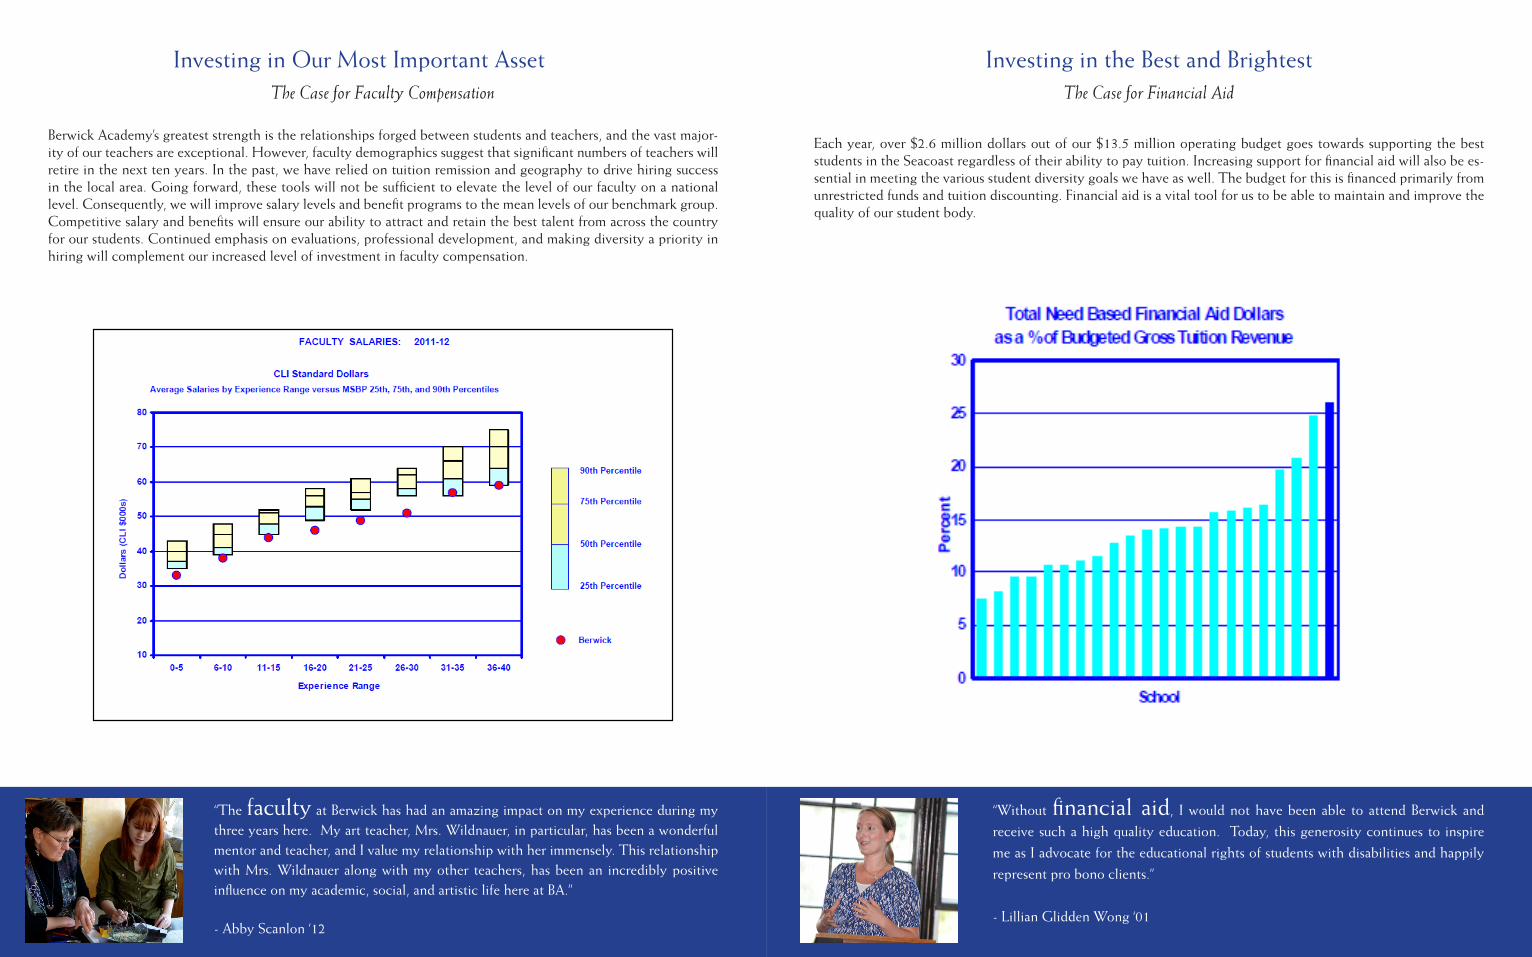
Berwick Academy’s greatest strength is the relationships forged between students and teachers, and the vast major-ity of our teachers are exceptional. However, faculty demographics suggest that significant numbers of teachers will retire in the next ten years. In the past, we have relied on tuition remission and geography to drive hiring success in the local area. Going forward, these tools will not be sufficient to elevate the level of our faculty on a national level. Consequently, we will improve salary levels and benefit programs to the mean levels of our benchmark group. Competitive salary and benefits will ensure our ability to attract and retain the best talent from across the country for our students. Continued emphasis on evaluations, professional development, and making diversity a priority in hiring will complement our increased level of investment in faculty compensation.
Investing in Our Most Important AssetThe Case for Faculty Compensation
“The faculty at Berwick has had an amazing impact on my experience during my three years here. My art teacher, Mrs. Wildnauer, in particular, has been a wonderful mentor and teacher, and I value my relationship with her immensely. This relationship with Mrs. Wildnauer along with my other teachers, has been an incredibly positive influence on my academic, social, and artistic life here at BA.”
- Abby Scanlon ‘12
Each year, over $2.6 million dollars out of our $13.5 million operating budget goes towards supporting the best students in the Seacoast regardless of their ability to pay tuition. Increasing support for financial aid will also be es-sential in meeting the various student diversity goals we have as well. The budget for this is financed primarily from unrestricted funds and tuition discounting. Financial aid is a vital tool for us to be able to maintain and improve the quality of our student body.
Investing in the Best and BrightestThe Case for Financial Aid
“Without financial aid, I would not have been able to attend Berwick and
receive such a high quality education. Today, this generosity continues to inspire
me as I advocate for the educational rights of students with disabilities and happily
represent pro bono clients.”
- Lillian Glidden Wong ‘01
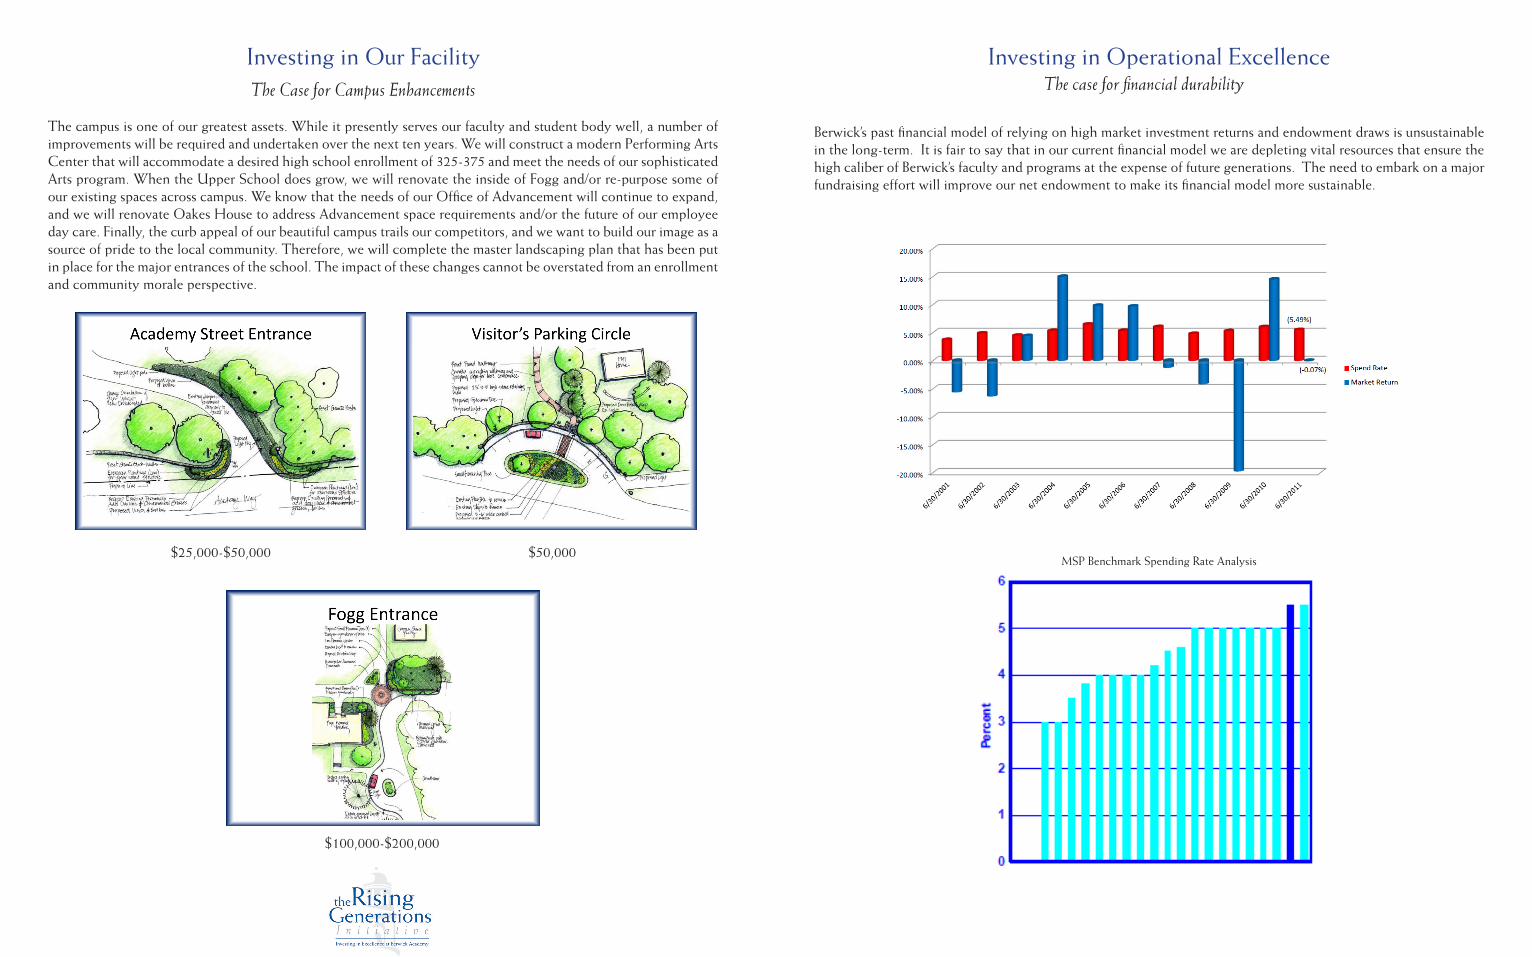
The campus is one of our greatest assets. While it presently serves our faculty and student body well, a number of improvements will be required and undertaken over the next ten years. We will construct a modern Performing Arts Center that will accommodate a desired high school enrollment of 325-375 and meet the needs of our sophisticated Arts program. When the Upper School does grow, we will renovate the inside of Fogg and/or re-purpose some of our existing spaces across campus. We know that the needs of our Office of Advancement will continue to expand, and we will renovate Oakes House to address Advancement space requirements and/or the future of our employee day care. Finally, the curb appeal of our beautiful campus trails our competitors, and we want to build our image as a source of pride to the local community. Therefore, we will complete the master landscaping plan that has been put in place for the major entrances of the school. The impact of these changes cannot be overstated from an enrollment and community morale perspective.
$25,000-$50,000 $50,000
$100,000-$200,000
Investing in Our FacilityThe Case for Campus Enhancements
Investing in Operational ExcellenceThe case for financial durability
Berwick’s past financial model of relying on high market investment returns and endowment draws is unsustainable in the long-term. It is fair to say that in our current financial model we are depleting vital resources that ensure the high caliber of Berwick’s faculty and programs at the expense of future generations. The need to embark on a major fundraising effort will improve our net endowment to make its financial model more sustainable.
MSP Benchmark Spending Rate Analysis
BERWICK ACADEMYFY 2013 -‐ 2017
LONG RANGE BUDGET PLANNING FINANCIAL MODELSummary Details
Summary Model 4.xlsx Version 4
FY 2013 FY 2014 FY 2015 FY 2016 FY 2017Scenario I (Improvements without Fundraising)
Incremental Annual Fund Increase 100,000$ -$ -$ -$ -$ 5% Incremental Salary Pool Increase 314,628$ 314,869$ 287,829$ 333,826$ 349,636$
Incremental Campus Investment 150,000$ 150,000$ 100,000$ 100,000$ 100,000$ Unrestricted Draw 433,889$ 463,889$ 395,000$ 590,000$ 660,000$ Debt Service details Interest only Interest only P&I (half year) P&I P&ITotal Cash & Investments @ June 30 14,615,193$ 14,417,565$ 14,269,769$ 13,921,552$ 13,485,741$
Marketable Investments - Beginning Balance 14,650,000$ 14,515,193$ 14,317,565$ 14,169,769$ 13,821,552$ less draw (unrestricted & restricted) (689,032)$ (744,642)$ (681,756)$ (883,179)$ (960,051)$ add operating OPEX surplus 9,245$ 7,049$ 1,346$ 7,847$ 10,078$
3.72% add investment return 544,980$ 539,965$ 532,613$ 527,115$ 514,162$ Ending Balance 14,515,193$ 14,317,565$ 14,169,769$ 13,821,552$ 13,385,741$
FY 2013 FY 2014 FY 2015 FY 2016 FY 2017Scenario II (Treading Water)
Incremental Annual Fund Increase 100,000$ -$ -$ -$ -$ 3% Incremental Salary Pool Increase 314,628$ 188,921$ 191,488$ 228,532$ 236,256$
Incremental Campus Investment -$ -$ -$ -$ -$ Unrestricted Draw 283,889$ 283,889$ 200,000$ 150,000$ 90,000$ Debt Service details Interest only Interest only P&I (half year) P&I P&ITotal Cash & Investments @ June 30 14,765,193$ 14,865,686$ 15,075,008$ 15,204,006$ 15,378,162$
Marketable Investments - Beginning Balance 14,650,000$ 14,665,193$ 14,765,686$ 14,975,008$ 15,104,006$ less draw (unrestricted & restricted) (539,032)$ (564,642)$ (486,756)$ (443,170)$ (390,051)$ add operating OPEX surplus 9,245$ 119,591$ 146,794$ 15,097$ 2,338$
3.72% add investment return 544,980$ 545,545$ 549,284$ 557,070$ 561,869$ Ending Balance 14,665,193$ 14,765,686$ 14,975,008$ 15,104,006$ 15,278,162$
FY 2013 FY 2014 FY 2015 FY 2016 FY 2017Scenario III (Improvements with Fundraising)
Incremental Annual Fund Increase 600,000$ 500,000$ 500,000$ 500,000$ 500,000$ 5% Incremental Salary Pool Increase 314,628$ 314,869$ 287,829$ 333,826$ 349,636$
Incremental Campus Investment 150,000$ 150,000$ 100,000$ 100,000$ 100,000$ Unrestricted Draw -$ -$ -$ -$ -$ Debt Service details Interest only Interest only P&I (half year) P&I P&ITotal Cash & Investments @ June 30 14,865,193$ 14,965,686$ 15,175,008$ 15,304,006$ 17,117,226$
Marketable Investments - Beginning Balance 14,650,000$ 15,089,908$ 15,490,618$ 15,965,461$ 16,518,468$ less draw (restricted only) (255,143)$ (280,753)$ (286,756)$ (290,179)$ (300,051)$ add operating OPEX surplus 75,356$ 43,160$ 106,346$ 167,847$ 100,078$
4.23% add investment return 619,695$ 638,303$ 655,253$ 675,339$ 698,731$ Ending Balance 15,089,908$ 15,490,618$ 15,965,461$ 16,518,468$ 17,017,226$
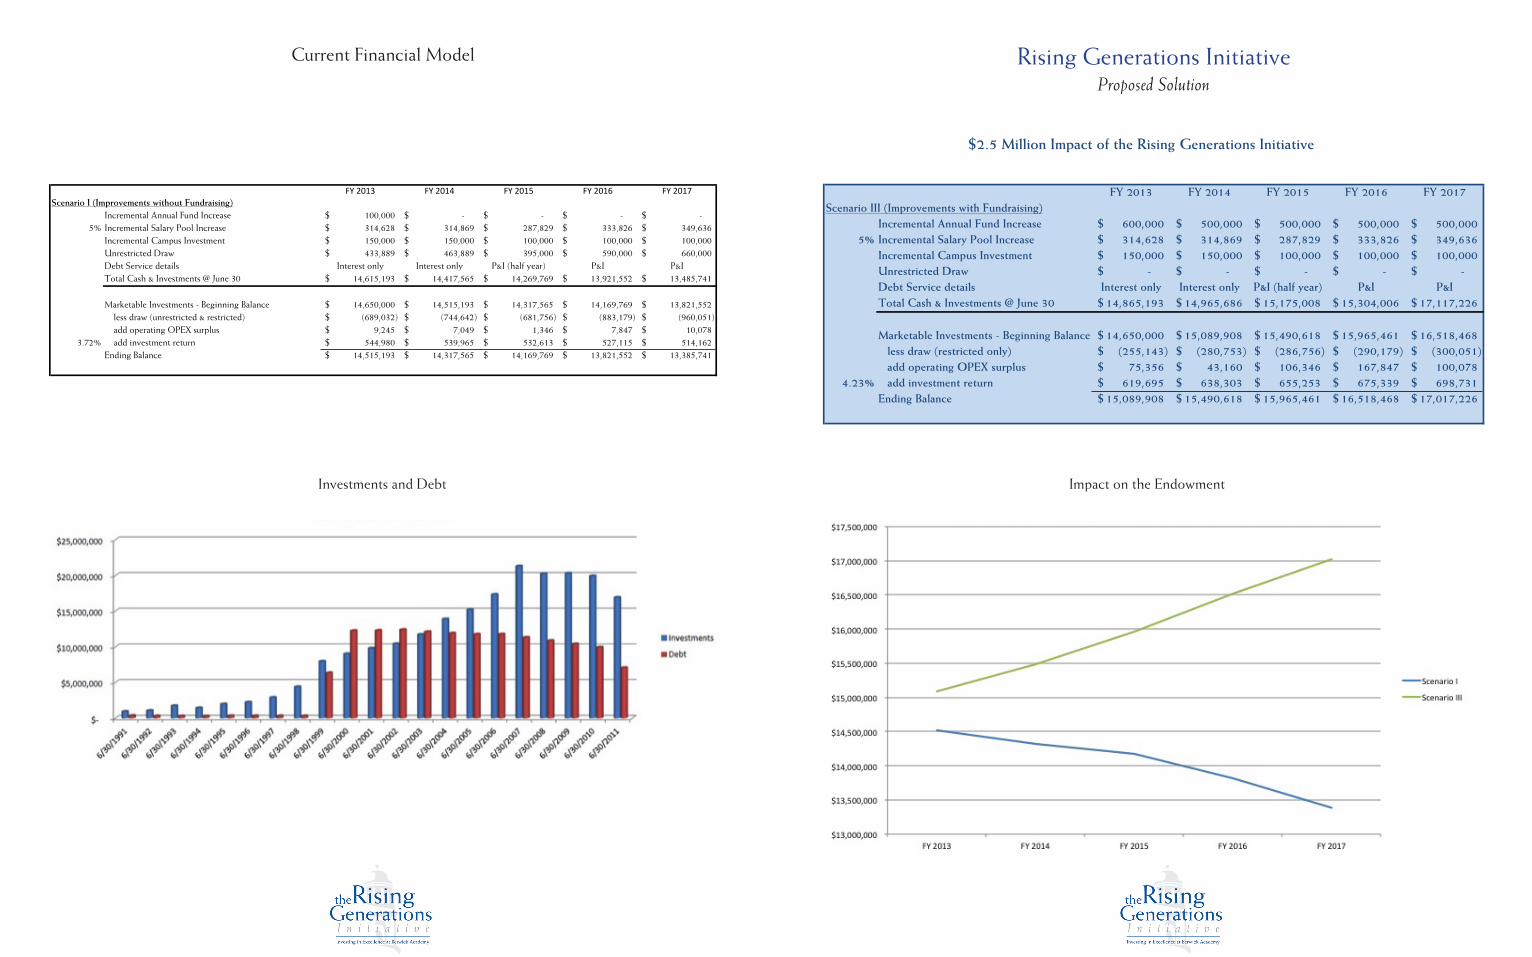
$2.5 Million Impact of the Rising Generations Initiative
Current Financial Model Rising Generations Initiative
BERWICK ACADEMYFY 2013 -‐ 2017
LONG RANGE BUDGET PLANNING FINANCIAL MODELSummary Details
Summary Model 4.xlsx Version 4
FY 2013 FY 2014 FY 2015 FY 2016 FY 2017Scenario I (Improvements without Fundraising)
Incremental Annual Fund Increase 100,000$ -$ -$ -$ -$ 5% Incremental Salary Pool Increase 314,628$ 314,869$ 287,829$ 333,826$ 349,636$
Incremental Campus Investment 150,000$ 150,000$ 100,000$ 100,000$ 100,000$ Unrestricted Draw 433,889$ 463,889$ 395,000$ 590,000$ 660,000$ Debt Service details Interest only Interest only P&I (half year) P&I P&ITotal Cash & Investments @ June 30 14,615,193$ 14,417,565$ 14,269,769$ 13,921,552$ 13,485,741$
Marketable Investments - Beginning Balance 14,650,000$ 14,515,193$ 14,317,565$ 14,169,769$ 13,821,552$ less draw (unrestricted & restricted) (689,032)$ (744,642)$ (681,756)$ (883,179)$ (960,051)$ add operating OPEX surplus 9,245$ 7,049$ 1,346$ 7,847$ 10,078$
3.72% add investment return 544,980$ 539,965$ 532,613$ 527,115$ 514,162$ Ending Balance 14,515,193$ 14,317,565$ 14,169,769$ 13,821,552$ 13,385,741$
FY 2013 FY 2014 FY 2015 FY 2016 FY 2017Scenario II (Treading Water)
Incremental Annual Fund Increase 100,000$ -$ -$ -$ -$ 3% Incremental Salary Pool Increase 314,628$ 188,921$ 191,488$ 228,532$ 236,256$
Incremental Campus Investment -$ -$ -$ -$ -$ Unrestricted Draw 283,889$ 283,889$ 200,000$ 150,000$ 90,000$ Debt Service details Interest only Interest only P&I (half year) P&I P&ITotal Cash & Investments @ June 30 14,765,193$ 14,865,686$ 15,075,008$ 15,204,006$ 15,378,162$
Marketable Investments - Beginning Balance 14,650,000$ 14,665,193$ 14,765,686$ 14,975,008$ 15,104,006$ less draw (unrestricted & restricted) (539,032)$ (564,642)$ (486,756)$ (443,170)$ (390,051)$ add operating OPEX surplus 9,245$ 119,591$ 146,794$ 15,097$ 2,338$
3.72% add investment return 544,980$ 545,545$ 549,284$ 557,070$ 561,869$ Ending Balance 14,665,193$ 14,765,686$ 14,975,008$ 15,104,006$ 15,278,162$
FY 2013 FY 2014 FY 2015 FY 2016 FY 2017Scenario III (Improvements with Fundraising)
Incremental Annual Fund Increase 600,000$ 500,000$ 500,000$ 500,000$ 500,000$ 5% Incremental Salary Pool Increase 314,628$ 314,869$ 287,829$ 333,826$ 349,636$
Incremental Campus Investment 150,000$ 150,000$ 100,000$ 100,000$ 100,000$ Unrestricted Draw -$ -$ -$ -$ -$ Debt Service details Interest only Interest only P&I (half year) P&I P&ITotal Cash & Investments @ June 30 14,865,193$ 14,965,686$ 15,175,008$ 15,304,006$ 17,117,226$
Marketable Investments - Beginning Balance 14,650,000$ 15,089,908$ 15,490,618$ 15,965,461$ 16,518,468$ less draw (restricted only) (255,143)$ (280,753)$ (286,756)$ (290,179)$ (300,051)$ add operating OPEX surplus 75,356$ 43,160$ 106,346$ 167,847$ 100,078$
4.23% add investment return 619,695$ 638,303$ 655,253$ 675,339$ 698,731$ Ending Balance 15,089,908$ 15,490,618$ 15,965,461$ 16,518,468$ 17,017,226$
$2.5 Million Impact of the Rising Generations Initiative
Impact on the Endowment
Proposed Solution
Investments and Debt
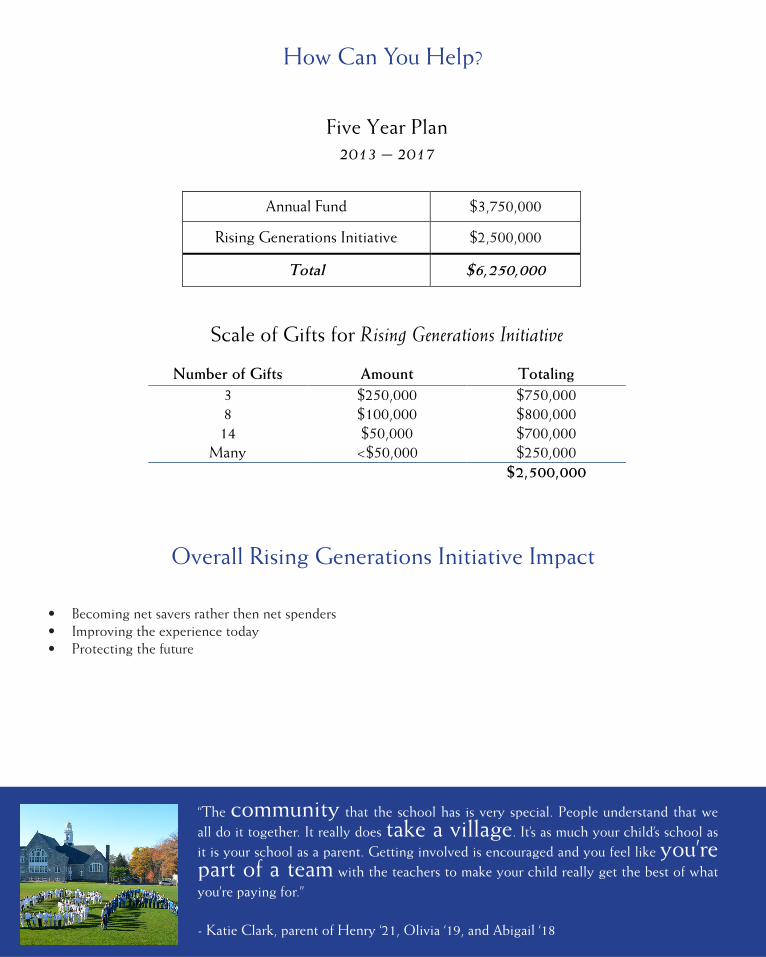
Five Year Plan 2013 – 2017
Annual Fund $3,750,000
Rising Generations Initiative $2,500,000
Total $6,250,000
Scale of Gifts for Rising Generations Initiative
Number of Gifts Amount Totaling 3 $250,000 $750,000 8 $100,000 $800,000 14 $50,000 $700,000
Many <$50,000 $250,000 $2,500,000
How Can You Help?
Overall Rising Generations Initiative Impact
“The community that the school has is very special. People understand that we all do it together. It really does take a village. It’s as much your child’s school as it is your school as a parent. Getting involved is encouraged and you feel like you’re part of a team with the teachers to make your child really get the best of what you’re paying for.”
- Katie Clark, parent of Henry ‘21, Olivia ‘19, and Abigail ‘18
• Becoming net savers rather then net spenders• Improving the experience today • Protecting the future
Top Related