


Languages
Pages
Legal


Prepared for:
Retirement Plan
Quarterly Investment
Review
All Vendor Summary
September 30, 2009
Pepperdine University Retirement PlanPlan Name:
Quarter Ending:
Section 1 – Market Overview
Industry Analysis
Section 2 – Diversified Plan Portfolio Summary
Fund Performance Summary
T. Rowe Price Retirement - Qualitative Analysis Summary
PortfolioXPress Allocation (underlying holdings)
Quantitative Analysis Summary
Fund Evaluation Analysis
Overlap Analysis
Range of Investments
Management Style Analysis
Portfolio Analysis
Portfolio Return vs. Custom Benchmark
Watch List
Table of Contents
Section 3 – Diversified Plan Asset Allocation
Asset Allocation by Fund
Asset Allocation by Category
Asset Allocation Quarterly Comparison
Average Account Balance By Age
Asset Allocation by Age Group
Portfolio Xpress Models
Section 4 – TIAA-CREF Plan Portfolio Summary
Fund Performance Summary
Quantitative Analysis Summary
Fund Evaluation Analysis
Management Style Analysis
Portfolio Analysis
Portfolio Return vs. Custom Benchmark
Section 5 – TIAA-CREF Plan Asset Allocation
Asset Allocation by Fund
Asset Allocation by Category %
Asset Allocation Quarterly Comparison
Growth of Plan Assets
Section 6 – Prudential Plan Portfolio Summary
Fund Performance Summary
Quantitative Analysis Summary
Fund Evaluation Analysis
Management Style Analysis
Portfolio Analysis
Portfolio Return vs. Custom Benchmark
Section 7 – Prudential Plan Asset Allocation
Asset Allocation by Fund
Asset Allocation by Category %
Asset Allocation Quarterly Comparison ($ and %)
Growth of Plan Assets

Market Overview
September 30, 2009
Section 1
3rd Quarter 2009 Market Overview
4
Source: Standard & Poor’s, FRB, BLS, BEA, JP Morgan. This information is not intended to be used as investment advice. For information only related to a general overview of the market. For plan
sponsor use only.
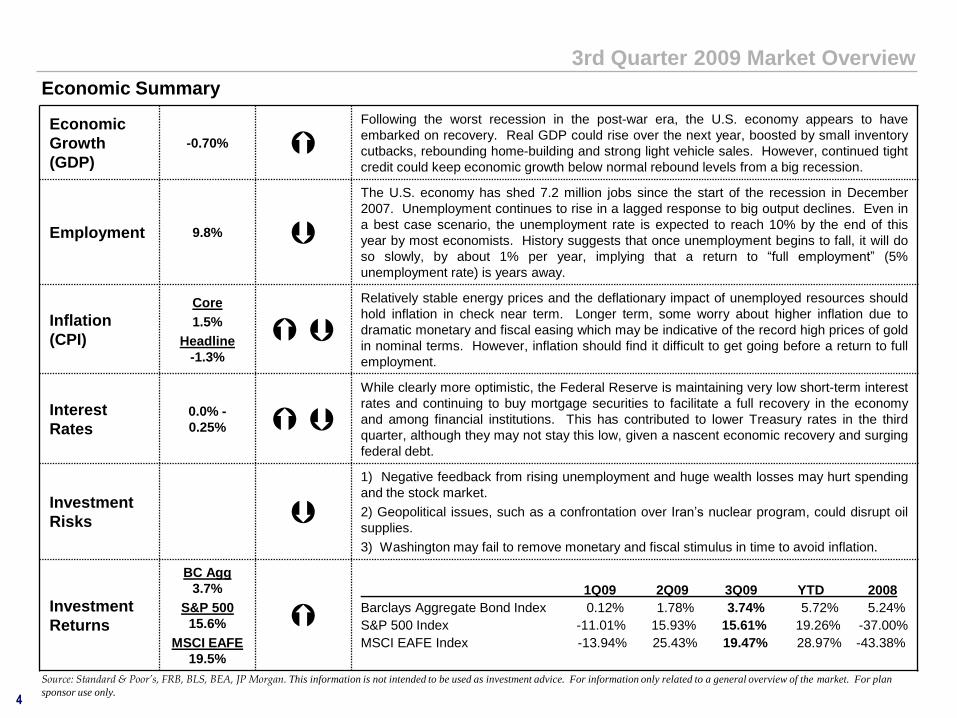
Economic
Growth
(GDP)
-0.70%
Following the worst recession in the post-war era, the U.S. economy appears to have
embarked on recovery. Real GDP could rise over the next year, boosted by small inventory
cutbacks, rebounding home-building and strong light vehicle sales. However, continued tight
credit could keep economic growth below normal rebound levels from a big recession.
Employment 9.8%
The U.S. economy has shed 7.2 million jobs since the start of the recession in December
2007. Unemployment continues to rise in a lagged response to big output declines. Even in
a best case scenario, the unemployment rate is expected to reach 10% by the end of this
year by most economists. History suggests that once unemployment begins to fall, it will do
so slowly, by about 1% per year, implying that a return to “full employment” (5%
unemployment rate) is years away.
Inflation
(CPI)
Core
1.5%
Headline
-1.3%
Relatively stable energy prices and the deflationary impact of unemployed resources should
hold inflation in check near term. Longer term, some worry about higher inflation due to
dramatic monetary and fiscal easing which may be indicative of the record high prices of gold
in nominal terms. However, inflation should find it difficult to get going before a return to full
employment.
Interest
Rates0.0% -
0.25%
While clearly more optimistic, the Federal Reserve is maintaining very low short-term interest
rates and continuing to buy mortgage securities to facilitate a full recovery in the economy
and among financial institutions. This has contributed to lower Treasury rates in the third
quarter, although they may not stay this low, given a nascent economic recovery and surging
federal debt.
Investment
Risks
1) Negative feedback from rising unemployment and huge wealth losses may hurt spending
and the stock market.
2) Geopolitical issues, such as a confrontation over Iran’s nuclear program, could disrupt oil
supplies.
3) Washington may fail to remove monetary and fiscal stimulus in time to avoid inflation.
Investment
Returns
BC Agg
3.7%
S&P 500
15.6%
MSCI EAFE
19.5%
1Q09 2Q09 3Q09 YTD 2008
Barclays Aggregate Bond Index 0.12% 1.78% 3.74% 5.72% 5.24%
S&P 500 Index -11.01% 15.93% 15.61% 19.26% -37.00%
MSCI EAFE Index -13.94% 25.43% 19.47% 28.97% -43.38%
Economic Summary
3rd Quarter 2009 Market Overview
5
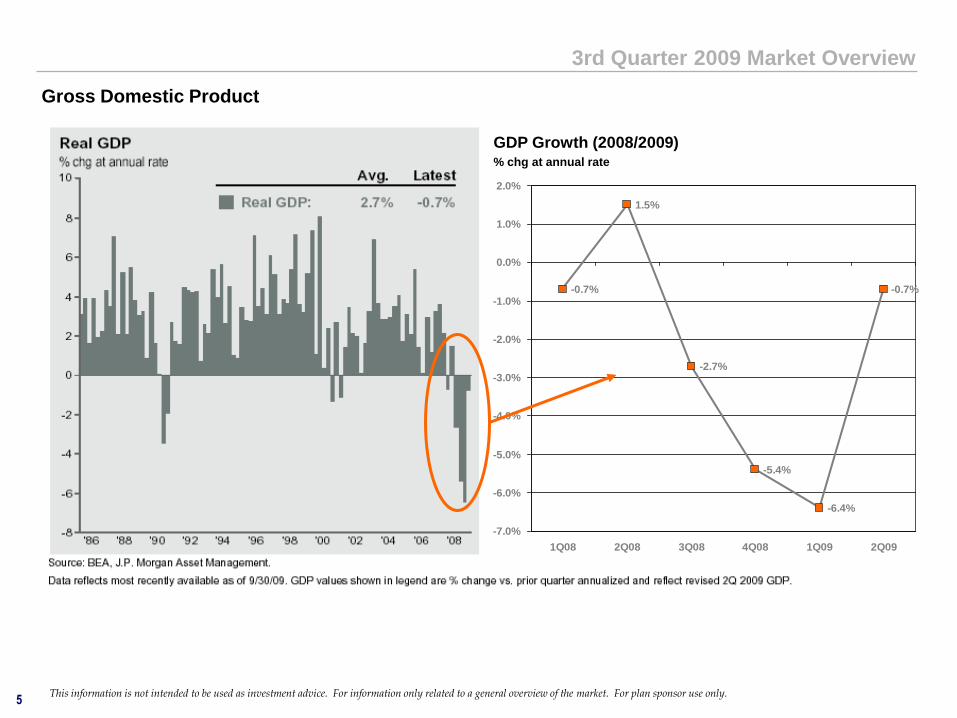
Gross Domestic Product
This information is not intended to be used as investment advice. For information only related to a general overview of the market. For plan sponsor use only.
-0.7%
-2.7%
-5.4%
-6.4%
-0.7%
1.5%
-7.0%
-6.0%
-5.0%
-4.0%
-3.0%
-2.0%
-1.0%
0.0%
1.0%
2.0%
1Q08 2Q08 3Q08 4Q08 1Q09 2Q09
GDP Growth (2008/2009)% chg at annual rate

3rd Quarter 2009 Market Overview
6This information is not intended to be used as investment advice. For information only related to a general overview of the market. For plan sponsor use only.
Contributions to GDP Growth

3rd Quarter 2009 Market Overview
7
Cyclical Indicators
This information is not intended to be used as investment advice. For information only related to a general overview of the market. For plan sponsor use only.

3rd Quarter 2009 Market Overview
8
Employment
This information is not intended to be used as investment advice. For information only related to a general overview of the market. For plan sponsor use only.

3rd Quarter 2009 Market Overview
9
Consumer Price Index
This information is not intended to be used as investment advice. For information only related to a general overview of the market. For plan sponsor use only.

3rd Quarter 2009 Market Overview
10
Corporate Profits
This information is not intended to be used as investment advice. For information only related to a general overview of the market. For plan sponsor use only.

3rd Quarter 2009 Market Overview
11
Oil and the Economy
This information is not intended to be used as investment advice. For information only related to a general overview of the market. For plan sponsor use only.

3rd Quarter 2009 Market Overview
12This information is not intended to be used as investment advice. For information only related to a general overview of the market. For plan sponsor use only.
Credit Conditions

3rd Quarter 2009 Market Overview
13
Current Account Deficit and U.S. Dollar
This information is not intended to be used as investment advice. For information only related to a general overview of the market. For plan sponsor use only.

3rd Quarter 2009 Market Overview
14
Fixed Income Sectors Returns as of 9/30/2009
This information is not intended to be used as investment advice. For information only related to a general overview of the market. For plan sponsor use only.
Source: Barclays Capital, FactSet, JPMorgan Asset Management.
Past performance is not indicative of future returns. Fixed income sectors shown above are provided by Barclays Capital and are represented by: Barclays Capital U.S. Aggregate Index; MBS: Fixed Rate MBS Index; Corporate: U.S. Corporates; Municipals: Muni Bond Index; Emerging Debt: Emerging Markets Index; High Yield: Corporate High Yield Index; Treasuries: Barclays Capital U.S. Treasury. TIPS: Barclays Capital Real TIPS.
The “balanced” portfolio assumes the following weights: 10% in MBS, 20% in Corporate, 15% in Municipals, 10% in Emerging Debt, 10% in High Yield, 25% in Treasuries, 10% in TIPS. Balanced portfolio assumes annual rebalancing.
Data as of 9/30/09.
3rd Quarter 2009 Market Overview
15
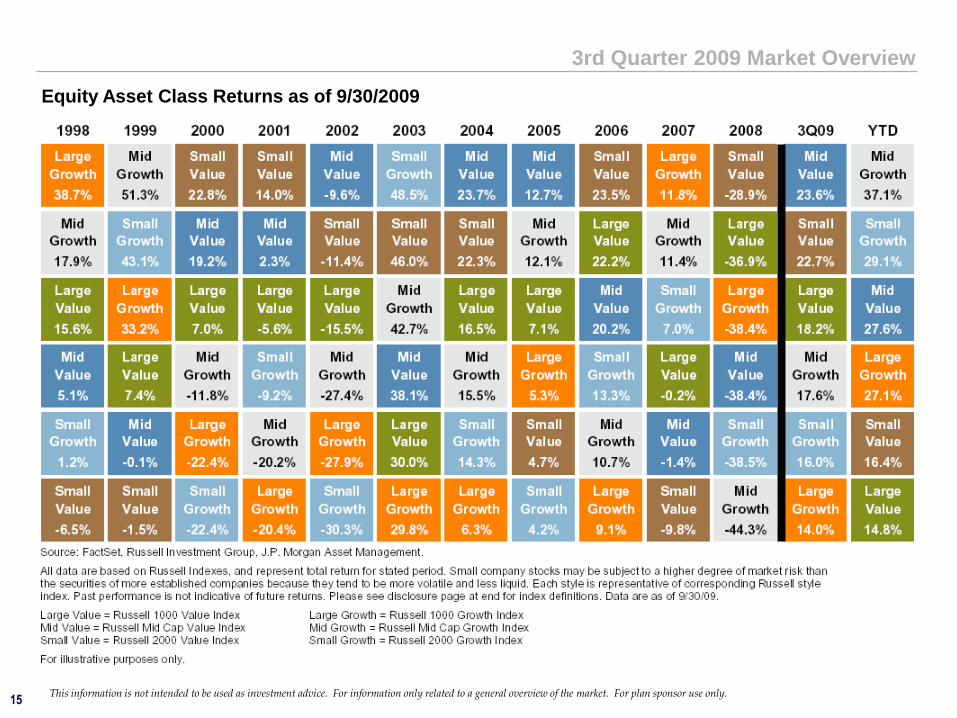
Equity Asset Class Returns as of 9/30/2009
This information is not intended to be used as investment advice. For information only related to a general overview of the market. For plan sponsor use only.

3rd Quarter 2009 Market Overview
16
Source: Standard & Poor’s, Russell Investment Group, JPMorgan Asset Management. This information is not intended to be used as investment advice. For information only related to a general overview of the market. For plan sponsor use only.
S&P 500 Weight (%) 9.2 11.5 11.7 15.2 13.1 10.2 3.5 18.7 3.2 3.7
Russell 1000 Growth Weight (%) 10.3 16.0 4.2 5.2 16.6 10.2 4.0 31.8 0.6 0.9
Russell 1000 Value Weight (%) 9.5 5.5 18.4 25.4 9.1 10.6 3.9 5.1 5.6 6.9
3Q09 Return 19.3 11.4 10.1 25.5 9.5 22.0 21.5 17.0 5.6 6.2 15.6
YTD 2009 29.6 9.4 7.8 21.2 9.7 14.8 38.4 46.1 1.4 4.3 19.3
1 Year Annualized Return -0.1 -4.6 -14.4 -23.5 -3.6 -12.7 -4.2 8.5 0.0 -7.1 -6.9
3 Year Annualized Return -6.2 3.0 1.6 -22.2 -2.7 -6.5 0.9 0.8 -5.0 -1.2 -5.4
5 Year Annualized Return -1.2 6.2 10.0 -9.6 1.8 -0.3 4.4 3.7 2.0 7.0 1.0
10 Year Annualized Return -0.4 5.2 8.9 -1.5 1.9 1.2 5.1 -5.1 -6.6 3.6 -0.1
15 Year Annualized Return 6.4 9.3 12.5 7.0 10.3 7.7 6.0 9.5 3.2 7.1 7.6
Forward P/E Ratio 16.2x 14.1x 14.1x 16.2x 12.1x 17.4x 19.8x 17.0x 13.0x 12.4x 15.0x
Trailing P/E Ratio 18.1x 15.9x 11.7x 30.2x 15.0x 14.7x 23.2x 21.3x 13.9x 13.0x 16.9x
Trailing 20-year Average P/E Ratio 19.9x 21.7x 19.2x 15.7x 24.6x 20.2x 19.9x 27.0x 18.6x 14.5x 19.9x
Co
ns D
iscre
tio
n
Co
ns S
tap
les
En
erg
y
Fin
an
cia
ls
Healt
h C
are
Ind
ustr
ials
Mate
rials
Tech
no
log
y
Tele
co
m
S&
P 5
00 In
dex
Uti
liti
es
S&P Index Sectors – Performance as of 9/30/2009

3rd Quarter 2009 Market Overview
17
World Equity Market Returns as of 9/30/2009
This information is not intended to be used as investment advice. For information only related to a general overview of the market. For plan sponsor use only.

3rd Quarter 2009 Market Overview
18
Mutual Funds Flows
This information is not intended to be used as investment advice. For information only related to a general overview of the market. For plan sponsor use only.
3rd Quarter 2009 Market Overview
19
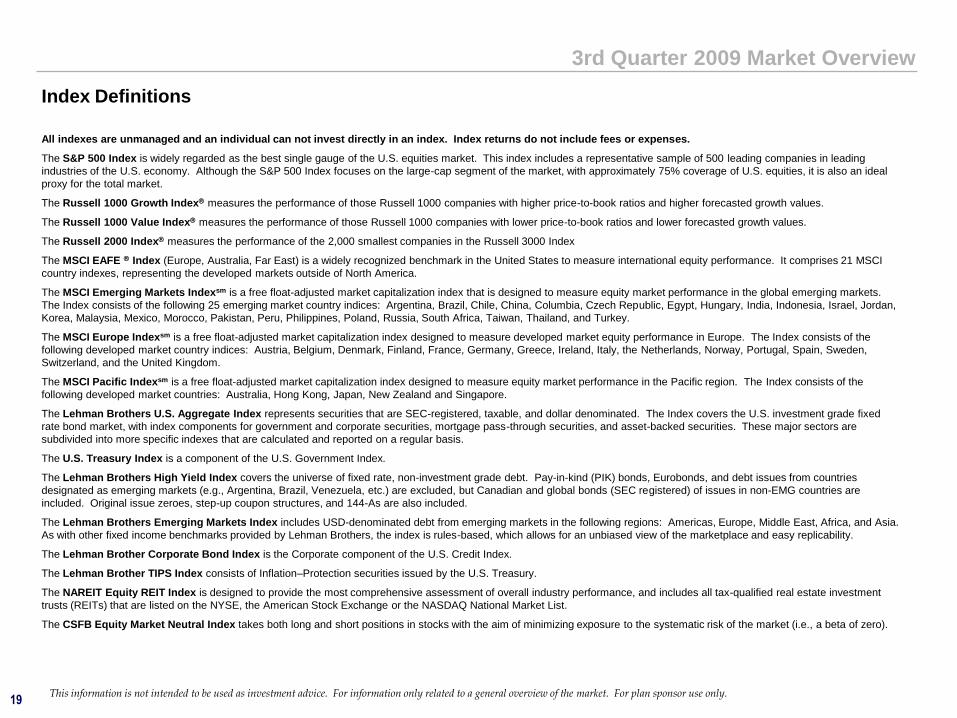
Index Definitions
All indexes are unmanaged and an individual can not invest directly in an index. Index returns do not include fees or expenses.
The S&P 500 Index is widely regarded as the best single gauge of the U.S. equities market. This index includes a representative sample of 500 leading companies in leading
industries of the U.S. economy. Although the S&P 500 Index focuses on the large-cap segment of the market, with approximately 75% coverage of U.S. equities, it is also an ideal
proxy for the total market.
The Russell 1000 Growth Index measures the performance of those Russell 1000 companies with higher price-to-book ratios and higher forecasted growth values.
The Russell 1000 Value Index measures the performance of those Russell 1000 companies with lower price-to-book ratios and lower forecasted growth values.
The Russell 2000 Index measures the performance of the 2,000 smallest companies in the Russell 3000 Index
The MSCI EAFE Index (Europe, Australia, Far East) is a widely recognized benchmark in the United States to measure international equity performance. It comprises 21 MSCI
country indexes, representing the developed markets outside of North America.
The MSCI Emerging Markets Indexsm is a free float-adjusted market capitalization index that is designed to measure equity market performance in the global emerging markets.
The Index consists of the following 25 emerging market country indices: Argentina, Brazil, Chile, China, Columbia, Czech Republic, Egypt, Hungary, India, Indonesia, Israel, Jordan,
Korea, Malaysia, Mexico, Morocco, Pakistan, Peru, Philippines, Poland, Russia, South Africa, Taiwan, Thailand, and Turkey.
The MSCI Europe Indexsm is a free float-adjusted market capitalization index designed to measure developed market equity performance in Europe. The Index consists of the
following developed market country indices: Austria, Belgium, Denmark, Finland, France, Germany, Greece, Ireland, Italy, the Netherlands, Norway, Portugal, Spain, Sweden,
Switzerland, and the United Kingdom.
The MSCI Pacific Indexsm is a free float-adjusted market capitalization index designed to measure equity market performance in the Pacific region. The Index consists of the
following developed market countries: Australia, Hong Kong, Japan, New Zealand and Singapore.
The Lehman Brothers U.S. Aggregate Index represents securities that are SEC-registered, taxable, and dollar denominated. The Index covers the U.S. investment grade fixed
rate bond market, with index components for government and corporate securities, mortgage pass-through securities, and asset-backed securities. These major sectors are
subdivided into more specific indexes that are calculated and reported on a regular basis.
The U.S. Treasury Index is a component of the U.S. Government Index.
The Lehman Brothers High Yield Index covers the universe of fixed rate, non-investment grade debt. Pay-in-kind (PIK) bonds, Eurobonds, and debt issues from countries
designated as emerging markets (e.g., Argentina, Brazil, Venezuela, etc.) are excluded, but Canadian and global bonds (SEC registered) of issues in non-EMG countries are
included. Original issue zeroes, step-up coupon structures, and 144-As are also included.
The Lehman Brothers Emerging Markets Index includes USD-denominated debt from emerging markets in the following regions: Americas, Europe, Middle East, Africa, and Asia.
As with other fixed income benchmarks provided by Lehman Brothers, the index is rules-based, which allows for an unbiased view of the marketplace and easy replicability.
The Lehman Brother Corporate Bond Index is the Corporate component of the U.S. Credit Index.
The Lehman Brother TIPS Index consists of Inflation–Protection securities issued by the U.S. Treasury.
The NAREIT Equity REIT Index is designed to provide the most comprehensive assessment of overall industry performance, and includes all tax-qualified real estate investment
trusts (REITs) that are listed on the NYSE, the American Stock Exchange or the NASDAQ National Market List.
The CSFB Equity Market Neutral Index takes both long and short positions in stocks with the aim of minimizing exposure to the systematic risk of the market (i.e., a beta of zero).
This information is not intended to be used as investment advice. For information only related to a general overview of the market. For plan sponsor use only.

Diversified Plan - Portfolio Summary
September 30, 2009
Section 2
21
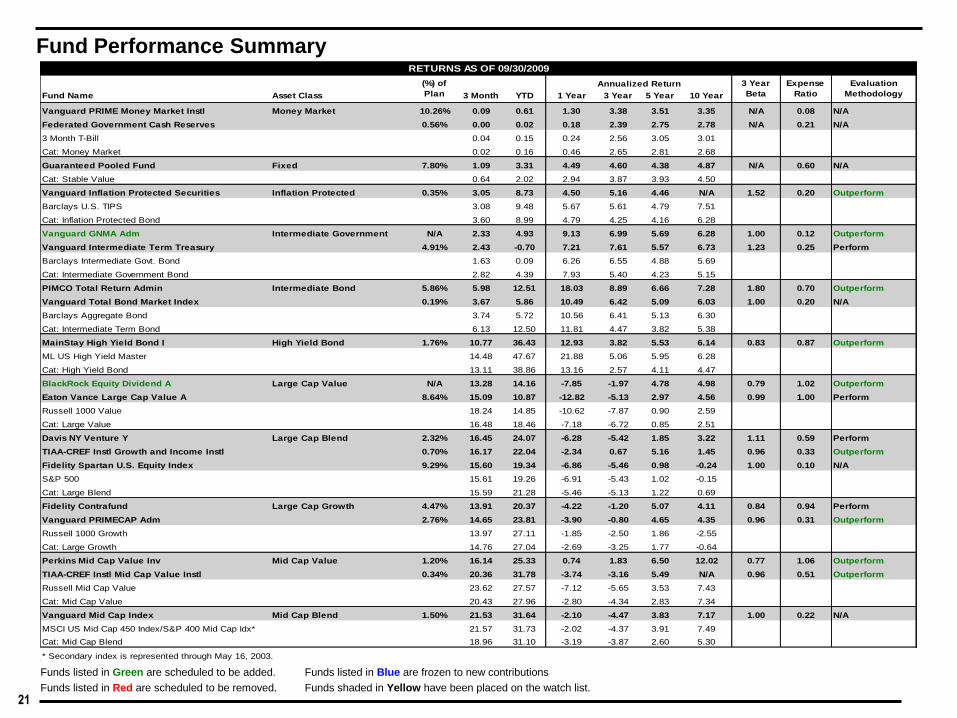
Fund Performance Summary
Funds listed in Green are scheduled to be added. Funds listed in Blue are frozen to new contributions
Funds listed in Red are scheduled to be removed. Funds shaded in Yellow have been placed on the watch list.
Fund Name Asset Class 3 Month YTD 1 Year 3 Year 5 Year 10 Year
Vanguard PRIME Money Market Instl Money Market 10.26% 0.09 0.61 1.30 3.38 3.51 3.35 N/A 0.08 N/A
Federated Government Cash Reserves 0.56% 0.00 0.02 0.18 2.39 2.75 2.78 N/A 0.21 N/A
3 Month T-Bill 0.04 0.15 0.24 2.56 3.05 3.01
Cat: Money Market 0.02 0.16 0.46 2.65 2.81 2.68
Guaranteed Pooled Fund Fixed 7.80% 1.09 3.31 4.49 4.60 4.38 4.87 N/A 0.60 N/A
Cat: Stable Value 0.64 2.02 2.94 3.87 3.93 4.50
Vanguard Inflation Protected Securities Inflation Protected 0.35% 3.05 8.73 4.50 5.16 4.46 N/A 1.52 0.20 Outperform
Barclays U.S. TIPS 3.08 9.48 5.67 5.61 4.79 7.51
Cat: Inflation Protected Bond 3.60 8.99 4.79 4.25 4.16 6.28
Vanguard GNMA Adm Intermediate Government N/A 2.33 4.93 9.13 6.99 5.69 6.28 1.00 0.12 Outperform
Vanguard Intermediate Term Treasury 4.91% 2.43 -0.70 7.21 7.61 5.57 6.73 1.23 0.25 Perform
Barclays Intermediate Govt. Bond 1.63 0.09 6.26 6.55 4.88 5.69
Cat: Intermediate Government Bond 2.82 4.39 7.93 5.40 4.23 5.15
PIMCO Total Return Admin Intermediate Bond 5.86% 5.98 12.51 18.03 8.89 6.66 7.28 1.80 0.70 Outperform
Vanguard Total Bond Market Index 0.19% 3.67 5.86 10.49 6.42 5.09 6.03 1.00 0.20 N/A
Barclays Aggregate Bond 3.74 5.72 10.56 6.41 5.13 6.30
Cat: Intermediate Term Bond 6.13 12.50 11.81 4.47 3.82 5.38
MainStay High Yield Bond I High Yield Bond 1.76% 10.77 36.43 12.93 3.82 5.53 6.14 0.83 0.87 Outperform
ML US High Yield Master 14.48 47.67 21.88 5.06 5.95 6.28
Cat: High Yield Bond 13.11 38.86 13.16 2.57 4.11 4.47
BlackRock Equity Dividend A Large Cap Value N/A 13.28 14.16 -7.85 -1.97 4.78 4.98 0.79 1.02 Outperform
Eaton Vance Large Cap Value A 8.64% 15.09 10.87 -12.82 -5.13 2.97 4.56 0.99 1.00 Perform
Russell 1000 Value 18.24 14.85 -10.62 -7.87 0.90 2.59
Cat: Large Value 16.48 18.46 -7.18 -6.72 0.85 2.51
Davis NY Venture Y Large Cap Blend 2.32% 16.45 24.07 -6.28 -5.42 1.85 3.22 1.11 0.59 Perform
TIAA-CREF Instl Growth and Income Instl 0.70% 16.17 22.04 -2.34 0.67 5.16 1.45 0.96 0.33 Outperform
Fidelity Spartan U.S. Equity Index 9.29% 15.60 19.34 -6.86 -5.46 0.98 -0.24 1.00 0.10 N/A
S&P 500 15.61 19.26 -6.91 -5.43 1.02 -0.15
Cat: Large Blend 15.59 21.28 -5.46 -5.13 1.22 0.69
Fidelity Contrafund Large Cap Growth 4.47% 13.91 20.37 -4.22 -1.20 5.07 4.11 0.84 0.94 Perform
Vanguard PRIMECAP Adm 2.76% 14.65 23.81 -3.90 -0.80 4.65 4.35 0.96 0.31 Outperform
Russell 1000 Growth 13.97 27.11 -1.85 -2.50 1.86 -2.55
Cat: Large Growth 14.76 27.04 -2.69 -3.25 1.77 -0.64
Perkins Mid Cap Value Inv Mid Cap Value 1.20% 16.14 25.33 0.74 1.83 6.50 12.02 0.77 1.06 Outperform
TIAA-CREF Instl Mid Cap Value Instl 0.34% 20.36 31.78 -3.74 -3.16 5.49 N/A 0.96 0.51 Outperform
Russell Mid Cap Value 23.62 27.57 -7.12 -5.65 3.53 7.43
Cat: Mid Cap Value 20.43 27.96 -2.80 -4.34 2.83 7.34
Vanguard Mid Cap Index Mid Cap Blend 1.50% 21.53 31.64 -2.10 -4.47 3.83 7.17 1.00 0.22 N/A
MSCI US Mid Cap 450 Index/S&P 400 Mid Cap Idx* 21.57 31.73 -2.02 -4.37 3.91 7.49
Cat: Mid Cap Blend 18.96 31.10 -3.19 -3.87 2.60 5.30
* Secondary index is represented through May 16, 2003.
Evaluation
Methodology
Annualized Return Expense
Ratio
RETURNS AS OF 09/30/2009
3 Year
Beta
(%) of
Plan

22
Fund Performance Summary (continued)
- 3 Yr Beta is run against the Morningstar Best Fit Index
Funds listed in Green are scheduled to be added. Funds listed in Blue are frozen to new contributions
Funds listed in Red are scheduled to be removed. Funds shaded in Yellow have been placed on the watch list.
Fund Name Asset Class 3 Month YTD 1 Year 3 Year 5 Year 10 Year
Munder Mid-Cap Core Growth A Mid Cap Growth 1.52% 16.41 25.53 -6.22 -3.16 3.71 9.16 0.92 1.35 Perform
Russell Mid Cap Growth 17.58 37.12 -0.40 -3.10 3.75 2.18
Cat: Mid Cap Growth 17.13 31.56 -3.10 -2.83 3.14 2.88
Allianz NFJ Small Cap Value Inst Small Value 0.69% 16.10 17.44 -7.15 0.09 6.45 11.19 0.80 0.82 Outperform
Russell 2000 Value Index 22.70 16.36 -12.61 -6.65 1.78 8.05
Cat: Small Cap Value 21.32 25.83 -6.39 -4.72 2.30 8.34
Lord Abbett Small Cap Value A Small Blend 0.49% 16.97 22.16 -7.30 -0.48 7.18 11.98 0.87 1.23 Outperform
Russell 2000 Index 19.28 22.43 -9.55 -4.57 2.41 4.88
Cat: Small Cap Blend 19.04 26.20 -6.97 -5.19 2.02 6.79
Vanguard Small Cap Index 1.95% 21.84 30.79 -4.08 -2.83 3.66 5.72 1.00 0.23 N/A
MSCI US Small Cap 1750 Index/Russell 2000 Idx* 21.86 30.78 -4.20 -2.86 3.67 5.77
Cat: Small Cap Blend 19.04 26.20 -6.97 -5.19 2.02 6.79
Royce Value Plus Instl Small Growth 1.74% 18.23 37.52 -2.27 -2.41 5.16 N/A 0.99 1.04 Outperform
Russell 2000 Growth 15.95 29.12 -6.32 -2.60 2.91 1.10
Cat: Small Cap Growth 16.50 29.27 -5.25 -4.00 1.94 2.97
American Funds New Perspective R4 Global 0.85% 18.65 30.50 4.67 0.56 7.08 5.49 0.90 0.75 Outperform
Mutual Discovery Z 0.71% 9.46 17.96 3.52 1.66 9.05 9.86 0.50 1.02 Outperform
MSCI WORLD 17.45 24.90 -2.29 -4.35 3.51 0.92
Cat: World Stock 17.15 28.88 0.64 -3.23 4.37 3.08
American Funds EuroPacific Growth R4 Foreign Large Equity 2.47% 19.53 34.58 8.59 1.11 9.77 6.00 0.86 0.82 Outperform
Fidelity Spartan International Index 1.87% 19.32 25.79 1.80 -3.44 6.11 2.46 1.03 0.10 N/A
MSCI EAFE ND 19.47 28.97 3.21 -3.60 6.07 2.53
Cat: Foreign Large Equity 18.69 28.77 1.49 -3.71 5.79 3.01
BlackRock International Opportunities A Foreign Small / Mid Equity 1.14% 17.36 33.48 6.54 0.95 12.97 14.14 1.08 1.58 Outperform
MSCI EAFE ND 19.47 28.97 3.21 -3.60 6.07 2.53
Cat: Foreign Small / Mid Equity 20.71 42.51 9.09 -3.30 7.53 6.27
DFA Emerging Markets Value I Emerging Markets 2.74% 24.79 76.41 26.11 12.02 21.03 15.40 1.10 0.60 Outperform
MSCI EM ND 21.04 64.88 19.44 8.27 17.68 11.70
Cat: Diversified Emerging Markets 20.91 64.45 19.07 7.95 17.31 11.38
AIM Real Estate Instl Specialty - Real Estate 0.95% 32.16 19.96 -22.69 -10.38 3.82 11.32 0.86 0.83 Outperform
Dow Jones Wilshire REIT Index U.S. 35.44 17.65 -29.35 -13.73 1.15 9.72
Cat: Specialty - Real Estate 32.45 20.48 -25.86 -13.42 0.36 8.85
* Secondary index is represented through May 16, 2003.
Annualized Return Expense
Ratio
Evaluation
Methodology
RETURNS AS OF 09/30/09
3 Year
Beta
(%) of
Plan
23
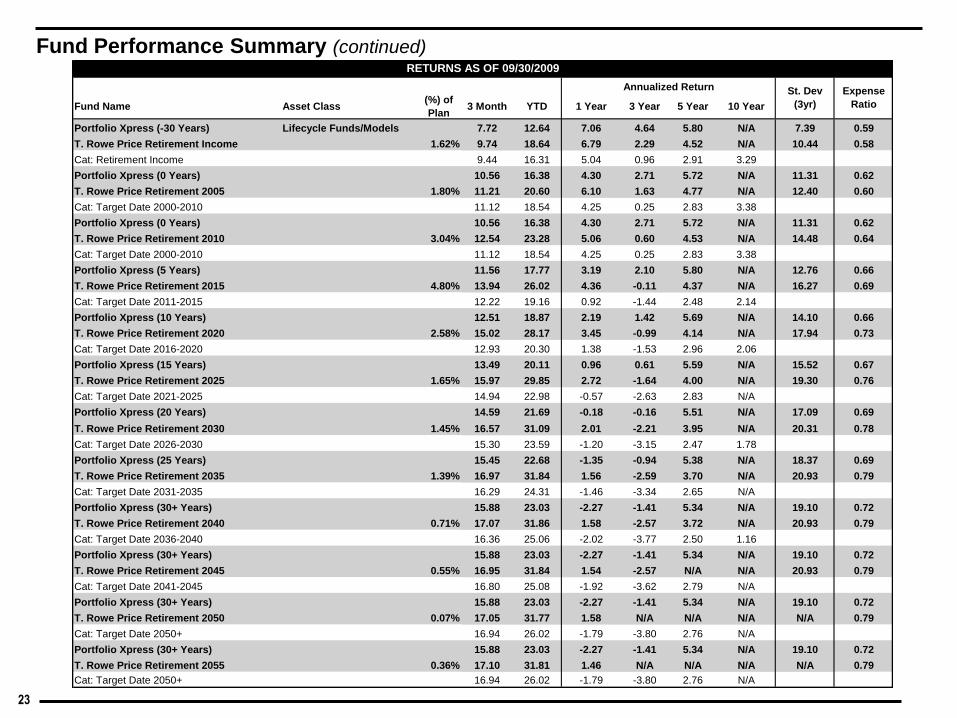
Fund Performance Summary (continued)
Fund Name Asset Class(%) of
Plan3 Month YTD 1 Year 3 Year 5 Year 10 Year
Portfolio Xpress (-30 Years) Lifecycle Funds/Models 7.72 12.64 7.06 4.64 5.80 N/A 7.39 0.59
T. Rowe Price Retirement Income 1.62% 9.74 18.64 6.79 2.29 4.52 N/A 10.44 0.58
Cat: Retirement Income 9.44 16.31 5.04 0.96 2.91 3.29
Portfolio Xpress (0 Years) 10.56 16.38 4.30 2.71 5.72 N/A 11.31 0.62
T. Rowe Price Retirement 2005 1.80% 11.21 20.60 6.10 1.63 4.77 N/A 12.40 0.60
Cat: Target Date 2000-2010 11.12 18.54 4.25 0.25 2.83 3.38
Portfolio Xpress (0 Years) 10.56 16.38 4.30 2.71 5.72 N/A 11.31 0.62
T. Rowe Price Retirement 2010 3.04% 12.54 23.28 5.06 0.60 4.53 N/A 14.48 0.64
Cat: Target Date 2000-2010 11.12 18.54 4.25 0.25 2.83 3.38
Portfolio Xpress (5 Years) 11.56 17.77 3.19 2.10 5.80 N/A 12.76 0.66
T. Rowe Price Retirement 2015 4.80% 13.94 26.02 4.36 -0.11 4.37 N/A 16.27 0.69
Cat: Target Date 2011-2015 12.22 19.16 0.92 -1.44 2.48 2.14
Portfolio Xpress (10 Years) 12.51 18.87 2.19 1.42 5.69 N/A 14.10 0.66
T. Rowe Price Retirement 2020 2.58% 15.02 28.17 3.45 -0.99 4.14 N/A 17.94 0.73
Cat: Target Date 2016-2020 12.93 20.30 1.38 -1.53 2.96 2.06
Portfolio Xpress (15 Years) 13.49 20.11 0.96 0.61 5.59 N/A 15.52 0.67
T. Rowe Price Retirement 2025 1.65% 15.97 29.85 2.72 -1.64 4.00 N/A 19.30 0.76
Cat: Target Date 2021-2025 14.94 22.98 -0.57 -2.63 2.83 N/A
Portfolio Xpress (20 Years) 14.59 21.69 -0.18 -0.16 5.51 N/A 17.09 0.69
T. Rowe Price Retirement 2030 1.45% 16.57 31.09 2.01 -2.21 3.95 N/A 20.31 0.78
Cat: Target Date 2026-2030 15.30 23.59 -1.20 -3.15 2.47 1.78
Portfolio Xpress (25 Years) 15.45 22.68 -1.35 -0.94 5.38 N/A 18.37 0.69
T. Rowe Price Retirement 2035 1.39% 16.97 31.84 1.56 -2.59 3.70 N/A 20.93 0.79
Cat: Target Date 2031-2035 16.29 24.31 -1.46 -3.34 2.65 N/A
Portfolio Xpress (30+ Years) 15.88 23.03 -2.27 -1.41 5.34 N/A 19.10 0.72
T. Rowe Price Retirement 2040 0.71% 17.07 31.86 1.58 -2.57 3.72 N/A 20.93 0.79
Cat: Target Date 2036-2040 16.36 25.06 -2.02 -3.77 2.50 1.16
Portfolio Xpress (30+ Years) 15.88 23.03 -2.27 -1.41 5.34 N/A 19.10 0.72
T. Rowe Price Retirement 2045 0.55% 16.95 31.84 1.54 -2.57 N/A N/A 20.93 0.79
Cat: Target Date 2041-2045 16.80 25.08 -1.92 -3.62 2.79 N/A
Portfolio Xpress (30+ Years) 15.88 23.03 -2.27 -1.41 5.34 N/A 19.10 0.72
T. Rowe Price Retirement 2050 0.07% 17.05 31.77 1.58 N/A N/A N/A N/A 0.79
Cat: Target Date 2050+ 16.94 26.02 -1.79 -3.80 2.76 N/A
Portfolio Xpress (30+ Years) 15.88 23.03 -2.27 -1.41 5.34 N/A 19.10 0.72
T. Rowe Price Retirement 2055 0.36% 17.10 31.81 1.46 N/A N/A N/A N/A 0.79
Cat: Target Date 2050+ 16.94 26.02 -1.79 -3.80 2.76 N/A
RETURNS AS OF 09/30/2009
Annualized Return Expense
Ratio
St. Dev
(3yr)

24
T. Rowe Price Retirement Funds - Qualitative Analysis
T. Rowe Price Retirement Funds
Provide Asset Allocation/Target Date
Services Since2002
Method of Investment Fund of Funds
Investment Strategy Active
# of Underlying Funds 17
# of Underlying Funds closed to new
investments0
# of Funds Avaliable 12
Holdings Subadvised or Cloned NO
Glide Path Static
Tactical Strategies Yes
Rebalance Trigger 5%
Glide Path Extension 30 years
Net Assets $23 billion
Alternative Asset Classes Emerging Markets/ World Bond / Emerging Markets Bond
T. Rowe Price Retirement Funds Asset Allocation
0%
10%
20%
30%
40%
50%
60%
70%
80%
90%
100%
2055
2050
2045
2040
2035
2030
2025
2020
2015
2010
2005
Inco
me
International Equity Domestic Equity Fixed Income

25
Portfolio XPress Allocation (Underlying Holdings)
Foreign Equity
0%
10%
20%
30%
40%
50%
60%
70%
80%
90%
100%
40 35 30 25 20 15 10 5 0 Income
Years Until Retirement
Portfolio Xpress T. Row e Price Wells Fargo MSTAR Category
Domestic Equity
0%
10%
20%
30%
40%
50%
60%
70%
80%
90%
100%
40 35 30 25 20 15 10 5 0 Income
Years Until Retirement
Portfolio Xpress T. Row e Price Wells Fargo MSTAR Category
Fixed Income
0%
10%
20%
30%
40%
50%
60%
70%
80%
90%
100%
40 35 30 25 20 15 10 5 0 Income
Years Until Retirement
Portfolio Xpress T. Row e Price Wells Fargo MSTAR Category
Domestic Equity
0%
10%
20%
30%
40%
50%
60%
70%
80%
90%
100%
40 35 30 25 20 15 10 5 0 Income
Years Until Retirement
Portfolio Xpress
T. Row e Price
Wells Fargo (Conservative Target Date)
MSTAR Category

26
Quantitative Analysis Summary
0%
25%
50%
100%
4.44%
Top
Possible
Score
95.56%
Lowest
Possible
Score
Outp
erf
orm
Pe
rfo
rmU
nde
rpe
rfo
rm
Fund Name Fund Category
Fund
Wgt* 3Q09 2Q09 1Q09 4Q08
3 Year
Average
Fund Score
Vanguard Inflation Protected Securities Inflation Protected 0.35% 24.87 21.87 20.00 22.00 18.78
Barclays U.S. TIPS
Vanguard GNMA Adm Intermediate Govt 0.00% 17.13 17.22 17.00 16.84 16.68
Vanguard Intermediate Term Treasury 4.91% 28.13 28.24 23.68 21.46 21.46
Barclays Int Govt Bond
PIMCO Total Return Admin Intermediate Bond 5.86% 12.29 13.01 11.90 12.41 12.41
Barclays Aggregate Bond
MainStay High Yield Bond I High Yield Bond 1.76% 23.49 21.31 21.94 22.13 22.13
ML US High Yield Master
BlackRock Equity Dividend A Large Value 0.00% 22.80 22.24 21.91 22.29 24.43
Eaton Vance Large Cap Value A 8.64% 26.51 22.38 20.10 18.59 18.59
Russell 1000 Value
Davis NY Venture Y Large Blend 2.32% 25.31 26.04 30.11 31.09 31.09
TIAA-CREF Growth and Income Instl 0.70% 24.79 23.30 23.70 24.74 24.74
S&P 500 Index
Fidelity Contrafund Large Growth 4.47% 25.12 25.57 22.89 24.07 24.07
Vanguard PRIMECAP Adm 2.76% 19.19 18.85 17.35 16.69 16.69
Russell 1000 Growth
Perkins Mid Cap Value Inv Mid Cap Value 1.20% 19.72 16.40 15.75 16.18 16.18
TIAA-CREF Mid Cap Value Instl 0.34% 22.21 21.30 21.32 23.97 23.97
Russell Mid Cap Value
Munder Mid-Cap Core Growth A Mid Cap Growth 1.52% 32.97 31.86 28.89 26.63 26.63
Russell Mid Cap Growth
Allianz NFJ Small Cap Value Instl Small Cap Value 0.69% 21.83 20.84 19.43 19.80 19.80
Russell 2000 Value
Lord Abbett Small Cap Value A Small Cap Blend 0.49% 22.29 21.73 19.42 19.37 22.42
Russell 2000 Index
Royce Value Plus Instl Small Cap Growth 1.74% 19.57 17.44 19.24 19.31 19.31
Russell 2000 Growth
American Funds New Perspective R4 World Stock 0.85% 23.69 23.78 22.48 25.23 25.23
Mutual Discovery Z 0.71% 20.43 18.35 17.91 17.51 17.51
MSCI World
American Funds EuroPacific Growth R4 Foreign Large Equity 2.47% 17.23 16.44 15.70 17.89 17.89
MSCI EAFE
BlackRock International Opportunities A Foreign Sm/Mid Equity 1.14% 16.40 13.86 15.63 15.50 15.50
MSCI EAFE
DFA Emerging Markets Value I Emerging Markets 2.74% 11.99 10.96 11.29 11.54 11.54
MSCI EAFE
AIM Real Estate Instl Specialty-Real Estate 0.95% 16.46 18.27 13.97 15.34 15.34
DJ Wilshire REIT Index
PLAN WEIGHTED SCORE: 21.78 20.81 19.93 19.22
*Fund w eightings are remeasured by assigning a proportionate w eighting to each fund included in the Evaluation Methodology Score.
EVALUATION METHODOLOGY SCORE

27
0%
25%
50%
100%
4.44%
Top
Possible
Score
95.56%
Lowest
Possible
Score
Ou
tpe
rfo
rmP
erf
orm
Un
de
rpe
rfo
rm
Vanguard Inflation Prot Securities
Ranking vs. Peers - Inflation Protected Bond
Inflation Protected Bond Universe = 152 Funds 9/30/2009
Total Return 36.20%
10 Year NA
5 Year 32.00%
3 year 39.00%
Rolling 12-month - 10 years 8.00%
Rolling 36-Month - 10 years 13.00%
Sharpe Ratio 34.60%
10 Year NA
5 Year 28.00%
3 year 39.00%
Information Ratio 35.00%
10 Year NA
5 Year 32.00%
3 year 37.00%
Up Capture Ratio - 10 years 23.00%
Down Capture Ratio - 10 years 34.00%
Style Consistency to Benchmark - Lehman US TIPS Index 20.00%
R2 20.00%
Avg Credit Quality 20.00%
Expense Ratio 0.20 20.00%
Total Average Ranking 24.87%STATUS OUTPERFORM
Total Average Ranking
Performance Ranking
Ratio Statistics
Style Consistency
Fund Expense

28
0%
25%
50%
100%
4.44%
Top
Possible
Score
95.56%
Lowest
Possible
Score
Ou
tpe
rfo
rmP
erf
orm
Un
de
rpe
rfo
rm
Vanguard GNMA Adm
Ranking vs. Peers - Intermediate Govt Bond
Intermediate Govt Bond Universe = 447 Funds 9/30/2009
Total Return 9.50%
10 Year 5.00%
5 Year 5.00%
3 Year 14.00%
Rolling 12-month - 10 years 2.00%
Rolling 36-Month - 10 years 4.00%
Sharpe Ratio 3.90%
10 Year 4.00%
5 Year 2.00%
3 Year 5.00%
Information Ratio 6.80%
10 Year 7.00%
5 Year 3.00%
3 Year 9.00%
Up Capture Ratio - 10 years 46.00%
Down Capture Ratio - 10 years 22.00%
Style Consistency to Benchmark - Lehman US Intermediate Govt Index 40.00%
R2 60.00%
Avg Credit Quality 20.00%
Expense Ratio 0.12 20.00%
Total Average Ranking 17.13%STATUS OUTPERFORM
Total Average Ranking
Performance Ranking
Ratio Statistics
Style Consistency
Fund Expense
29
0%
25%
50%
100%
4.44%
Top
Possible
Score
95.56%
Lowest
Possible
Score
Ou
tpe
rfo
rmP
erf
orm
Un
de
rpe
rfo
rm
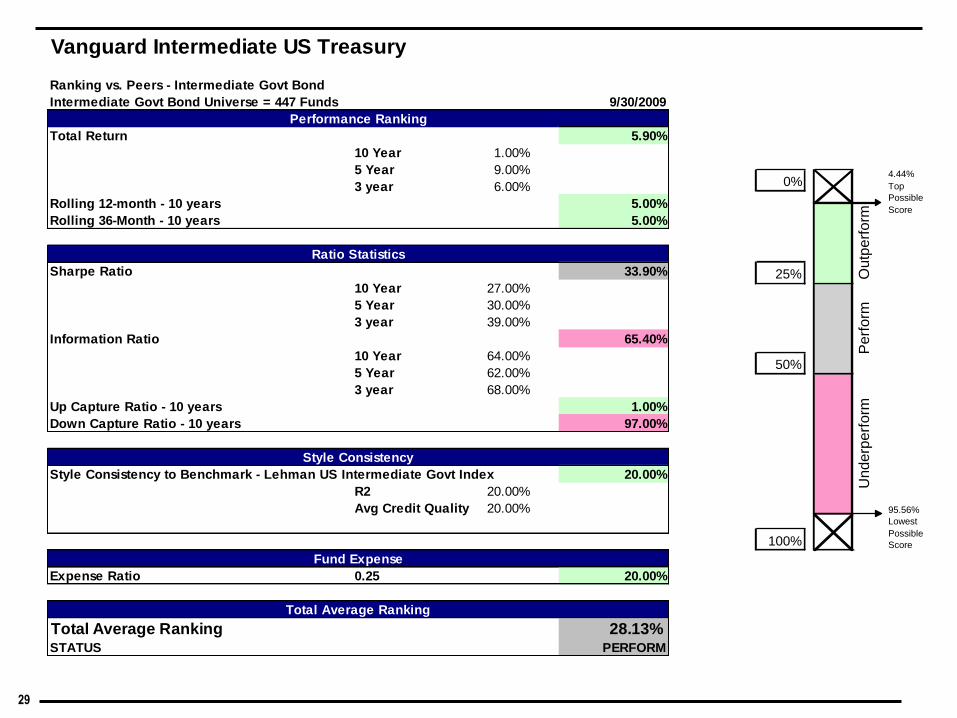
Vanguard Intermediate US Treasury
Ranking vs. Peers - Intermediate Govt Bond
Intermediate Govt Bond Universe = 447 Funds 9/30/2009
Total Return 5.90%
10 Year 1.00%
5 Year 9.00%
3 year 6.00%
Rolling 12-month - 10 years 5.00%
Rolling 36-Month - 10 years 5.00%
Sharpe Ratio 33.90%
10 Year 27.00%
5 Year 30.00%
3 year 39.00%
Information Ratio 65.40%
10 Year 64.00%
5 Year 62.00%
3 year 68.00%
Up Capture Ratio - 10 years 1.00%
Down Capture Ratio - 10 years 97.00%
Style Consistency to Benchmark - Lehman US Intermediate Govt Index 20.00%
R2 20.00%
Avg Credit Quality 20.00%
Expense Ratio 0.25 20.00%
Total Average Ranking 28.13%STATUS PERFORM
Total Average Ranking
Performance Ranking
Ratio Statistics
Style Consistency
Fund Expense

30
0%
25%
50%
100%
4.44%
Top
Possible
Score
95.56%
Lowest
Possible
Score
Ou
tpe
rfo
rmP
erf
orm
Un
de
rpe
rfo
rm
PIMCO Total Return Admin
Ranking vs. Peers - Intermediate Bond
Intermediate Bond Universe = 1307 Funds 9/30/2009
Total Return 1.70%
10 Year 3.00%
5 Year 2.00%
3 year 1.00%
Rolling 12-month - 10 years 2.00%
Rolling 36-Month - 10 years 2.00%
Sharpe Ratio 1.20%
10 Year 2.00%
5 Year 1.00%
3 year 1.00%
Information Ratio 5.70%
10 Year 5.00%
5 Year 4.00%
3 year 7.00%
Up Capture Ratio - 10 years 8.00%
Down Capture Ratio - 10 years 30.00%
Style Consistency to Benchmark - Lehman US Aggregate Bond Index 40.00%
R2 60.00%
Avg Credit Quality 20.00%
Expense Ratio 0.70 20.00%
Total Average Ranking 12.29%STATUS OUTPERFORM
Total Average Ranking
Performance Ranking
Ratio Statistics
Style Consistency
Fund Expense

31
0%
25%
50%
100%
4.44%
Top
Possible
Score
95.56%
Lowest
Possible
Score
Ou
tpe
rfo
rmP
erf
orm
Un
de
rpe
rfo
rm
MainStay High Yield Bond I
Ranking vs. Peers - High Yield Bond
High Yield Bond Universe = 631 Funds 9/30/2009
Total Return 24.20%
10 Year 11.00%
5 Year 15.00%
3 year 35.00%
Rolling 12-month - 10 years 9.00%
Rolling 36-Month - 10 years 6.00%
Sharpe Ratio 27.70%
10 Year 24.00%
5 Year 23.00%
3 year 32.00%
Information Ratio 30.50%
10 Year 25.00%
5 Year 25.00%
3 year 36.00%
Up Capture Ratio - 10 years 33.00%
Down Capture Ratio - 10 years 31.00%
Style Consistency to Benchmark - Merrill Lynch High Yield US Master 30.00%
R2 40.00%
Avg Credit Quality 20.00%
Expense Ratio 0.87 20.00%
Total Average Ranking 23.49%STATUS OUTPERFORM
Total Average Ranking
Performance Ranking
Ratio Statistics
Style Consistency
Fund Expense

32
0%
25%
50%
100%
4.44%
Top
Possible
Score
95.56%
Lowest
Possible
Score
Ou
tpe
rfo
rmP
erf
orm
Un
de
rpe
rfo
rm
BlackRock Equity Dividend A
Ranking vs. Peers - Large Cap Value
Large Cap Value Universe = 1530 Funds 9/30/2009
Total Return 4.40%
10 Year 13.00%
5 Year 1.00%
3 year 3.00%
Rolling 12-month - 10 years 3.00%
Rolling 36-Month - 10 years 2.00%
Sharpe Ratio 19.40%
10 Year 22.00%
5 Year 20.00%
3 year 18.00%
Information Ratio 18.40%
10 Year 18.00%
5 Year 21.00%
3 year 17.00%
Up Capture Ratio - 10 years 73.00%
Down Capture Ratio - 10 years 5.00%
Style Consistency to Benchmark - Russell 1000 Value 40.00%
R2 40.00%
Return Style 60.00%
Holding Style 20.00%
Expense Ratio 1.02 40.00%
Total Average Ranking 22.80%STATUS OUTPERFORM
Total Average Ranking
Performance Ranking
Ratio Statistics
Style Consistency
Fund Expense
33
0%
25%
50%
100%
4.44%
Top
Possible
Score
95.56%
Lowest
Possible
Score
Ou
tpe
rfo
rmP
erf
orm
Un
de
rpe
rfo
rm
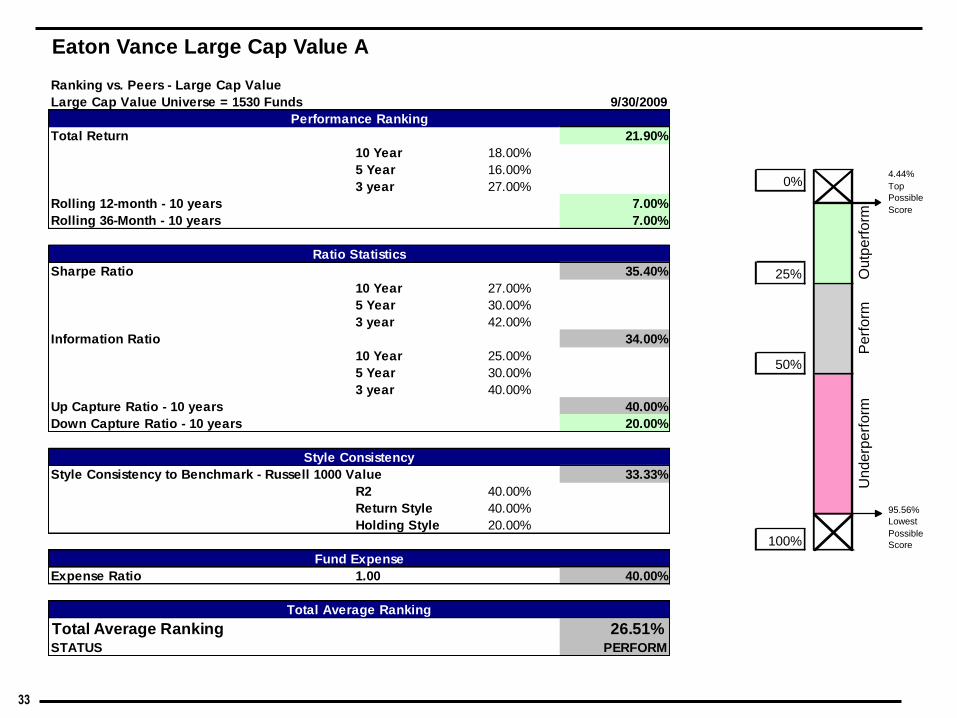
Eaton Vance Large Cap Value A
Ranking vs. Peers - Large Cap Value
Large Cap Value Universe = 1530 Funds 9/30/2009
Total Return 21.90%
10 Year 18.00%
5 Year 16.00%
3 year 27.00%
Rolling 12-month - 10 years 7.00%
Rolling 36-Month - 10 years 7.00%
Sharpe Ratio 35.40%
10 Year 27.00%
5 Year 30.00%
3 year 42.00%
Information Ratio 34.00%
10 Year 25.00%
5 Year 30.00%
3 year 40.00%
Up Capture Ratio - 10 years 40.00%
Down Capture Ratio - 10 years 20.00%
Style Consistency to Benchmark - Russell 1000 Value 33.33%
R2 40.00%
Return Style 40.00%
Holding Style 20.00%
Expense Ratio 1.00 40.00%
Total Average Ranking 26.51%STATUS PERFORM
Total Average Ranking
Performance Ranking
Ratio Statistics
Style Consistency
Fund Expense
34
0%
25%
50%
100%
4.44%
Top
Possible
Score
95.56%
Lowest
Possible
Score
Ou
tpe
rfo
rmP
erf
orm
Un
de
rpe
rfo
rm
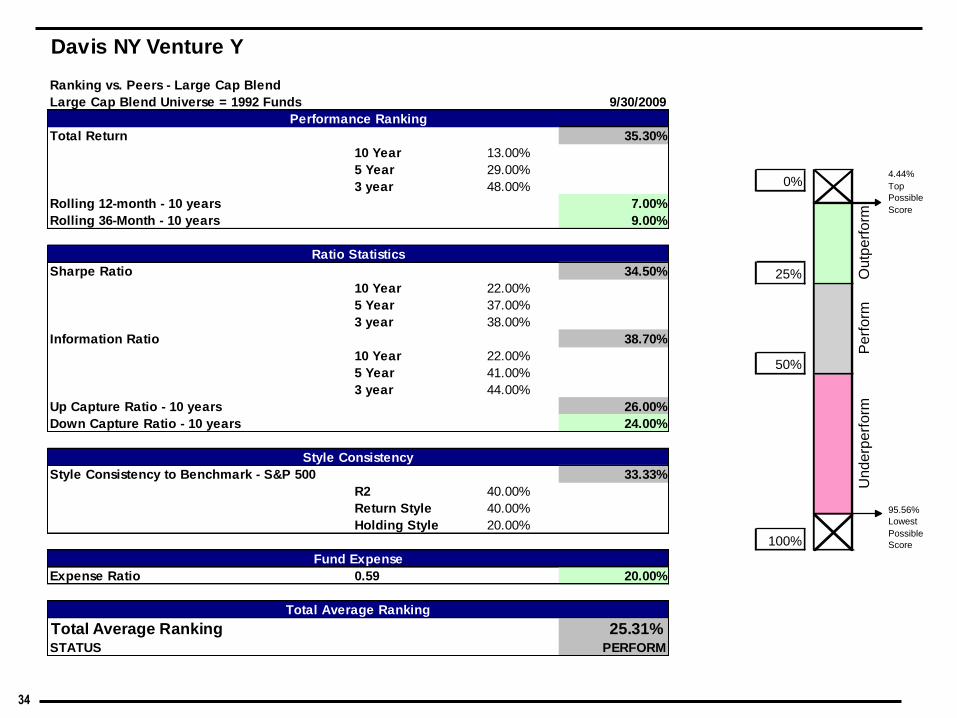
Davis NY Venture Y
Ranking vs. Peers - Large Cap Blend
Large Cap Blend Universe = 1992 Funds 9/30/2009
Total Return 35.30%
10 Year 13.00%
5 Year 29.00%
3 year 48.00%
Rolling 12-month - 10 years 7.00%
Rolling 36-Month - 10 years 9.00%
Sharpe Ratio 34.50%
10 Year 22.00%
5 Year 37.00%
3 year 38.00%
Information Ratio 38.70%
10 Year 22.00%
5 Year 41.00%
3 year 44.00%
Up Capture Ratio - 10 years 26.00%
Down Capture Ratio - 10 years 24.00%
Style Consistency to Benchmark - S&P 500 33.33%
R2 40.00%
Return Style 40.00%
Holding Style 20.00%
Expense Ratio 0.59 20.00%
Total Average Ranking 25.31%STATUS PERFORM
Total Average Ranking
Performance Ranking
Ratio Statistics
Style Consistency
Fund Expense

35
0%
25%
50%
100%
4.44%
Top
Possible
Score
95.56%
Lowest
Possible
Score
Ou
tpe
rfo
rmP
erf
orm
Un
de
rpe
rfo
rm
TIAA-CREF Growth and Income Instl
Ranking vs. Peers - Large Cap Blend
Large Cap Blend Universe = 1992 Funds 9/30/2009
Total Return 7.80%
10 Year 32.00%
5 Year 3.00%
3 Year 1.00%
Rolling 12-month - 10 years 28.00%
Rolling 36-Month - 10 years 30.00%
Sharpe Ratio 20.60%
10 Year 39.00%
5 Year 21.00%
3 Year 13.00%
Information Ratio 21.00%
10 Year 37.00%
5 Year 22.00%
3 Year 14.00%
Up Capture Ratio - 10 years 34.00%
Down Capture Ratio - 10 years 35.00%
Style Consistency to Benchmark - S&P 500 26.67%
R2 20.00%
Return Style 20.00%
Holding Style 40.00%
Expense Ratio 0.33 20.00%
Total Average Ranking 24.79%STATUS OUTPERFORM
Total Average Ranking
Performance Ranking
Ratio Statistics
Style Consistency
Fund Expense

36
0%
25%
50%
100%
4.44%
Top
Possible
Score
95.56%
Lowest
Possible
Score
Ou
tpe
rfo
rmP
erf
orm
Un
de
rpe
rfo
rm
Fidelity Contrafund
Ranking vs. Peers - Large Cap Growth
Large Cap Growth Universe = 2170 Funds 9/30/2009
Total Return 12.60%
10 Year 5.00%
5 Year 7.00%
3 year 19.00%
Rolling 12-month - 10 years 0.00%
Rolling 36-Month - 10 years 0.00%
Sharpe Ratio 28.30%
10 Year 10.00%
5 Year 26.00%
3 year 37.00%
Information Ratio 25.50%
10 Year 6.00%
5 Year 26.00%
3 year 33.00%
Up Capture Ratio - 10 years 91.00%
Down Capture Ratio - 10 years 2.00%
Style Consistency to Benchmark - Russell 1000 Growth 46.67%
R2 60.00%
Return Style 60.00%
Holding Style 20.00%
Expense Ratio 0.94 20.00%
Total Average Ranking 25.12%STATUS PERFORM
Total Average Ranking
Performance Ranking
Ratio Statistics
Style Consistency
Fund Expense

37
0%
25%
50%
100%
4.44%
Top
Possible
Score
95.56%
Lowest
Possible
Score
Ou
tpe
rfo
rmP
erf
orm
Un
de
rpe
rfo
rm
Vanguard PRIMECAP Adm
Ranking vs. Peers - Large Cap Growth
Large Cap Growth Universe = 2170 Funds 9/30/2009
Total Return 11.30%
10 Year 3.00%
5 Year 9.00%
3 year 16.00%
Rolling 12-month - 10 years 1.00%
Rolling 36-Month - 10 years 1.00%
Sharpe Ratio 25.50%
10 Year 8.00%
5 Year 28.00%
3 year 31.00%
Information Ratio 25.20%
10 Year 9.00%
5 Year 28.00%
3 year 30.00%
Up Capture Ratio - 10 years 23.00%
Down Capture Ratio - 10 years 19.00%
Style Consistency to Benchmark - Russell 1000 Growth 46.67%
R2 40.00%
Return Style 80.00%
Holding Style 20.00%
Expense Ratio 0.31 20.00%
Total Average Ranking 19.19%STATUS OUTPERFORM
Total Average Ranking
Performance Ranking
Ratio Statistics
Style Consistency
Fund Expense
38
0%
25%
50%
100%
4.44%
Top
Possible
Score
95.56%
Lowest
Possible
Score
Ou
tpe
rfo
rmP
erf
orm
Un
de
rpe
rfo
rm
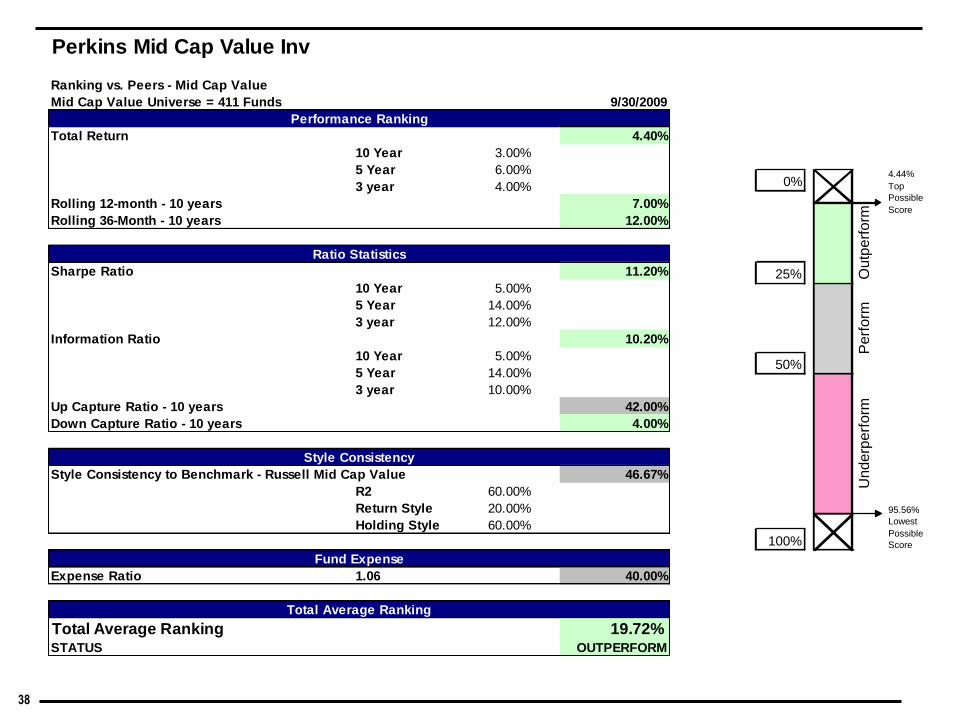
Perkins Mid Cap Value Inv
Ranking vs. Peers - Mid Cap Value
Mid Cap Value Universe = 411 Funds 9/30/2009
Total Return 4.40%
10 Year 3.00%
5 Year 6.00%
3 year 4.00%
Rolling 12-month - 10 years 7.00%
Rolling 36-Month - 10 years 12.00%
Sharpe Ratio 11.20%
10 Year 5.00%
5 Year 14.00%
3 year 12.00%
Information Ratio 10.20%
10 Year 5.00%
5 Year 14.00%
3 year 10.00%
Up Capture Ratio - 10 years 42.00%
Down Capture Ratio - 10 years 4.00%
Style Consistency to Benchmark - Russell Mid Cap Value 46.67%
R2 60.00%
Return Style 20.00%
Holding Style 60.00%
Expense Ratio 1.06 40.00%
Total Average Ranking 19.72%STATUS OUTPERFORM
Total Average Ranking
Performance Ranking
Ratio Statistics
Style Consistency
Fund Expense

39
0%
25%
50%
100%
4.44%
Top
Possible
Score
95.56%
Lowest
Possible
Score
Ou
tpe
rfo
rmP
erf
orm
Un
de
rpe
rfo
rm
TIAA-CREF Mid Cap Value Instl
Ranking vs. Peers - Mid Cap Value
Mid Cap Value Universe = 411 Funds 9/30/2009
Total Return 22.40%
10 Year NA
5 Year 14.00%
3 year 28.00%
Rolling 12-month - 10 years 2.00%
Rolling 36-Month - 10 years 3.00%
Sharpe Ratio 27.80%
10 Year NA
5 Year 20.00%
3 year 33.00%
Information Ratio 28.00%
10 Year NA
5 Year 22.00%
3 year 32.00%
Up Capture Ratio - 10 years 19.00%
Down Capture Ratio - 10 years 51.00%
Style Consistency to Benchmark - Russell Mid Cap Value 26.67%
R2 20.00%
Return Style 40.00%
Holding Style 20.00%
Expense Ratio 0.51 20.00%
Total Average Ranking 22.21%STATUS OUTPERFORM
Total Average Ranking
Performance Ranking
Ratio Statistics
Style Consistency
Fund Expense

40
0%
25%
50%
100%
4.44%
Top
Possible
Score
95.56%
Lowest
Possible
Score
Ou
tpe
rfo
rmP
erf
orm
Un
de
rpe
rfo
rm
Munder Mid Cap Core Growth A
Ranking vs. Peers - Mid Cap Growth
Mid Cap Growth Universe = 1080 Funds 9/30/2009
Total Return 43.80%
10 Year 5.00%
5 Year 46.00%
3 year 58.00%
Rolling 12-month - 10 years 3.00%
Rolling 36-Month - 10 years 5.00%
Sharpe Ratio 44.20%
10 Year 5.00%
5 Year 49.00%
3 year 57.00%
Information Ratio 44.70%
10 Year 6.00%
5 Year 50.00%
3 year 57.00%
Up Capture Ratio - 10 years 68.00%
Down Capture Ratio - 10 years 8.00%
Style Consistency to Benchmark - Russell Mid Cap Growth 40.00%
R2 60.00%
Return Style 40.00%
Holding Style 20.00%
Expense Ratio 1.35 40.00%
Total Average Ranking 32.97%STATUS PERFORM
Total Average Ranking
Performance Ranking
Ratio Statistics
Style Consistency
Fund Expense

41
0%
25%
50%
100%
4.44%
Top
Possible
Score
95.56%
Lowest
Possible
Score
Ou
tpe
rfo
rmP
erf
orm
Un
de
rpe
rfo
rm
Allianz NFJ Small Cap Value Instl
Ranking vs. Peers - Small Cap Value
Small Cap Value Universe = 423 Funds 9/30/2009
Total Return 8.40%
10 Year 7.00%
5 Year 5.00%
3 year 11.00%
Rolling 12-month - 10 years 2.00%
Rolling 36-Month - 10 years 1.00%
Sharpe Ratio 19.20%
10 Year 13.00%
5 Year 17.00%
3 year 23.00%
Information Ratio 16.90%
10 Year 13.00%
5 Year 16.00%
3 year 19.00%
Up Capture Ratio - 10 years 86.00%
Down Capture Ratio - 10 years 3.00%
Style Consistency to Benchmark - Russell 2000 Value 40.00%
R2 40.00%
Return Style 60.00%
Holding Style 20.00%
Expense Ratio 0.82 20.00%
Total Average Ranking 21.83%STATUS OUTPERFORM
Total Average Ranking
Performance Ranking
Ratio Statistics
Style Consistency
Fund Expense
42
0%
25%
50%
100%
4.44%
Top
Possible
Score
95.56%
Lowest
Possible
Score
Ou
tpe
rfo
rmP
erf
orm
Un
de
rpe
rfo
rm
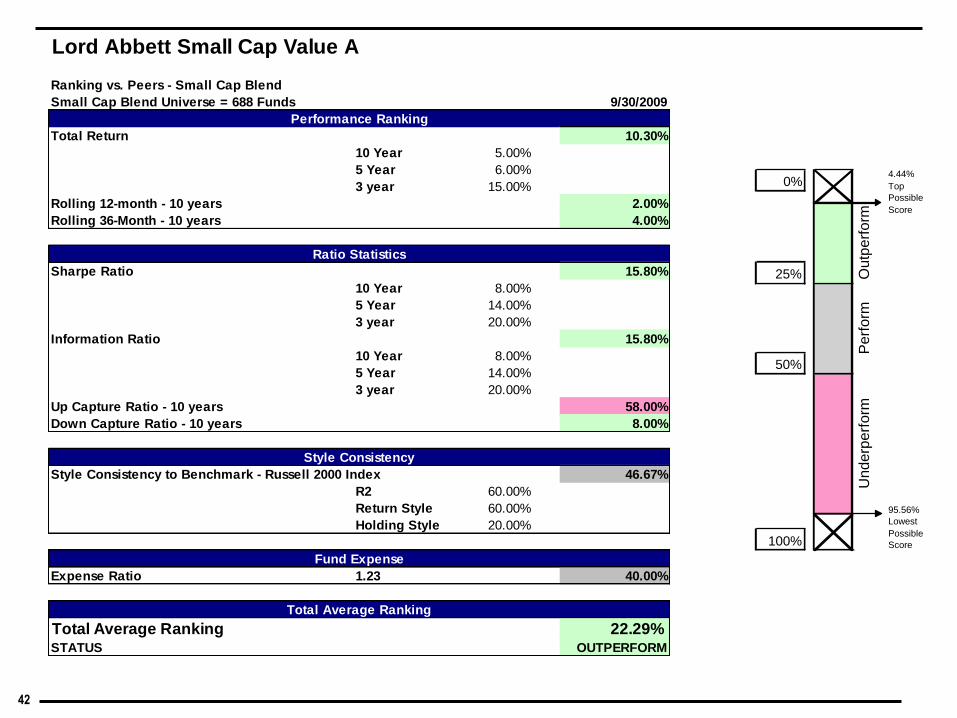
Lord Abbett Small Cap Value A
Ranking vs. Peers - Small Cap Blend
Small Cap Blend Universe = 688 Funds 9/30/2009
Total Return 10.30%
10 Year 5.00%
5 Year 6.00%
3 year 15.00%
Rolling 12-month - 10 years 2.00%
Rolling 36-Month - 10 years 4.00%
Sharpe Ratio 15.80%
10 Year 8.00%
5 Year 14.00%
3 year 20.00%
Information Ratio 15.80%
10 Year 8.00%
5 Year 14.00%
3 year 20.00%
Up Capture Ratio - 10 years 58.00%
Down Capture Ratio - 10 years 8.00%
Style Consistency to Benchmark - Russell 2000 Index 46.67%
R2 60.00%
Return Style 60.00%
Holding Style 20.00%
Expense Ratio 1.23 40.00%
Total Average Ranking 22.29%STATUS OUTPERFORM
Total Average Ranking
Performance Ranking
Ratio Statistics
Style Consistency
Fund Expense

43
0%
25%
50%
100%
4.44%
Top
Possible
Score
95.56%
Lowest
Possible
Score
Ou
tpe
rfo
rmP
erf
orm
Un
de
rpe
rfo
rm
Royce Value Plus Instl
Ranking vs. Peers - Small Cap Growth
Small Cap Growth Universe = 1006 Funds 9/30/2009
Total Return 25.20%
10 Year NA
5 Year 12.00%
3 year 34.00%
Rolling 12-month - 10 years 1.00%
Rolling 36-Month - 10 years 2.00%
Sharpe Ratio 32.20%
10 Year NA
5 Year 28.00%
3 year 35.00%
Information Ratio 35.40%
10 Year NA
5 Year 30.00%
3 year 39.00%
Up Capture Ratio - 10 years 12.00%
Down Capture Ratio - 10 years 15.00%
Style Consistency to Benchmark - Russell 2000 Growth 33.33%
R2 40.00%
Return Style 40.00%
Holding Style 20.00%
Expense Ratio 1.04 20.00%
Total Average Ranking 19.57%STATUS OUTPERFORM
Total Average Ranking
Performance Ranking
Ratio Statistics
Style Consistency
Fund Expense

44
0%
25%
50%
100%
4.44%
Top
Possible
Score
95.56%
Lowest
Possible
Score
Ou
tpe
rfo
rmP
erf
orm
Un
de
rpe
rfo
rm
American Funds New Perspective R4
Ranking vs. Peers - World Stock
World Stock Universe = 604 Funds 9/30/2009
Total Return 16.20%
10 Year 19.00%
5 Year 18.00%
3 year 14.00%
Rolling 12-month - 10 years 16.00%
Rolling 36-Month - 10 years 21.00%
Sharpe Ratio 24.00%
10 Year 26.00%
5 Year 26.00%
3 year 22.00%
Information Ratio 22.30%
10 Year 22.00%
5 Year 23.00%
3 year 22.00%
Up Capture Ratio - 10 years 39.00%
Down Capture Ratio - 10 years 31.00%
Style Consistency to Benchmark - MSCI The World Index NA
R2 NA
Return Style NA
Holding Style NA
Expense Ratio 0.75 20.00%
Total Average Ranking 23.69%STATUS OUTPERFORM
Total Average Ranking
Performance Ranking
Ratio Statistics
Style Consistency
Fund Expense

45
0%
25%
50%
100%
4.44%
Top
Possible
Score
95.56%
Lowest
Possible
Score
Ou
tpe
rfo
rmP
erf
orm
Un
de
rpe
rfo
rm
Mutual Discovery Z
Ranking vs. Peers - World Stock
World Stock Universe = 604 Funds 9/30/2009
Total Return 5.80%
10 Year 3.00%
5 Year 4.00%
3 year 8.00%
Rolling 12-month - 10 years 4.00%
Rolling 36-Month - 10 years 8.00%
Sharpe Ratio 17.80%
10 Year 1.00%
5 Year 12.00%
3 year 28.00%
Information Ratio 10.80%
10 Year 1.00%
5 Year 12.00%
3 year 14.00%
Up Capture Ratio - 10 years 96.00%
Down Capture Ratio - 10 years 1.00%
Style Consistency to Benchmark - MSCI The World Index NA
R2 NA
Return Style NA
Holding Style NA
Expense Ratio 1.02 20.00%
Total Average Ranking 20.43%STATUS OUTPERFORM
Total Average Ranking
Performance Ranking
Ratio Statistics
Style Consistency
Fund Expense

46
0%
25%
50%
100%
4.44%
Top
Possible
Score
95.56%
Lowest
Possible
Score
Ou
tpe
rfo
rmP
erf
orm
Un
de
rpe
rfo
rm
American Funds EuroPacific Growth R4
Ranking vs. Peers - Foreign Large Equity
Foreign Large Equity Universe = 1347 Funds 9/30/2009
Total Return 8.00%
10 Year 16.00%
5 Year 6.00%
3 year 6.00%
Rolling 12-month - 10 years 8.00%
Rolling 36-Month - 10 years 10.00%
Sharpe Ratio 21.10%
10 Year 24.00%
5 Year 21.00%
3 year 20.00%
Information Ratio 19.70%
10 Year 22.00%
5 Year 21.00%
3 year 18.00%
Up Capture Ratio - 10 years 36.00%
Down Capture Ratio - 10 years 15.00%
Style Consistency to Benchmark - MSCI EAFE NA
R2 NA
Return Style NA
Holding Style NA
Expense Ratio 0.82 20.00%
Total Average Ranking 17.23%STATUS OUTPERFORM
Total Average Ranking
Performance Ranking
Ratio Statistics
Style Consistency
Fund Expense

47
0%
25%
50%
100%
4.44%
Top
Possible
Score
95.56%
Lowest
Possible
Score
Ou
tpe
rfo
rmP
erf
orm
Un
de
rpe
rfo
rm
BlackRock Intl Opportunities A
Ranking vs. Peers - Foreign Large Equity
Foreign Large Equity Universe = 1347 Funds 9/30/2009
Total Return 4.30%
10 Year 0.00%
5 Year 1.00%
3 year 8.00%
Rolling 12-month - 10 years 1.00%
Rolling 36-Month - 10 years 1.00%
Sharpe Ratio 15.10%
10 Year 6.00%
5 Year 18.00%
3 year 17.00%
Information Ratio 16.80%
10 Year 8.00%
5 Year 19.00%
3 year 19.00%
Up Capture Ratio - 10 years 1.00%
Down Capture Ratio - 10 years 32.00%
Style Consistency to Benchmark - MSCI EAFE NA
R2 NA
Return Style NA
Holding Style NA
Expense Ratio 1.58 60.00%
Total Average Ranking 16.40%STATUS OUTPERFORM
Total Average Ranking
Performance Ranking
Ratio Statistics
Style Consistency
Fund Expense

48
0%
25%
50%
100%
4.44%
Top
Possible
Score
95.56%
Lowest
Possible
Score
Ou
tpe
rfo
rmP
erf
orm
Un
de
rpe
rfo
rm
DFA Emerging Markets Value I
Ranking vs. Peers - Emerging Markets
Emerging Markets Universe = 300 Funds 9/30/2009
Total Return 1.00%
10 Year 5.00%
5 Year 0.00%
3 year 0.00%
Rolling 12-month - 10 years 1.00%
Rolling 36-Month - 10 years 1.00%
Sharpe Ratio 11.20%
10 Year 16.00%
5 Year 15.00%
3 year 7.00%
Information Ratio 13.70%
10 Year 17.00%
5 Year 16.00%
3 year 11.00%
Up Capture Ratio - 10 years 25.00%
Down Capture Ratio - 10 years 23.00%
Style Consistency to Benchmark - MSCI EMF NA
R2 NA
Return Style NA
Holding Style NA
Expense Ratio 0.60 20.00%
Total Average Ranking 11.99%STATUS OUTPERFORM
Total Average Ranking
Performance Ranking
Ratio Statistics
Style Consistency
Fund Expense
49
0%
25%
50%
100%
4.44%
Top
Possible
Score
95.56%
Lowest
Possible
Score
Ou
tpe
rfo
rmP
erf
orm
Un
de
rpe
rfo
rm
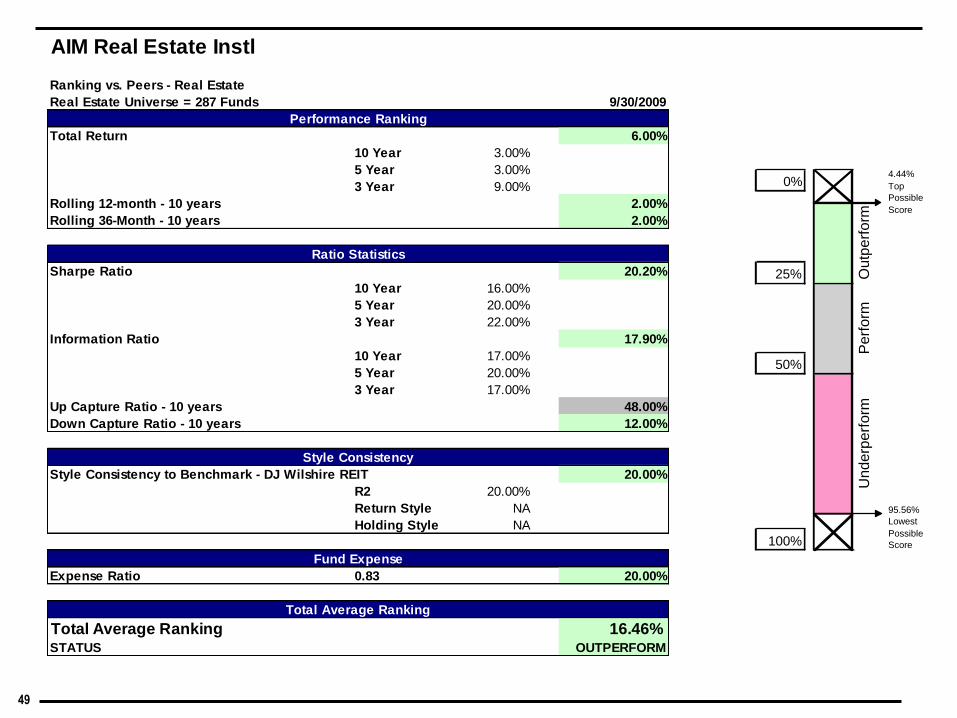
AIM Real Estate Instl
Ranking vs. Peers - Real Estate
Real Estate Universe = 287 Funds 9/30/2009
Total Return 6.00%
10 Year 3.00%
5 Year 3.00%
3 Year 9.00%
Rolling 12-month - 10 years 2.00%
Rolling 36-Month - 10 years 2.00%
Sharpe Ratio 20.20%
10 Year 16.00%
5 Year 20.00%
3 Year 22.00%
Information Ratio 17.90%
10 Year 17.00%
5 Year 20.00%
3 Year 17.00%
Up Capture Ratio - 10 years 48.00%
Down Capture Ratio - 10 years 12.00%
Style Consistency to Benchmark - DJ Wilshire REIT 20.00%
R2 20.00%
Return Style NA
Holding Style NA
Expense Ratio 0.83 20.00%
Total Average Ranking 16.46%STATUS OUTPERFORM
Total Average Ranking
Performance Ranking
Ratio Statistics
Style Consistency
Fund Expense

50
Overlap Analysis
0 - 30%
31 – 50%
51% and above
Eato
n V
ance L
arg
e C
ap V
alu
e
Fid
elit
y C
ontr
afu
nd
Alli
anz F
unds N
FJ S
mall-
Cap V
alu
e
Vanguard
Sm
all-
Cap I
ndex
Lord
Abbett
Sm
all-
Cap V
alu
e
Perk
ins M
id C
ap V
alu
e
Davis
New
York
Ventu
re
Munder
Mid
-Cap C
ore
Gro
wth
Vanguard
Mid
-Cap I
ndex
Royce V
alu
e P
lus
Vanguard
PR
IME
CA
P
TIA
A-C
RE
F M
id-C
ap V
alu
e
Fid
elit
y S
part
an U
S E
quity I
ndex
TIA
A C
RE
F G
row
th &
Incom
e
Bla
ckR
ock E
qu
ity D
ivid
en
d
Eaton Vance Large Cap Value -- 8 0 0 0 13 5 0 1 0 9 7 15 33 36
Fidelity Contrafund 8 -- 0 2 0 6 7 1 6 1 6 4 17 11 8
Allianz Funds NFJ Small-Cap Value 0 0 -- 8 7 4 0 5 4 2 0 3 0 1 1
Vanguard Small-Cap Index 0 2 8 -- 9 4 0 3 0 4 1 5 1 1 0
Lord Abbett Small-Cap Value 0 0 7 9 -- 3 0 2 2 6 0 4 0 1 0
Perkins Mid Cap Value 13 6 4 4 3 -- 4 6 10 6 9 10 7 13 8
Davis New York Venture 5 7 0 0 0 4 -- 0 2 0 2 2 7 6 7
Munder Mid-Cap Core Growth 0 1 5 3 2 6 0 -- 10 4 0 8 0 2 2
Vanguard Mid-Cap Index 1 6 4 0 2 10 2 10 -- 3 4 21 5 9 1
Royce Value Plus 0 1 2 4 6 6 0 4 3 -- 1 1 1 1 0
Vanguard PRIMECAP 9 6 0 1 0 9 2 0 4 1 -- 5 8 17 8
TIAA-CREF Mid-Cap Value 7 4 3 5 4 10 2 8 21 1 5 -- 6 15 4
Fidelity Spartan US Equity Index 15 17 0 1 0 7 7 0 5 1 8 6 -- 22 18
TIAA CREF Growth & Income 33 11 1 1 1 13 6 2 9 1 17 15 22 -- 28
BlackRock Equity Dividend 36 8 1 0 0 8 7 2 1 0 8 4 18 28 --

51
Range of InvestmentsLower risk/lower potential reward Higher risk/higher potential reward
BALANCED
CAPITAL
PRESERVATIONINCOME HYBRID VALUE BLEND GROWTH
LARGE VALUE
- BlackRock Equity
Dividend
- Eaton Vance Large Cap
Value
LARGE BLEND
- Davis NY Venture
- TIAA-CREF Instl Grth and
Income
- Fidelity Spartan US Equity
Idx
LARGE GROWTH
- Fidelity Contrafund
- Vanguard PRIMECAP
MID CAP VALUE
- Perkins Mid Cap Value
- TIAA-CREF Instl Mid
Cap Value
MID CAP BLEND
- Vanguard Mid Cap Index
MID CAP GROWTH
- Munder Mid-Cap Core
Growth
SMALL CAP VALUE
- Allianz NFJ Small Cap
Value Inst
SMALL CAP BLEND
- Lord Abbett Small Cap
Value
- Vanguard Small Cap Index
SMALL CAP GROWTH
- Royce Value Plus
SP
EC
IAL
TY REAL ESTATE
- AIM Real Estate
WORLD STOCK
- American Funds New
Perspective
- Mutual Discovery
FOREIGN LARGE CAP
- American Funds
EuroPacific Growth
- Fidelity Spartan
International Index
FOREIGN SM/MID CAP
- BlackRock International
Opportunities
EMERGING MARKETS
- DFA Emerging Markets
Value
Funds listed in Green is scheduled to be added
EQUITYFIXED INCOME
DO
ME
ST
ICF
OR
EIG
N
FIXED
- Vanguard PRIME MMkt
- Federated Gov Reserve
- Guaranteed Pooled
INFLATION PROTECTED
- Vanguard Inflation
Protected Sec
INTERMEDIATE
GOVERNMENT
- Vanguard Int Term
Treasury
- Vanguard GNMA
INTERMEDIATE
CORPORATE
- PIMCO Total Return
- Vanguard Total Bond
Market Index
HIGH YIELD BOND
- MainStay High Yield
Bond

52
Management Style (Returns-based)D
om
es
tic E
qu
ity
Fo
reig
n E
qu
ity
M anager Style
Octo b e r 1 9 9 9 - Se p te m b e r 2 0 0 9
USD, 36-month centered window; exp. weighted, rescaled
-2
-1
0
1
2
Sm
all -
La
rge
-2 -1 0 1 2
V a lue - G rowth
Top Value Top Growth
Mid Value Mid Growth
Sm Value Sm Growth
Russell Style Indices
BlackRock Equity Dividend A
Eaton Vance Large-Cap Value A
Davis NY Venture Y
TIAA-CREF Growth & Income Instl
Fidelity Spartan U.S. Equity Index Inv
Fidelity Contrafund
Vanguard PRIMECAP Adm
Perkins Mid Cap Value Investor
TIAA-CREF Mid-Cap Value Instl
Vanguard Mid Capitalization Index
Munder Mid-Cap Core Growth A
Allianz NFJ Small Cap Value Instl
Lord Abbett Small-Cap Value A
Vanguard Small Cap Index
Royce Value Plus Instl
M anager Style
October 1999 - September 2009
USD, 36-month centered window; exp. weighted, rescaled
-2
-1
0
1
2
Sm
all
- L
arg
e
-2 -1 0 1 2
E u ro p e - A si a
Europe Lg
Europe Sm
AsiaPac Lg
AsiaPac Sm
S&P Int'l Equity Indices
American Funds New Perspective R4
Mutual Discovery Z
American Funds EuroPacific Gr R4
Fidelity Spartan International Index Inv
BlackRock International Opp A
DFA Emerging Markets Value I
M anager Style
Octo b e r 2 0 0 6 - Se p te m b e r 2 0 0 9
USD, single data window; exp. weighted, rescaled
-2
-1
0
1
2
Sm
all -
La
rge
-2 -1 0 1 2
V a lue - G rowth
Top Value Top Growth
Mid Value Mid Growth
Sm Value Sm Growth
Russell Style Indices
BlackRock Equity Dividend A
Eaton Vance Large-Cap Value A
Davis NY Venture Y
TIAA-CREF Growth & Income Instl
Fidelity Spartan U.S. Equity Index Inv
Fidelity Contrafund
Vanguard PRIMECAP Adm
Perkins Mid Cap Value Investor
TIAA-CREF Mid-Cap Value Instl
Vanguard Mid Capitalization Index
Munder Mid-Cap Core Growth A
Allianz NFJ Small Cap Value Instl
Lord Abbett Small-Cap Value A
Vanguard Small Cap Index
Royce Value Plus Instl
M anager Style
October 2006 - September 2009
USD, single data window; exp. weighted, rescaled
-2
-1
0
1
2
Sm
all
- L
arg
e
-2 -1 0 1 2
E u ro p e - A si a
Europe Lg
Europe Sm
AsiaPac Lg
AsiaPac Sm
S&P Int'l Equity Indices
American Funds New Perspective R4
Mutual Discovery Z
American Funds EuroPacific Gr R4
Fidelity Spartan International Index Inv
BlackRock International Opp A
DFA Emerging Markets Value I

53
Portfolio Analysis
Portfolio Composition
Sector Weightings
Non-US Stocks,
14.69%
Cash, 14.24%
US Stocks, 45.70%
Bonds, 24.56%
Other, 0.80%
1st Qtr - 2009 2nd Qtr - 2009 3rd Qtr - 2009 S&P 500 Index
Software 3.38% 3.93% 3.88% 4.75%
Hardware 7.42% 8.08% 7.69% 11.11%
Media 2.81% 2.67% 2.04% 2.53%
Telecommunication 3.95% 3.77% 6.12% 5.40%
Healthcare 13.98% 12.91% 10.56% 11.82%
Consumer Services 7.95% 8.44% 8.48% 8.76%
Business Services 6.49% 6.68% 4.89% 3.41%
Financial Services 16.75% 16.72% 20.37% 14.60%
Consumer Goods 9.60% 9.49% 10.06% 11.08%
Industrial Materials 12.70% 12.82% 12.05% 10.83%
Energy 11.19% 10.84% 10.79% 12.23%
Utilities 3.91% 3.69% 3.08% 3.49%

54
Portfolio Return vs. Custom Benchmark
Annualized Returns Benchmark Weightings
3 YR 3 YR 3 YR Expense
Performance as of September 30, 2009 3 Month 1 Year 3 Year 5 Year 10 Year Std Dev Mean Sharpe Ratio
Pepperdine Diversified 403(b) Plan 11.75% 2.18% 1.00% 4.80% 4.99% 13.85 1.00 -0.06 0.58
Custom Benchmark - Index (Passive) 11.90% -0.18% -1.00% 3.41% 3.02% N/A N/A N/A N/A
Custom Benchmark - Category (Active) 11.57% 1.23% -0.77% 3.34% 3.23% 14.00 -0.77 -0.18 0.70*
Annualized Returns
*Custom expense ratio represents the weighted expense (based upon current allocation) of Institutional and Retirement share classes in each asset category.
-2%
0%
2%
4%
6%
3 Year 5 Year
Pepperdine Diversified 403(b) Plan
Custom Benchmark - Index (Passive)
Custom Benchmark - Category (Active)
Fund Name Category (Active) Index (Passive) Weight
Vanguard Prime Money Market Instl Money Market 3 Month T-Bill 10.26%
Federated Gov. Cash Reserves Money Market 3 Month T-Bill 0.56%
Guaranteed Pooled Fund Stable Value Cat: Stable Value 7.80%
Vanguard Infl Protected Sec Inflation Protected Barclays U.S. TIPS 0.35%
Vanguard Int Term Treasury Intermediate Govt Bond Barclays Int Government Bond 4.91%
PIMCO Total Return Admin Intermediate Bond Barclays Aggregate Bond 5.86%
Vanguard Total Bond Mkt Index Intermediate Bond Barclays Aggregate Bond 0.19%
MainStay HY Bond I High Yield Bond ML US High Yield Master 1.76%
Eaton Vance Large Cap Value A Large Cap Value Russell 1000 Value 8.64%
Davis NY Venture A Large Cap Blend S&P 500 Index 2.32%
TIAA-CREF G&I Instl Large Cap Blend S&P 500 Index 0.70%
Fidelity Spartan US Equity Index Large Cap Blend S&P 500 Index 9.29%
Fidelity Contrafund Large Cap Growth Russell 1000 Growth 4.47%
Vanguard PRIMECAP Large Cap Growth Russell 1000 Growth 2.76%
Perkins Mid Cap Value Inv Mid Cap Value Russell Mid Cap Value 1.20%
TiAA-CREF Mid Cap Value Instl Mid Cap Value Russell Mid Cap Value 0.34%
Vanguard Mid Cap Index Mid Cap Blend MSCI US Prm MC 450 Idx/SP 400MC Idx 1.50%
Munder Mid Cap Core Growth A Mid Cap Growth Russell Mid Cap Growth 1.52%
Allianz NFJ Small Cap Val Instl Small Cap Value Russell 2000 Value 0.69%
Lord Abbett Small Cap Value A Small Cap Blend Russell 2000 Index 0.49%
Vanguard Small Cap Index Small Cap Blend MSCI US SC 1750/Russell 2000 Index 1.95%
Royce Value Plus Instl Small Cap Growth Russell 2000 Growth 1.74%
American Funds New Perspective R4 World Stock MSCI World 0.85%
Mutual Discovery Z World Stock MSCI World 0.71%
American Funds EuroPac Grth R4 Foreign Large Equity MSCI EAFE 2.47%
Fidelity Spartan International Idx Foreign Large Equity MSCI EAFE 1.87%
BlackRock International Opp A Foreign Sm/Mid Equity MSCI EAFE 1.14%
DFA Emerging Markets Value I Emerging Markets MSCI Emerging Markets 2.74%
AIM Real Estate Instl Real Estate DJ Wilshire REIT Index 0.95%
T. Rowe Price Retirement Funds Target Dates Cat: Target Dates 20.02%

55
Watch List
Asset Class Fund Name Added Deleted Rationale
Small Cap Blend Lord Abbett Small Cap Value 2Q 2009 Manager change

Diversified Plan - Asset Allocation
September 30, 2009
Section 3
57
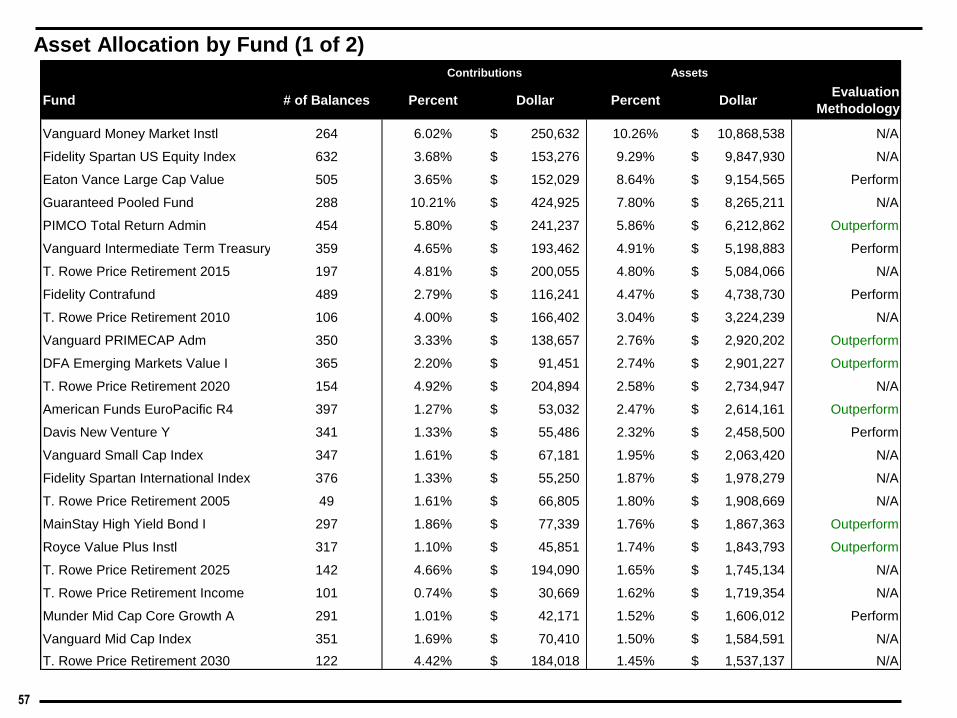
Asset Allocation by Fund (1 of 2)
Fund # of Balances Percent Dollar Percent DollarEvaluation
Methodology
Vanguard Money Market Instl 264 6.02% 250,632$ 10.26% 10,868,538$ N/A
Fidelity Spartan US Equity Index 632 3.68% 153,276$ 9.29% 9,847,930$ N/A
Eaton Vance Large Cap Value 505 3.65% 152,029$ 8.64% 9,154,565$ Perform
Guaranteed Pooled Fund 288 10.21% 424,925$ 7.80% 8,265,211$ N/A
PIMCO Total Return Admin 454 5.80% 241,237$ 5.86% 6,212,862$ Outperform
Vanguard Intermediate Term Treasury 359 4.65% 193,462$ 4.91% 5,198,883$ Perform
T. Rowe Price Retirement 2015 197 4.81% 200,055$ 4.80% 5,084,066$ N/A
Fidelity Contrafund 489 2.79% 116,241$ 4.47% 4,738,730$ Perform
T. Rowe Price Retirement 2010 106 4.00% 166,402$ 3.04% 3,224,239$ N/A
Vanguard PRIMECAP Adm 350 3.33% 138,657$ 2.76% 2,920,202$ Outperform
DFA Emerging Markets Value I 365 2.20% 91,451$ 2.74% 2,901,227$ Outperform
T. Rowe Price Retirement 2020 154 4.92% 204,894$ 2.58% 2,734,947$ N/A
American Funds EuroPacific R4 397 1.27% 53,032$ 2.47% 2,614,161$ Outperform
Davis New Venture Y 341 1.33% 55,486$ 2.32% 2,458,500$ Perform
Vanguard Small Cap Index 347 1.61% 67,181$ 1.95% 2,063,420$ N/A
Fidelity Spartan International Index 376 1.33% 55,250$ 1.87% 1,978,279$ N/A
T. Rowe Price Retirement 2005 49 1.61% 66,805$ 1.80% 1,908,669$ N/A
MainStay High Yield Bond I 297 1.86% 77,339$ 1.76% 1,867,363$ Outperform
Royce Value Plus Instl 317 1.10% 45,851$ 1.74% 1,843,793$ Outperform
T. Rowe Price Retirement 2025 142 4.66% 194,090$ 1.65% 1,745,134$ N/A
T. Rowe Price Retirement Income 101 0.74% 30,669$ 1.62% 1,719,354$ N/A
Munder Mid Cap Core Growth A 291 1.01% 42,171$ 1.52% 1,606,012$ Perform
Vanguard Mid Cap Index 351 1.69% 70,410$ 1.50% 1,584,591$ N/A
T. Rowe Price Retirement 2030 122 4.42% 184,018$ 1.45% 1,537,137$ N/A
Contributions Assets

58
Asset Allocation by Fund (2 of 2)
Fund # of Balances Percent Dollar Percent DollarEvaluation
Methodology
T. Rowe Price Retirement 2035 152 3.52% 146,354$ 1.39% 1,469,344$ N/A
Perkins Mid Cap Value Inv 307 1.24% 51,578$ 1.20% 1,270,992$ Outperform
BlackRock International Opportunity A 287 1.56% 64,931$ 1.14% 1,204,077$ Outperform
AIM Real Estate Instl 286 1.01% 41,848$ 0.95% 1,004,164$ Outperform
American Funds New Perspective R4 255 0.75% 31,206$ 0.85% 896,171$ Outperform
T. Rowe Price Retirement 2040 123 3.48% 144,913$ 0.71% 751,610$ N/A
Mutual Discovery Z 246 1.34% 55,730$ 0.71% 749,533$ Outperform
TIAA-CREF Growth & Income Instl 239 1.79% 74,603$ 0.70% 739,891$ Outperform
Allianz NFJ Small Cap Value Instl 257 1.26% 52,308$ 0.69% 728,897$ Outperform
Federated Govt Cash 9 0.50% 20,923$ 0.56% 595,744$ N/A
T. Rowe Price Retirement 2045 132 2.24% 93,019$ 0.55% 586,276$ N/A
Lord Abbett Small Cap Value A 245 0.62% 25,937$ 0.49% 518,200$ Outperform
T. Rowe Price Retirement 2055 6 0.18% 7,509$ 0.36% 380,263$ N/A
Vanguard Inflation Protected Securities 32 0.26% 10,942$ 0.35% 365,777$ Outperform
TIAA-CREF Mid Cap Value Instl 231 0.61% 25,510$ 0.34% 357,486$ Outperform
Vanguard Total Bond Market Index 50 0.40% 16,788$ 0.19% 198,767$ N/A
T. Rowe Price Retirement 2050 36 0.52% 21,761$ 0.07% 69,313$ N/A
Sub Total 1962 100.00% 4,161,423$ 100.00% 105,964,319$
Personal Choice 7 -$ 3,259,182$
Total 1,969 4,161,423$ 109,223,501$
Contributions Assets

59
Asset Allocation by Category (%)
0.00%
5.00%
10.00%
15.00%
20.00%
25.00%
30.00%
Fixed Bond Large Cap Mid Cap Small Cap International Specialty Target Date
Large Cap Value Large Cap Blend Large Cap Growth Mid Cap Value Mid Cap Blend
Mid Cap Growth Small Cap Value Small Cap Blend Small Cap Growth

60
Asset Allocation Quarterly Comparison (1 of 2)
Fund Q1-2009 Q2-2009 Q3-2009
Vanguard Money Market 12,781,836$ 11,192,143$ 10,868,538$
Fidelity Spartan US Equity Index 8,222,253$ 9,031,993$ 9,847,930$
Eaton Vance Large Cap Value 7,134,420$ 7,796,962$ 9,154,565$
Guaranteed Pooled Fund 6,329,013$ 7,437,408$ 8,265,211$
PIMCO Total Return Admin 4,639,420$ 5,471,586$ 6,212,862$
Vanguard Intermediate Term Treasury 6,697,830$ 4,885,850$ 5,198,883$
T. Rowe Price Retirement 2015 4,069,911$ 4,067,344$ 5,084,066$
Fidelity Contrafund 3,716,456$ 4,238,672$ 4,738,730$
T. Rowe Price Retirement 2010 2,230,945$ 2,646,475$ 3,224,239$
Vanguard PRIMECAP 1,618,754$ 2,286,364$ 2,920,202$
DFA Emerging Markets Value I 1,177,131$ 2,255,374$ 2,901,227$
T. Rowe Price Retirement 2020 1,716,763$ 1,856,593$ 2,734,947$
American Funds EuroPacific R4 1,670,262$ 2,063,792$ 2,614,161$
Davis New York Venture Y 1,828,855$ 2,074,397$ 2,458,500$
Vanguard Small Cap Index 1,212,253$ 1,641,903$ 2,063,420$
Fidelity Spartan International Index 1,254,889$ 1,575,048$ 1,978,279$
T. Rowe Price Retirement 2005 1,434,076$ 1,664,223$ 1,908,669$
MainStay High Yield Bond I 670,548$ 1,432,801$ 1,867,363$
Royce Value Plus Instl 1,188,193$ 1,582,124$ 1,843,793$
T. Rowe Price Retirement 2025 988,932$ 1,344,702$ 1,745,134$

61
Asset Allocation Quarterly Comparison (2 of 2)
Fund Q1-2009 Q2-2009 Q3-2009
T. Rowe Price Retirement Income 1,531,868$ 1,614,071$ 1,719,354$
Munder Mid Cap Core Growth A 1,101,548$ 1,361,246$ 1,606,012$
Vanguard Mid Cap Index 879,948$ 1,224,286$ 1,584,591$
T. Rowe Price Retirement 2030 602,831$ 1,124,155$ 1,537,137$
T. Rowe Price Retirement 2035 948,768$ 1,184,257$ 1,469,344$
Perkins Mid Cap Value Inv 767,694$ 1,015,626$ 1,270,992$
Black Rock International Opportunity A 517,112$ 995,160$ 1,204,077$
AIM Real Estate Instl 493,693$ 726,041$ 1,004,164$
American Funds New Perspective R4 368,005$ 642,360$ 896,171$
T. Rowe Price Retirement 2040 291,217$ 472,030$ 751,610$
Mutual Discovery Z 469,082$ 652,874$ 749,533$
TIAA-CREF Growth & Income Instl 233,079$ 529,487$ 739,891$
Allianz NFJ Small Cap Value Instl 258,629$ 567,212$ 728,897$
Federated Govt Cash -$ 593,704$ 595,744$
T. Rowe Price Retirement 2045 249,282$ 399,600$ 586,276$
Lord Abbett Small Cap Value A 181,006$ 329,279$ 518,200$
T. Rowe Price Retirement 2055 203,710$ 265,488$ 380,263$
Vanguard Inflation Protected Securities -$ -$ 365,777$
TIAA-CREF Mid Cap Value Instl 91,117$ 223,234$ 357,486$
Vanguard Total Bond Market Index -$ -$ 198,767$
T. Rowe Price Retirement 2050 31,053$ 40,018$ 69,313$
Total Core Line Up 79,802,378$ 90,514,562$ 105,964,319$
Personal Choice 858,062$ 2,761,284$ 3,259,182$
Total Plan Assets 80,660,440$ 93,275,845$ 109,223,501$

62
Average Account Balance By Age
Age 20-29, 0.78%
Age 30-39, 7.49%
Age 40-49, 21.07%
Age 50-59, 33.18%
Age 60-69, 32.06%
Age 70+, 5.41%
Age 20-29 855,618.80$
Age 30-39 8,184,510.30$
Age 40-49 23,017,254.91$
Age 50-59 36,245,254.78$
Age 60-69 35,012,797.46$
Age 70+ 5,908,065.18$
$109,223,501

63
Asset Allocation By Age
Age 29 & Under Age 30-39 Age 40-49
Age 50-59 Age 60-69 Age 70 & Over
Fixed
Bond
Equity
Foreign
Lifecycle
Brokerage
34.69%
11.71%
46.01%
0.00%2.56%
5.03%
47.21%
10.90%
28.00%
5.30%
8.59%0.00%
42.10%
13.78%
21.55%
1.02%12.02%
9.53%
39.13%
10.25%
16.45%
14.01%
17.40%2.75%
33.35%
6.03%
16.21%
5.18%
23.76%
15.48%
19.08%
5.95%
32.63%
11.42%
27.29%
3.64%

64
PortfolioXPress Models
Models30+ Years To
Retirement
20 Years To
Retirement
10 Years To
RetirementAt Retirement
10 Years Into
Retirement
Federated US Treasury Cash 0% 0% 0% 1% 1%
Vanguard PRIME Money Market 0% 0% 0% 1% 1%
Guaranteed Pool 0% 0% 3% 6% 9%
PIMCO Total Return Admin 2% 9% 17% 23% 28%
Vanguard Int Term Treasury 1% 4% 8% 11% 13%
MainStay HY Corporate Bond I 2% 4% 5% 6% 8%
Eaton Vance Large Cap Value A 16% 13% 12% 9% 8%
Davis NY Venture Y 4% 4% 3% 3% 2%
Fidelity Spartan US Equity Index 4% 4% 3% 3% 2%
TIAA-CREF Growth & Income Instl 4% 5% 3% 4% 2%
Fidelity Contrafund 8% 6% 5% 4% 3%
Vanguard PRIMECAP 8% 6% 6% 4% 4%
Perkins Md Cap Value Inv 2% 1% 1% 1% 0%
TIAA-CREF Mid Cap Value Instl 2% 2% 2% 1% 1%
Vanguard Mid Cap Index 3% 3% 2% 1% 1%
Munder Mid Cap Core Growth 4% 4% 3% 3% 2%
Allianz NFJ Small Cap Value Instl 3% 3% 2% 2% 1%
Lord Abbett Small Cap Value A 2% 2% 1% 1% 1%
Vanguard Small Cap Index 2% 2% 2% 1% 1%
Royce Value Plus Instl 4% 3% 2% 2% 1%
AIM Real Estate Inst 3% 3% 2% 1% 1%
Amer Funds EuroPac Growth R4 3% 3% 2% 1% 1%
Amer Funds new Perspective R4 3% 3% 2% 1% 1%
Fidelity Spartan Intl Index 4% 3% 3% 2% 2%
Mutual Discovery Z 4% 3% 3% 2% 2%
BlackRock International Opp A 6% 5% 4% 3% 2%
DFA Emerging Markets 6% 5% 4% 3% 2%
Fix
ed
/Bo
nd
sL
arg
e C
ap
Eq
uit
yM
id/S
mall C
ap
Eq
uit
yF
ore
ign
/Wo
rld
Eq
uit
y

TIAA-CREF Plan - Portfolio Summary
September 30, 2009
Section 4

66
Fund Performance Summary
Funds listed in Green are scheduled to be added. Funds listed in Blue are frozen to new contributions
Funds listed in Red are scheduled to be removed. Funds shaded in Yellow have been placed on the watch list.
Fund Name Asset Class 3 Month YTD 1 Year 3 Year 5 Year 10 Year
CREF Money Market Money Market 7.77% 0.00 0.10 0.71 2.89 3.08 2.99 0.47 N/A
3 Month T-Bill 0.04 0.15 0.24 2.56 3.05 3.01
Cat: Money Market 0.02 0.16 0.46 2.65 2.81 2.68
TIAA Traditional (GRA, RA) Stable Value 45.10% 0.91 3.35 4.91 4.97 4.55 6.16 0.50 N/A
TIAA Traditional (GSRA, SRA) 7.20% 0.75 2.24 3.91 4.22 3.55 5.59 0.50 N/A
Cat: Stable Value 0.64 2.02 2.94 3.87 3.93 4.50
CREF Inflation Linked Bond Inflation Protected Bond 2.37% 2.85 7.59 4.58 4.98 4.27 7.03 0.50 Perform
Barclays U.S. TIPS 3.08 9.48 5.67 5.61 4.79 7.51
Cat: Inflation Protected Bond 3.60 8.99 4.79 4.25 4.16 6.28
CREF Bond Market Intermediate Bond 2.69% 4.06 6.58 9.19 5.00 4.22 5.79 0.50 Perform
Barclays Aggregate Bond 3.74 5.72 10.56 6.41 5.13 6.30
Cat: Intermediate Term Bond 6.13 12.50 11.81 4.47 3.82 5.38
CREF Social Choice Hybrid 2.71% 12.19 18.03 2.24 -0.34 3.11 2.95 0.53 Perform
40% Barclays Agg Bond / 60% S&P 500 Index 10.77 14.16 0.63 -0.42 2.95 2.74
Cat: Moderate Allocation 12.20 19.57 1.38 -1.56 2.56 2.90
CREF Stock Large Cap Blend 23.96% 17.64 25.76 -3.06 -4.10 2.78 1.02 0.59 Perform
S&P 500 Index 15.61 19.26 -6.91 -5.43 1.02 -0.15
Cat: Large Blend 15.59 21.28 -5.46 -5.13 1.22 0.69
CREF Equity Index 1.77% 16.17 20.83 -6.70 -5.42 1.16 0.36 0.49 N/A
Russell 3000 Index 16.31 21.19 -6.42 -5.06 1.56 0.73
Cat: Large Blend 15.59 21.28 -5.46 -5.13 1.22 0.69
CREF Growth Large Cap Growth 3.20% 14.12 26.63 -2.36 -2.06 1.56 -3.44 0.58 Underperform
Russell 1000 Growth 13.97 27.11 -1.85 -2.50 1.86 -2.55
Cat: Large Growth 14.76 27.04 -2.69 -3.25 1.77 -0.64
CREF Global Equities Global 2.78% 18.41 27.16 -2.11 -4.27 3.27 0.60 0.65 Underperform
MSCI WORLD 17.45 24.90 -2.29 -4.35 3.51 0.92
Cat: World Stock 17.15 28.88 0.64 -3.23 4.37 3.08
TIAA Real Estate Specialty - Real Estate 0.44% -7.64 -23.79 -33.83 -8.76 0.01 3.86 1.01 N/A
Wilshire REIT Index 35.42 17.81 -29.26 -13.71 1.18 9.73
Cat: Specialty - Real Estate 32.45 20.48 -25.86 -13.42 0.36 8.85
RETURNS AS OF 09/30/2009
(%) of
Plan
Annualized Return Evaluation
Methodology
Expense
Ratio

67
Quantitative Analysis Summary
0%
25%
50%
100%
4.44%
Top
Possible
Score
95.56%
Lowest
Possible
Score
Ou
tpe
rfo
rmP
erf
orm
Un
de
rpe
rfo
rm
Fund Name Fund Category
Fund
Wgt* 3Q09 2Q09 1Q09 4Q08
CREF Inflation Linked Bond Inflation Protected Bond 2.37% 33.24 29.89 28.64 26.31
Barclays U.S. Tips
CREF Bond Market Intermediate Bond 2.69% 28.89 26.82 23.60 23.22
Barclays Aggregate Bond
CREF Social Choice Moderate Allocation 2.71% 39.59 40.81 43.69 43.08
40% Barclays Agg Bond/60% S&P 500 Index
CREF Stock Large Cap Blend 23.96% 27.90 27.76 30.95 31.09
S&P 500 Index
CREF Growth Large Cap Growth 3.20% 50.21 49.83 50.19 53.36
Russell 1000 Growth
CREF Global Equities Global 2.78% 60.19 61.06 61.40 60.44
MSCI World
PLAN WEIGHTED SCORE: 33.42 32.92 34.47 34.91
*Fund w eightings are remeasured by assigning a proportionate w eighting to each fund included in the Evaluation Methodology Score.
EVALUATION METHODOLOGY SCORE

68
0%
25%
50%
100%
4.44%
Top
Possible
Score
95.56%
Lowest
Possible
Score
Ou
tpe
rfo
rmP
erf
orm
Un
de
rpe
rfo
rm
CREF Inflation Linked Bond
Ranking vs. Peers - Inflation Protected Bond
Inflation Protected Bond Universe = 152 Funds 9/30/2009
Total Return 46.90%
10 Year 41.00%
5 Year 49.00%
3 Year 48.00%
Rolling 12-month - 10 years 28.00%
Rolling 36-Month - 10 years 32.00%
Sharpe Ratio 36.50%
10 Year 9.00%
5 Year 39.00%
3 Year 46.00%
Information Ratio 35.80%
10 Year 8.00%
5 Year 39.00%
3 Year 45.00%
Up Capture Ratio - 10 years 22.00%
Down Capture Ratio - 10 years 58.00%
Style Consistency to Benchmark - Lehman US TIPS Index 20.00%
R2 20.00%
Avg Credit Quality 20.00%
Expense Ratio 0.50 20.00%
Total Average Ranking 33.24%STATUS PERFORM
Total Average Ranking
Performance Ranking
Ratio Statistics
Style Consistency
Fund Expense

69
0%
25%
50%
100%
4.44%
Top
Possible
Score
95.56%
Lowest
Possible
Score
Ou
tpe
rfo
rmP
erf
orm
Un
de
rpe
rfo
rm
CREF Bond Market
Ranking vs. Peers - Intermediate Bond
Intermediate Bond Universe = 1307 Funds 9/30/2009
Total Return 48.50%
10 Year 34.00%
5 Year 49.00%
3 Year 54.00%
Rolling 12-month - 10 years 15.00%
Rolling 36-Month - 10 years 22.00%
Sharpe Ratio 27.60%
10 Year 18.00%
5 Year 30.00%
3 Year 30.00%
Information Ratio 25.90%
10 Year 16.00%
5 Year 24.00%
3 Year 31.00%
Up Capture Ratio - 10 years 34.00%
Down Capture Ratio - 10 years 47.00%
Style Consistency to Benchmark - Lehman US Aggregate Bond Index 20.00%
R2 20.00%
Avg Credit Quality 20.00%
Expense Ratio 0.50 20.00%
Total Average Ranking 28.89%STATUS PERFORM
Total Average Ranking
Performance Ranking
Ratio Statistics
Style Consistency
Fund Expense

70
0%
25%
50%
100%
4.44%
Top
Possible
Score
95.56%
Lowest
Possible
Score
Ou
tpe
rfo
rmP
erf
orm
Un
de
rpe
rfo
rm
CREF Social Choice
Ranking vs. Peers - Moderate Allocation
Moderate Allocation Universe = 770 Funds 9/30/2009
Total Return 33.90%
10 Year 50.00%
5 Year 33.00%
3 Year 28.00%
Rolling 12-month - 10 years 43.00%
Rolling 36-Month - 10 years 43.00%
Sharpe Ratio 42.50%
10 Year 50.00%
5 Year 45.00%
3 Year 38.00%
Information Ratio 39.30%
10 Year 46.00%
5 Year 42.00%
3 Year 35.00%
Up Capture Ratio - 10 years 63.00%
Down Capture Ratio - 10 years 32.00%
Style Consistency to Benchmark - Moderate Allocation Category NA
R2 NA
Return Style NA
Holding Style NA
Expense Ratio 0.53 20.00%
Total Average Ranking 39.59%STATUS PERFORM
Total Average Ranking
Performance Ranking
Ratio Statistics
Style Consistency
Fund Expense

71
0%
25%
50%
100%
4.44%
Top
Possible
Score
95.56%
Lowest
Possible
Score
Ou
tpe
rfo
rmP
erf
orm
Un
de
rpe
rfo
rm
CREF Stock
Ranking vs. Peers - Large Cap Blend
Large Cap Blend Universe = 1992 Funds 9/30/2009
Total Return 26.50%
10 Year 37.00%
5 Year 17.00%
3 Year 28.00%
Rolling 12-month - 10 years 16.00%
Rolling 36-Month - 10 years 14.00%
Sharpe Ratio 31.80%
10 Year 40.00%
5 Year 31.00%
3 Year 29.00%
Information Ratio 35.10%
10 Year 42.00%
5 Year 34.00%
3 Year 33.00%
Up Capture Ratio - 10 years 21.00%
Down Capture Ratio - 10 years 60.00%
Style Consistency to Benchmark - S&P 500 26.67%
R2 20.00%
Return Style 40.00%
Holding Style 20.00%
Expense Ratio 0.59 20.00%
Total Average Ranking 27.90%STATUS PERFORM
Total Average Ranking
Performance Ranking
Ratio Statistics
Style Consistency
Fund Expense

72
0%
25%
50%
100%
4.44%
Top
Possible
Score
95.56%
Lowest
Possible
Score
Ou
tpe
rfo
rmP
erf
orm
Un
de
rpe
rfo
rm
CREF Growth
Ranking vs. Peers - Large Cap Growth
Large Cap Growth Universe = 2170 Funds 9/30/2009
Total Return 48.80%
10 Year 88.00%
5 Year 54.00%
3 Year 30.00%
Rolling 12-month - 10 years 71.00%
Rolling 36-Month - 10 years 70.00%
Sharpe Ratio 52.80%
10 Year 73.00%
5 Year 59.00%
3 Year 41.00%
Information Ratio 52.60%
10 Year 76.00%
5 Year 58.00%
3 Year 40.00%
Up Capture Ratio - 10 years 35.00%
Down Capture Ratio - 10 years 75.00%
Style Consistency to Benchmark - Russell 1000 Growth 26.67%
R2 20.00%
Return Style 40.00%
Holding Style 20.00%
Expense Ratio 0.58 20.00%
Total Average Ranking 50.21%STATUS UNDERPERFORM
Total Average Ranking
Performance Ranking
Ratio Statistics
Style Consistency
Fund Expense

73
0%
25%
50%
100%
4.44%
Top
Possible
Score
95.56%
Lowest
Possible
Score
Ou
tpe
rfo
rmP
erf
orm
Un
de
rpe
rfo
rm
CREF Global Equities
Ranking vs. Peers - World Stock
World Stock Universe = 604 Funds 9/30/2009
Total Return 65.20%
10 Year 76.00%
5 Year 65.00%
3 Year 61.00%
Rolling 12-month - 10 years 75.00%
Rolling 36-Month - 10 years 71.00%
Sharpe Ratio 66.60%
10 Year 78.00%
5 Year 65.00%
3 Year 63.00%
Information Ratio 65.70%
10 Year 75.00%
5 Year 64.00%
3 Year 63.00%
Up Capture Ratio - 10 years 66.00%
Down Capture Ratio - 10 years 52.00%
Style Consistency to Benchmark - MSCI The World Index NA
R2 NA
Return Style NA
Holding Style NA
Expense Ratio 0.65 20.00%
Total Average Ranking 60.19%STATUS UNDERPERFORM
Total Average Ranking
Performance Ranking
Ratio Statistics
Style Consistency
Fund Expense

74
Range of Investments
Lower risk/lower potential reward Higher risk/higher potential reward
BALANCED
CAPITAL
PRESERVATIONINCOME HYBRID VALUE BLEND GROWTH
LARGE BLEND
- CREF Stock
- CREF Equity Index
LARGE GROWTH
- CREF Growth
SP
EC
IAL
TY REAL ESTATE
- TIAA Real Estate
FO
RE
IGN
WORLD STOCK
- CREF Global Equities
EQUITYFIXED INCOME
DO
ME
ST
IC
MONEY MARKET
- CREF Money Market
- TIAA Traditional
INFLATION PROTECTED
BOND
- CREF Inflation Linked
Bond
INTERMEDIATE BOND
- CREF Bond Market
MODERATE ALLOCATION
- CREF Social Choice

75
Management Style (Returns-based)D
om
es
tic E
qu
ity
Fo
reig
n E
qu
ity
M anager Style
October 2006 - September 2009
USD, single data window; exp. weighted, rescaled
-2
-1
0
1
2
Sm
all
- L
arg
e
-2 -1 0 1 2
V a l u e - G ro w th
Top Value Top Growth
Mid Value Mid Growth
Sm Value Sm Growth
Russell Style Indices
CREF Stock
CREF Equity Index
CREF Growth
M anager Style
October 2006 - September 2009
USD, single data window; exp. weighted, rescaled
-2
-1
0
1
2
Sm
all
- L
arg
e
-2 -1 0 1 2
E u ro p e - A si a
Europe Lg
Europe Sm
AsiaPac Lg
AsiaPac Sm
S&P Int'l Equity Indices
CREF Global Equities
M anager Style
October 1999 - September 2009
USD, 36-month centered window; exp. weighted, rescaled
-2
-1
0
1
2
Sm
all
- L
arg
e
-2 -1 0 1 2
V a l u e - G ro w th
Top Value Top Growth
Mid Value Mid Growth
Sm Value Sm Growth
Russell Style Indices
CREF Stock
CREF Equity Index
CREF Growth
M anager Style
October 1999 - September 2009
USD, 36-month centered window; exp. weighted, rescaled
-2
-1
0
1
2
Sm
all
- L
arg
e
-2 -1 0 1 2
E u ro p e - A si a
Europe Lg
Europe Sm
AsiaPac Lg
AsiaPac Sm
S&P Int'l Equity Indices
CREF Global Equities

76
Portfolio Return vs. Custom Benchmark
Annualized Returns Benchmark Weightings
Fund Name Category (Active) Index (Passive) Weight
CREF Money Market Money Market 3 Month T-Bill 7.77%
TIAA Traditional (GRA, RA) Stable Value Cat: Stable Value 45.10%
TIAA Traditional (GSRA, SRA) Stable Value Cat: Stable Value 7.20%
CREF Inflation Linked Bond Inflation Protected Bond Barclays U.S. TIPS 2.37%
CREF Bond Market Intermediate Term Bond Barclays Aggregate Bond 2.69%
CREF Social Choice Moderate Allocation 40%Barclays Agg/60%S&P500 2.71%
CREF Stock Large Cap Blend S&P 500 Index 23.96%
CREF Equity Index Large Cap Blend Russell 3000 Index 1.77%
CREF Growth Large Cap Growth Russell 1000 Growth 3.20%
CREF Global Equities Global Stock MSCI World 2.78%
TIAA Real Estate Specialty - Real Estate Wilshire REIT 0.44%
3 YR 3 YR 3 YR Expense
Performance as of September 30, 2009 3 Month 1 Year 3 Year 5 Year 10 Year Std Dev Mean Sharpe Ratio
Pepperdine TIAA-CREF 403(b) Plan 6.25% 2.47% 2.15% 4.20% 3.94% 7.19 2.15 -0.05 0.53
Custom Benchmark - Index (Passive) 5.92% -0.03% 0.86% 3.06% 2.97% N/A N/A N/A N/A
Custom Benchmark - Category (Active) 5.87% 1.38% 1.20% 3.30% 3.19% 7.04 1.20 -0.19 0.67*
Annualized Returns
*Custom expense ratio represents the weighted expense (based upon current allocation) of Institutional and Retirement share classes in each asset category.
0%
1%
2%
3%
4%
5%
3 Year 5 Year
Pepperdine TIAA-CREF 403(b) Plan
Custom Benchmark - Index (Passive)
Custom Benchmark - Category (Active)
TIAA-CREF Plan - Asset Allocation
September 30, 2009
Section 5

78
Asset Allocation by Fund
Fund % of Assets Assets ($)Evaluation
Methodology
TIAA Traditional (GRA, RA) 45.10% 65,350,397$ N/A
CREF Stock 23.96% 34,712,042$ Perform
CREF Money Market 7.77% 11,264,779$ N/A
TIAA Traditional (GSRA, SRA) 7.20% 10,425,664$ N/A
CREF Growth 3.20% 4,633,878$ Underperform
CREF Global Equities 2.78% 4,029,553$ Underperform
CREF Social Choice 2.71% 3,932,838$ Perform
CREF Bond Market 2.69% 3,890,746$ Perform
CREF Inflation-linked Bond 2.37% 3,432,885$ Perform
CREF Equity Index 1.77% 2,571,621$ N/A
TIAA Real Estate 0.44% 642,559$ N/A
Total 100.00% 144,886,963$

79
Asset Allocation by Category (%)
0.00%
10.00%
20.00%
30.00%
40.00%
50.00%
60.00%
70.00%
Fixed Bond Balanced Large Cap International Specialty
Large Cap Blend Large Cap Growth

80
Asset Allocation Quarterly Comparison ($)
Fund Q4-2008 Q1-2009 Q2-2009 Q3-2009
TIAA Traditional 75,518,132$ 75,567,619$ 75,623,976$ 75,776,061$
CREF Stock 34,906,400$ 26,273,848$ 30,393,404$ 34,712,042$
CREF Money Market 13,284,795$ 12,206,243$ 11,793,806$ 11,264,779$
CREF Growth 4,253,171$ 3,430,220$ 4,049,729$ 4,633,878$
CREF Global Equities 4,062,490$ 2,679,243$ 3,320,370$ 4,029,553$
CREF Social Choice 3,932,871$ 3,228,543$ 3,599,962$ 3,932,838$
CREF Bond Market 4,597,185$ 4,058,794$ 3,820,011$ 3,890,746$
CREF Inflation-linked Bond 3,189,917$ 3,229,041$ 3,405,874$ 3,432,885$
CREF Equity Index 2,942,082$ 2,081,418$ 2,517,603$ 2,571,621$
TIAA Real Estate 1,580,215$ 943,778$ 842,198$ 642,559$
Total 148,267,259$ 133,698,746$ 139,366,932$ 144,886,963$

81
Asset Allocation Quarterly Comparison (%)
50.9
3%
23.5
4%
8.9
6%
2.8
7%
2.7
4%
2.6
5%
3.1
0%
2.1
5%
1.9
8%
1.0
7%
56.5
2%
19.6
5%
9.1
3%
2.5
7%
2.0
0%
2.4
1%
3.0
4%
2.4
2%
1.5
6%
0.7
1%
54.2
6%
21.8
1%
8.4
6%
2.9
1%
2.3
8%
2.5
8%
2.7
4%
2.4
4%
1.8
1%
0.6
0%
52.3
0%
23.9
6%
7.7
7%
3.2
0%
2.7
8%
2.7
1%
2.6
9%
2.3
7%
1.7
7%
0.4
4%
0%
10%
20%
30%
40%
50%
60%T
IAA
Tra
ditio
nal
CR
EF
Sto
ck
CR
EF
Mo
ne
y M
ark
et
CR
EF
Gro
wth
CR
EF
Glo
ba
l E
quitie
s
CR
EF
So
cia
l C
hoic
e
CR
EF
Bo
nd
Ma
rke
t
CR
EF
In
fla
tio
n-lin
ke
d
Bo
nd
CR
EF
Eq
uity I
nde
x
TIA
A R
eal E
sta
te
Q4-2008
Q1-2009
Q2-2009
Q3-2009

82
Growth of Plan Assets
$10,000,000
$30,000,000
$50,000,000
$70,000,000
$90,000,000
$110,000,000
$130,000,000
$150,000,000
$170,000,000
$190,000,000
Plan Assets $163,060,699 $161,259,967 $160,896,646 $148,267,259 $133,698,746 $139,366,932 $144,886,963
Mar-08 June-08 Sept-08 Dec-08 Mar-09 Jun-09 Sept-09

Prudential Plan - Portfolio Summary
September 30, 2009
Section 6

84
Fund Performance Summary
Funds listed in Green are scheduled to be added. Funds listed in Blue are frozen to new contributions
Funds listed in Red are scheduled to be removed. Funds shaded in Yellow have been placed on the watch list.
Fund Name Asset Class 3 Month YTD 1 Year 3 Year 5 Year 10 Year
Medley Money Market Money Market 1.97% -0.11 -0.12 0.21 2.48 2.61 2.46 1.00 N/A
3 Month T-Bill 0.04 0.15 0.24 2.56 3.05 3.01
Cat: Money Market 0.02 0.16 0.46 2.65 2.81 2.68
Prudential Guaranteed Interest Stable Value 58.89% 0.98 2.92 3.94 4.00 4.03 4.65 0.49 N/A
Cat: Stable Value 0.64 2.02 2.94 3.87 3.93 4.50
Medley Government Income Intermediate Government 1.50% 3.80 6.37 9.32 5.23 4.01 5.27 0.52 Underperform
Barclays Intermediate Government Bond 1.63 0.09 6.26 6.55 4.88 5.69
Cat: Intermediate Government Bond 2.82 4.57 8.13 5.52 4.30 5.24
Medley Diversified Bond Intermediate Bond 4.06% 7.90 16.48 14.45 5.76 4.72 5.53 0.44 Perform
Barclays Aggregate Bond 3.74 5.72 10.56 6.41 5.13 6.30
Cat: Intermediate Term Bond 6.13 12.50 11.81 4.47 3.82 5.38
Medley Conservative Balanced Conservative Allocation 1.53% 10.56 14.89 2.26 -0.53 2.34 2.05 0.59 Underperform
Medley Flexible Managed 0.65% 10.78 13.94 -0.82 -1.98 2.08 1.63 0.64 Underperform
Cat: Conservative Allocation 9.52 17.02 5.29 0.87 3.15 3.43
Medley Stock Index Large Cap Blend 3.53% 15.18 18.29 -7.69 -6.33 0.03 -1.11 0.37 N/A
S&P 500 Index 15.61 19.26 -6.91 -5.43 1.02 -0.15
Cat: Large Blend 15.59 21.28 -5.46 -5.13 1.22 0.69
Medley Capital Growth Large Cap Growth 9.89% 14.26 38.55 2.85 -4.10 4.03 2.71 1.00 Perform
Medley Equity 16.57% 14.42 26.95 -1.97 -3.40 2.56 1.23 0.48 Perform
Russell 1000 Growth 13.97 27.11 -1.85 -2.50 1.86 -2.55
Cat: Large Growth 14.76 27.04 -2.69 -3.25 1.77 -0.64
Medley Global Global 1.41% 17.67 19.89 -7.12 -6.80 2.53 -0.43 0.84 Underperform
MSCI WORLD 17.45 24.90 -2.29 -4.35 3.51 0.92
Cat: World Stock 17.15 28.88 0.64 -3.23 4.37 3.08
RETURNS AS OF 09/30/2009
(%) of
Plan
Annualized Return Evaluation
Methodology
Expense
Ratio

85
Quantitative Analysis Summary
0%
25%
50%
100%
4.44%
Top
Possible
Score
95.56%
Lowest
Possible
Score
Outp
erf
orm
Pe
rfo
rmU
nd
erp
erf
orm
Fund Name Fund Category
Fund
Wgt* 3Q09 2Q09 1Q09 4Q08
Medley Government Income Intermediate Government 1.50% 53.81 57.70 58.46 59.00
Barclays Intermediate Government
Medley Diversified Bond Intermediate Bond 4.06% 44.11 48.61 51.71 52.58
Barclays Aggregate Bond
Medley Conservative Balanced Conservative Allocation 1.53% 57.95 58.63 59.51 58.04
Medely Flexible Managed 0.65% 63.03 61.68 57.96 53.26
Cat: Conservative Allocation
Medley Capital Growth Large Cap Growth 9.89% 33.98 29.94 31.87 36.68
Medley Equity Account 16.57% 37.64 37.14 39.34 38.91
Russell 1000 Growth
Medley Global Global 1.41% 70.96 70.24 72.41 65.29
MSCI World
PLAN WEIGHTED SCORE: 40.70 40.24 42.67 43.76
*Fund w eightings are remeasured by assigning a proportionate w eighting to each fund included in the Evaluation Methodology Score.
EVALUATION METHODOLOGY SCORE
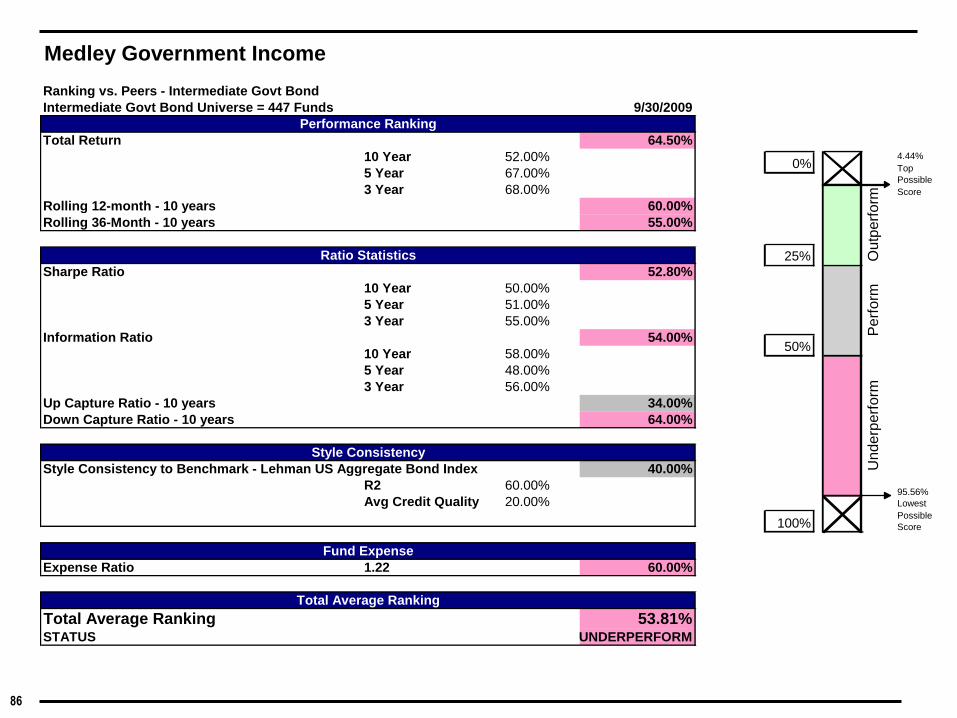
86
0%
25%
50%
100%
4.44%
Top
Possible
Score
95.56%
Lowest
Possible
Score
Ou
tpe
rfo
rmP
erf
orm
Un
de
rpe
rfo
rm
Medley Government Income
Ranking vs. Peers - Intermediate Govt Bond
Intermediate Govt Bond Universe = 447 Funds 9/30/2009
Total Return 64.50%
10 Year 52.00%
5 Year 67.00%
3 Year 68.00%
Rolling 12-month - 10 years 60.00%
Rolling 36-Month - 10 years 55.00%
Sharpe Ratio 52.80%
10 Year 50.00%
5 Year 51.00%
3 Year 55.00%
Information Ratio 54.00%
10 Year 58.00%
5 Year 48.00%
3 Year 56.00%
Up Capture Ratio - 10 years 34.00%
Down Capture Ratio - 10 years 64.00%
Style Consistency to Benchmark - Lehman US Aggregate Bond Index 40.00%
R2 60.00%
Avg Credit Quality 20.00%
Expense Ratio 1.22 60.00%
Total Average Ranking 53.81%STATUS UNDERPERFORM
Total Average Ranking
Performance Ranking
Ratio Statistics
Style Consistency
Fund Expense

87
0%
25%
50%
100%
4.44%
Top
Possible
Score
95.56%
Lowest
Possible
Score
Ou
tpe
rfo
rmP
erf
orm
Un
de
rpe
rfo
rm
Medley Diversified Bond
Ranking vs. Peers - Intermediate Bond
Intermediate Bond Universe = 1307 Funds 9/30/2009
Total Return 36.60%
10 Year 45.00%
5 Year 32.00%
3 Year 36.00%
Rolling 12-month - 10 years 37.00%
Rolling 36-Month - 10 years 46.00%
Sharpe Ratio 33.50%
10 Year 42.00%
5 Year 27.00%
3 Year 34.00%
Information Ratio 45.90%
10 Year 47.00%
5 Year 45.00%
3 Year 46.00%
Up Capture Ratio - 10 years 33.00%
Down Capture Ratio - 10 years 65.00%
Style Consistency to Benchmark - Lehman US Intermediate Govt Index 40.00%
R2 60.00%
Avg Credit Quality 20.00%
Expense Ratio 1.20 60.00%
Total Average Ranking 44.11%STATUS PERFORM
Total Average Ranking
Performance Ranking
Ratio Statistics
Style Consistency
Fund Expense

88
0%
25%
50%
100%
4.44%
Top
Possible
Score
95.56%
Lowest
Possible
Score
Ou
tpe
rfo
rmP
erf
orm
Un
de
rpe
rfo
rm
Medley Conservative Balanced
Ranking vs. Peers - Conservative Allocation
Intermediate Bond Universe = 212 Funds 9/30/2009
Total Return 70.00%
10 Year 80.00%
5 Year 70.00%
3 Year 66.00%
Rolling 12-month - 10 years 52.00%
Rolling 36-Month - 10 years 54.00%
Sharpe Ratio 65.40%
10 Year 65.00%
5 Year 58.00%
3 Year 70.00%
Information Ratio 67.20%
10 Year 69.00%
5 Year 63.00%
3 Year 69.00%
Up Capture Ratio - 10 years 24.00%
Down Capture Ratio - 10 years 81.00%
Style Consistency to Benchmark - Conservative Allocation Category NA
R2 NA
Return Style NA
Holding Style NA
Expense Ratio 1.33 50.00%
Total Average Ranking 57.95%STATUS UNDERPERFORM
Total Average Ranking
Performance Ranking
Ratio Statistics
Style Consistency
Fund Expense

89
0%
25%
50%
100%
4.44%
Top
Possible
Score
95.56%
Lowest
Possible
Score
Ou
tpe
rfo
rmP
erf
orm
Un
de
rpe
rfo
rm
Medley Flexible Managed
Ranking vs. Peers - Conservative Allocation
Intermediate Bond Universe = 212 Funds 9/30/2009
Total Return 87.20%
10 Year 87.00%
5 Year 76.00%
3 Year 94.00%
Rolling 12-month - 10 years 49.00%
Rolling 36-Month - 10 years 44.00%
Sharpe Ratio 70.90%
10 Year 66.00%
5 Year 59.00%
3 Year 80.00%
Information Ratio 83.10%
10 Year 81.00%
5 Year 73.00%
3 Year 90.00%
Up Capture Ratio - 10 years 12.00%
Down Capture Ratio - 10 years 98.00%
Style Consistency to Benchmark - Conservative Allocation Category NA
R2 NA
Return Style NA
Holding Style NA
Expense Ratio 1.38 60.00%
Total Average Ranking 63.03%STATUS UNDERPERFORM
Total Average Ranking
Performance Ranking
Ratio Statistics
Style Consistency
Fund Expense

90
0%
25%
50%
100%
4.44%
Top
Possible
Score
95.56%
Lowest
Possible
Score
Ou
tpe
rfo
rmP
erf
orm
Un
de
rpe
rfo
rm
Medley Capital Growth
Ranking vs. Peers - Large Cap Growth
Large Cap Growth Universe = 2170 Funds 9/30/2009
Total Return 38.30%
10 Year 13.00%
5 Year 14.00%
3 Year 63.00%
Rolling 12-month - 10 years 4.00%
Rolling 36-Month - 10 years 5.00%
Sharpe Ratio 38.80%
10 Year 16.00%
5 Year 32.00%
3 Year 52.00%
Information Ratio 42.70%
10 Year 16.00%
5 Year 35.00%
3 Year 58.00%
Up Capture Ratio - 10 years 68.00%
Down Capture Ratio - 10 years 9.00%
Style Consistency to Benchmark - Russell 1000 Growth 60.00%
R2 80.00%
Return Style 80.00%
Holding Style 20.00%
Expense Ratio 1.00 40.00%
Total Average Ranking 33.98%STATUS PERFORM
Total Average Ranking
Performance Ranking
Ratio Statistics
Style Consistency
Fund Expense

91
0%
25%
50%
100%
4.44%
Top
Possible
Score
95.56%
Lowest
Possible
Score
Ou
tpe
rfo
rmP
erf
orm
Un
de
rpe
rfo
rm
Medley Equity
Ranking vs. Peers - Large Cap Growth
Large Cap Growth Universe = 2170 Funds 9/30/2009
Total Return 41.20%
10 Year 28.00%
5 Year 32.00%
3 Year 52.00%
Rolling 12-month - 10 years 7.00%
Rolling 36-Month - 10 years 9.00%
Sharpe Ratio 48.80%
10 Year 29.00%
5 Year 45.00%
3 Year 59.00%
Information Ratio 46.40%
10 Year 25.00%
5 Year 43.00%
3 Year 57.00%
Up Capture Ratio - 10 years 86.00%
Down Capture Ratio - 10 years 7.00%
Style Consistency to Benchmark - Russell 1000 Growth 53.33%
R2 60.00%
Return Style 80.00%
Holding Style 20.00%
Expense Ratio 1.22 40.00%
Total Average Ranking 37.64%STATUS PERFORM
Total Average Ranking
Performance Ranking
Ratio Statistics
Style Consistency
Fund Expense

92
0%
25%
50%
100%
4.44%
Top
Possible
Score
95.56%
Lowest
Possible
Score
Ou
tpe
rfo
rmP
erf
orm
Un
de
rpe
rfo
rm
Medley Global
Ranking vs. Peers - World Stock
World Stock Universe = 604 Funds 9/30/2009
Total Return 78.80%
10 Year 85.00%
5 Year 71.00%
3 Year 81.00%
Rolling 12-month - 10 years 83.00%
Rolling 36-Month - 10 years 79.00%
Sharpe Ratio 79.60%
10 Year 84.00%
5 Year 71.00%
3 Year 83.00%
Information Ratio 78.30%
10 Year 83.00%
5 Year 69.00%
3 Year 82.00%
Up Capture Ratio - 10 years 44.00%
Down Capture Ratio - 10 years 75.00%
Style Consistency to Benchmark - MSCI The World Index NA
R2 NA
Return Style NA
Holding Style NA
Expense Ratio 1.57 50.00%
Total Average Ranking 70.96%STATUS UNDERPERFORM
Total Average Ranking
Performance Ranking
Ratio Statistics
Style Consistency
Fund Expense

93
Range of Investments
Lower risk/lower potential reward Higher risk/higher potential reward
BALANCED
CAPITAL
PRESERVATIONINCOME HYBRID VALUE BLEND GROWTH
LARGE BLEND
- Medley Stock Index
LARGE GROWTH
- Medley Capital Growth
- Medley Equity
FO
RE
IGN WORLD STOCK
- Medley Global
EQUITYFIXED INCOME
DO
ME
ST
IC
MONEY MARKET
- Medley Money Market
STABLE VALUE
- Prudential GIA
INTERMEDIATE
GOVERNMENT
- Medley Govt Income
INTERMEDIATE BOND
- Medley Diversified Bond
CONSERVATIVE
ALLOCATION
- Medley Conservative
Balanced
- Medley Flexible Managed

94
Management Style (Returns-based)D
om
es
tic E
qu
ity
Fo
reig
n E
qu
ity
M anager Style
October 2006 - September 2009
USD, single data window; exp. weighted, rescaled
-2
-1
0
1
2
Sm
all
- L
arg
e
-2 -1 0 1 2
V a l u e - G ro w th
Top Value Top Growth
Mid Value Mid Growth
Sm Value Sm Growth
Russell Style Indices
Medley Stock Index
Medley Captial Growth
Medley Equity Account
M anager Style
October 2006 - September 2009
USD, single data window; exp. weighted, rescaled
-2
-1
0
1
2
Sm
all
- L
arg
e
-2 -1 0 1 2
E u ro p e - A si a
Europe Lg
Europe Sm
AsiaPac Lg
AsiaPac Sm
S&P Int'l Equity Indices
Medley Global Account
M anager Style
October 1999 - September 2009
USD, 36-month centered window; exp. weighted, rescaled
-2
-1
0
1
2
Sm
all
- L
arg
e
-2 -1 0 1 2
V a l u e - G ro w th
Top Value Top Growth
Mid Value Mid Growth
Sm Value Sm Growth
Russell Style Indices
Medley Stock Index
Medley Captial Growth
Medley Equity Account
M anager Style
October 1999 - September 2009
USD, 36-month centered window; exp. weighted, rescaled
-2
-1
0
1
2
Sm
all
- L
arg
e
-2 -1 0 1 2
E u ro p e - A si a
Europe Lg
Europe Sm
AsiaPac Lg
AsiaPac Sm
S&P Int'l Equity Indices
Medley Global Account
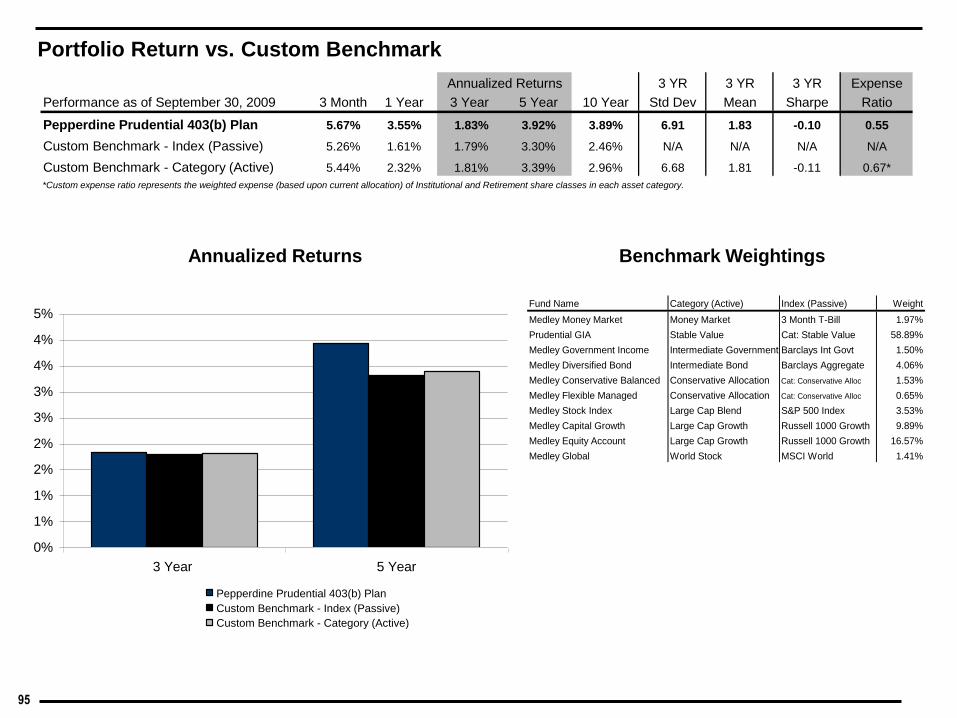
95
Portfolio Return vs. Custom Benchmark
Annualized Returns Benchmark Weightings
3 YR 3 YR 3 YR Expense
Performance as of September 30, 2009 3 Month 1 Year 3 Year 5 Year 10 Year Std Dev Mean Sharpe Ratio
Pepperdine Prudential 403(b) Plan 5.67% 3.55% 1.83% 3.92% 3.89% 6.91 1.83 -0.10 0.55
Custom Benchmark - Index (Passive) 5.26% 1.61% 1.79% 3.30% 2.46% N/A N/A N/A N/A
Custom Benchmark - Category (Active) 5.44% 2.32% 1.81% 3.39% 2.96% 6.68 1.81 -0.11 0.67*
Annualized Returns
*Custom expense ratio represents the weighted expense (based upon current allocation) of Institutional and Retirement share classes in each asset category.
0%
1%
1%
2%
2%
3%
3%
4%
4%
5%
3 Year 5 Year
Pepperdine Prudential 403(b) Plan
Custom Benchmark - Index (Passive)
Custom Benchmark - Category (Active)
Fund Name Category (Active) Index (Passive) Weight
Medley Money Market Money Market 3 Month T-Bill 1.97%
Prudential GIA Stable Value Cat: Stable Value 58.89%
Medley Government Income Intermediate Government Barclays Int Govt 1.50%
Medley Diversified Bond Intermediate Bond Barclays Aggregate 4.06%
Medley Conservative Balanced Conservative Allocation Cat: Conservative Alloc 1.53%
Medley Flexible Managed Conservative Allocation Cat: Conservative Alloc 0.65%
Medley Stock Index Large Cap Blend S&P 500 Index 3.53%
Medley Capital Growth Large Cap Growth Russell 1000 Growth 9.89%
Medley Equity Account Large Cap Growth Russell 1000 Growth 16.57%
Medley Global World Stock MSCI World 1.41%

Prudential Plan - Asset Allocation
September 30, 2009
Section 7

97
Asset Allocation by Fund
Fund % of Assets Assets ($)Evaluation
Methodology
Prudential Guaranteed Interest 58.89% 2,019,847$ N/A
Medley Equity 16.57% 568,151$ Perform
Medley Capital Growth 9.89% 339,064$ Perform
Medley Diversified Bond 4.06% 139,263$ Perform
Medley Stock Index 3.53% 121,232$ N/A
Medley Money Market 1.97% 67,479$ N/A
Medley Conservative Balanced 1.53% 52,361$ Underperform
Medley Government Income 1.50% 51,436$ Underperform
Medley Global 1.41% 48,467$ Underperform
Medley Flexible Managed 0.65% 22,392$ Underperform
Total 100.00% 3,429,692$

98
Asset Allocation by Category (%)
60.86%
5.56%
26.46%
2.18%3.53%
1.41%
0.00%
10.00%
20.00%
30.00%
40.00%
50.00%
60.00%
70.00%
Fixed Bond Conservative Large Cap International
Large Cap Blend Large Cap Growth
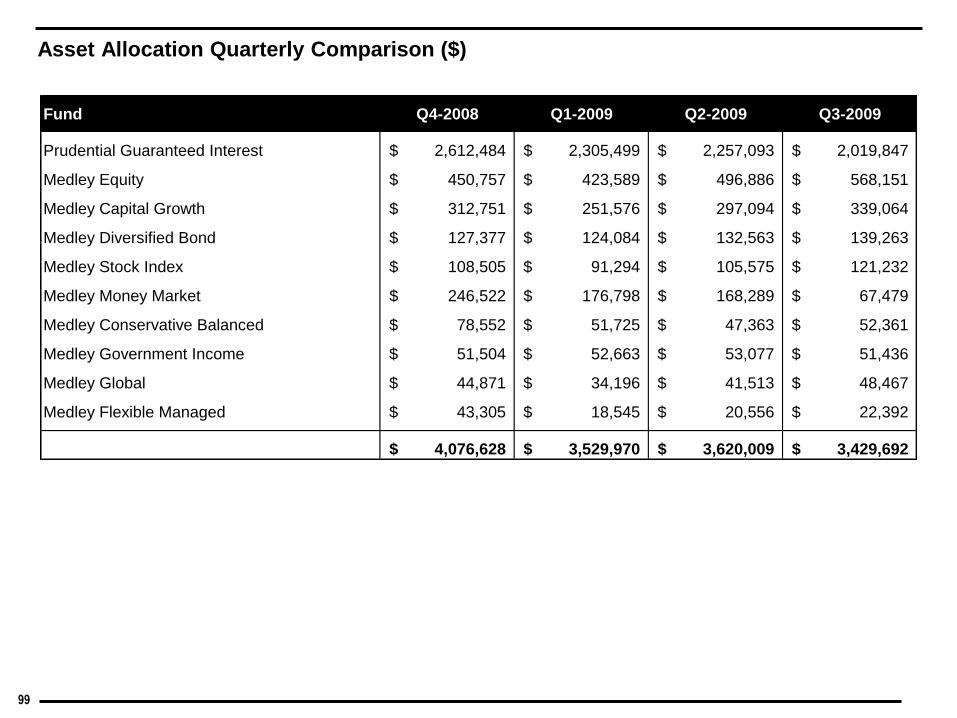
99
Asset Allocation Quarterly Comparison ($)
Fund Q4-2008 Q1-2009 Q2-2009 Q3-2009
Prudential Guaranteed Interest 2,612,484$ 2,305,499$ 2,257,093$ 2,019,847$
Medley Equity 450,757$ 423,589$ 496,886$ 568,151$
Medley Capital Growth 312,751$ 251,576$ 297,094$ 339,064$
Medley Diversified Bond 127,377$ 124,084$ 132,563$ 139,263$
Medley Stock Index 108,505$ 91,294$ 105,575$ 121,232$
Medley Money Market 246,522$ 176,798$ 168,289$ 67,479$
Medley Conservative Balanced 78,552$ 51,725$ 47,363$ 52,361$
Medley Government Income 51,504$ 52,663$ 53,077$ 51,436$
Medley Global 44,871$ 34,196$ 41,513$ 48,467$
Medley Flexible Managed 43,305$ 18,545$ 20,556$ 22,392$
4,076,628$ 3,529,970$ 3,620,009$ 3,429,692$

100
Asset Allocation Quarterly Comparison (%)
64.0
8%
11.0
6%
7.6
7%
3.1
2%
2.6
6% 6.0
5%
1.9
3%
1.2
6%
1.1
0%
1.0
6%
65.3
1%
12.0
0%
7.1
3%
3.5
2%
2.5
9%
5.0
1%
1.4
7%
1.4
9%
0.9
7%
0.5
3%
62.3
5%
13.7
3%
8.2
1%
3.6
6%
2.9
2%
4.6
5%
1.3
1%
1.4
7%
1.1
5%
0.5
7%
58.8
9%
16.5
7%
9.8
9%
4.0
6%
3.5
3%
1.9
7%
1.5
3%
1.5
0%
1.4
1%
0.6
5%
0%
10%
20%
30%
40%
50%
60%
70%P
rude
ntia
l G
uara
nte
ed
Inte
rest
Me
dle
y E
quity
Me
dle
y C
apita
l G
row
th
Me
dle
y D
ive
rsifie
d B
ond
Me
dle
y S
tock I
nde
x
Me
dle
y M
on
ey M
ark
et
Me
dle
y C
onse
rva
tive
Ba
lance
d
Me
dle
y G
ove
rnm
en
t
Inco
me
Me
dle
y G
loba
l
Me
dle
y F
lexib
le M
an
age
d
Q4-2008
Q1-2009
Q2-2009
Q3-2009

101
Growth of Plan Assets
$-
$1,000,000
$2,000,000
$3,000,000
$4,000,000
$5,000,000
$6,000,000
Plan Assets $4,810,807 $4,901,610 $4,443,301 $4,076,628 $3,529,970 $3,620,009 $3,429,692
Mar-08 June-08 Sept-08 Dec-08 Mar-09 June-09 Sept-09

103
Evaluation Methodology Changes
Effective 9/30/2007 – Change to Foreign Large Cap Equity Universe
The evaluation methodology for foreign large cap equity funds has been changed to broaden the universe to include value, blend and growth
funds. The rationale for this change was based on the following criteria:
• Return-based style analysis illustrates that foreign large cap equity funds do not display strong style consistency quarter over quarter
• The portfolio characteristics (P/E, regional exposure, market caps) are highly correlated across the value, blend and growth categories
• Foreign equity fund mandates (prospectus objectives and guidelines) generally allow managers greater flexibility to invest in companies with
various style versus their domestic counterparts
• Foreign funds can invest across regions and countries whose market valuations are affected by individual currency and interest rates that are
inherent to those areas, therefore, classifying holdings in traditional value and growth categories may not accurately reflect the manager’s stock
selection style. For example, a high P/E growth company (based upon domestic measures) in Japan may be classified as a value stock simply
because the Japanese market is undervalued compared to other foreign markets, thereby undervaluing the individual companies.
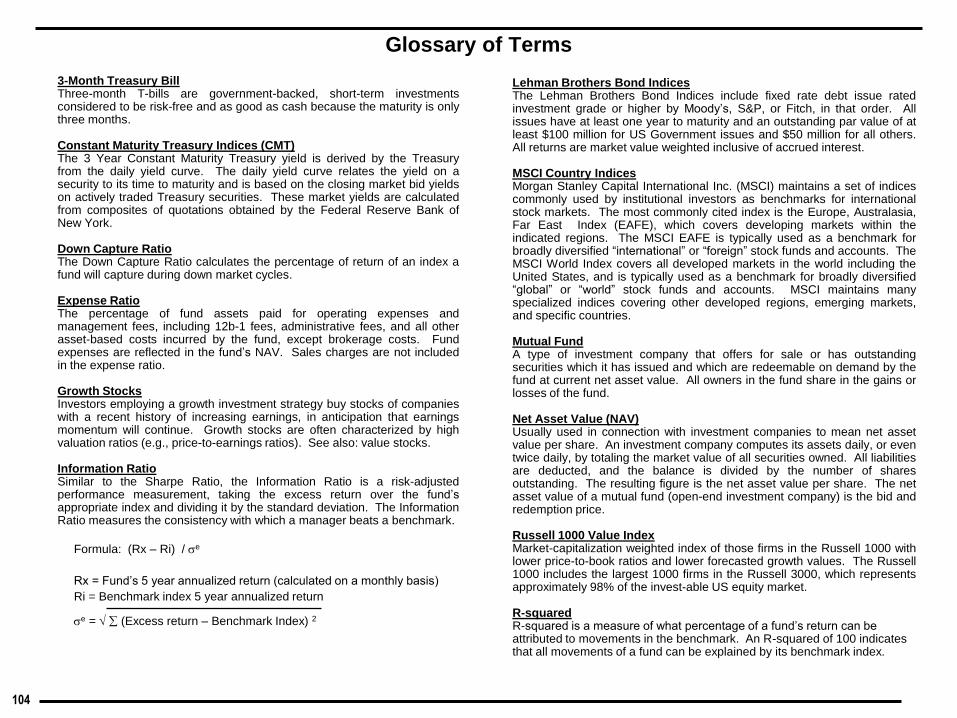
104
Glossary of Terms
3-Month Treasury BillThree-month T-bills are government-backed, short-term investmentsconsidered to be risk-free and as good as cash because the maturity is onlythree months.
Constant Maturity Treasury Indices (CMT)The 3 Year Constant Maturity Treasury yield is derived by the Treasuryfrom the daily yield curve. The daily yield curve relates the yield on asecurity to its time to maturity and is based on the closing market bid yieldson actively traded Treasury securities. These market yields are calculatedfrom composites of quotations obtained by the Federal Reserve Bank ofNew York.
Down Capture RatioThe Down Capture Ratio calculates the percentage of return of an index afund will capture during down market cycles.
Expense RatioThe percentage of fund assets paid for operating expenses andmanagement fees, including 12b-1 fees, administrative fees, and all otherasset-based costs incurred by the fund, except brokerage costs. Fundexpenses are reflected in the fund’s NAV. Sales charges are not includedin the expense ratio.
Growth StocksInvestors employing a growth investment strategy buy stocks of companieswith a recent history of increasing earnings, in anticipation that earningsmomentum will continue. Growth stocks are often characterized by highvaluation ratios (e.g., price-to-earnings ratios). See also: value stocks.
Information RatioSimilar to the Sharpe Ratio, the Information Ratio is a risk-adjustedperformance measurement, taking the excess return over the fund’sappropriate index and dividing it by the standard deviation. The InformationRatio measures the consistency with which a manager beats a benchmark.
Formula: (Rx – Ri) / e
Rx = Fund’s 5 year annualized return (calculated on a monthly basis)
Ri = Benchmark index 5 year annualized return
e = (Excess return – Benchmark Index) 2
Lehman Brothers Bond IndicesThe Lehman Brothers Bond Indices include fixed rate debt issue ratedinvestment grade or higher by Moody’s, S&P, or Fitch, in that order. Allissues have at least one year to maturity and an outstanding par value of atleast $100 million for US Government issues and $50 million for all others.All returns are market value weighted inclusive of accrued interest.
MSCI Country IndicesMorgan Stanley Capital International Inc. (MSCI) maintains a set of indicescommonly used by institutional investors as benchmarks for internationalstock markets. The most commonly cited index is the Europe, Australasia,Far East Index (EAFE), which covers developing markets within theindicated regions. The MSCI EAFE is typically used as a benchmark forbroadly diversified “international” or “foreign” stock funds and accounts. TheMSCI World Index covers all developed markets in the world including theUnited States, and is typically used as a benchmark for broadly diversified“global” or “world” stock funds and accounts. MSCI maintains manyspecialized indices covering other developed regions, emerging markets,and specific countries.
Mutual FundA type of investment company that offers for sale or has outstandingsecurities which it has issued and which are redeemable on demand by thefund at current net asset value. All owners in the fund share in the gains orlosses of the fund.
Net Asset Value (NAV)Usually used in connection with investment companies to mean net assetvalue per share. An investment company computes its assets daily, or eventwice daily, by totaling the market value of all securities owned. All liabilitiesare deducted, and the balance is divided by the number of sharesoutstanding. The resulting figure is the net asset value per share. The netasset value of a mutual fund (open-end investment company) is the bid andredemption price.
Russell 1000 Value IndexMarket-capitalization weighted index of those firms in the Russell 1000 withlower price-to-book ratios and lower forecasted growth values. The Russell1000 includes the largest 1000 firms in the Russell 3000, which representsapproximately 98% of the invest-able US equity market.
R-squaredR-squared is a measure of what percentage of a fund’s return can be attributed to movements in the benchmark. An R-squared of 100 indicates that all movements of a fund can be explained by its benchmark index.

105
Glossary of Terms
Russell 1000 Growth IndexMarket-capitalization weighted index of those firms in the Russell 1000 withhigher price-to-book ratios and higher forecasted growth values. TheRussell 1000 includes the largest 1000 firms in the Russell 3000, whichrepresents approximately 98% of the invest-able US equity market.
Russell Mid Cap Value IndexMarket-weighted total return index that measures the performance ofcompanies within the Russell 2000 having lower price-to-book ratios andlower forecasted growth values. The Russell 2000 includes the 2000 firmsin the Russell 3000 with the smallest market capitalizations. The Russell3000 Index represents approximately 98% of the invest-able US equitymarket.
Russell Mid Cap Growth IndexMarket-weighted total return index that measures the performance ofcompanies within the Russell 2000 having higher price-to-book ratios andhigher forecasted growth values. The Russell 2000 includes firms 201through 1000, based on market capitalization, from the Russell 3000. TheRussell 3000 Index represents approximately 98% of the invest-able USequity market.
Russell 2000 Value Index
Market-weighted total return index that measures the performance of companies within the Russell 2000 Index having lower price-to-book ratios and lower forecasted growth values. The Russell 2000 Index includes the 2000 firms from the Russell 3000 Index with the smallest market capitalizations. The Russell 3000 Index represents 98% of the investable US equity market.
Russell 2000 Growth Index
Market-weighted total return index that measures the performance ofcompanies within the Russell 2000 Index having higher price-to-book ratiosand higher forecasted growth values. The Russell 2000 Index includes the2000 firms from the Russell 3000 Index with the smallest marketcapitalizations. The Russell 3000 Index represents 98% of the investableUS equity market.
S&P 500 IndexThe S&P 500 Index consists of widely held common stocks, consisting offour broad sectors (industrials, utilities, financial, and transportation). It is amarket-value weighted index (stock price times shares outstanding), witheach stock affecting the index in proportion to its market value. This index,calculated by Standard & Poor’s, is a total return index with dividendsreinvested.
Sharpe RatioA direct measure of reward-to-risk. Defined as:
Formula: (Rx - Rf) / x
Rx = Average annual rate of return of XRf = Best available rate of return of a “risk-free” security (3 month T-bill)
x = (Excess return – 3 month T-bill) 2
Sharpe ratio measures the efficiency in the amount of risk taken ascompared to the reward received for taking such risk.
Standard DeviationA statistical measurement of dispersion about an average, which, for amutual fund, depicts how widely the returns varied over a certain period oftime. Investors use the standard deviation of historical performance to try topredict the range of returns that are most likely for a given fund. When afund has a high standard deviation, the predicted range of performance iswide, implying greater volatility.
Total ReturnsReturns for periods longer than one year are expressed as “annualizedreturns.” This is equivalent to the compound rate of return which, over acertain period of time, would produce a fund’s total return over that sameperiod.
Up Capture RatioThe Up Capture Ratio calculates the percentage return of an index a fundwill capture during up market cycles.
Value StocksInvestors employing a value investment strategy buy stocks of companiesthey believe are under-priced based on their fundamental ability to generateearnings, in anticipation that the price performance of the stock will reverse.Value stocks are often characterized by low valuation ratios (e.g., price-to-earnings ratios). See also: growth stocks.
Wilshire 4500Measures the performance of all US common equity securities excluding thestocks in the S&P 500. Wilshire indices are reported as total returns withdividends reinvested.

106
Retirement Plan Limits
ITEM IRS CODE 2010 2009 2008 2007 2006
Defined Contribution Annual Limit 1
415 (c)(1)(A) 49,000$ 49,000$ 46,000$ 45,000$ 44,000$
Defined Benefit Annual Limit 1
415 (b)(1)(A) 195,000$ 195,000$ 185,000$ 180,000$ 175,000$
Maximum Compensation Limit 2
401(a)(17) 245,000$ 245,000$ 230,000$ 225,000$ 220,000$
401(k) & 403(b) Employee Deferral Limit 3
402(g)(1) 16,500$ 16,500$ 15,500$ 15,500$ 15,000$
Catch-Up Deferral Limit 4
414(v)(2)(B)(i) 5,500$ 5,500$ 5,000$ 5,000$ 5,000$
Highly Compensated Employee (HCE) Compensation Level 5
414(q)(1)(B) 110,000$ 110,000$ 105,000$ 100,000$ 100,000$
Maximum SIMPLE Plan Deferral Limit 1
408(p)(2)(E) 11,500$ 11,500$ 10,500$ 10,500$ 10,000$
Social Security Tax Wage Base 106,800$ 106,800$ 102,000$ 97,500$ 94,200$
1 Limits are applied for the calendar year.
2 Based on year in which plan year begins. All compensation from a single employer (including all members of a controlled group) must be aggregated for purposes of this limit.
3 Employee deferrals to 401(k) and 403(b) plans must be aggregated for purposes of this limit. Limits are applied during the calendar year.
4 Available to employees age 50 and older during the calendar year.
5 For the 2009 plan year, an employee who earns $105,000 in 2008 is an HCE. For the 2010 plan year, an employee who earns $110,000 in 2009 is an HCE.

107
WARRANTIES
This report was prepared by Benefit Funding Services Group using data compiled from various sources. Benefit Funding Services
Group does not warrant the accuracy of data provided by other sources, but does make reasonable efforts to obtain and utilize only
reliable information.
Past investment performance does not guarantee future results.
The material in this report is for Plan Sponsor use only and should not be reproduced without written permission by Benefit Funding
Services Group.
DISCLOSURES
Returns stated in this report are net of fees unless otherwise noted.
Sharpe Ratio and Standard Deviation data are provided for a 3-year period prior to the reporting date, unless otherwise noted.
Calculations for returns-based style analysis charts are done by MPI Stylus.
Evaluation methodology calculations are provided by MPI Stylus and Morningstar, Inc.
Universe information is provided by Morningstar, Inc.
Fund details and portfolio characteristics are provided by Morningstar, Inc. with the most recent data available from the investment
companies.
Investment advisory services offered through Investment Advisor Representatives of Benefit Funding Services Group.
Benefit Funding Services Group
2040 Main Street, Suite #150, Irvine, CA 92614
Phone 949.955.2552 Fax 949.955.2553
Top Related