


Languages
Pages
Legal


PORTSMOUTH, VIRGINIA
5731 Portsmouth Blvd RETAIL FOR SALE & LEASE
Jeff Parker, CCIM®
Senior Vice President+1 757 213 [email protected]
CONTACT
PROPERTY FEATURES• Two buildings on 1.08 acres for sale or lease
• One 3,500 SF building & one 1,270 SF building
• Pylon signage available
• Site currently used as retail
• AADT 19,000: Portsmouth Blvd & Elmhurst Lane (2016)
• Perfect for retail, restaurant, dry cleaner, daycare, medical or redevelopment
© 2018 CB Richard Ellis of Virginia, Inc. This information has been obtained from sources believed reliable. We have not verified it and make no guarantee, warranty or representation about it. Any projections, opinions, assumptions or estimates used are for example only and do not represent the current or future performance of the property. You and your advisors should conduct a careful, independent investigation of the property to determine to your satisfaction the suitability of the property for your needs. CBRE and the CBRE logo are service marks of CBRE, Inc. and/or its affiliated or related companies in the United States and other countries. All other marks displayed on this document are the property of their respective owners.
NEW LISTING!
AVAILABLE

SUMMARYPROPERTY DESCRIPTIONLocated in between Hardees and Sonic in a vibrant neighborhood corridor on Portsmouth Blvd.
ADDRESS 5731 Portsmouth Blvd, Portsmouth, Virginia
TOTAL LOT SIZE 1.08 acres• 3,500 SF building• 1,270 SF building
SALE PRICE$550,000
LEASE RATE Bldg One : $15.00 NNNBldg, Two : $18.00 NNN
ZONING C-1
FEATURES • 140 ft frontage on Portsmouth Blvd• Prime redevelopment or value add retail site• Turn lane access to site
2017 Estimated Demographics
1-Mile 3-Mile 5-Mile
Population 11,268 75,877 164,358
Average HH Income $59,972 $69,894 $66,353
Daytime Population 7,564 69,919 171,783
PORTSMOUTH, VIRGINIA
5731 Portsmouth Blvd RETAIL FOR SALE & LEASE

5731 Portsmouth Blvd PORTSMOUTH, VIRGINIA
RETAIL FOR SALE & LEASE

SIT
E
PO
RTS
MO
UTH
BLV
D
5731
Por
tsm
outh
Blv
d R
ETA
IL F
OR
SA
LE &
LEA
SE
PORT
SMO
UTH
, V
IRG
INIA

SIT
E
PO
RTS
MO
UTH
BLV
D
5731
Por
tsm
outh
Blv
d R
ETA
IL F
OR
SA
LE &
LEA
SE
PORT
SMO
UTH
, V
IRG
INIA

DEMOGRAPHIC PROFILE
5731 PORTSMOUTH BLVD
1 MILE 3 MILES 5 MILES
2017 Businesses 209 2,048 4,362
2017 Employees 2,035 31,681 79,904
2017 Population - Current Year Estimate 11,268 75,877 164,358
2022 Population - Five Year Projection 11,299 78,222 170,194
2010 Population - Census 11,286 72,918 157,169
2000 Population - Census 11,242 72,913 154,302
2010-2017 Annual Population Growth Rate -0.02% 0.55% 0.62%
2017-2022 Annual Population Growth Rate 0.05% 0.61% 0.70%
2017 Population 11 ,268 75 ,877 164 ,358Age 0-4 724 6.4% 4,510 5.9% 10,798 6.6%Age 5-9 732 6.5% 4,689 6.2% 10,995 6.7%Age 10-14 696 6.2% 4,663 6.1% 10,724 6.5%Age 15-19 596 5.3% 4,430 5.8% 10,111 6.2%Age 20-24 595 5.3% 4,563 6.0% 10,908 6.6%Age 25-29 792 7.0% 5,150 6.8% 12,302 7.5%Age 30-34 926 8.2% 5,039 6.6% 11,804 7.2%Age 35-39 838 7.4% 4,782 6.3% 10,959 6.7%Age 40-44 665 5.9% 4,444 5.9% 9,905 6.0%Age 45-49 635 5.6% 4,667 6.2% 10,094 6.1%Age 50-54 705 6.3% 5,185 6.8% 10,898 6.6%Age 55-59 765 6.8% 5,465 7.2% 11,091 6.7%Age 60-64 687 6.1% 4,946 6.5% 9,706 5.9%Age 65-69 578 5.1% 4,319 5.7% 8,108 4.9%Age 70-74 452 4.0% 3,195 4.2% 5,920 3.6%Age 75-79 356 3.2% 2,338 3.1% 4,103 2.5%Age 80-84 249 2.2% 1,636 2.2% 2,810 1.7%Age 85 and Older 277 2.5% 1,857 2.4% 3,123 1.9%
2017 Median Age 38.4 40.1 37.1
2017 Population 11 ,268 75 ,877 164 ,358
White 7,911 70.2% 38,664 51.0% 74,375 45.3%
Black or African American 2,634 23.4% 31,786 41.9% 77,005 46.9%
Asian 162 1.4% 1,655 2.2% 3,520 2.1%
American Indian or Alaska Native 59 0.5% 307 0.4% 704 0.4%
Pacific Islander 25 0.2% 100 0.1% 224 0.1%
Other Race 101 0.9% 980 1.3% 2,608 1.6%
Two or More Races 376 3.3% 2,384 3.1% 5,921 3.6%
Hispanic 486 4.3% 3,110 4.1% 8,360 5.1%
White Non-Hispanic 7,636 67.8% 37,238 49.1% 70,690 43.0%
©2018 CBRE. This information has been obtained from sources believed reliable. We have not verified it and make no guarantee, warranty or representation about it. Any projections, opinions, assumptions or estimates used are forexample only and do not represent the current or future performance of the property. You and your advisors should conduct a careful, independent investigation of the property to determine to your satisfaction the suitability of the propertyfor your needs. Source: Esri Page 1 ProjectID:311021
PLACE OF WORK
POPULAT ION
A G E
RACE AND ETHNIC ITY
PORTSMOUTH, VIRGINIA
5731 Portsmouth Blvd RETAIL FOR SALE & LEASE

DEMOGRAPHIC PROFILE
5731 PORTSMOUTH BLVD
1 MILE 3 MILES 5 MILES
2017 Population 25 and Over 7 ,926 53 ,021 110 ,823
Less than 9th Grade 336 4.2% 1,782 3.4% 3,939 3.6%
9-12th Grade - No Diploma 722 9.1% 5,080 9.6% 10,649 9.6%
High School Diploma 2,392 30.2% 12,751 24.0% 25,315 22.8%
GED or Alternative Credential 458 5.8% 2,831 5.3% 6,018 5.4%
Some College - No Degree 1,968 24.8% 12,903 24.3% 28,172 25.4%
Associate`s Degree 655 8.3% 4,429 8.4% 9,803 8.8%
Bachelor`s Degree 1,010 12.7% 8,376 15.8% 17,252 15.6%
Graduate or Professional Degree 385 4.9% 4,869 9.2% 9,675 8.7%
2017 Population 11 ,268 75 ,877 164 ,358
Males 5,405 48.0% 36,404 48.0% 78,830 48.0%
Females 5,863 52.0% 39,472 52.0% 85,528 52.0%
2017 Population 15+ 9 ,116 62 ,014 131 ,840
Never Married 3,094 33.9% 20,235 32.6% 46,620 35.4%
Married 4,067 44.6% 29,491 47.6% 60,272 45.7%
Widowed 720 7.9% 4,624 7.5% 8,528 6.5%
Divorced 1,235 13.5% 7,664 12.4% 16,420 12.5%
2017 Civi l ian Population 16+ in Labor Force 5 ,974 37 ,291 79 ,867
2017 Employed Civilian Population 16+ 5,812 97.3% 34,966 93.8% 74,224 92.9%
2017 Unemployed Population 16+ 162 2.7% 2,324 6.2% 5,643 7.1%
2017 Employed Civi l ian Population 16+ 5 ,812 34 ,966 74 ,224
White Collar 2,879 49.5% 20,110 57.5% 42,261 56.9%
Services 1,286 22.1% 6,302 18.0% 14,177 19.1%
Blue Collar 1,647 28.3% 8,553 24.5% 17,788 24.0%
2017 Daytime Population 7 ,564 69 ,919 171 ,783
Daytime Workers 2,066 27.3% 29,675 42.4% 84,179 49.0%
Daytime Residents 5,498 72.7% 40,244 57.6% 87,604 51.0%
©2018 CBRE. This information has been obtained from sources believed reliable. We have not verified it and make no guarantee, warranty or representation about it. Any projections, opinions, assumptions or estimates used are forexample only and do not represent the current or future performance of the property. You and your advisors should conduct a careful, independent investigation of the property to determine to your satisfaction the suitability of the propertyfor your needs. Source: Esri Page 2 ProjectID:311021
EDUCAT ION
GENDER
MAR ITAL STATUS
EMPLOYMENT STATUS
CLASS OF WORKER
DAYT IME POPULAT ION
PORTSMOUTH, VIRGINIA
5731 Portsmouth Blvd RETAIL FOR SALE & LEASE

DEMOGRAPHIC PROFILE
5731 PORTSMOUTH BLVD
1 MILE 3 MILES 5 MILES
2017 Households - Current Year Estimate 4,737 28,778 61,905
2022 Households - Five Year Projection 4,738 29,552 63,933
2010 Households - Census 4,765 27,793 59,334
2000 Households - Census 4,794 27,905 56,860
2010-2017 Annual Household Growth Rate -0.08% 0.48% 0.59%
2017-2022 Annual Household Growth Rate 0.00% 0.53% 0.65%
2017 Average Household Size 2.38 2.59 2.60
2017 Households 4 ,737 28 ,778 61 ,897
Under $15,000 600 12.7% 3,072 10.7% 7,111 11.5%
$15,000-$24,999 457 9.6% 2,702 9.4% 6,173 10.0%
$25,000-$34,999 610 12.9% 2,892 10.0% 6,386 10.3%
$35,000-$49,999 922 19.5% 4,205 14.6% 9,292 15.0%
$50,000-$74,999 878 18.5% 5,536 19.2% 11,873 19.2%
$75,000-$99,999 625 13.2% 4,068 14.1% 8,789 14.2%
$100,000-$149,999 385 8.1% 4,108 14.3% 8,170 13.2%
$150,000-$199,999 124 2.6% 1,234 4.3% 2,445 4.0%
$200,000 and Over 136 2.9% 961 3.3% 1,659 2.7%
2017 Average Household Income $59,972 $69,894 $66,353
2022 Average Household Income $67,884 $77,655 $73,991
2017 Median Household Income $45,351 $54,987 $52,903
2022 Median Household Income $46,987 $57,399 $55,271
2017 Per Capita Income $25,243 $26,879 $25,421
2022 Per Capita Income $28,493 $29,705 $28,203
2017 Owner Occupied Housing Units 2 ,778 20 ,006 37 ,952
Under $50,000 60 2.2% 442 2.2% 1,132 3.0%
$50,000-$99,999 113 4.1% 859 4.3% 1,809 4.8%
$100,000-$149,999 578 20.8% 3,067 15.3% 5,338 14.1%
$150,000-$199,999 1,139 41.0% 4,590 22.9% 8,921 23.5%
$200,000-$249,999 469 16.9% 3,295 16.5% 6,699 17.7%
$250,000-$299,999 154 5.5% 2,245 11.2% 4,430 11.7%
$300,000-$399,999 165 5.9% 3,062 15.3% 5,902 15.6%
$400,000-$499,999 26 0.9% 1,010 5.0% 1,631 4.3%
$500,000-$749,999 34 1.2% 881 4.4% 1,269 3.3%
$750,000-$999,999 24 0.9% 295 1.5% 459 1.2%
$1,000,000 and Over 17 0.6% 261 1.3% 361 1.0%
2017 Median Value of Owner Occ. Housing Units $178,029 $215,865 $213,252
2017 Average Value of Owner Occ. Housing Units $202,366 $264,010 $251,998
©2018 CBRE. This information has been obtained from sources believed reliable. We have not verified it and make no guarantee, warranty or representation about it. Any projections, opinions, assumptions or estimates used are forexample only and do not represent the current or future performance of the property. You and your advisors should conduct a careful, independent investigation of the property to determine to your satisfaction the suitability of the propertyfor your needs. Source: Esri Page 3 ProjectID:311021
HOUSEHOLDS
HOUSEHOLD INCOME
HOUS ING VALUE
PORTSMOUTH, VIRGINIA
5731 Portsmouth Blvd RETAIL FOR SALE & LEASE
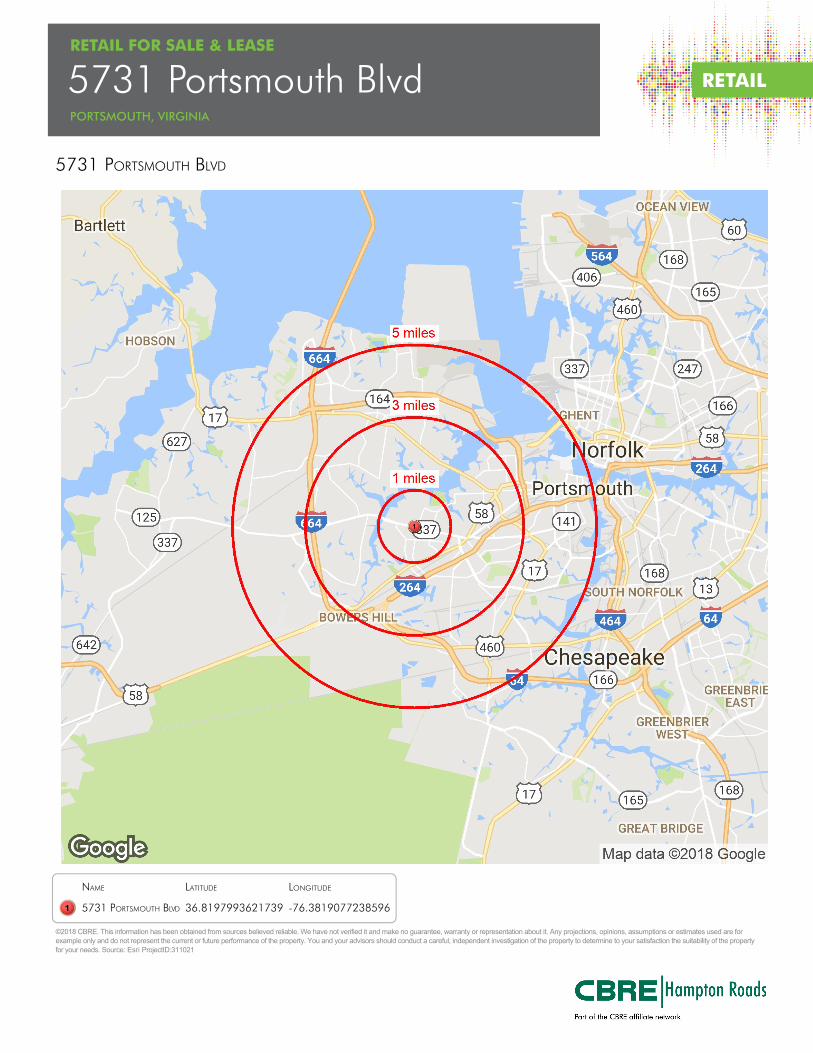
DEMOGRAPHIC PROFILE
5731 PORTSMOUTH BLVD
NAME LATITUDE LONGITUDE
5731 PORTSMOUTH BLVD 36.8197993621739 -76.3819077238596
©2018 CBRE. This information has been obtained from sources believed reliable. We have not verified it and make no guarantee, warranty or representation about it. Any projections, opinions, assumptions or estimates used are forexample only and do not represent the current or future performance of the property. You and your advisors should conduct a careful, independent investigation of the property to determine to your satisfaction the suitability of the propertyfor your needs. Source: Esri ProjectID:311021
PORTSMOUTH, VIRGINIA
5731 Portsmouth Blvd RETAIL FOR SALE & LEASE
Top Related