


Languages
Pages
Legal

Results for the Full Year 2017
Key financial and operating highlights in the full year 2017
� Group total revenues rose by 3.0% on a proforma1 basis (reported: +4.1%), EBITDA increased by 2.0% (rep.: +3.2%).
� Revenue increase driven by growth in fixed-line service revenues and equipment revenues, while mobile service revenues
were lower due to roaming; the revenue increase was driven by all markets except for the Republic of Macedonia.
� Full year OPEX increased due to intensified sales activities and investments in A1 Digital, but also regulation-driven roam-
ing expenses and higher than usual non-recurring items in Q4.
� EBITDA development in the full year 2017 was also impacted by:
� Restructuring in Austria: positive EUR 18.2 mn in 2017 compared to a negative EUR 7.2 mn effect in 2016. � Positive FX effects in 2017: EUR 11.0 mn in revenues; EUR 3.3 mn in EBITDA. � Positive one-off effects in total revenues and EBITDA of EUR 23.8 mn in 2017 compared to positive one-off effects in
EBITDA of EUR 21.4 mn in 2016 (details see p. 25). � Solid operational trend in the first nine months of 2017 weakened by seasonally lower EBITDA margin in Q4 but also higher
Q4 OPEX versus last year driven by additional investments realising market opportunities in the Christmas season, A1 Digi-tal and higher than usual non-recurring items.
� Negative roaming effect on EBITDA of approx. EUR 20 mn in 2017; high usage elasticity and higher than expected visitor roaming revenues at a Group level.
� Reported net result of EUR 345.5 mn in 2017 compared to EUR 413.2 mn in 2016, negatively impacted by brand value
amortisation in the amount EUR 123.2 mn in 2017; excluding D&A from brand value amortisation reported net result
grew by 13.4% in 2017.
� Free cash flow growth of 65.8% year-on-year to EUR 384.7 mn.
� Group outlook 2018: total revenue growth of 1-2% (on a reported basis), CAPEX2 of approximately EUR 750 mn.
Key performance indicators Proforma view
in EUR million Q4 2017 reported
Q4 2016 proforma % change
1-12 M 2017 reported
1-12 M 2016 proforma % change
Total revenues 1,130.0 1,110.8 1.7 4,382.5 4,254.9 3.0
Service revenues 940.2 941.1 – 0.1 3,775.3 3,715.8 1.6
Equipment revenues 161.5 141.3 14.2 504.4 450.4 12.0
Other operating income 28.2 28.4 – 0.7 102.8 88.7 15.8
EBITDA 288.3 278.7 3.5 1,397.3 1,370.4 2.0
% total revenues 25.5% 25.1% 31.9% 32.2%
EBIT – 20.1 53.9 n.m. 443.9 496.2 – 10.5
% total revenues – 1.8% 4.9% 10.1% 11.7%
Wireless indicators Q4 2017 reported
Q4 2016 proforma % change
1-12 M 2017 reported
1-12 M 2016 proforma % change
Wireless subscribers (thousands) 20,657.7 20,707.8 – 0.2 20,657.7 20,707.8 – 0.2
thereof postpaid 15,580.7 15,041.0 3.6 15,580.7 15,041.0 3.6
thereof prepaid 5,077.1 5,666.8 – 10.4 5,077.1 5,666.8 – 10.4
MoU (per Ø subscriber)*) 341.6 328.0 4.1 330.9 322.9 2.5
ARPU (EUR) 8.5 8.6 – 2.2 8.6 8.7 – 0.8
Churn (%) 2.2% 2.2% 2.0% 2.0%
Wireline indicators Q4 2017 reported
Q4 2016 proforma % change
1-12 M 2017 reported
1-12 M 2016 proforma % change
RGUs (thousands) 6,036.5 6,075.8 – 0.6 6,036.5 6,075.8 – 0.6 All financial figures are based on IFRS; if not stated otherwise, all comparisons are given year-on-year. EBITDA is defined as net income excluding financial result, income taxes, depreciation and amortisation and impairment charges. *) Minutes of Use no longer include M2M subscribers. Comparative figures have been adjusted accordingly. 1 Proforma figures include M&A transactions made between the start of the comparison period and the end of the reporting period. 2 Does not include investment in spectrum and acquisitions.
2 Results for the Full Year 2017
Disclaimer
Disclaimer for forward-looking statements: This document contains forward-looking statements. These forward-looking statements are
usually accompanied by words such as ‘believe’, ‘intend’, ‘anticipate’, ‘plan’, ‘expect’ and similar expressions. Actual events may differ
materially from those anticipated in these forward-looking statements as a result of a number of factors. Forward-looking statements
involve inherent risks and uncertainties. A number of important factors could cause actual results or outcomes to differ materially from
those expressed in any forward-looking statement. Neither A1 Telekom Austria Group nor any other person accepts any liability for any
such forward-looking statements. A1 Telekom Austria Group will not update these forward-looking statements, whether due to changed
factual circumstances, changes in assumptions or expectations. This report does not constitute a recommendation or invitation to pur-
chase or sell securities of A1 Telekom Austria Group.
Information on alternative performance measures and reporting changes
The Consolidated Financial Statements are prepared according to applicable accounting standards. The presentation and analysis of
financial information and key performance indicators may differ substantially from the financial information presented in the Consoli-
dated Financial Statements. This is due to the fact that the presentation and analysis are partially based on proforma figures which in-
clude M&A transactions between the start of the comparison period and the end of the reporting period.
To reflect the performance on an operational basis, the proforma figures present comparison figures for previous periods as if M&A
transactions executed between the start of the comparison period and the end of the reporting period had already been fully consoli-
dated in the relevant months of the comparison period. Alternative performance measures are used to describe the operational perfor-
mance. Please therefore also refer to the financial information presented in the Consolidated Financial Statements, which do not con-
tain proforma figures, as well as the reconciliation tables provided on page 32.
As of Q1 2017, the new company ‘A1 Digital International GmbH’ is consolidated as part of the segment ‘Corporate & other, elimina-
tions’. The Machine-to-Machine (M2M) business, which has so far been reported in the Austrian Segment, is part of this new company.
Therefore, previously reported numbers in the segments Austria as well as in ‘Corporate & other, eliminations’ will be affected, while
Group numbers will not change. Comparative figures have been adjusted accordingly. The new company will focus on the B2B market
and offer digital services to actively support companies in the digitalisation process with the goal of enhancing their success in their
field of business.
A1 Telekom Austria Group 3
Table of Contents
Full year and fourth quarter results1 4
Q4 2017: Summary of Profit and Loss (proforma) 5
Full Year 2017 analysis (reported) 8
Detailed analysis on quarterly and full year results 11
Group Overview (proforma) 11
Quarterly analysis of segments (proforma) 12
Full Year 2017: Summary of Profit and Loss 25
Outlook 29
Additional Information 31
Reconciliation Tables 32
1 This financial report of Telekom Austria Group contains quarterly results which have not been audited or reviewed by a certified public accountant. The full year 2017 results figures are audited. Figures are not yet approved by the Supervisory Board. The annual financial report, which includes the audited single and consolidated financial statement as well as the management reports will be released as required by 30 April 2018.
4 Results for the Full Year 2017
Full year and fourth quarter results
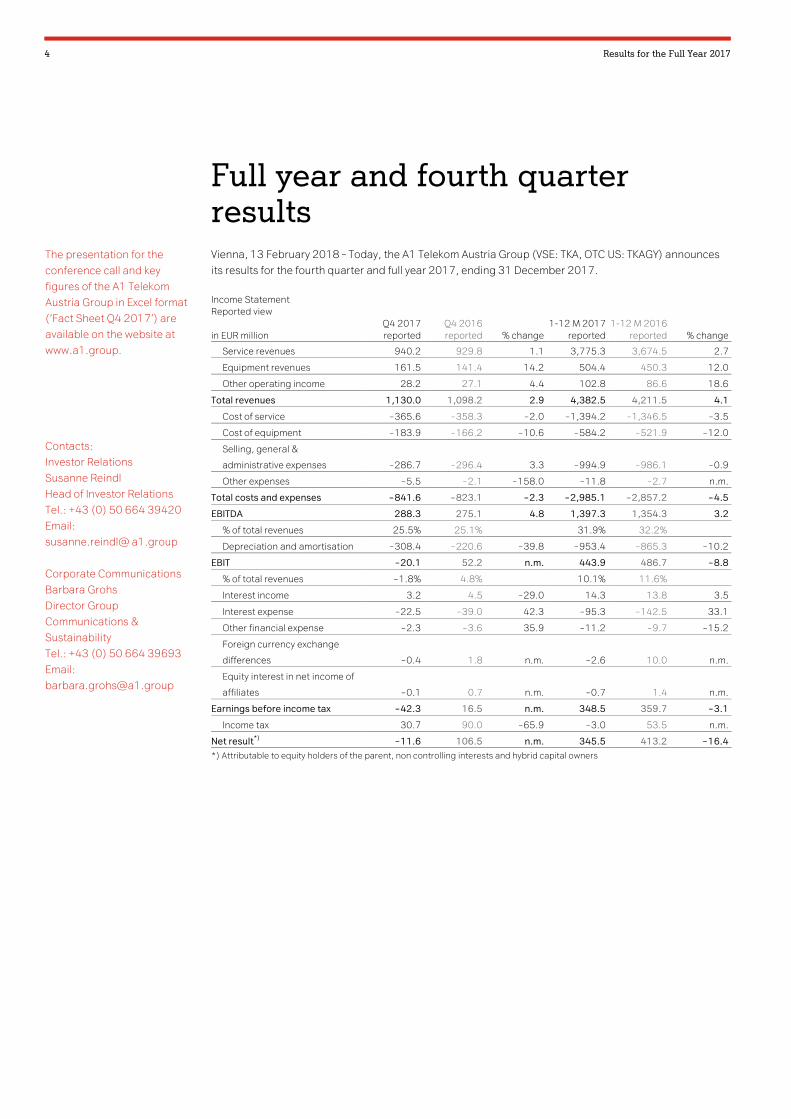
Vienna, 13 February 2018 – Today, the A1 Telekom Austria Group (VSE: TKA, OTC US: TKAGY) announces
its results for the fourth quarter and full year 2017, ending 31 December 2017.
Income Statement Reported view
in EUR million Q4 2017 reported
Q4 2016 reported % change
1-12 M 2017 reported
1-12 M 2016 reported % change
Service revenues 940.2 929.8 1.1 3,775.3 3,674.5 2.7
Equipment revenues 161.5 141.4 14.2 504.4 450.3 12.0
Other operating income 28.2 27.1 4.4 102.8 86.6 18.6
Total revenues 1,130.0 1,098.2 2.9 4,382.5 4,211.5 4.1
Cost of service – 365.6 – 358.3 – 2.0 – 1,394.2 – 1,346.5 – 3.5
Cost of equipment – 183.9 – 166.2 – 10.6 – 584.2 – 521.9 – 12.0
Selling, general &
administrative expenses – 286.7 – 296.4 3.3 – 994.9 – 986.1 – 0.9
Other expenses – 5.5 – 2.1 – 158.0 – 11.8 – 2.7 n.m.
Total costs and expenses – 841.6 – 823.1 – 2.3 – 2,985.1 – 2,857.2 – 4.5
EBITDA 288.3 275.1 4.8 1,397.3 1,354.3 3.2
% of total revenues 25.5% 25.1% 31.9% 32.2%
Depreciation and amortisation – 308.4 – 220.6 – 39.8 – 953.4 – 865.3 – 10.2
EBIT – 20.1 52.2 n.m. 443.9 486.7 – 8.8
% of total revenues – 1.8% 4.8% 10.1% 11.6%
Interest income 3.2 4.5 – 29.0 14.3 13.8 3.5
Interest expense – 22.5 – 39.0 42.3 – 95.3 – 142.5 33.1
Other financial expense – 2.3 – 3.6 35.9 – 11.2 – 9.7 – 15.2
Foreign currency exchange
differences – 0.4 1.8 n.m. – 2.6 10.0 n.m.
Equity interest in net income of
affiliates – 0.1 0.7 n.m. – 0.7 1.4 n.m.
Earnings before income tax – 42.3 16.5 n.m. 348.5 359.7 – 3.1
Income tax 30.7 90.0 – 65.9 – 3.0 53.5 n.m.
Net result*)
– 11.6 106.5 n.m. 345.5 413.2 – 16.4 *) Attributable to equity holders of the parent, non controlling interests and hybrid capital owners
The presentation for the
conference call and key
figures of the A1 Telekom
Austria Group in Excel format
(‘Fact Sheet Q4 2017’) are
available on the website at
www.a1.group.
Contacts:
Investor Relations
Susanne Reindl
Head of Investor Relations
Tel.: +43 (0) 50 664 39420
Email:
susanne.reindl@ a1.group
Corporate Communications
Barbara Grohs
Director Group
Communications &
Sustainability
Tel.: +43 (0) 50 664 39693
Email:

A1 Telekom Austria Group 5
Q4 2017: Summary of Profit and Loss (proforma)
The following analysis is presented on a proforma2 basis if not stated otherwise.
The following factors impact the year-on-year comparison of the operating results of A1 Telekom Austria
Group in the fourth quarter of 2017 and should be considered in the analysis:
� The acquisition of the fixed-line provider Garant (Gomel) in Belarus, consolidated as of
1 August 2017.
� The acquisition of the fixed-line operator Metronet in Croatia, consolidated as of 1 February 2017.
� The acquisition of the fixed-line provider Atlant Telecom and its subsidiary TeleSet in Belarus, con-
solidated as of 1 December 2016.
� Total negative FX effects amounting to EUR 8.6 mn for total revenues and EUR 4.7 mn for EBITDA in
the fourth quarter of 2017. FX losses in Belarus were partly offset by currency appreciations in Ser-
bia.
� Restructuring charges amounted to positive EUR 5.0 mn in Q4 2017 compared to negative
EUR 26.8 mn in the same period last year.
� A positive one-off effect in the Republic of Serbia in the amount of EUR 3.8 mn in Q4 2017 in other
operating income, resulting from changed parameters in the calculation of asset retirement obli-
gations.
� There were no one-off effects included in the fourth quarter of 2016.
� Additionally, the EBITDA decline at an operational basis was negatively impacted by higher than
usual non-recurring items driving OPEX in Q4 2017 extraordinarily high.
As of Q1 2017, A1 Digital International GmbH (A1 Digital) is consolidated as part of the segment ‘Corpo-
rate & other, eliminations’. The M2M (Machine-to-Machine) business, which has so far been reported in
the Austria segment, is now part of this company. A1 Digital focusses on the B2B market and offers digital
services to actively support companies in the digitalisation process, with the goal of enhancing their suc-
cess in their field of business. In August 2017, A1 Digital acquired a majority holding of Swiss cloud pro-
vider Akenes SA, which operates under the brand Exoscale. Exoscale provides infrastructure and services
for cloud applications in Europe. Following the acquisition, A1 Digital is now able to offer cloud-based ser-
vices via this platform.
In September 2017, the A1 Telekom Austria Group took a further step in strengthening its brand profile
and announced its decision to introduce the A1 brand stepwise in all markets according to local circum-
stances and thereby harmonise its brands throughout the Group. This triggered the continuous amortisa-
tion of local brand values, which had reached a total of around EUR 350 mn by the end of 2016. The re-
spective companies will amortise the brand values until the phase-out of the old brands, which is expected
to have a negative impact on the net result until the financial year 2019, with more than half of the impact
in 2017 and Q1 2018. In Q4 2017, the brand value amortisation resulting thereof amounted to
EUR 103.5 mn and stemmed primarily from the segment Bulgaria as well as, to a lesser extent, from the
segments Belarus, Croatia and Republic of Macedonia.
In the fourth quarter of 2017, A1 Telekom Austria Group saw a slight decrease in the mobile subscriber
base of 0.2% in a year-on-year comparison to 20.7 million subscribers. Declining subscriber numbers in
Bulgaria, Austria, Belarus, the Republic of Macedonia and Slovenia were partly mitigated by the growth of
M2M subscribers of A1 Digital as well as growth in Croatia and the Republic of Serbia. Subscriber numbers
2 Proforma figures include effects of M&A transactions executed between the start of the comparison period and the end of the reporting period.
6 Results for the Full Year 2017
in Austria declined by 1.9% in 2017 due to the prepaid business. Almost all markets saw a shift from pre-
paid to postpaid offers. The number of revenue generating units (RGUs) in the fixed-line business of the
Group declined by 0.6% year-on-year (reported: +2.3%). The decline in RGUs in Austria and Bulgaria,
which was mainly driven by voice RGUs, was partly offset by increases in Belarus, the Republic of Macedo-
nia, Slovenia and Croatia.
Group total revenues increased by 1.7% year-on-year (reported: +2.9%) as growth in Austria, the Repub-
lic of Serbia and Bulgaria offset declines in Croatia, the Republic of Macedonia, Slovenia and Belarus. Neg-
ative effects stemming from the abolition of retail roaming in the EU as of 15 June 2017 derive mostly from
Austria and Slovenia. Group service revenues were stable (-0.1% year-on-year; reported: +1.1%).
Total revenues in the Austrian segment increased by 2.3% year-on-year in the fourth quarter of 2017 as
more handsets sold and the increase in retail fixed-line service revenues outweighed the negative effects
on customer roaming and losses in the prepaid segment.
In the Bulgarian segment, total revenues increased by 3.1% in a year-on-year comparison, driven by
higher equipment revenues and increased fixed-line service revenues. The latter rose following the posi-
tive impact of the exclusive sports content offer and a higher ARPL in the business segment.
Total revenues in the Croatian segment declined by 3.2% year-on-year (reported: +3.6%), stemming from
fewer handsets sold and due to exceptionally high other operating income in the comparison period. Total
revenues in the Belarusian segment were stable at -0.1% year-on-year (reported: +5.8%) in Euro terms,
while they rose by 10.7% (reported: +17.2%) on a local currency basis. This rise was mainly driven by
higher equipment revenues due to a shift towards more expensive handsets.
In the Slovenian segment, total revenues declined by 1.8% year-on-year in the fourth quarter of 2017
driven by lower monthly fees due to the enduring highly competitive environment in the mobile business as
well as the negative roaming impact. Total revenues in the Serbian segment increased by 10.3% year-on-
year due to a shift towards postpaid tariffs introduced in June 2017 and the strong demand for net cubes
as well as due to the above-mentioned positive one-off effect in other operating income. Excluding this
one-off effect, total revenues rose by 4.0% year-on-year. In the Republic of Macedonia, total revenues de-
clined by 7.9% year-on-year, driven by a lower other operating income and less handsets sold.
Group total costs and expenses increased by 1.1% year-on-year to EUR 841.6 mn in the fourth quarter of
2017 (reported: +2.3%) and benefitted from a positive restrucutring effect in a year-on-year comparison.
Excluding restructuring in Austria, Group total costs and expenses were driven by higher cost of equip-
ment, sales area costs, roaming expenses and higher than usual non-recurring items such as bad debts
and provisions for legal cases as well as commissions.
Group EBITDA rose by 3.5% year-on-year to EUR 288.3 mn in the fourth quarter of 2017 (reported:
+4.8%). The comparison of Group EBITDA is positively affected by restructuring charges in Austria.
Excluding the above-mentioned one-off effect, restructuring charges as well as the FX impact, Group
EBITDA decreased despite solid revenue growth due to high Q4 OPEX versus last year driven by additional
investments realising market opportunities in the Christmas season, A1 Digital and higher than usual non-
recurring items.
In Austria, the EBITDA rose by 14.3% year-on-year. Excluding restructuring, EBITDA decreased by 3.2% as
the negative roaming impact, higher product-related costs such as leased lines and content, as well as
higher commissions could not be compensated by higher fixed-line service revenues.
In Bulgaria, the EBITDA increase of 2.5% was driven by higher fixed-line service revenues and a better
equipment margin due to lower subsidies.
Group revenues increased by
1.7% year-on-year
Group EBITDA rose by 3.5%
year-on-year

A1 Telekom Austria Group 7
In Croatia, lower other operating income as well as higher bad debt and roaming expenses could not be
offset by savings in advertising and content costs. This led to a decrease in EBITDA of 5.6% year-on-year
(reported: +3.3%).
In Belarus, EBITDA came in 14.0% lower compared to Q4 2016 (reported: -10.2%). Excluding the negative
FX impact of EUR 4.9 mn, EBITDA in Belarus declined by 2.5% year-on-year (reported: +1.8%) due to the
slowdown in revenue growth as growth dynamics were fading out together with higher cost of services
such as taxes and use of rights as well as inflation-based salary increases.
In Slovenia, EBITDA declined by 24.9%, driven by lower monthly fees, roaming losses and increased
content costs.
EBITDA in the Republic of Serbia rose by 15.7% year-on-year, positively impacted by the above-mentioned
one-off effect. Operationally, higher mobile service revenues could not outweigh higher bad debts and
interconnection costs. The latter rose due to unlimited tariffs, which led to more outgoing minutes.
In the Republic of Macedonia, merger-related cost efficiencies and improving trends in service revenues
led to EBITDA growth of 11.0% year-on-year.
Depreciation and amortisation increased by 38.7% to EUR 308.4 mn in the fourth quarter of 2017 (re-
ported:+39.8%) due to the brand amortisation of EUR 103.5 mn, primarily in Bulgaria and to a lesser de-
gree in Belarus, Croatia and the Republic of Macedonia, related to the rebranding announced in Septem-
ber 2017. This led to a decline in operating income from positive EUR 53.9 mn in Q4 2016 (reported: EUR
+52.2 mn) to negative EUR 20.1 mn in Q4 2017. Excluding the effects of the rebranding, operating in-
come increased by 54.6% (reported: +59.7%).

8 Results for the Full Year 2017
Full Year 2017 analysis (reported)
Balance Sheet
Balance sheet Reported view
in EUR million
31 Dec 2017
reported
31 Dec 2016
reported % change
31 Dec 2017
reported
31 Dec 2016
reported % change
Cash, cash equivalents &
other short-term investments 202.4 464.2 – 56.4 Short-term debt* 0.6 500.1 – 99.9
Accounts receivable 679.3 636.5 6.7 Accounts payable 784.2 852.6 – 8.0
Other current assets 257.1 255.7 0.5 Other current liabilities 458.9 495.1 – 7.3
Inventories 87.4 82.5 6.0 Current liabilities 1,243.7 1,847.8 – 32.7
Current assets 1,226.3 1,438.9 – 14.8
Property, plant & equipment 2,627.9 2,550.8 3.0 Long-term debt 2,533.6 2,303.5 10.0
Intangibles 2,075.9 2,321.4 – 10.6 Other liabilities 923.6 1,021.2 – 9.6
Goodwill 1,276.3 1,241.8 2.8 Non-current liabilities 3,457.2 3,324.7 4.0
Investments in affiliates
& long-term investments 46.9 49.2 – 4.8
Other non-current assets 385.0 341.2 12.9 Shareholder's equity 2,937.4 2,770.7 6.0
Non-current assets 6,412.0 6,504.3 – 1.4
Total assets 7,638.3 7,943.2 – 3.8
Total liabilities and
equity 7,638.3 7,943.2 – 3.8
*) Includes current portion of long-term debt.
As of 31 December 2017, the balance sheet total declined by 3.8% year-on-year to EUR 7,638.3 mn.
Current assets fell by 14.8% to EUR 1,226.3 mn in the period under review resulting from the reduction in
cash and cash equivalents, which was partly offset by an increase in receivables. The main reason for the
decrease in cash and cash equivalents was the repayment of a EUR 500 mn bond on 27 January 2017,
which was partly offset by the tap-issuance of an existing bond of EUR 250 mn on 11 July 2017.
Non-current assets decreased by 1.4% year-on-year to EUR 6,412.0 mn, as the growth in property, plant
and equipment, deferred tax assets and goodwill was more than offset by the reduction in intangible as-
sets. The increase in goodwill as well as in property, plant and equipment was attributable primarily to the
acquisition of Metronet in Croatia, while the increase in property, plant and equipment was also impacted
by the fibre and LTE rollout in Austria. The reduction in intangible assets resulted from brand value amorti-
sations in connection with Group-wide rebranding and from the amortisation of licences and software.
This reduction was partly offset by the increase in intangible assets due to the acquisition of Metronet and
a new IRU (Indefeasible Rights of Use) contract in Slovenia.
Current liabilities declined by 32.7% to EUR 1,243.7 mn in the period under review, primarily as a result of
the repayment of the EUR 500 mn Eurobond. Liabilities were also driven down by EUR 120 mn due to the
exercising of the call option associated with the acquisition of the Telekom Slovenije Group’s 45% stake in
the Macedonian company one.Vip DOOEL.
Non-current liabilities increased by 4.0% to EUR 3,457.2 mn in the year under review. Non-current finan-
cial liabilities went up as a result of the tap-issuance of EUR 250 mn on 11 July 2017. Non-current provi-
sions declined mainly as a result of payments for restructuring and social plans, and this was only partly
offset by an increase in asset retirement obligations.

A1 Telekom Austria Group 9
Dividend payments, which also include coupon payments of EUR 33.8 mn for the EUR 600 mn hybrid
bond, increased from EUR 67.2 mn in the previous year to EUR 166.9 mn in 2017 due to the increase in
the dividend from EUR 0.05 to EUR 0.20 per share.
The rise in stockholder’s equity from EUR 2,770.7 mn at year-end 2016 to EUR 2,937.4 mn at year-end
2017 resulted from the net income for 2017 less the carried out profit distribution. This also led to an in-
crease in the equity ratio as of 31 December 2017 to 38.5% after 34.9% as of 31 December 2016.
Net Debt
Net debt Reported
in EUR million 1-12 M 2017
reported 1-12 M 2016
reported % change
Net debt 2,331.8 2,339.4 – 0.3
Net Debt / EBITDA (12 months) 1.7x 1.7x
In the 2017 reporting year, the A1 Telekom Austria Group’s net debt decreased slightly by 0.3% to
EUR 2,331.8 mn. Dividend payments and the outflow of funds for the acquisition of Metronet were offset
by the free cash flow. The net debt to EBITDA ratio remained stable in comparison with the previous year at
1.7x as of 31 December 2017.
Cash Flow
Cash flow Reported
in EUR million 1-12 M 2017
reported 1-12 M 2016
reported % change
Earnings before income tax (EBT) 348.5 359.7 – 3.1
Net cash flow from operating activities 1,174.8 1,195.5 – 1.7
Net cash flow from investing activities – 770.4 – 823.5 6.5
Net cash flow from financing activities – 659.3 – 824.3 20.0
Net change in cash and cash equivalents – 255.1 – 451.7 43.5
Adjustment to cash flows due to exchange rate fluctuations – 0.2 0.6 n.m.
Earnings before tax (EBT) declined year-on-year by 3.1% to EUR 348.5 mn, as the higher EBITDA and the
improved financial result were more than offset by the brand value amortisation of EUR 121.8 mn in con-
junction with the Group-wide rebranding. (The total brand amortisation for the full year 2017 amounted to
EUR 123.2 mn.)
Despite the improvement in results of operations, cash flow from operating activities decreased slightly
year-on-year by 1.7% to EUR 1,174.8 mn. This was mainly due to increased needs for working capital
compared with the previous year. Additional needs for working capital (‘change in financial positions’ in
notes) in the 2017 reporting year in the amount of EUR 204.4 mn were to a large extent driven by pay-
ments for restructuring as well as higher accounts receivable. Payments for income taxes and higher in-
stalment sales also contributed to the increase in working capital.
Cash flow from investing activities went down by 6.5% to EUR -770.4 mn in the reporting period as the
cash outflow from the acquisition of Metronet was more than compensated by a decrease in capital ex-
penditures paid. The latter was also impacted by the fact that the figure for 2016 included greater pay-
ments for capital expenditures from 2015, such as the spectrum investments in the Republic of Serbia.
Cash flow from financing activities decreased from EUR -824.3 mn in 2016 to EUR -659.3 mn in the 2017
reporting year. The repayment of a EUR 500 mn bond in January 2017 was partly compensated by the tap-
issuance of EUR 250 mn. Interest payments fell significantly year-on-year by 39.9% to EUR 99.8 mn due to
the reduction in financial liabilities and the use of favourable refinancing. Dividend and hybrid bond cou-
pon payments increased overall from EUR 67.2 mn in 2016 to EUR 166.9 mn in 2017 due to the increase

10 Results for the Full Year 2017
in the dividend from EUR 0.05 to EUR 0.20 per share. There was also an outflow of funds totalling
EUR 120 mn in the year under review due to the exercising of the call option associated with the acquisi-
tion of the Telekom Slovenije Group’s 45% stake in the Macedonian company one.Vip DOOEL.
Overall, cash and cash equivalents went down by EUR 255.1 mn in the year under review compared with a
reduction of EUR 451.7 mn in the previous year.
Free cash flow, which is calculated as cash flow from operating activities less capital expenditures paid
and interest paid plus proceeds from the sale of plant, property and equipment increased from
EUR 232.0 mn in the previous year to EUR 384.7 mn in the 2017 reporting year. This was mainly attributa-
ble to the lower levels of capital expenditures and interest paid as well as operational improvement.
Capital Expenditures
In the 2017 year under review, capital expenditures decreased by 3.6% year-on-year to EUR 736.9 mn.
This was due to lower investments in Belarus, Austria and the Republic of Macedonia, which were partially
offset by higher capital expenditures in Slovenia, the Republic of Serbia, Croatia and Bulgaria.
In 2017, tangible capital expenditures decreased by 9.5% to EUR 579.3 mn in comparison with the previ-
ous year, as higher investment levels in the Republic of Serbia, Croatia and Bulgaria were more than com-
pensated for by lower tangible capital expenditures in Austria, Belarus, the Republic of Macedonia and
Slovenia. The decline in tangible capital expenditures in Austria was attributable to lower investments in
the fibre rollout. In Belarus, tangible capital expenditures declined compared to 2016 as the previous year
was affected by the solar power plant project.
The increase in intangible capital expenditures of 27.4% to EUR 157.6 mn was driven mainly by the capi-
talisation of a long-term IRU (Indefeasible Rights of Use) contract for fibre-optic lines in Slovenia. Higher
investments in Bulgaria, Croatia and Austria also played a role here.
Personnel
Personnel (full-time equivalent) Reported
Average of period 1-12 M 2017
reported 1-12 M 2016
reported % change
Austria 8,287 8,448 – 1.9
International operations 10,093 9,048 11.5
Corporate & other 279 220 26.6
Total 18,659 17,717 5.3
Personnel (full-time equivalent) Reported
End of period 1-12 M 2017
reported 1-12 M 2016
reported % change
Austria 8,246 8,352 – 1.3
International operations 10,366 9,613 7.8
Corporate & other 345 238 45.2
Total 18,957 18,203 4.1
The A1 Telekom Austria Group had 18,957 employees at the end of 2017 (2016:18,203). The headcount
in the Austrian segment was reduced by 1.3% to 8,246 employees as part of the ongoing restructuring
measures. Around 47% of existing employees have civil servant status. The segments outside of Austria
saw an increase of 7.8% to 10,366 employees. This increase was mainly driven by M&A activities in Croa-
tia and Belarus, as well as higher salesforce numbers.
M&A drove the increase in
International Operations’
headcount

A1 Telekom Austria Group 11
Detailed analysis on quarterly and full year results
Group Overview (proforma)
The following tables are presented on a proforma basis and include effects of M&A transactions executed
between the start of the comparison period and the end of the reporting period. This affects the segments
of Croatia and Belarus. The proforma view is equivalent to the reported view for the other segments. Aver-
age monthly revenue per fixed-line (ARPL) is available on a reported basis only. The reconciliation tables,
including reported and proforma values, as well as the difference thereof, can be found on page 32.
Key performance indicators Reported view
in EUR million Q4 2017 reported
Q4 2016 proforma % change
1-12 M 2017 reported
1-12 M 2016 proforma % change
Total revenues 1,130.0 1,110.8 1.7 4,382.5 4,254.9 3.0
Service revenues 940.2 941.1 – 0.1 3,775.3 3,715.8 1.6
thereof mobile service
revenues 525.1 536.4 – 2.1 2,139.0 2,146.2 – 0.3
thereof fixed-line service
revenues 415.1 404.7 2.6 1,636.3 1,569.6 4.2
Equipment revenues 161.5 141.3 14.2 504.4 450.4 12.0
Other operating income 28.2 28.4 – 0.7 102.8 88.7 15.8
EBITDA 288.3 278.7 3.5 1,397.3 1,370.4 2.0
% total revenues 25.5% 25.1% 31.9% 32.2%
EBIT – 20.1 53.9 n.m. 443.9 496.2 – 10.5
% total revenues – 1.8% 4.9% 10.1% 11.7%
Wireless indicators Q4 2017 reported
Q4 2016 proforma % change
1-12 M 2017 reported
1-12 M 2016 proforma % change
Wireless subscribers (thousands) 20,657.7 20,707.8 – 0.2 20,657.7 20,707.8 – 0.2
Postpaid 15,580.7 15,041.0 3.6 15,580.7 15,041.0 3.6
Prepaid 5,077.1 5,666.8 – 10.4 5,077.1 5,666.8 – 10.4
MoU (per Ø subscriber)*) 341.6 328.0 4.1 330.9 322.9 2.5
ARPU (EUR) 8.5 8.6 – 2.2 8.6 8.7 – 0.8
Churn (%) 2.2% 2.2% 2.0% 2.0%
Wireline indicators Q4 2017 reported
Q4 2016 proforma % change
1-12 M 2017 reported
1-12 M 2016 proforma % change
RGUs 6,036.5 6,075.8 – 0.6 6,036.5 6,075.8 – 0.6 *) Minutes of Use no longer include M2M subscribers. Comparative figures have been adjusted accordingly.

12 Results for the Full Year 2017
Quarterly analysis of segments (proforma)
Segment Austria3
Key performance indicators Proforma view ( = Reported view) Financials
in EUR million Q4 2017 reported
Q4 2016 proforma % change
1-12 M 2017 reported
1-12 M 2016 proforma % change
Total revenues 676.2 660.9 2.3 2,622.3 2,571.6 2.0
Service revenues 590.7 590.5 0.0 2,365.5 2,339.0 1.1
thereof mobile service
revenues 248.1 255.3 – 2.8 1,006.2 1,032.0 – 2.5
thereof fixed-line service
revenues 342.6 335.1 2.2 1,359.4 1,306.9 4.0
Equipment revenues 69.3 52.6 31.9 198.5 175.3 13.2
Other operating income 16.2 17.9 – 9.4 58.3 57.3 1.7
EBITDA 202.1 176.8 14.3 914.2 899.7 1.6
% of total revenues 29.9% 26.7% 34.9% 35.0%
EBIT 85.3 49.4 72.6 442.1 404.4 9.3
% of total revenues 12.6% 7.5% 16.9% 15.7%
Wireless indicators Q4 2017 reported
Q4 2016 proforma % change
1-12 M 2017 reported
1-12 M 2016 proforma % change
Wireless subscribers (thousands) 5,335.2 5,438.7 – 1.9 5,335.2 5,438.7 – 1.9
thereof postpaid 3,779.4 3,709.9 1.9 3,779.4 3,709.9 1.9
thereof prepaid 1,555.8 1,728.8 – 10.0 1,555.8 1,728.8 – 10.0
MoU (per Ø subscriber)*) 266.1 256.5 3.7 256.3 251.8 1.8
ARPU (in EUR) 15.5 15.7 – 1.1 15.6 15.8 – 1.2
Churn (%) 1.8% 1.8% 1.7% 1.7%
Wireline indicators Q4 2017 reported
Q4 2016 proforma % change
1-12 M 2017 reported
1-12 M 2016 proforma % change
RGUs (thousands) 3,390.4 3,495.5 – 3.0 3,390.4 3,495.5 – 3.0
As there have been no mergers or acquisitions in Austria between the beginning of the comparison
period and the end of the period under review, the following analysis is based on reported figures.
In Q4 2017, competition in the Austrian mobile market continued to be driven by aggressive promotions
including high data allowances in the mobile no-frills business but also data monetisation in the contract
business. In this environment, A1 Telekom Austria AG monetises the growth in demand for data via high
data allowances and by including data roaming in the premium tariffs. As of November 2017, these also
included ‘zero-rated’ services enabling certain music and video streaming services to be used inde-
pendently of data limits. At the same time, the price pressure in the no-frills segment is being addressed
by its no-frills brands bob and YESSS!, i.e. through competitive national tariffs. Moreover, the company
launched attractive regional promotions and target group-oriented products, e.g. for the youth segment.
The fixed-line business profited from the increased demand for broadband products with higher speeds
as well as the monthly fee increase for existing customers as of 1 August 2017. In this context, next to the
3 Since the first quarter 2017, Machine-to-Machine (M2M) is no longer reported in the Austrian segment and is shown in ‘Corporate & other, eliminations’. Comparative figures have been adjusted accordingly.

A1 Telekom Austria Group 13
classical fibre infrastructure, the hybrid modem as a combination of the fixed-line and mobile network re-
mains central to providing A1 fixed-line products with higher bandwidths.
Beyond that, mobile WiFi routers with unlimited data offerings remain a relevant element in the Austrian
broadband market. On 26 June 2017, A1 increased the available download speed in its mobile and fixed-
line broadband offers to up to 300 Mbps.
In the fourth quarter of 2017, the total number of mobile communication subscribers declined by 1.9%
year-on-year, entirely driven by a decrease in the number of prepaid customers. At the same time, high
demand for mobile WiFi routers and high-value tariffs persisted, resulting in a higher number of postpaid
subscribers. Net additions came in negative at -22,100 as the growth in postpaid was not able to fully off-
set the decline in the prepaid segment.
In the fixed-line business, total fixed-line revenue generating units (RGUs) decreased by 3.0% year-on-
year in Q4 2017, mainly due to losses of voice RGUs. While the demand for fibre upgrades remained con-
tinuously strong and TV RGUs continued to exhibit solid growth (+4.5% year-on-year), the number of fixed-
line broadband RGUs declined by 2.3% year-on-year as the above-mentioned price increase as of 1 Au-
gust 2017 and some substitution by WiFi routers led to higher churn. Compared to Q3, the number of
broadband RGUs remained stable.
In the fourth quarter of 2017, total revenues increased by 2.3% year-on-year as higher equipment reve-
nues and fixed-line service revenues outweighed losses in wireless service revenues.
Total service revenues were stable year-on-year (0.0%).
Wireless service revenues were impacted by negative effects on customer roaming after the abolition of
retail roaming within the EU as of 15 June 2017 as well as losses in the prepaid segment. This was partly
compensated by increased revenues from high-value and mobile WiFi router customers. Wireless equip-
ment revenues rose due to higher quantities and more expensive handsets sold.
Average monthly revenue per user (ARPU) decreased by 1.1% from EUR 15.7 in Q4 2016 to EUR 15.5 in
the fourth quarter of 2017, driven by losses in roaming revenues and a lower prepaid ARPU. Excluding
roaming, ARPU would have risen slightly in Q4 2017 compared to last year.
Fixed-line service revenues increased by 2.2% as higher retail fixed-line revenues due to the solid demand
for higher bandwidth products and TV options, as well as the above-mentioned price increase, were only
partly offset by lower voice revenues.
The average monthly revenue per fixed-line (ARPL) rose by 8.6% from EUR 28.2 in Q4 2016 to EUR 30.6 in
Q4 2017, mainly due to upselling measures in the broadband business, TV options as well as the above-
mentioned price increase.
Total costs and expenses decreased by 2.1% in the fourth quarter of 2017 compared to the same period
last year. Restructuring charges amounted to positive EUR 5.0 mn in the fourth quarter of 2017 compared
to negative EUR 26.8 mn in Q4 2016. Excluding restructuring charges, total costs and expenses rose by
4.8%. This increase was mainly driven by higher costs of equipment due to increased quantities on the
back of higher subsidies as part of Christmas promotions due to retention and acquisition measures.
Higher product-related costs such as for leased lines and content as well as commissions and ramp-up
costs for projects also contributed to this increase. Cost savings such as in purchasing and for mainte-
nance mitigated some of the additional higher than usual non-recurring costs.
TV RGU growth of 4.5% year-
on-year
ARPL increased by 8.6% to
EUR 30.6 in Q4 2017

14 Results for the Full Year 2017
Subsidies for acquisition rose by 95.3% to EUR 15.0 mn and subsidies for retention rose by 13.4% to
EUR 27.9 mn in Q4 2017, both due to an increased subsidy per handset and higher quantities. Addition-
ally, subsidies for the no-frills brand bob were introduced in Q4 2017 to address the growing optimiser
segment.
In total, EBITDA increased by 14.3% year-on-year. Excluding restructuring charges, EBITDA decreased by
3.2% as the negative roaming impact and higher product-related costs such as for leased lines and con-
tent as well as higher commissions and ramp-up costs for projects could not be compensated by higher
fixed-line service revenues.
Depreciation and amortisation decreased by 6.6% to EUR 116.8 mn in the quarter under review due to the
end of depreciation of frequencies and a large IT project. As a result, the Austrian segment reported an
increase in operating income of 72.6% year-on-year to EUR 85.3 mn in Q4 2017.
Segment Bulgaria
Key performance indicators Proforma view ( = Reported view) Financials
in EUR million Q4 2017 reported
Q4 2016 proforma % change
1-12 M 2017 reported
1-12 M 2016 proforma % change
Total revenues 112.1 108.7 3.1 431.2 412.0 4.7
Service revenues 89.8 89.1 0.8 359.0 357.7 0.4
thereof mobile service
revenues 65.8 67.4 – 2.4 267.0 271.9 – 1.8
thereof fixed-line service
revenues 24.0 21.7 10.5 92.0 85.7 7.3
Equipment revenues 19.3 17.7 8.6 59.4 48.4 22.6
Other operating income 3.1 1.9 63.0 12.8 6.0 114.7
EBITDA 25.8 25.2 2.5 130.1 125.6 3.6
% of total revenues 23.0% 23.1% 30.2% 30.5%
EBIT – 87.8 – 2.6 n.m. – 85.6 15.4 n.m.
% of total revenues – 78.3% – 2.4% – 19.8% 3.7%
Wireless indicators Q4 2017 reported
Q4 2016 proforma % change
1-12 M 2017 reported
1-12 M 2016 proforma % change
Wireless subscribers (thousands) 3,977.1 4,108.1 – 3.2 3,977.1 4,108.1 – 3.2
thereof postpaid 3,500.4 3,509.4 – 0.3 3,500.4 3,509.4 – 0.3
thereof prepaid 476.8 598.7 – 20.4 476.8 598.7 – 20.4
MoU (per Ø subscriber)*) 316.7 305.1 3.8 306.3 302.3 1.3
ARPU (in EUR) 5.5 5.5 0.2 5.5 5.5 – 0.7
Churn (%) 2.3% 2.2% 2.2% 2.0%
Wireline indicators Q4 2017 reported
Q4 2016 proforma % change
1-12 M 2017 reported
1-12 M 2016 proforma % change
RGUs (thousands) 1,005.0 1,018.9 – 1.4 1,005.0 1,018.9 – 1.4 *) Minutes of Use no longer include M2M subscribers. Comparative figures have been adjusted accordingly.
As there have been no mergers or acquisitions in Bulgaria between the beginning of the comparison
period and the end of the period under review, the following analysis is based on reported figures.
Also in the fourth quarter of 2017, the competitive environment in the Bulgarian mobile market remained
challenging. This was still particularly visible in the business segment, which continues to improve but is
still negative in a year-on-year comparison. To counter price pressure, Mobiltel once again maintained its
focus on value-based management and enhanced efforts to retain high-value customers. As a result, the
EBITDA increase of 14.3%
year-on-year, positively
impacted by restructuring
effects
A1 Telekom Austria Group 15
improving trends of total service revenues continued in Q4 2017, driven by the fixed-line business. In par-
ticular, this was driven by the content strategy, as in Q1 2017, Mtel included exclusive sports content in its
fixed-line product for new and existing customers. As of Q2 2017, this new content has been charged,
which supported the growth in fixed-line service revenues. Furthermore, successful cross and upselling
activities, as well as increased demand for customised corporate solutions, supported fixed-line service
revenues.
Total mobile subscribers declined by 3.2% year-on-year in the fourth quarter of 2017, mainly due to losses
in the prepaid segment, highly impacted by the national regulation for a limited number of prepaid card
activations per person, effective since 1 July 2017. Smartphone and mobile broadband services continued
to grow in Q4 2017 compared to Q4 2016 following the rise in demand for mobile data access. Total
fixed-line revenue generating units (RGUs) decreased by 1.4% year-on-year as the growth in TV and
broadband could only partly compensate for the loss in fixed-line voice services.
Total revenues rose by 3.1% in Q4 2017 compared to the same period last year due to increased fixed-line
service revenues as well as higher equipment revenues and higher other operating income. Equipment
revenues rose due to lower subsidies. Fixed-line service revenues increased, supported by the launch of
the exclusive sports TV package and high demand for fixed-line corporate solutions as well as the growth
in satellite TV RGUs. In the mobile business, higher visitor roaming revenues were not able to fully offset
the decline in business revenues as well as customer roaming revenues.
Average monthly revenue per user (ARPU) is stable year-on-year at EUR 5.5. The re-pricing in the business
segment and the negative regulatory effect of roaming was compensated by upselling activities in the resi-
dential segment. The average monthly revenue per fixed line (ARPL) increased from EUR 10.8 in Q4 2016
to EUR 11.9 in Q4 2017, supported by the upselling of existing subscribers as well as the charging of ex-
clusive sports content.
Total costs and expenses increased by 3.3% in a year-on-year comparison. This increase was primarily
driven by higher employee costs in customer facing units. Higher bad debts were triggered by a lower col-
lection rate. Roaming expenses increased while content costs rose following TV RGU growth. These cost
increases were partly offset by the decline in the costs of equipment due to a lower number of handsets
sold as well as lower commissions.
EBITDA rose by 2.5%, driven by higher fixed-line service revenues and a better equipment margin due to
lower subsidies.
ARPL increased by 9.5% to
EUR 11.9 in Q4 2017
EBITDA increased by 2.5%
y-o-y in Bulgaria
16 Results for the Full Year 2017
Segment Croatia
Key performance indicators Proforma view Financials
in EUR million Q4 2017 reported
Q4 2016 proforma % change
1-12 M 2017 reported
1-12 M 2016 proforma % change
Total revenues 106.9 110.5 – 3.2 434.9 423.9 2.6
Service revenues 90.9 90.5 0.5 379.7 365.1 4.0
thereof mobile service
revenues 60.5 60.0 0.9 258.8 249.8 3.6
thereof fixed-line service
revenues 30.4 30.6 – 0.3 120.9 115.3 4.9
Equipment revenues 14.4 17.4 – 17.2 49.0 51.9 – 5.6
Other operating income 1.6 2.5 – 38.2 6.2 7.0 – 11.0
EBITDA 19.6 20.8 – 5.6 108.0 98.6 9.6
% of total revenues 18.3% 18.8% 24.8% 23.2%
EBIT – 9.4 – 0.8 n.m. 12.4 15.0 – 17.2
% of total revenues – 8.8% – 0.7% 2.9% 3.5%
Wireless indicators Q4 2017 reported
Q4 2016 proforma % change
1-12 M 2017 reported
1-12 M 2016 proforma % change
Wireless subscribers (thousands) 1,772.7 1,720.0 3.1 1,772.7 1,720.0 3.1
thereof postpaid 965.2 846.8 14.0 965.2 846.8 14.0
thereof prepaid 807.5 873.2 – 7.5 807.5 873.2 – 7.5
MoU (per Ø subscriber)*) 305.2 305.9 – 0.2 310.1 310.1 0.0
ARPU (in EUR) 11.2 11.3 – 1.1 12.2 11.9 2.7
Churn (%) 3.6% 4.4% 2.6% 2.8%
Wireline indicators Q4 2017 reported
Q4 2016 proforma % change
1-12 M 2017 reported
1-12 M 2016 proforma % change
RGUs (thousands) 654.1 645.8 1.3 654.1 645.8 1.3 *) Minutes of Use no longer include M2M subscribers. Comparative figures have been adjusted accordingly.
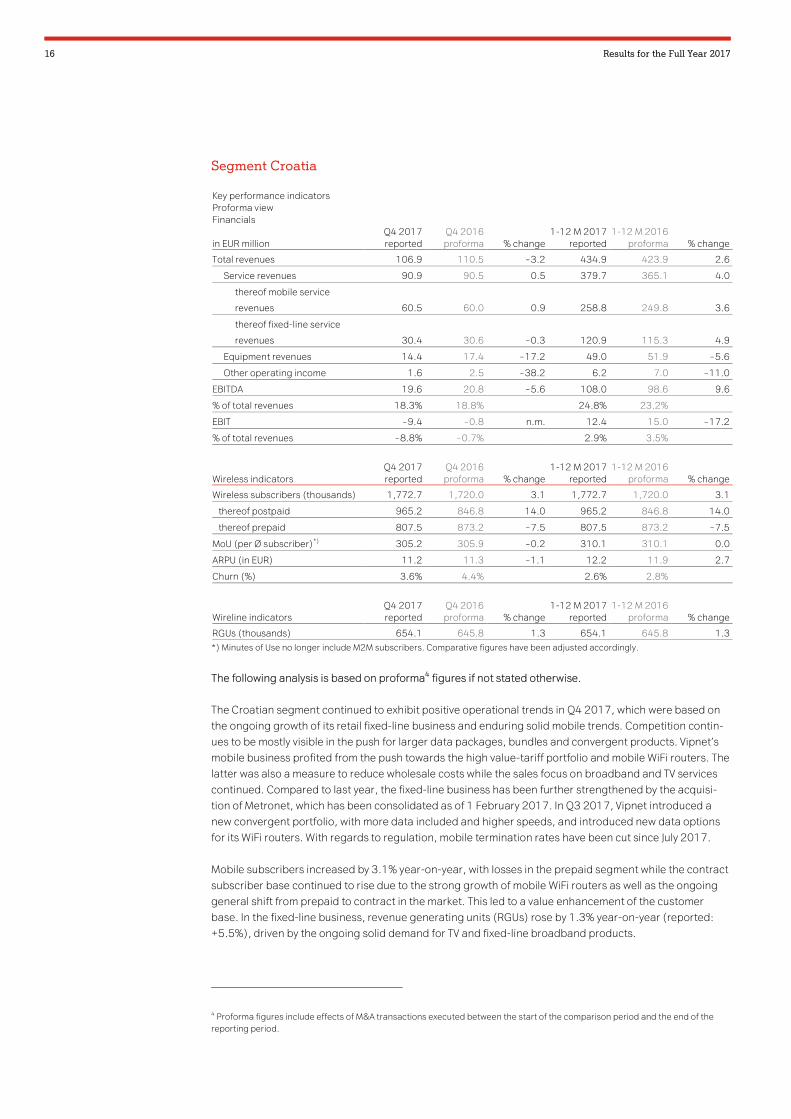
The following analysis is based on proforma4 figures if not stated otherwise.
The Croatian segment continued to exhibit positive operational trends in Q4 2017, which were based on
the ongoing growth of its retail fixed-line business and enduring solid mobile trends. Competition contin-
ues to be mostly visible in the push for larger data packages, bundles and convergent products. Vipnet’s
mobile business profited from the push towards the high value-tariff portfolio and mobile WiFi routers. The
latter was also a measure to reduce wholesale costs while the sales focus on broadband and TV services
continued. Compared to last year, the fixed-line business has been further strengthened by the acquisi-
tion of Metronet, which has been consolidated as of 1 February 2017. In Q3 2017, Vipnet introduced a
new convergent portfolio, with more data included and higher speeds, and introduced new data options
for its WiFi routers. With regards to regulation, mobile termination rates have been cut since July 2017.
Mobile subscribers increased by 3.1% year-on-year, with losses in the prepaid segment while the contract
subscriber base continued to rise due to the strong growth of mobile WiFi routers as well as the ongoing
general shift from prepaid to contract in the market. This led to a value enhancement of the customer
base. In the fixed-line business, revenue generating units (RGUs) rose by 1.3% year-on-year (reported:
+5.5%), driven by the ongoing solid demand for TV and fixed-line broadband products.
4 Proforma figures include effects of M&A transactions executed between the start of the comparison period and the end of the reporting period.

A1 Telekom Austria Group 17
The fourth quarter of 2017 saw a decrease in total revenues in the Croatian segment of 3.2% year-on-year
(reported: +3.6%), which was mainly driven by a decline in equipment revenues due to lower quantities as
well as the lower other operating income, while service revenues continued to grow. Other operating in-
come was exceptionally high in the comparison period due to a better collection rate of bad debts. Service
revenues increased as lower interconnection revenues due to the above-mentioned termination rate cut
were outweighed by growth in mobile WiFi routers and higher visitor roaming revenues. Fixed-line service
revenues were stable as lower interconnection revenues were outweighed by the continuing rise in retail
fixed-line revenues.
Average monthly revenue per user (ARPU) decreased to EUR 11.2 in the fourth quarter of 2017 compared
to EUR 11.3 in Q4 2016 due to the above-mentioned mobile termination rate cut. Average monthly reve-
nue per fixed line (ARPL) rose on a reported basis from EUR 23.8 in Q4 2016 to EUR 28.5 in Q4 2017 due
to the consolidation of Metronet with a higher ARPL. Together with the growth in fixed-line RGUs, this led
to a 26.2% year-on-year increase in reported ARPL-relevant revenues.
In the fourth quarter of 2017, total costs and expenses declined by 2.7% year-on-year (reported: +3.7%).
Increased bad debts and roaming expenses were more than outweighed by lower equipment costs, adver-
tising expenses as well as content and bitstream costs.
Lower costs and expenses could not offset the decline in total revenues, which led to a decrease in EBITDA
of 5.6% year-on-year (reported: +3.3%).
Total revenue decrease of
3.2% year-on-year
(reported: +3.6%)
EBITDA decrease of 5.6%
year-on-year (reported:
+3.3%)

18 Results for the Full Year 2017
Segment Belarus
Key performance indicators Proforma view Financials
in EUR million Q4 2017 reported
Q4 2016 proforma % change
1-12 M 2017 reported
1-12 M 2016 proforma % change
Total revenues 95.9 96.0 – 0.1 390.5 338.8 15.2
Service revenues 72.1 76.2 – 5.4 303.7 270.5 12.3
thereof mobile service
revenues 63.7 67.8 – 6.0 273.1 242.5 12.6
thereof fixed-line service
revenues 8.4 8.4 – 0.5 30.6 28.0 9.5
Equipment revenues 21.7 16.4 32.7 71.5 58.4 22.4
Other operating income 2.1 3.4 – 38.5 15.2 9.9 53.2
EBITDA 36.5 42.4 – 14.0 181.3 157.4 15.2
% of total revenues 38.0% 44.2% 46.4% 46.4%
EBIT 14.9 28.2 – 47.3 123.1 91.7 34.1
% of total revenues 15.5% 29.4% 31.5% 27.1%
Wireless indicators Q4 2017 reported
Q4 2016 proforma % change
1-12 M 2017 reported
1-12 M 2016 proforma % change
Wireless subscribers (thousands) 4,864.2 4,944.9 – 1.6 4,864.2 4,944.9 – 1.6
thereof postpaid 3,964.5 3,972.5 – 0.2 3,964.5 3,972.5 – 0.2
thereof prepaid 899.7 972.3 – 7.5 899.7 972.3 – 7.5
MoU (per Ø subscriber)*) 450.7 425.6 5.9 438.5 417.6 5.0
ARPU (in EUR) 4.4 4.6 – 4.9 4.7 4.1 13.7
Churn (%) 1.7% 1.7% 1.7% 1.6%
Wireline indicators Q4 2017 reported
Q4 2016 proforma % change
1-12 M 2017 reported
1-12 M 2016 proforma % change
RGUs (thousands) 463.4 429.3 8.0 463.4 429.3 8.0 *) Minutes of Use no longer include M2M subscribers. Comparative figures have been adjusted accordingly.
The following analysis is based on proforma5 figures if not stated otherwise.
In Belarus, operational developments continued to face macroeconomic challenges, nevertheless there
are some improvements and GDP is expected to have grown slightly by 0.7% in 2017 (IMF estimate;
2016: -2.6%). In this context, the government still maintains its focus on stabilising inflation, which came
in at 4.6% in December 2017 and continued to keep, amongst others, caps on certain price increases.
Already in the previous quarter, velcom continued its fixed-line consolidation strategy with the acquisition
of Garant (Gomel), consolidated as of 1 August 2017. Additionally, velcom is now able to offer cloud ser-
vices and digital products (Infrastructure as a Service, Platform as a Service), with the launch of its own
data centre in September 2017. Moreover, an inflation-linked price increase of 9% as of 12 April 2017
was implemented for the mobile business, following a price increase for the fixed-line business as of 1
March 2017. Despite its lack of a 4G license, velcom’s mobile network maintained its superior standard in
terms of coverage and quality. At the same time, strong mobile competition with unlimited data offers is a
challenge to customer retention. Although data consumption still increased, growth rates have started to
slow down.
The company’s mobile customer base decreased by 1.6% compared to the previous year, mainly driven by
the prepaid and, to a lesser extent, by the postpaid segment. Revenue generating units in the fixed-line
5 Proforma figures include effects of M&A transactions executed between the start of the comparison period and the end of the reporting period.

A1 Telekom Austria Group 19
business grew by 8.0% year-on-year to 463,400 RGUs, including the 159,600 RGUs of the acquired fixed-
line provider Garant (Gomel).
In Q4 2017, the Belarusian Rouble devalued by 10.7% compared to the same period last year (period av-
erage), while it appreciated by 1.0% in the full year 2017 versus full year 2016 (period average). Due to
the negative FX effect of EUR 10.4 mn, total revenues were stable at -0.1% (reported: +5.8%) year-on-
year in Euro terms, while they rose by 10.7% (reported: +17.2%) on a local currency basis. This rise was
driven by higher equipment revenues which rose due to a switch towards a more expensive handset port-
folio. Service revenues also rose due to inflation-linked price increases and ongoing growth in data con-
sumption. Nevertheless, revenue growth dynamics were fading out, also due to the annualisation of the
price increase from September 2016.
Total costs and expenses rose on a local currency basis driven by higher costs of equipment and higher
service costs such as taxes and use of rights as well as increased inflation-based salary increases.
The slowdown in revenue growth, together with higher costs and expenses, resulted in a 14.0% lower
EBITDA compared to Q4 2016 (reported: -10.2%). Excluding the negative FX impact of EUR 4.9 mn,
EBITDA in Belarus declined by 2.5% year-on-year (reported: +1.8%).
Segment Slovenia
Key performance indicators Proforma view ( = Reported view) Financials
in EUR million Q4 2017 reported
Q4 2016 proforma % change
1-12 M 2017 reported
1-12 M 2016 proforma % change
Total revenues 54.1 55.1 – 1.8 216.1 214.1 0.9
Service revenues 40.5 41.7 – 2.8 167.9 169.4 – 0.9
thereof mobile service
revenues 31.8 33.0 – 3.7 132.9 135.7 – 2.0
thereof fixed-line service
revenues 8.7 8.7 0.2 35.0 33.7 3.8
Equipment revenues 12.5 11.8 5.6 43.8 40.4 8.4
Other operating income 1.1 1.6 – 30.3 4.3 4.3 0.8
EBITDA 7.6 10.1 – 24.9 40.6 52.8 – 23.2
% of total revenues 14.0% 18.3% 18.8% 24.7%
EBIT 0.0 1.4 – 97.1 10.5 20.1 – 47.8
% of total revenues 0.1% 2.5% 4.8% 9.4%
Wireless indicators Q4 2017 reported
Q4 2016 proforma % change
1-12 M 2017 reported
1-12 M 2016 proforma % change
Wireless subscribers (thousands) 703.3 714.3 – 1.5 703.3 714.3 – 1.5
thereof postpaid 605.8 591.8 2.4 605.8 591.8 2.4
thereof prepaid 97.5 122.5 – 20.4 97.5 122.5 – 20.4
MoU (per Ø subscriber)*) 371.8 361.5 2.9 359.4 356.2 0.9
ARPU (in EUR) 15.0 15.4 – 2.5 15.6 15.8 – 1.7
Churn (%) 1.8% 1.6% 1.7% 1.5%
Wireline indicators Q4 2017 reported
Q4 2016 proforma % change
1-12 M 2017 reported
1-12 M 2016 proforma % change
RGUs (thousands) 183.0 172.0 6.4 183.0 172.0 6.4 *) Minutes of Use no longer include M2M subscribers. Comparative figures have been adjusted accordingly.
As there have been no mergers or acquisitions in Slovenia between the beginning of the comparison pe-
riod and the end of the period under review, the following analysis is based on reported figures.
Belarusian Rouble
depreciated by 10.7% in Q4
EBITDA decline of 2.5% year-
on-year in local currency
20 Results for the Full Year 2017
In the fourth quarter of 2017, the Slovenian telecommunications market was still characterised by fierce
competition in the mobile market, with a focus on convergent tariffs with high discounts and competitive
mobile tariffs including high data allowances. In order to follow market demand, A1 Slovenija also in-
creased its data allowances in September 2017.
In the fourth quarter of 2017, the number of mobile customers decreased by 1.5%, as losses in the pre-
paid segment could not be fully offset by an increasing number of postpaid subscribers. Total fixed-line
revenue generating units (RGUs) increased by 6.4% year-on-year in the fourth quarter of 2017, mainly
driven by higher demand for IPTV and voice telephony.
Total revenues in Slovenia declined by 1.8% year-on-year due to lower mobile service revenues. This de-
cline was driven by lower monthly fees following the enduring highly competitive environment as well as
the negative roaming impact. Equipment revenues rose on the back of higher sales prices due to high-
value handsets. Fixed-line service revenues remained stable in a year-on-year comparison.
Total costs and expenses increased by 3.3% year-on-year, mainly driven by higher roaming expenses as
well as sales area costs due to more sales staff. Content costs also rose following more TV RGUs and price
increases for TV rights.
The above-mentioned decline in revenues, together with the increase in total costs and expenses, led to a
sharp EBITDA decline of 24.9% year-on-year.
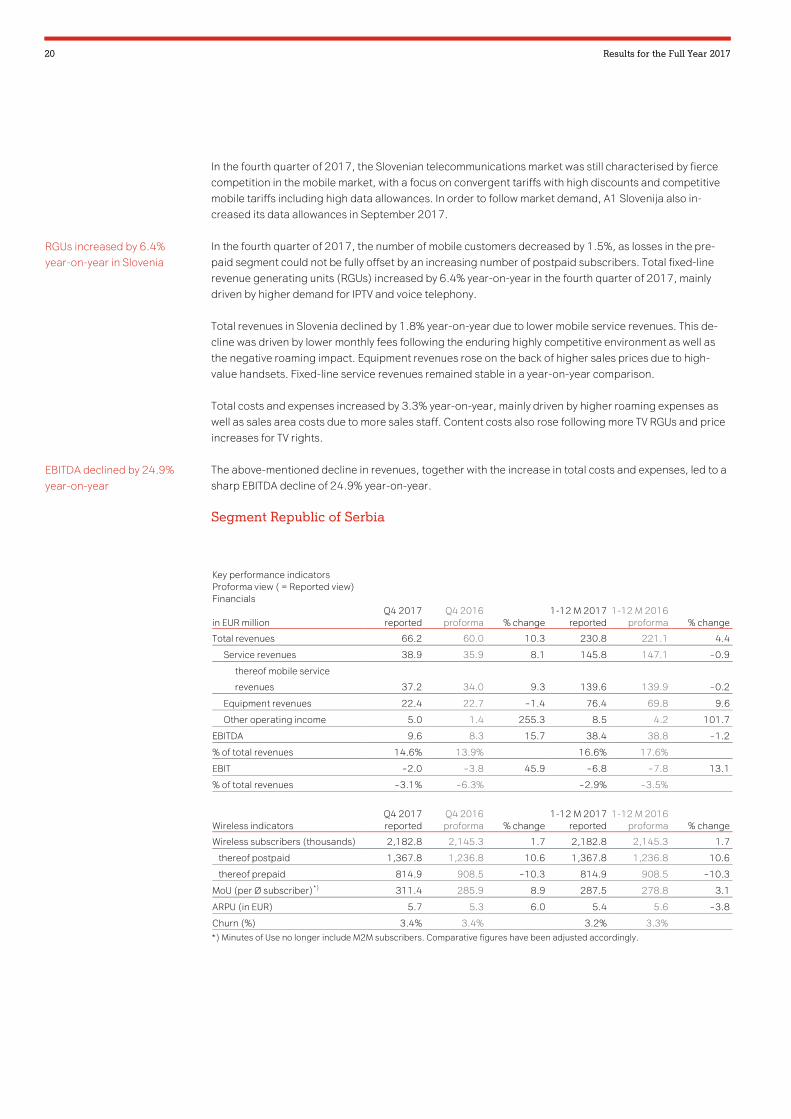
Segment Republic of Serbia
Key performance indicators Proforma view ( = Reported view) Financials
in EUR million Q4 2017 reported
Q4 2016 proforma % change
1-12 M 2017 reported
1-12 M 2016 proforma % change
Total revenues 66.2 60.0 10.3 230.8 221.1 4.4
Service revenues 38.9 35.9 8.1 145.8 147.1 – 0.9
thereof mobile service
revenues 37.2 34.0 9.3 139.6 139.9 – 0.2
Equipment revenues 22.4 22.7 – 1.4 76.4 69.8 9.6
Other operating income 5.0 1.4 255.3 8.5 4.2 101.7
EBITDA 9.6 8.3 15.7 38.4 38.8 – 1.2
% of total revenues 14.6% 13.9% 16.6% 17.6%
EBIT – 2.0 – 3.8 45.9 – 6.8 – 7.8 13.1
% of total revenues – 3.1% – 6.3% – 2.9% – 3.5%
Wireless indicators Q4 2017 reported
Q4 2016 proforma % change
1-12 M 2017 reported
1-12 M 2016 proforma % change
Wireless subscribers (thousands) 2,182.8 2,145.3 1.7 2,182.8 2,145.3 1.7
thereof postpaid 1,367.8 1,236.8 10.6 1,367.8 1,236.8 10.6
thereof prepaid 814.9 908.5 – 10.3 814.9 908.5 – 10.3
MoU (per Ø subscriber)*) 311.4 285.9 8.9 287.5 278.8 3.1
ARPU (in EUR) 5.7 5.3 6.0 5.4 5.6 – 3.8
Churn (%) 3.4% 3.4% 3.2% 3.3% *) Minutes of Use no longer include M2M subscribers. Comparative figures have been adjusted accordingly.
RGUs increased by 6.4%
year-on-year in Slovenia
EBITDA declined by 24.9%
year-on-year
A1 Telekom Austria Group 21
As there have been no mergers or acquisitions in the Republic of Serbia between the beginning of the
comparison period and the end of the period under review, the following analysis is based on
reported figures.
In the segment Republic of Serbia, vip mobile faces a highly competitive market with aggressive conver-
gent offers including high discounts. The company addressed this market environment by a repositioning
and the introduction of attractive flat tariffs in June 2017, with improving trends throughout the year. On a
negative tone, results were impacted by regulatory headwinds due to termination rate cuts in January
2017.
Supported by the new tariff portfolio, the contract share continued to increase further from 57.7% in Q4
2016 to 62.7% in Q4 2017. The number of total subscribers increased by 1.7% year-on-year, entirely
driven by the postpaid segment which was backed by high gross additions from the above-mentioned new
tariffs and high demand for mobile WiFi routers.
In Q4 2017, total revenues increased by 10.3% year-on-year due to higher mobile service revenues and
higher other operating income, partly offset by lower equipment revenues due to lower quantities. Other
operating income was driven by a positive one-off effect in the amount of EUR 3.8 mn in Q4 2017, result-
ing from changed parameters in the calculation of asset retirement obligations. Excluding this one-off ef-
fect, total revenues rose by 4.0% year-on-year. Mobile service revenues increased as rising revenues from
fixed fees more than compensated for decreased visitor and national roaming as well as lower intercon-
nection revenues resulting from termination rate cuts.
Total costs and expenses rose by 9.5% year-on year in the fourth quarter of 2017, driven by higher bad
debts. Interconnection costs rose due to unlimited tariffs which led to increased outgoing traffic. Addition-
ally, equipment costs increased due to mobile WiFi routers and increased subsidies.
EBITDA in the Republic of Serbia increased by 15.7% year-on-year. Excluding the above-mentioned one-
off effect, EBITDA declined by 29.9% year-on-year as the rise in mobile service revenues could not out-
weigh higher bad debts and interconnection costs.
Total revenues increased by
10.3% year-on-year.
EBITDA increase of 15.7% in
the Republic of Serbia
22 Results for the Full Year 2017
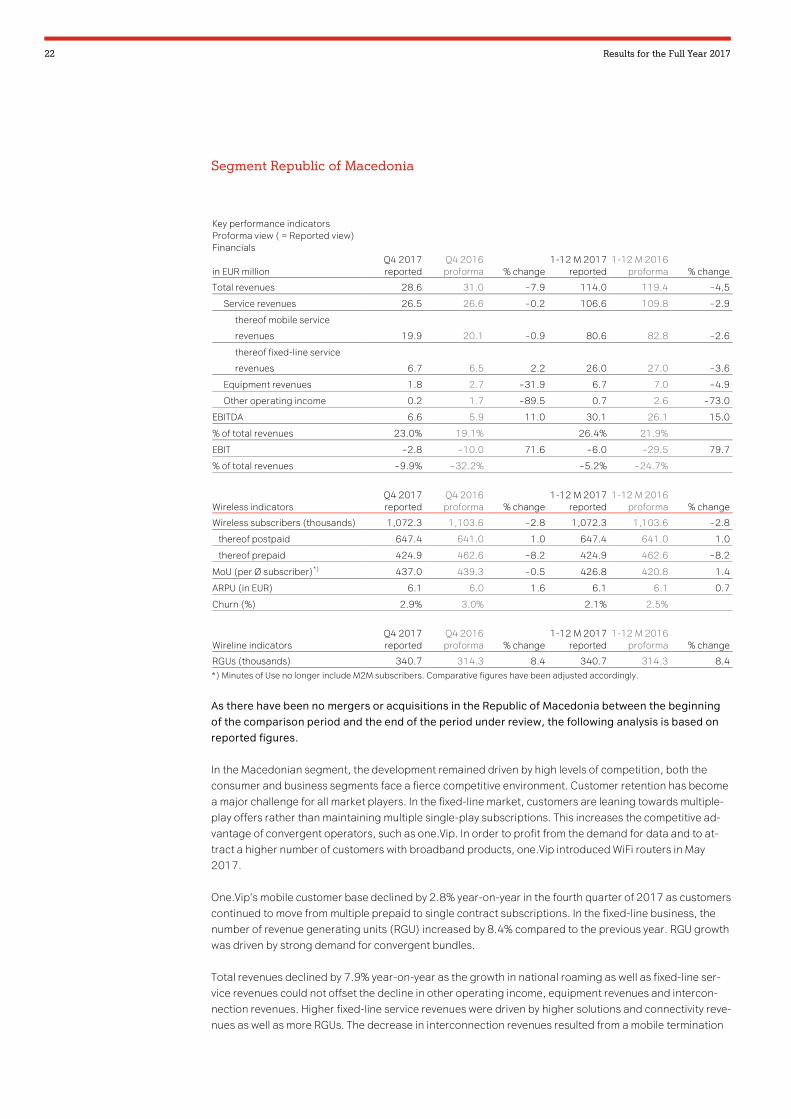
Segment Republic of Macedonia
Key performance indicators Proforma view ( = Reported view) Financials
in EUR million Q4 2017 reported
Q4 2016 proforma % change
1-12 M 2017 reported
1-12 M 2016 proforma % change
Total revenues 28.6 31.0 – 7.9 114.0 119.4 – 4.5
Service revenues 26.5 26.6 – 0.2 106.6 109.8 – 2.9
thereof mobile service
revenues 19.9 20.1 – 0.9 80.6 82.8 – 2.6
thereof fixed-line service
revenues 6.7 6.5 2.2 26.0 27.0 – 3.6
Equipment revenues 1.8 2.7 – 31.9 6.7 7.0 – 4.9
Other operating income 0.2 1.7 – 89.5 0.7 2.6 – 73.0
EBITDA 6.6 5.9 11.0 30.1 26.1 15.0
% of total revenues 23.0% 19.1% 26.4% 21.9%
EBIT – 2.8 – 10.0 71.6 – 6.0 – 29.5 79.7
% of total revenues – 9.9% – 32.2% – 5.2% – 24.7%
Wireless indicators Q4 2017 reported
Q4 2016 proforma % change
1-12 M 2017 reported
1-12 M 2016 proforma % change
Wireless subscribers (thousands) 1,072.3 1,103.6 – 2.8 1,072.3 1,103.6 – 2.8
thereof postpaid 647.4 641.0 1.0 647.4 641.0 1.0
thereof prepaid 424.9 462.6 – 8.2 424.9 462.6 – 8.2
MoU (per Ø subscriber)*) 437.0 439.3 – 0.5 426.8 420.8 1.4
ARPU (in EUR) 6.1 6.0 1.6 6.1 6.1 0.7
Churn (%) 2.9% 3.0% 2.1% 2.5%
Wireline indicators Q4 2017 reported
Q4 2016 proforma % change
1-12 M 2017 reported
1-12 M 2016 proforma % change
RGUs (thousands) 340.7 314.3 8.4 340.7 314.3 8.4 *) Minutes of Use no longer include M2M subscribers. Comparative figures have been adjusted accordingly.
As there have been no mergers or acquisitions in the Republic of Macedonia between the beginning
of the comparison period and the end of the period under review, the following analysis is based on
reported figures.
In the Macedonian segment, the development remained driven by high levels of competition, both the
consumer and business segments face a fierce competitive environment. Customer retention has become
a major challenge for all market players. In the fixed-line market, customers are leaning towards multiple-
play offers rather than maintaining multiple single-play subscriptions. This increases the competitive ad-
vantage of convergent operators, such as one.Vip. In order to profit from the demand for data and to at-
tract a higher number of customers with broadband products, one.Vip introduced WiFi routers in May
2017.
One.Vip’s mobile customer base declined by 2.8% year-on-year in the fourth quarter of 2017 as customers
continued to move from multiple prepaid to single contract subscriptions. In the fixed-line business, the
number of revenue generating units (RGU) increased by 8.4% compared to the previous year. RGU growth
was driven by strong demand for convergent bundles.
Total revenues declined by 7.9% year-on-year as the growth in national roaming as well as fixed-line ser-
vice revenues could not offset the decline in other operating income, equipment revenues and intercon-
nection revenues. Higher fixed-line service revenues were driven by higher solutions and connectivity reve-
nues as well as more RGUs. The decrease in interconnection revenues resulted from a mobile termination

A1 Telekom Austria Group 23
rate cut in December 2016. However, service revenues were stable year-on-year, showing an improving
trend compared to previous quarters. Equipment revenues declined due to lower quantities.
Total costs and expenses fell by 12.3% in a year-on-year comparison, driven by lower equipment costs as
well as cost synergies deriving from the merger with ONE.
In the Republic of Macedonia, lower total revenues were more than compensated by the decline in costs
and resulted in EBITDA growth of 11.0% year-on-year.
EBITDA grew by 11.0% in Q4
2017 year-on-year

24 Results for the Full Year 2017
Full Year 2017: Summary of Profit and Loss
The following analysis is based on proforma6 figures if not stated otherwise.
In order to further strengthen its market position, the A1 Telekom Austria Group carried out targeted M&A
activities, whereby the following transactions between the start of the comparison period and the end of
the reporting period are highlighted:
� The acquisition of fixed-line operator Garant (Gomel) in Belarus, consolidated as of 1 August
2017.
� The acquisition of fixed-line operator Metronet in Croatia, consolidated as of 1 February 2017.
� The acquisition of fixed-line provider Atlant Telecom and its subsidiary TeleSet in Belarus, consoli-
dated as of 1 December 2016.
In 2017, the one-off effects in total revenues (incl. other operating income) amounted to EUR +23.8 mn
(2016: none), EBITDA included one-off effects of EUR +23.8 mn (2016: EUR +21.4 mn). The material one-
off effects in 2017 and 2016 are as follows:
2017:
� A positive one-off effect in the Republic of Serbia in the amount of EUR 3.8 mn in Q4 2017 in other
operating income, resulting from changed parameters in the calculation of asset retirement obli-
gations.
� A positive one-off effect in Bulgaria in the amount of EUR 5.8 mn in Q3 2017 in other operating in-
come, stemming from a legal settlement.
� A positive one-off effect in Austria in the amount of EUR 10.6 mn in Q1 2017 in fixed-line service
revenues (in solutions & connectivity), resulting from the reversal of an accrual for wholesale ser-
vices.
� A positive one-off effect of EUR 3.6 mn in the Austria segment in Q1 2017 in other operating in-
come, stemming from a release of an asset retirement obligation.
2016:
� A positive EUR 14.4 mn one-off effect in Q3 2016 deriving from the reversal of an accrual for copy-
rights in Austria, included in cost of service.
� A positive EUR 7.0 mn one-off effect in Austria in cost of equipment in Q1 2016, stemming from
the harmonisation of value adjustments for handsets.
Furthermore, positive FX effects of EUR 11.0 mn are included in revenues and EUR 3.3 mn in EBITDA in
2017, stemming from the segments Belarus, Croatia and Republic of Serbia.
Restructuring charges amounted to positive EUR 18.2 mn in 2017 compared to negative EUR 7.2 mn in
2016.
Revenues
In the 2017 financial year, the A1 Telekom Austria Group saw an increase in revenues of 3.0% (reported:
+4.1%). This revenue growth was driven by the strong operational performance in Belarus, as well as
higher total revenues in Austria, Bulgaria, Croatia, the Republic of Serbia and Slovenia. These increases
6 Proforma figures include effects of M&A transactions executed between the start of the comparison period and the end of the reporting period.
Group total revenues rose by
3.0% year-on-year
A1 Telekom Austria Group 25
were only partly offset by lower total revenues in the Republic of Macedonia. In total, Group service reve-
nues increased by 1.6% (reported: +2.7%).
Negative effects stemming from the stepwise abolition of retail roaming in the EU as of 30 April 2016 and
15 June 2017 came in lower than expected and derive mostly from Austria, with further impacts in Slovenia
and Bulgaria. The impact in Croatia was positive.
Total revenues in the Austrian segment increased by 2.0% year-on-year in the year under review, including
the positive one-off effects described above in the total amount of EUR 14.2 mn in Q1 2017. Excluding
these effects, total revenues rose by 1.4%. The rise was driven by higher solutions & connectivity and in-
terconnection revenues in the fixed-line segment, increasing revenues from fixed-line services in the resi-
dential business as well as higher revenues from the sale of handsets. Revenues from fixed-line services in
the residential business increased as the lower airtime revenues could be more than offset by higher
broadband revenues thanks to a strong demand for products with a higher bandwidth and the above-
mentioned price increases as well as increased TV revenues. In the mobile business, the lower revenues
from mobile services were due to the negative effects of the stepwise abolition of retail roaming in the EU
as of 30 April 2016 and 15 June 2017 as well as losses in the prepaid segment. This was somewhat com-
pensated for by increased revenues in the mobile broadband business and the postpaid segment. Reve-
nues from the sale of mobile handsets increased due to higher quantities sold and an updated handset
portfolio with a shift to higher-value devices.
In the Bulgarian segment, total revenues rose by 4.7% in 2017 compared to the same period last year.
This was driven by the increase in revenues from the sale of handsets and higher revenues from fixed-line
services as well as a positive one-off effect in other operating income in Q3 2017 amounting to
EUR 5.8 mn as a result of a legal settlement. Excluding this one-off effect, total revenues increased by
3.2% year-on-year. Wireless service revenues were impacted by pricing pressure in the business segment
and regulatory effects from the reduction of interconnection and roaming charges. Fixed-line service reve-
nues increased, supported by the launch of the exclusive sport TV package and increased demand for
fixed-line corporate solutions as well as the growth in satellite TV subscribers.
In the Croatian segment, total revenues rose by 2.6% year-on-year (reported: +9.2%). This development
was attributable primarily to the strong growth in the fixed-line business as well as the significant increase
in visitor roaming due to greater elasticity in data usage. Excluding these positive roaming effects, Croatia
also saw a rise in revenues from mobile services in the year under review. Equipment revenues declined
despite higher sales volumes as revenues per device decreased.
Total revenues in the Belarusian segment increased by 15.2% year-on-year (reported: +21.6%), driven by
continuing solid operational growth on the back of inflation-linked price increases and strong demand for
data. Revenues from the sale of handsets also increased due to the changeover to a portfolio with more
expensive handsets and higher sales volumes. The supportive FX development in the first half of 2017 was
almost completely offset by a devaluation in the second half of the year. Overall, the Belarusian Rouble ap-
preciated by 1.0% compared to the same period last year (period average used respectively). On a local
currency basis, total revenues rose by 14.1% in comparison with the previous year (reported: +20.5%).
Total revenues in Slovenia increased by 0.9% year-on-year, as lower revenues from mobile services could
be more than offset by increasing equipment revenues and increasing revenues from fixed-line services.
Mobile service revenues declined as a result of negative roaming impacts and lower monthly fees due to
the enduring highly competitive environment. Equipment revenues rose on the back of higher sales prices
due to higher value handsets. Fixed-line service revenues increased due to price adjustments for TV prod-
ucts as of 1 March 2017 and RGU growth.
Total revenues in the Republic of Serbia increased by 4.4% year-on-year as a result of higher equipment
revenues, which increased as a result of higher sales prices, and the positive one-off effect resulting from
changed parameters in the calculation of asset retirement obligations. Excluding this one-off effect, total

26 Results for the Full Year 2017
revenues increased by 2.6% year-on-year. Increased monthly fees were fully offset by lower interconnec-
tion revenues, prescribed by regulation, and by lower airtime revenues.
Total revenues in the Republic of Macedonia decreased by 4.5% year-on-year, mostly due to a decline in
interconnection revenues stemming from a mobile termination rate cut as well as lower transit revenues in
the fixed-line segment.
Total Costs and Expenses
Group total costs and expenses increased by 3.5% year-on-year in the year under review (reported:
+4.5%). Investments in high-value customers led to a rise in costs of equipment and higher sales area
costs. The costs of service increased, among other things, due to higher roaming and content costs. Re-
structuring, originating entirely from the Austria segment, resulted in income of EUR 18.2 mn in the year
under review, stemming primarily from a revaluation due to changed parameters. In the previous year, re-
structuring charges amounted to EUR 7.2 mn.
EBITDA
Group EBITDA increased by 2.0% in the 2017 financial year (reported: +3.2%). The growth in Belarus,
Austria, Croatia, Bulgaria and Republic of Macedonia was only partially offset by a decline in Slovenia and
the Republic of Serbia. Furthermore, start-up costs of A1 Digital, included in the position ‘Corporate &
other, eliminations’, had a negative impact on Group EBITDA. In total, the EBITDA margin decreased
slightly from 32.2% in the previous year to 31.9% in the year under review. Solid operational trend in the
first nine months of 2017 were weakened by seasonally lower EBITDA margin in Q4 but also higher Q4
OPEX versus last year driven by additional investments realising market opportunities in the Christmas
season, A1 Digital and higher than usual non-recurring items.
In the Austrian segment, the rise in total costs and expenses in the year under review was more than offset
by higher total revenues. The EBITDA thereby increased by 1.6% in comparison with the previous year. Ad-
justed for one-off effects in costs and revenues as well as restructuring expenses, the EBITDA decreased
slightly by 0.4%. In 2017, total costs and expenses in the Austrian segment rose by 2.2% year-on-year.
Costs of equipment, interconnection expenses, attributable to increased volumes, and roaming costs in
particular experienced an increase. These increases were partially offset by lower network maintenance
and advertising costs. Costs of equipment rose primarily due to higher handset subsidies and higher
quantities as well as increased costs for ICT equipment.
In the Bulgarian segment, increasing total revenues could more than offset higher costs and expenses
which resulted in an EBITDA increase of 3.6% in the 2017 year under review. Excluding the above-men-
tioned positive one-off effect in Q3 2017, the EBITDA declined by 1.0% year-on-year. The increase in total
costs and expenses of 5.1% in comparison with the previous year was driven primarily by higher equip-
ment costs following increased costs for smartphones. In addition, employee costs increased due to sales
initiatives while bad debt expenses rose year-on-year due to lower collections. These cost increases were
partially offset by lower network maintenance costs and decreased interconnection costs.
In the Croatian segment, the slightly higher costs and expenses were more than offset by revenue growth,
which led to an EBITDA increase of 9.6% year-on-year (reported: +22.4%). The 0.5% increase in costs and
expenses in the year under review (reported: +5.4%) was primarily driven by higher roaming costs as well
as revenue-related salesforce costs and commissions.
In the Belarusian segment, the increasing revenues more than offset higher costs and expenses, which
resulted in an increase in EBITDA of 15.2% (reported: 19.6%). Belarus recorded the highest EBITDA mar-
gin in the Group at 46.4% in the year under review (2016: 46.4%). Excluding the positive FX effects
amounting to EUR 1.8 mn, the EBITDA in Belarus increased by 14.1% year-on-year (reported: 18.5%).
Costs and expenses increased by 15.3% in the year under review (reported: +23.5%). On a local currency
Group EBITDA increase of
2.0% year-on-year

A1 Telekom Austria Group 27
basis, the increase amounted to 14.2% (reported: 22.3%). This increase resulted mostly from increasing
equipment costs and higher personnel costs due to inflation-linked salary increases as well as higher
roaming costs.
In Slovenia, higher revenues were more than offset by higher costs and expenses in the year under review
and resulted in a significant decrease in the EBITDA of 23.2% year-on-year. Costs and expenses increased
by 8.8% and were primarily driven by higher equipment costs following the shift to higher value handsets
and rising roaming costs. Content costs increased as a result of more TV RGUs and price increases for TV
rights, while advertising costs also increased due to the rebranding.
In the Republic of Serbia, the higher total revenues could not entirely offset the higher costs and expenses,
which resulted in a 1.2% decline in the EBITDA. Excluding the one-off effect in Q4 2017, EBITDA decreased
by 11.0% year-on-year. In the year under review, total costs and expenses increased by 5.5% year-on-
year, mainly driven by higher equipment costs due to mobile Wi-Fi routers and higher handset prices. The
higher costs were also attributable to higher bad debts as well as increasing personnel and advertising
costs as a result of sales initiatives. These increases were partly compensated for by lower interconnection
expenses due to the above-mentioned termination rate cuts.
In the Republic of Macedonia, the decrease in total revenues was more than offset by lower total costs and
expenses and in 2017; the EBITDA increased by 15.0% year-on-year. Costs and expenses decreased by
10.0% year-on-year. The decline was attributable to lower interconnection expenses due to a termination
rate cut as well as cost savings on account of the synergies created following the merger with ONE.
Operating Income
In the year under review, expenses for depreciation and amortisation increased by 9.4% to EUR 953.4 mn
(reported: +10.2%) in comparison with the previous year. This increase was primarily due to the brand
value amortisation in Bulgaria and, to a lesser degree, in Belarus, Croatia, and the Republic of Macedonia,
in conjunction with Group-wide rebranding. As a result, operating income declined by 10.5% to
EUR 443.9 mn compared with the previous year (reported: -8.8%). Excluding brand value amortisations,
the operating income increased by 14.3% (reported: 16.5%).
The following analysis is presented on a reported basis if not stated otherwise.
Consolidated Net Result
The A1 Telekom Austria Group recorded a financial result of negative EUR 95.4 mn in the year under re-
view, which means an improvement of 24.8% compared to the previous year. This was mainly due to the
EUR 47.2 mn reduction in interest expense. This resulted, on the one hand, from the repayment of a
EUR 500 mn bond on 27 January 2017 and favourable refinancing conditions. On the other hand, the pre-
vious year was impacted by termination costs for the early repayment of bank debt. FX differences
amounted to negative EUR 2.6 mn in the reporting year after positive EUR 10.0 mn in 2016.
Tax expenses of EUR 3.0 mn were reported in the year under review despite further capitalisation of de-
ferred tax assets. In the previous year, the recognition of higher deferred tax assets on tax losses carried
forward resulted in a tax benefit of EUR 53.5 mn. Overall, the A1 Telekom Austria Group reported a positive
net result of EUR 345.5 mn in the 2017 reporting year (2016: EUR 413.2 mn).
Reported net result of
EUR 345.5 mn

28 Results for the Full Year 2017
Outlook
A1 Telekom Austria Group outlook for the full year 2018
(Based on IAS 18 reporting)
In 2017, A1 Telekom Austria Group managed to grow revenues and EBITDA via a clear focus on high-value
customers and attractive fixed-line propositions, both on a reported and proforma basis. This was
achieved despite the fact that most of the Group’s mobile markets continued to be characterised by in-
tense competition and regulatory burdens. The macroeconomic headwinds slowed down further in most
segments. Results were negatively impacted by the stepwise abolition of retail roaming in the EU during
the last two years. The Belarusian Rouble showed, in contrast to the forgone years, a stable development
versus the Euro (+1.0% year-on-year based on period average). Cost efficiencies enabled the translation
of the solid revenue growth into an EBITDA increase. Moreover, results profited from acquisitions in the
fixed-line business.
In the reporting year, the A1 Telekom Austria Group decided to harmonise its brands throughout the
Group and to roll out the ‘A1’ brand in a gradual manner throughout the Group, depending on local cir-
cumstances. This triggered the amortisation of local brand values, which had reached a total of around
EUR 350 mn by the end of 2016. The respective companies will amortise the brand values until the phase-
out of the old brands, which is expected to have a negative impact on the net result until the financial year
2019, with more than half of the impact in 2017 and Q1 2018. In 2017, the brand value amortisation re-
sulting thereof amounted to EUR 121.8 mn and stemmed primarily from the segment Bulgaria as well as,
to a lesser extent, from the segments Belarus, Croatia and Republic of Macedonia. (The total brand amor-
tisation for the full year 2017 amounted to EUR 123.2 mn.)
For the full year 2018, most of the market dynamics mentioned above are expected to remain.
Both in Austria and in the CEE markets, the competitive environment in mobile markets is anticipated to
continue, while the demand for fixed-line services is expected to remain a positive driver across all mar-
kets. In the CEE segments, operational results are expected to benefit increasingly from measures taken in
the past as well as from the macroeconomic improvements, with GDP growth forecasted in all markets.
The negative roaming impact is anticipated to amount to approximately 1.0% to 1.5% of Group EBITDA for
the full year 2018. Contrary to the supportive FX development in 2017, the operational performance in
Belarus is expected to be negatively affected by a devaluation of the Belarusian Rouble.
In this business environment, the Management of A1 Telekom Austria Group remains committed to its
growth strategy and is concentrating on the following focus areas: exceling in the core business, expan-
sion of products and services as well as value-accretive mergers and acquisitions.
As in the previous year, results should gain support from ongoing efforts to continuously increase operat-
ing efficiency.
For the year 2018, the Management of A1 Telekom Austria Group expects to achieve modest growth in
total revenues on a reported basis.
A1 Telekom Austria Group remains committed to the LTE rollout across its markets as well as the acceler-
ated fibre deployment in Austria. Capital expenditures before spectrum investments and acquisitions are
expected to remain stable in 2018.

A1 Telekom Austria Group 29
Whilst the Management of A1 Telekom Austria Group acknowledges the limited predictability of the Bela-
rusian Rouble, it expects the currency to devalue by approximately 10% versus the EUR (period average) in
2018.
Based on the improved operational and financial performance of the Group, a new expected dividend level
was agreed upon by América Móvil and Österreichische Bundes- und Industriebeteiligungen GmbH (ÖBIB)
in 2016. Starting with the financial year 2016, this dividend expectation entails the payment of EUR 0.20
per share to be maintained or increased on a sustainable basis in line with the operational and financial
developments of the Group.
In order to ensure its financial flexibility, A1 Telekom Austria Group remains committed to maintaining its
Baa2/BBB ratings from Moody’s and Standard & Poor’s.
With regards to frequencies, in Austria the NRA announced that an auction on 3.4-3.8 GHz band will be
published in 2018.
Please note that this a list of potential spectrum awards procedures. Whether A1 Telekom Austria Group is
planning and sees a need to participate and acquire spectrum in the abovementioned procedures, the
Group is not permitted to comment on.

30 Results for the Full Year 2017
Additional Information
Risks and Uncertainties
The A1 Telekom Austria Group faces various risks and uncertainties which could affect its results. For fur-
ther details about these risks and uncertainties, please refer to the A1 Telekom Austria Group Annual Re-
port 2016, pp. 74 ff.
Waiver of Review
This financial report of the A1 Telekom Austria Group contains quarterly results which have not been au-
dited or reviewed by a certified public accountant.
Other
The use of automated calculation systems may give rise to rounding differences.
The reported results include depreciation and amortisation of fair value adjustments resulting from past
business combinations and therefore may deviate from the result of the single financial statements.
n.m. – not meaningful, used for percentage changes >300% and others which are not meaningful.
n.a. – not applicable, e.g. for divisions by zero.
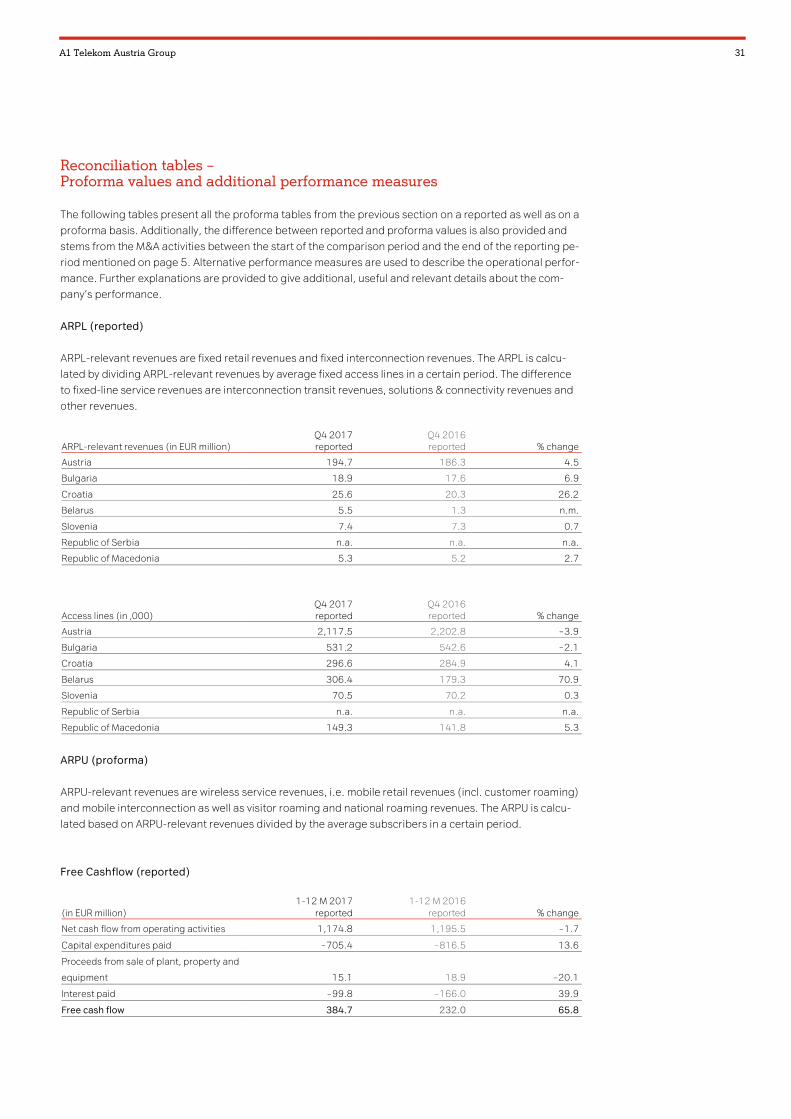
A1 Telekom Austria Group 31
Reconciliation tables – Proforma values and additional performance measures
The following tables present all the proforma tables from the previous section on a reported as well as on a
proforma basis. Additionally, the difference between reported and proforma values is also provided and
stems from the M&A activities between the start of the comparison period and the end of the reporting pe-
riod mentioned on page 5. Alternative performance measures are used to describe the operational perfor-
mance. Further explanations are provided to give additional, useful and relevant details about the com-
pany’s performance.
ARPL (reported)
ARPL-relevant revenues are fixed retail revenues and fixed interconnection revenues. The ARPL is calcu-
lated by dividing ARPL-relevant revenues by average fixed access lines in a certain period. The difference
to fixed-line service revenues are interconnection transit revenues, solutions & connectivity revenues and
other revenues.
ARPL-relevant revenues (in EUR million) Q4 2017 reported
Q4 2016 reported % change
Austria 194.7 186.3 4.5
Bulgaria 18.9 17.6 6.9
Croatia 25.6 20.3 26.2
Belarus 5.5 1.3 n.m.
Slovenia 7.4 7.3 0.7
Republic of Serbia n.a. n.a. n.a.
Republic of Macedonia 5.3 5.2 2.7
Access lines (in ‚000) Q4 2017 reported
Q4 2016 reported % change
Austria 2,117.5 2,202.8 – 3.9
Bulgaria 531.2 542.6 – 2.1
Croatia 296.6 284.9 4.1
Belarus 306.4 179.3 70.9
Slovenia 70.5 70.2 0.3
Republic of Serbia n.a. n.a. n.a.
Republic of Macedonia 149.3 141.8 5.3
ARPU (proforma)
ARPU-relevant revenues are wireless service revenues, i.e. mobile retail revenues (incl. customer roaming)
and mobile interconnection as well as visitor roaming and national roaming revenues. The ARPU is calcu-
lated based on ARPU-relevant revenues divided by the average subscribers in a certain period.
Free Cashflow (reported)
(in EUR million) 1-12 M 2017
reported 1-12 M 2016
reported % change
Net cash flow from operating activities 1,174.8 1,195.5 – 1.7
Capital expenditures paid – 705.4 – 816.5 13.6
Proceeds from sale of plant, property and
equipment 15.1 18.9 – 20.1
Interest paid – 99.8 – 166.0 39.9
Free cash flow 384.7 232.0 65.8
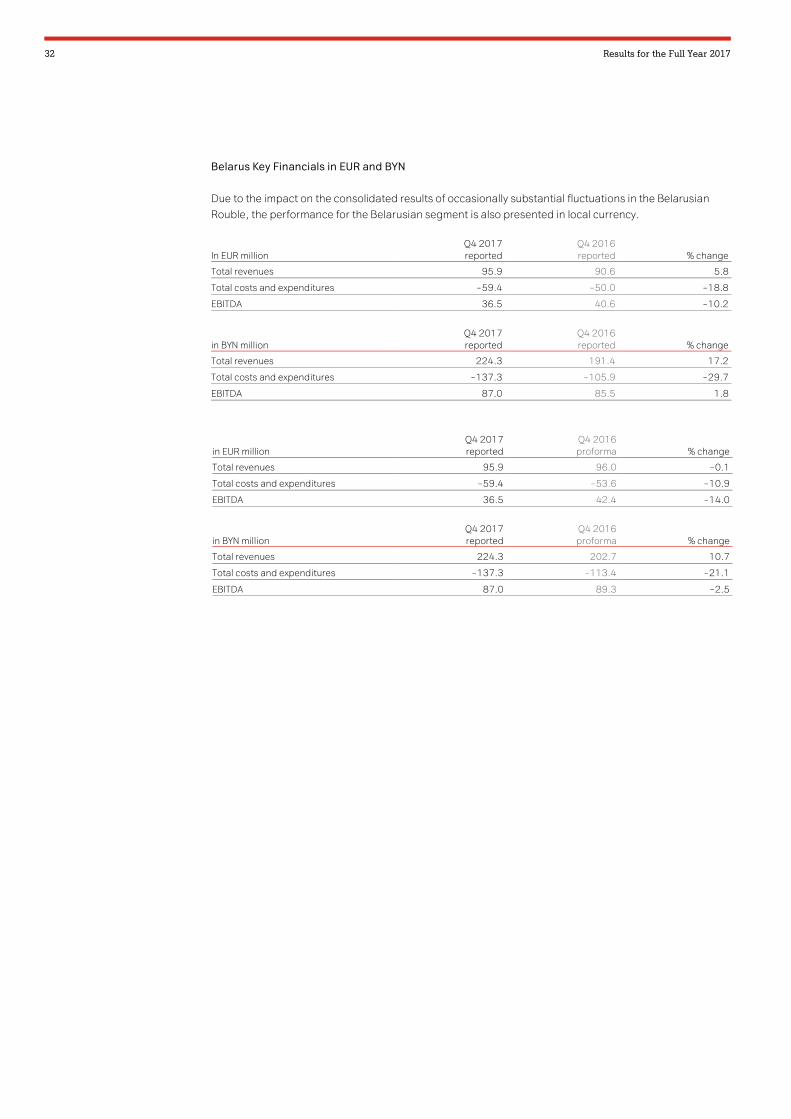
32 Results for the Full Year 2017
Belarus Key Financials in EUR and BYN
Due to the impact on the consolidated results of occasionally substantial fluctuations in the Belarusian
Rouble, the performance for the Belarusian segment is also presented in local currency.
In EUR million Q4 2017 reported
Q4 2016 reported % change
Total revenues 95.9 90.6 5.8
Total costs and expenditures – 59.4 – 50.0 – 18.8
EBITDA 36.5 40.6 – 10.2
in BYN million Q4 2017 reported
Q4 2016 reported % change
Total revenues 224.3 191.4 17.2
Total costs and expenditures – 137.3 – 105.9 – 29.7
EBITDA 87.0 85.5 1.8
in EUR million Q4 2017 reported
Q4 2016 proforma % change
Total revenues 95.9 96.0 – 0.1
Total costs and expenditures – 59.4 – 53.6 – 10.9
EBITDA 36.5 42.4 – 14.0
in BYN million Q4 2017 reported
Q4 2016 proforma % change
Total revenues 224.3 202.7 10.7
Total costs and expenditures – 137.3 – 113.4 – 21.1
EBITDA 87.0 89.3 – 2.5
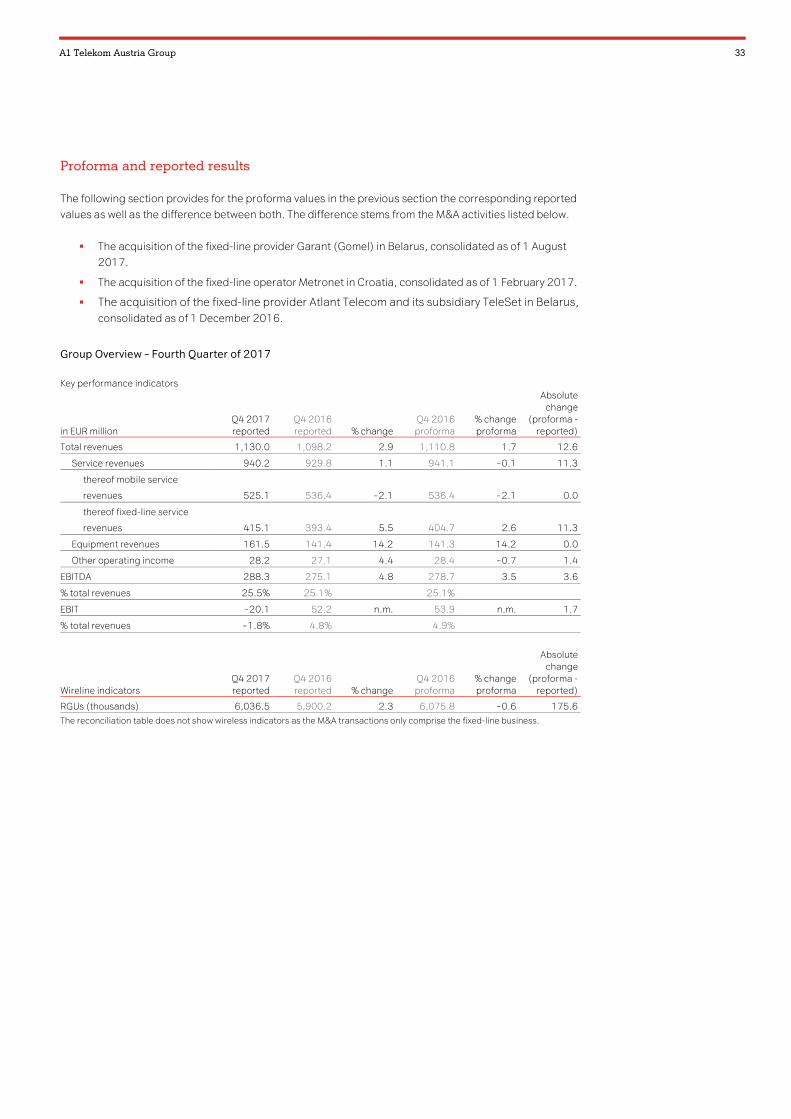
A1 Telekom Austria Group 33
Proforma and reported results
The following section provides for the proforma values in the previous section the corresponding reported
values as well as the difference between both. The difference stems from the M&A activities listed below.
� The acquisition of the fixed-line provider Garant (Gomel) in Belarus, consolidated as of 1 August
2017.
� The acquisition of the fixed-line operator Metronet in Croatia, consolidated as of 1 February 2017.
� The acquisition of the fixed-line provider Atlant Telecom and its subsidiary TeleSet in Belarus,
consolidated as of 1 December 2016.
Group Overview – Fourth Quarter of 2017
Key performance indicators
in EUR million Q4 2017 reported
Q4 2016 reported % change
Q4 2016 proforma
% change proforma
Absolute change
(proforma - reported)
Total revenues 1,130.0 1,098.2 2.9 1,110.8 1.7 12.6
Service revenues 940.2 929.8 1.1 941.1 – 0.1 11.3
thereof mobile service
revenues 525.1 536.4 – 2.1 536.4 – 2.1 0.0
thereof fixed-line service
revenues 415.1 393.4 5.5 404.7 2.6 11.3
Equipment revenues 161.5 141.4 14.2 141.3 14.2 0.0
Other operating income 28.2 27.1 4.4 28.4 – 0.7 1.4
EBITDA 288.3 275.1 4.8 278.7 3.5 3.6
% total revenues 25.5% 25.1% 25.1%
EBIT – 20.1 52.2 n.m. 53.9 n.m. 1.7
% total revenues – 1.8% 4.8% 4.9%
Wireline indicators Q4 2017 reported
Q4 2016 reported % change
Q4 2016 proforma
% change proforma
Absolute change
(proforma - reported)
RGUs (thousands) 6,036.5 5,900.2 2.3 6,075.8 – 0.6 175.6 The reconciliation table does not show wireless indicators as the M&A transactions only comprise the fixed-line business.
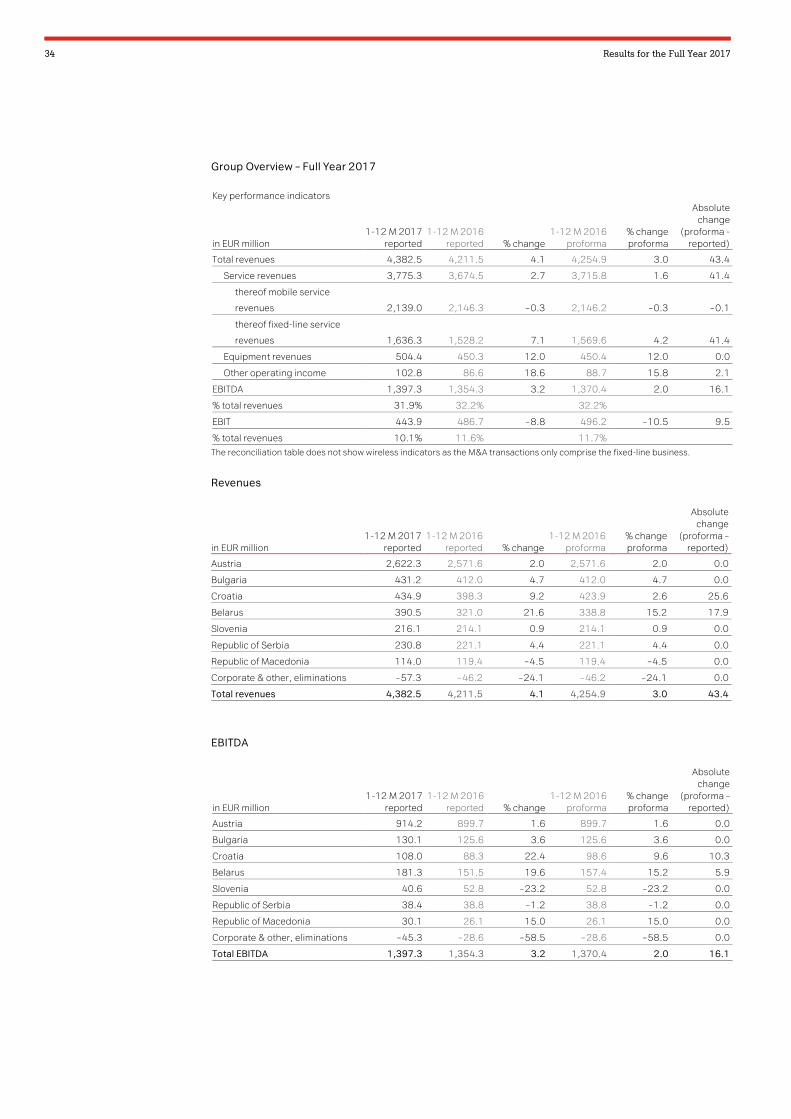
34 Results for the Full Year 2017
Group Overview – Full Year 2017
Key performance indicators
in EUR million 1-12 M 2017
reported 1-12 M 2016
reported % change 1-12 M 2016
proforma % change proforma
Absolute change
(proforma - reported)
Total revenues 4,382.5 4,211.5 4.1 4,254.9 3.0 43.4
Service revenues 3,775.3 3,674.5 2.7 3,715.8 1.6 41.4
thereof mobile service
revenues 2,139.0 2,146.3 – 0.3 2,146.2 – 0.3 – 0.1
thereof fixed-line service
revenues 1,636.3 1,528.2 7.1 1,569.6 4.2 41.4
Equipment revenues 504.4 450.3 12.0 450.4 12.0 0.0
Other operating income 102.8 86.6 18.6 88.7 15.8 2.1
EBITDA 1,397.3 1,354.3 3.2 1,370.4 2.0 16.1
% total revenues 31.9% 32.2% 32.2%
EBIT 443.9 486.7 – 8.8 496.2 – 10.5 9.5
% total revenues 10.1% 11.6% 11.7% The reconciliation table does not show wireless indicators as the M&A transactions only comprise the fixed-line business.
Revenues
in EUR million 1-12 M 2017
reported 1-12 M 2016
reported % change 1-12 M 2016
proforma % change proforma
Absolute change
(proforma – reported)
Austria 2,622.3 2,571.6 2.0 2,571.6 2.0 0.0
Bulgaria 431.2 412.0 4.7 412.0 4.7 0.0
Croatia 434.9 398.3 9.2 423.9 2.6 25.6
Belarus 390.5 321.0 21.6 338.8 15.2 17.9
Slovenia 216.1 214.1 0.9 214.1 0.9 0.0
Republic of Serbia 230.8 221.1 4.4 221.1 4.4 0.0
Republic of Macedonia 114.0 119.4 – 4.5 119.4 – 4.5 0.0
Corporate & other, eliminations – 57.3 – 46.2 – 24.1 – 46.2 – 24.1 0.0
Total revenues 4,382.5 4,211.5 4.1 4,254.9 3.0 43.4
EBITDA
in EUR million 1-12 M 2017
reported 1-12 M 2016
reported % change 1-12 M 2016
proforma % change proforma
Absolute change
(proforma – reported)
Austria 914.2 899.7 1.6 899.7 1.6 0.0
Bulgaria 130.1 125.6 3.6 125.6 3.6 0.0
Croatia 108.0 88.3 22.4 98.6 9.6 10.3
Belarus 181.3 151.5 19.6 157.4 15.2 5.9
Slovenia 40.6 52.8 – 23.2 52.8 – 23.2 0.0
Republic of Serbia 38.4 38.8 – 1.2 38.8 – 1.2 0.0
Republic of Macedonia 30.1 26.1 15.0 26.1 15.0 0.0
Corporate & other, eliminations – 45.3 – 28.6 – 58.5 – 28.6 – 58.5 0.0
Total EBITDA 1,397.3 1,354.3 3.2 1,370.4 2.0 16.1

A1 Telekom Austria Group 35
Depreciation and Amortisation
in EUR million 1-12 M 2017
reported 1-12 M 2016
reported % change 1-12 M 2016
proforma % change proforma
Absolute change
(proforma – reported)
Austria 472.2 493.0 – 4.2 493.0 – 4.2 0.0
Bulgaria 215.7 110.2 95.8 110.2 95.8 0.0
Croatia 95.6 78.8 21.2 83.5 14.4 4.7
Belarus 58.2 63.7 – 8.7 65.7 – 11.3 1.9
Slovenia 30.1 32.7 – 8.0 32.7 – 8.0 0.0
Republic of Serbia 45.1 46.6 – 3.2 46.6 – 3.2 0.0
Republic of Macedonia 36.0 55.7 – 35.3 55.7 – 35.3 0.0
Corporate & other, eliminations 0.5 – 15.4 n.m. – 15.4 n.m. 0.0
Total D&A 953.4 865.3 10.2 871.9 9.4 6.6
EBIT
in EUR million 1-12 M 2017
reported 1-12 M 2016
reported % change 1-12 M 2016
proforma % change proforma
Absolute change
(proforma – reported)
Austria 442.1 404.4 9.3 404.4 9.3 0.0
Bulgaria – 85.6 15.4 n.m. 15.4 n.m. 0.0
Croatia 12.4 9.4 32.1 15.0 – 17.2 5.6
Belarus 123.1 87.8 40.2 91.7 34.1 3.9
Slovenia 10.5 20.1 – 47.8 20.1 – 47.8 0.0
Republic of Serbia – 6.8 – 7.8 13.1 – 7.8 13.1 0.0
Republic of Macedonia – 6.0 – 29.5 79.7 – 29.5 79.7 0.0
Corporate & other, eliminations – 45.8 – 13.2 – 248.0 – 13.2 – 248.0 0.0
Total EBIT 443.9 486.7 – 8.8 496.2 – 10.5 9.5
Capital Expenditures*)
in EUR million 1-12 M 2017
reported 1-12 M 2016
reported % change 1-12 M 2016
proforma % change proforma
Absolute change
(proforma – reported)
Austria 435.5 460.3 – 5.4 460.3 – 5.4 0.0
Bulgaria 81.3 73.0 11.3 73.0 11.3 0.0
Croatia 84.7 76.3 11.0 81.0 4.6 4.7
Belarus 47.1 73.7 – 36.1 73.8 – 36.2 0.1
Slovenia 41.8 26.8 56.2 26.8 56.2 0.0
Republic of Serbia 35.1 25.9 35.7 25.9 35.7 0.0
Republic of Macedonia 21.3 35.4 – 39.8 35.4 – 39.8 0.0
Corporate & other, eliminations – 10.0 – 7.2 – 37.5 – 7.2 – 37.5 0.0
Total capital expenditures 736.9 764.1 – 3.6 768.9 – 4.2 4.8 *) Additions to property, plant and equipment and intangible assets, excluding asset retirement obligations

36 Results for the Full Year 2017
Capital Expenditures – Tangible
in EUR million 1-12 M 2017
reported 1-12 M 2016
reported % change
Austria 361.2 391.3 – 7.7
Bulgaria 53.8 52.6 2.3
Croatia 69.3 67.2 3.1
Belarus 37.9 65.8 – 42.4
Slovenia 19.3 20.2 – 4.5
Republic of Serbia 26.0 19.2 35.2
Republic of Macedonia 17.9 30.9 – 42.3
Corporate & other, eliminations – 6.0 – 6.9 11.9
Total capital expenditures – tangible 579.3 640.4 – 9.5
Capital Expenditures – Intangible
in EUR million 1-12 M 2017
reported 1-12 M 2016
reported % change
Austria 74.3 68.9 7.9
Bulgaria 27.5 20.4 34.3
Croatia 15.4 9.1 68.8
Belarus 9.1 7.8 16.4
Slovenia 22.5 6.6 241.8
Republic of Serbia 9.1 6.6 37.3
Republic of Macedonia 3.5 4.5 – 22.7
Corporate & other, eliminations – 3.9 – 0.4 n.m.
Total capital expenditures – intangible 157.6 123.7 27.4
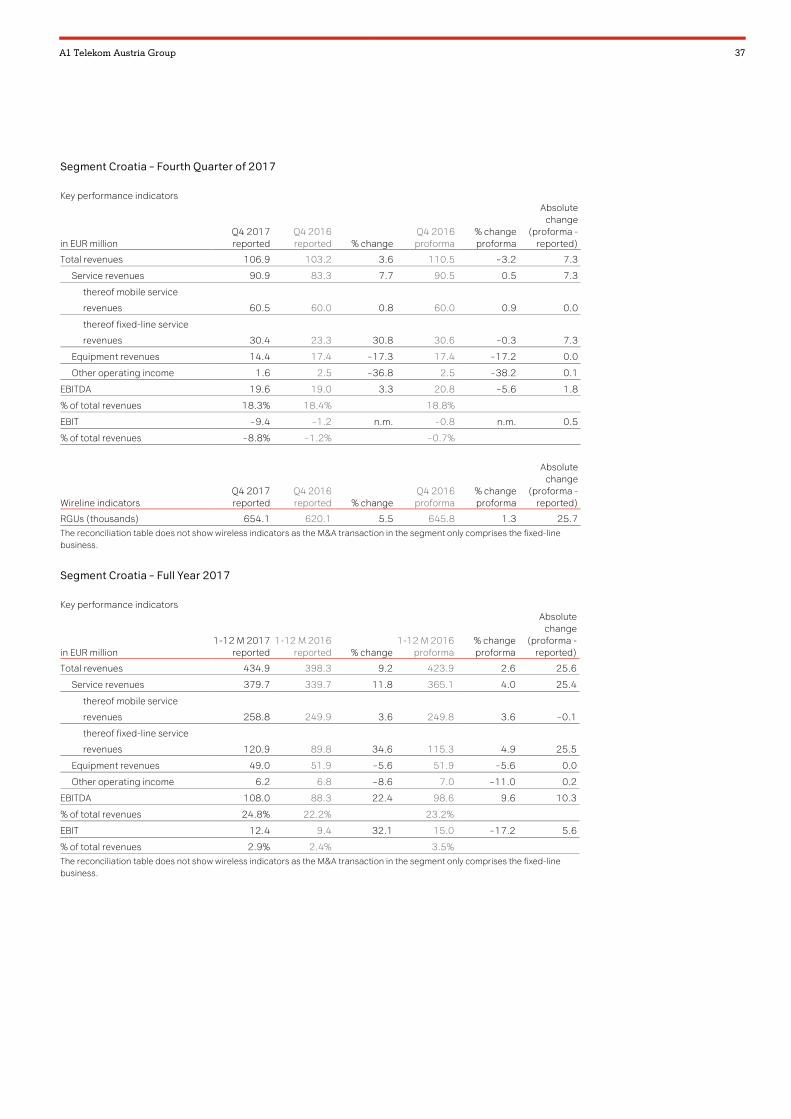
A1 Telekom Austria Group 37
Segment Croatia – Fourth Quarter of 2017
Key performance indicators
in EUR million Q4 2017 reported
Q4 2016 reported % change
Q4 2016 proforma
% change proforma
Absolute change
(proforma - reported)
Total revenues 106.9 103.2 3.6 110.5 – 3.2 7.3
Service revenues 90.9 83.3 7.7 90.5 0.5 7.3
thereof mobile service
revenues 60.5 60.0 0.8 60.0 0.9 0.0
thereof fixed-line service
revenues 30.4 23.3 30.8 30.6 – 0.3 7.3
Equipment revenues 14.4 17.4 – 17.3 17.4 – 17.2 0.0
Other operating income 1.6 2.5 – 36.8 2.5 – 38.2 0.1
EBITDA 19.6 19.0 3.3 20.8 – 5.6 1.8
% of total revenues 18.3% 18.4% 18.8%
EBIT – 9.4 – 1.2 n.m. – 0.8 n.m. 0.5
% of total revenues – 8.8% – 1.2% – 0.7%
Wireline indicators Q4 2017 reported
Q4 2016 reported % change
Q4 2016 proforma
% change proforma
Absolute change
(proforma - reported)
RGUs (thousands) 654.1 620.1 5.5 645.8 1.3 25.7 The reconciliation table does not show wireless indicators as the M&A transaction in the segment only comprises the fixed-line business.
Segment Croatia – Full Year 2017
Key performance indicators
in EUR million 1-12 M 2017
reported 1-12 M 2016
reported % change 1-12 M 2016
proforma % change proforma
Absolute change
(proforma - reported)
Total revenues 434.9 398.3 9.2 423.9 2.6 25.6
Service revenues 379.7 339.7 11.8 365.1 4.0 25.4
thereof mobile service
revenues 258.8 249.9 3.6 249.8 3.6 – 0.1
thereof fixed-line service
revenues 120.9 89.8 34.6 115.3 4.9 25.5
Equipment revenues 49.0 51.9 – 5.6 51.9 – 5.6 0.0
Other operating income 6.2 6.8 – 8.6 7.0 – 11.0 0.2
EBITDA 108.0 88.3 22.4 98.6 9.6 10.3
% of total revenues 24.8% 22.2% 23.2%
EBIT 12.4 9.4 32.1 15.0 – 17.2 5.6
% of total revenues 2.9% 2.4% 3.5% The reconciliation table does not show wireless indicators as the M&A transaction in the segment only comprises the fixed-line business.

38 Results for the Full Year 2017
Segment Belarus – Fourth Quarter of 2017
Key performance indicators
in EUR million Q4 2017 reported
Q4 2016 reported % change
Q4 2016 proforma
% change proforma
Absolute change
(proforma - reported)
Total revenues 95.9 90.6 5.8 96.0 – 0.1 5.3
Service revenues 72.1 72.2 – 0.1 76.2 –5.4 4.0
thereof mobile service
revenues 63.7 67.8 – 6.0 67.8 – 6.0 0.0
thereof fixed-line service
revenues 8.4 4.4 90.9 8.4 – 0.5 4.0
Equipment revenues 21.7 16.4 32.7 16.4 32.7 0.0
Other operating income 2.1 2.1 – 0.5 3.4 – 38.5 1.3
EBITDA 36.5 40.6 – 10.2 42.4 – 14.0 1.8
% of total revenues 38.0% 44.8% 44.2%
EBIT 14.9 26.9 – 44.8 28.2 – 47.3 1.3
% of total revenues 15.5% 29.7% 29.4%
Wireline indicators Q4 2017 reported
Q4 2016 reported % change
Q4 2016 proforma
% change proforma
Absolute change
(proforma - reported)
RGUs (thousands) 463.4 279.4 65.9 429.3 8.0 149.9 The reconciliation table does not show wireless indicators as the M&A transaction in the segment only comprises the fixed-line business.
Segment Belarus – Full Year 2017
Key performance indicators
in EUR million
1-12 M 2017
reported 1-12 M 2016
reported % change 1-12 M 2016
proforma % change proforma
Absolute change
(proforma - reported)
Total revenues 390.5 321.0 21.6 338.8 15.2 17.9
Service revenues 303.7 254.5 19.3 270.5 12.3 16.0
thereof mobile service
revenues 273.1 242.5 12.6 242.5 12.6 0.0
thereof fixed-line service
revenues 30.6 12.0 154.9 28.0 9.5 16.0
Equipment revenues 71.5 58.4 22.4 58.4 22.4 0.0
Other operating income 15.2 8.0 89.4 9.9 53.2 1.9
EBITDA 181.3 151.5 19.6 157.4 15.2 5.9
% of total revenues 46.4% 47.2% 46.4%
EBIT 123.1 87.8 40.2 91.7 34.1 3.9
% of total revenues 31.5% 27.4% 27.1% The reconciliation table does not show wireless indicators as the M&A transaction in the segment only comprises the fixed-line business.
Top Related