


Languages
Pages
Legal


JANUARY 30, 2020
RESOLUTE FOREST
PRODUCTS
Q4 2019 RESULTS

JANUARY 30, 2020 2RFP Q4 2019 RESULTS
CAUTIONARY STATEMENTS REGARDING
FORWARD-LOOKING INFORMATIONStatements in this presentation that are not reported financial results or other historical information of Resolute Forest Products Inc. (with itssubsidiaries, “we,” “our,” “us” or the company”) are "forward-looking statements" within the meaning of the Private Securities Litigation Reform Actof 1995. They include, for example, statements made in the Outlook slide of this presentation and statements relating to our: efforts and initiatives toreduce costs and increase revenues and profitability; business and operating outlook; future pension obligations; assessment of market conditions;growth strategies and prospects, and the growth potential of the Company and the industry in which we operate; liquidity; future cash flows,including as a result of the changes to our pension funding obligations; expectations on the closing of the pending acquisition and related benefits;and strategies for achieving our goals generally. Forward-looking statements may be identified by the use of forward-looking terminology such asthe words “should,” “would,” “could,” “will,” “may,” “expect,” “believe,” “see,” “anticipate,” “continue,” “attempt,” “project,” “progress,” “build,” “plan,”“grow” and other terms with similar meaning indicating possible future events or potential impact on our business or our shareholders.
The reader is cautioned not to place undue reliance on these forward-looking statements, which are not guarantees of future performance. Thesestatements are based on management's current assumptions, beliefs, and expectations, all of which involve a number of business risks anduncertainties that could cause actual results to differ materially. The potential risks and uncertainties that could cause our actual future financialcondition, results of operations, and performance to differ materially from those expressed or implied in this presentation include, but are not limitedto, the impact of: developments in non-print media, and the effectiveness of our responses to these developments; intense competition in the forestproducts industry; any inability to offer products certified to globally recognized forestry management and chain of custody standards; any inability tosuccessfully implement our strategies to increase our earnings power; the possible failure to successfully integrate acquired businesses with ours orto realize the anticipated benefits of acquisitions, such as our entry into tissue production and sales, or divestitures or other strategic transactions orprojects; uncertainty or changes in political or economic conditions in the United States, Canada or other countries in which we sell our products;global economic conditions; the highly cyclical nature of the forest products industry; any difficulties in obtaining timber or wood fiber at favorableprices, or at all; changes in the cost of purchased energy and other raw materials; physical and financial risks associated with global, regional, andlocal weather conditions, and climate change; any disruption in operations or increased labor costs due to labor disputes; difficulties in ouremployee relations or retention; disruptions to our supply chain, operations, or the delivery of our products; disruptions to our information technologysystems including cybersecurity incidents; risks related to the operation and transition of legacy system applications; negative publicity, even ifunjustified; currency fluctuations; any increase in the level of required contributions to our pension plans, including as a result of any increase in theamount by which they are underfunded; our ability to maintain adequate capital resources to provide for all of our substantial capital requirements;the terms of our outstanding indebtedness, which could restrict our current and future operations; losses that are not covered by insurance; anyadditional closure costs and long-lived asset impairment or accelerated depreciation charges; any need to record additional valuation allowancesagainst our recorded deferred income tax assets; our exports from one country to another country becoming or remaining subject to duties, cashdeposit requirements, border taxes, quotas, or other trade remedies or restrictions; countervailing and anti-dumping duties on imports to the U.S. ofsubstantially all of our softwood lumber products produced at our Canadian sawmills; any failure to comply with laws or regulations generally; anyadditional environmental or health and safety liabilities; any violation of trade laws, export controls, or other laws relating to our international salesand operations; adverse outcomes of legal proceedings, claims and governmental inquiries, investigations, and other disputes in which we areinvolved; the actions of holders of a significant percentage of our common stock; and the potential risks and uncertainties described under theheading "Risk Factors" in Part I, Item 1A of the Company's annual report on Form 10-K for the year ended December 31, 2018.
All forward-looking statements in this presentation are expressly qualified by the cautionary statements contained or referred to above and in theCompany's other filings with the U.S. Securities and Exchange Commission and the Canadian securities regulatory authorities. The Companydisclaims any obligation to publicly update or revise any forward-looking information, whether as a result of new information, future events orotherwise, except as required by law.
All figures in US$ unless otherwise noted

• Q4 GAAP net loss of $71 million / $47 million for 2019
• Q4 adjusted EBITDA of $4 million / $213 million for 2019
• Acquisition of three U.S. South sawmills expected to
close soon
• Repurchased 3 million shares in Q4 / 5 million in 2019
• Year-end liquidity at $583 million
JANUARY 30, 2020 3RFP Q4 2019 RESULTS
Q4 2019 FINANCIAL HIGHLIGHTS
Adjusted EBITDA is a non-GAAP financial measure. Refer to Appendices A and B for a definition and reconciliation of non-GAAP financial measures.

JANUARY 30, 2020 4RFP Q4 2019 RESULTS
Q4 2019 OVERVIEWAdjusted EBITDA : Q4’19 vs. Q3’19
• Lower sales price: newsprint ↓ 5%; specialty papers ↓ 4%; pulp ↓ 4%; offset by wood ↑ 6%
• Costs: lower maintenance costs
Adjusted EBITDA is a non-GAAP financial measure. Refer to Appendices A and B for a definition and reconciliation of non-GAAP financial measures.
23
4
Q3 2019 FX Sales price Volume Costs SG&A Freight Q4 2019
8
(1)
(17)(3)
(2)
(4)
23
4
Q3 2019 Market pulp Tissue Woodproducts
Newsprint Specialtypapers
Corporate Q4 2019
(5)
(7)(4)
(6)
3

105
4
Q4 2018 Market pulp Tissue Woodproducts
Newsprint Specialtypapers
Corporate Q4 2019
(58)
3
(38)
(18)
9
1
JANUARY 30, 2020 5RFP Q4 2019 RESULTS
Q4 2019 OVERVIEWAdjusted EBITDA : Q4’19 vs. Q4’18
Adjusted EBITDA is a non-GAAP financial measure. Refer to Appendices A and B for a definition and reconciliation of non-GAAP financial measures.
• Divestitures: sale of Catawba and Fairmont facilities in Q4 2018
• Lower selling price: pulp ↓ 26%; newsprint ↓ 14%; specialty papers ↓ 7%
• Costs: lower input costs, due in part to the idling of Augusta
• SG&A: lower variable compensation expense
105
4
Q4 2018 Divestitures FX Sales price Volume Costs SG&A Freight Q4 2019
(98) (3)
9
3
57
(24)

574
213
2018 Market pulp Tissue Wood products Newsprint Specialtypapers
Corporate 2019
•
(173)
(62) (11)5
17
(137)
JANUARY 30, 2020 6RFP Q4 2019 RESULTS
2019 OVERVIEWAdjusted EBITDA : 2019 vs. 2018
Adjusted EBITDA is a non-GAAP financial measure. Refer to Appendices A and B for a definition and reconciliation of non-GAAP financial measures.
• Divestitures: sale of Catawba and Fairmont facilities in Q4 2018
• Lower selling price: wood ↓ 20%; pulp ↓ 9%
• Costs: higher fiber costs and additional maintenance
• SG&A: lower variable compensation expense
574
213
2018 Divestitures FX Sales price Volume Costs SG&A Freight CalhounTissue
2019
43
28
(240)
11
(27)
(128)(2)
(46)

JANUARY 30, 2020 7RFP Q4 2019 RESULTS
U.S. SAWMILL ACQUISITIONS
Acquisition of three U.S. sawmills:
• Agreement to purchase for $163 million, plus working capital
• Closing expected in the first quarter
Benefits:
• Attractive valuation
• Combined production capacity of 550 mmbf
• Immediate scale in the attractive U.S. South
• Grows total footprint by 25% (at capacity), in a rich fiber basket
• Opportunity to create value with operational expertise in sawmilling
• Leverage scale to achieve synergies in fiber procurement, corporate
procurement, corporate functions, etc.
• Tax efficient transaction

JANUARY 30, 2020 8RFP Q4 2019 RESULTS
MARKET PULP
1. EBITDA is a non-GAAP financial measure. Refer to Appendices A and B for a definition and reconciliation of non-GAAP financial measures.
2. Divestitures in Q4 2018: Catawba mill (approx. 230,000 mt annual capacity) and Fairmont mill (net impact of approx. 80,000 mt of shipments annually).
3. For the 11 months ended November 30, 2019 vs. November 30, 2018.
4. The “all-in” cash cost is the total cost, excluding depreciation and amortization, of each ton shipped (cost of sales, distribution costs, and selling, general and administrative
expenses).
91
108116
80 78
110
7468
Q1 2018 Q2 2018 Q3 2018 Q4 2018 Q1 2019 Q2 2019 Q3 2019 Q4 2019
Inventory (000's mt)
World shipments of chemical pulp vs.
20183
– Hardwood unchanged
– Softwood ↑ 6%
Q4 transaction price ↓ $24/mt vs. Q3
Q4 shipments ↓ 27k mt vs. Q3
Q4 cash cost4 marginally lower vs. Q3
Finished goods inventory ↓ 6k mt vs. Q3
293
601
200
300
400
500
600
700
800
900
200
250
300
350
400
450
500
550
Q1 2018 Q2 2018 Q3 2018 Q4 2018 Q1 2019 Q2 2019 Q3 2019 Q4 2019
$/m
t
00
0's
mt
shipments average transaction price (right-hand scale)2 2
2
(US$mm) Q4 2019 Q3 2019 2019 2018
Sales 176 201 797 1,085
Operating (loss) income (18) (12) 39 172
EBITDA1 (12) (5) 62 199
Shipments (000’s mt) 293 320 1,156 1,424

JANUARY 30, 2020 9RFP Q4 2019 RESULTS
TISSUE
1. EBITDA is a non-GAAP financial measure. Refer to Appendices A and B for a definition and reconciliation of non-GAAP financial measures.
2. Includes Calhoun since Q2 2018.
3. For the 11 months ended November 30, 2019 vs November 30, 2018.
23
1,743
1,000
1,100
1,200
1,300
1,400
1,500
1,600
1,700
1,800
0
5
10
15
20
25
30
35
40
Q1 2018 Q2 2018 Q3 2018 Q4 2018 Q1 2019 Q2 2019 Q3 2019 Q4 2019
$/s
t
00
0's
st
shipments average transaction price (right-hand scale)
U.S. consumption ↑ 2.7% vs. 20183
‒ Away-from-home shipments ↑ 3%
‒ At-home shipments ↑ 2%
Q4 transaction price ↑ $2/st vs. Q3
Q4 cash cost ↓ $132/st vs. Q3
Positive EBITDA in 2019
2
11
87
57 7
6 8
Q1 2018 Q2 2018 Q3 2018 Q4 2018 Q1 2019 Q2 2019 Q3 2019 Q4 2019
Inventory (000's st)
2
(US$mm) Q4 2019 Q3 2019 2019 2018
Sales 40 43 165 130
Operating loss (1) (3) (16) (30)
EBITDA1 4 1 2 (15)
Shipments (000’s st) 23 25 97 84
JANUARY 30, 2020 10RFP Q4 2019 RESULTS
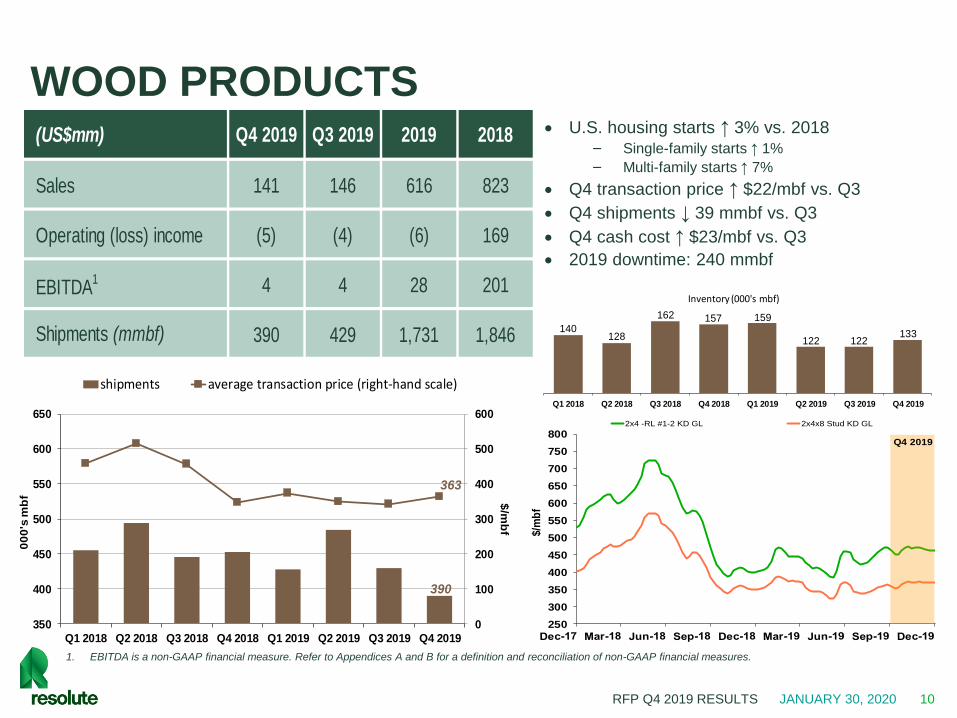
WOOD PRODUCTS
1. EBITDA is a non-GAAP financial measure. Refer to Appendices A and B for a definition and reconciliation of non-GAAP financial measures.
390
363
0
100
200
300
400
500
600
350
400
450
500
550
600
650
Q1 2018 Q2 2018 Q3 2018 Q4 2018 Q1 2019 Q2 2019 Q3 2019 Q4 2019
$/m
bf
00
0's
mb
f
shipments average transaction price (right-hand scale)
140128
162 157 159
122 122133
Q1 2018 Q2 2018 Q3 2018 Q4 2018 Q1 2019 Q2 2019 Q3 2019 Q4 2019
Inventory (000's mbf)
250
300
350
400
450
500
550
600
650
700
750
800
$/m
bf
2x4 -RL #1-2 KD GL 2x4x8 Stud KD GL
Q4 2019
U.S. housing starts ↑ 3% vs. 2018‒ Single-family starts ↑ 1%
‒ Multi-family starts ↑ 7%
Q4 transaction price ↑ $22/mbf vs. Q3
Q4 shipments ↓ 39 mmbf vs. Q3
Q4 cash cost ↑ $23/mbf vs. Q3
2019 downtime: 240 mmbf
(US$mm) Q4 2019 Q3 2019 2019 2018
Sales 141 146 616 823
Operating (loss) income (5) (4) (6) 169
EBITDA1 4 4 28 201
Shipments (mmbf) 390 429 1,731 1,846

JANUARY 30, 2020 11RFP Q4 2019 RESULTS
NEWSPRINT
1. EBITDA is a non-GAAP financial measure. Refer to Appendices A and B for a definition and reconciliation of non-GAAP financial measures.
2. For the 11 months ended November 30, 2019 vs. November 30, 2018.
9385
96101
135
105 104 105
Q1 2018 Q2 2018 Q3 2018 Q4 2018 Q1 2019 Q2 2019 Q3 2019 Q4 2019
Inventory (000's mt)
316
543
350
400
450
500
550
600
650
200
300
400
500
600
700
800
Q1 2018 Q2 2018 Q3 2018 Q4 2018 Q1 2019 Q2 2019 Q3 2019 Q4 2019
$/m
t
00
0's
mt
shipments average transaction price (right-hand scale)
North America:‒ Demand ↓ 14% vs. 2018
Publishers ↓ 17%
Commercial printers ↓ 9%
‒ Shipment-to-capacity ratio of 84%
World2:‒ Demand ↓ 13% vs. 2018
‒ Shipment-to-capacity ratio of 81%
Q4 transaction price ↓ $30/mt vs. Q3
Q4 shipments ↑ 2k mt vs. Q3
Q4 cash cost ↓ $15/mt vs. Q3
(US$mm) Q4 2019 Q3 2019 2019 2018
Sales 172 180 773 907
Operating income - 4 49 74
EBITDA1 7 11 78 140
Shipments (000’s mt) 316 314 1,315 1,507

JANUARY 30, 2020 12RFP Q4 2019 RESULTS
SPECIALTY PAPERS
1. EBITDA is a non-GAAP financial measure. Refer to Appendices A and B for a definition and reconciliation of non-GAAP financial measures.
2. Divestiture at the end of Q4 2018: Catawba mill (approx. 350,000 st annual capacity).
3. Supercalendered.
68 7078
54 54 5549
40
Q1 2018 Q2 2018 Q3 2018 Q4 2018 Q1 2019 Q2 2019 Q3 2019 Q4 2019
Inventory (000's st)
197
702
400
450
500
550
600
650
700
750
800
100
150
200
250
300
350
400
450
500
Q1 2018 Q2 2018 Q3 2018 Q4 2018 Q1 2019 Q2 2019 Q3 2019 Q4 2019
$/s
t00
0's
st
shipments average transaction price (right-hand scale)
North American uncoated mechanical
grades demand ↓ 16% vs. 2018– Standard papers ↓ 21%; SC3 ↓ 11%
– Shipment-to-capacity ratio of 82%
Q4 transaction price ↓ $30/st vs. Q3
Q4 shipments ↑ 12k st vs. Q3
Q4 cash cost ↑ $5/st vs. Q3
2 2
2
(US$mm) Q4 2019 Q3 2019 2019 2018
Sales 139 135 572 811
Operating (loss) income (1) 4 33 40
EBITDA1 10 15 76 87
Shipments (000’s st) 197 185 774 1,130
1. Excluding special items. Refer to Appendices A and B for a definition and reconciliation of non-GAAP financial measures.
2. Adjusted EBITDA is a non-GAAP financial measure. Refer to Appendices A and B for a definition and reconciliation of non-GAAP financial measures.
3. Other postretirement benefit.
4. Includes impact of divestitures of Catawba and Fairmont mills in 2018.
JANUARY 30, 2020 13RFP Q4 2019 RESULTS
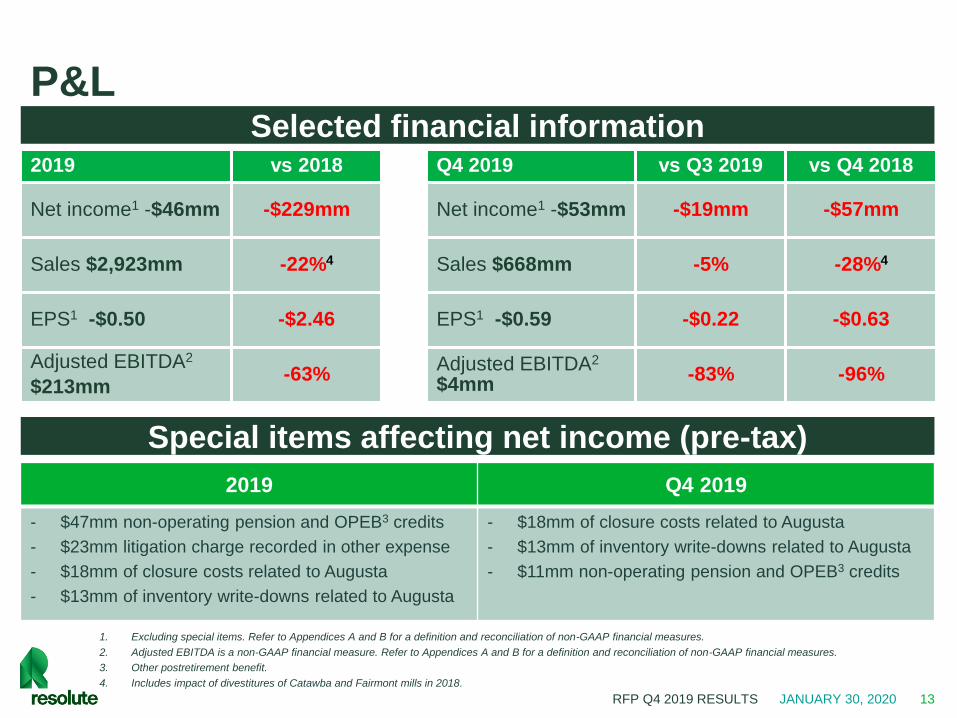
P&LSelected financial information
Special items affecting net income (pre-tax)
2019 Q4 2019
- $47mm non-operating pension and OPEB3 credits
- $23mm litigation charge recorded in other expense
- $18mm of closure costs related to Augusta
- $13mm of inventory write-downs related to Augusta
- $18mm of closure costs related to Augusta
- $13mm of inventory write-downs related to Augusta
- $11mm non-operating pension and OPEB3 credits
2019 vs 2018 Q4 2019 vs Q3 2019 vs Q4 2018
Net income1 -$46mm -$229mm Net income1 -$53mm -$19mm -$57mm
Sales $2,923mm -22%4 Sales $668mm -5% -28%4
EPS1 -$0.50 -$2.46 EPS1 -$0.59 -$0.22 -$0.63
Adjusted EBITDA2
$213mm-63%
Adjusted EBITDA2
$4mm-83% -96%

JANUARY 30, 2020 14RFP Q4 2019 RESULTS
PERFORMANCE METRICS« All-in » cash cost EBITDA1 per unit
1. EBITDA is a non-GAAP financial measure. Refer to Appendices A and B for a definition and reconciliation of non-GAAP financial measures.
642
354
522
652
1,578
500
750
1,000
1,250
1,500
1,750
2,000
200
300
400
500
600
700
800
Market pulp $/mt Wood products $/mbf
Newsprint $/mt Specialty papers $/st
Tissue $/st (right-hand scale)
(41)
9 21
50
165
(400)
(200)
0
200
400
600
800
1,000
1,200
(60)
(30)
0
30
60
90
120
150
180
Market pulp $/mt Wood products $/mbf
Newsprint $/mt Specialty papers $/st
Tissue $/st (right-hand scale)
EBITDA1
contribution from cogen
(US$mm)
Q1’18 Q2’18 Q3’18 Q4’18 Q1’19 Q2’19 Q3’19 Q4’19
12 11 10 4 11 8 9 8

JANUARY 30, 2020 15RFP Q4 2019 RESULTS
LIQUIDITY AND CASH FLOW
(US$mm) Q4 2019vs
Q3 2019vs
Q4 2018
Cash 3 -66 -301
Working capital3
562 +19 -4
Total debt 449 +25 -196
Interest 7 -1 -4
Available liquidity(US$mm)
2019 2018
Q4 Q3 Q2 Q1 Q4 Q3 Q2 Q1
Total debt 449 424 423 423 645 645 675 779
Cash on hand 3 69 98 69 304 72 6 13
Available under revolving credit facilities 580 497 492 526 517 582 511 439
• Q4 net cash used by operations of $35mm
• 2019 capex of $113mm
• Cumulative lumber cash duty deposits of
$162mm
• $24mm of share repurchases in 2019
• Available liquidity of $583mm
• Net debt to adjusted LTM1 EBITDA2 ratio at 2.1x
• Extended and increased senior secured credit
facility by an additional $175mm in Q4
1. Last twelve months.
2. EBITDA is a non-GAAP financial measure. Refer to Appendices A and B for a definition and reconciliation of non-GAAP financial measures.
3. Excludes in Q4 2018 $1mm of supercalendered paper and $6mm of uncoated groundwood paper cash countervailing duty deposits receivable.

JANUARY 30, 2020 16RFP Q4 2019 RESULTS
PENSION
(US$mm) 2019 2018 2017
Net pension liabilities 1,326 1,122 1,097
OPEB liabilities 147 148 172
Net pension and OPEB liabilities 1,473 1,270 1,269
U.S. GAAP discount rate at 12/311 3.0% 3.8% 3.6%
Pension plans deficit for funding purposes2 497 550 562
• Net pension & OPEB liability ↑ $203mm in Q4 vs. 2018 • Decrease in the applicable discount rates and unfavorable currency exchange, offset by ongoing pension contributions
(US$mm) 2020E 2019 2018 2017
Pension contributions3 112 99 121 132
OPEB payments 13 12 13 11
Operating pension and OPEB costs3 34 33 40 41
Non-op. pension and OPEB (credits)/costs4 8 (47) (50) (7)
Total pension and OPEB (credits)/costs3 42 (14) (10) 34
1. Pension plans.
2. Funding for pension plans in Quebec is determined on a going concern basis; in Ontario, also on a going-concern basis since 2018 as we exited special funding regulations on
December 31, 2018, and on a solvency basis for 2017; and in the U.S. on a 25-year average interest rate basis.
3. Includes defined benefit and defined contribution plans.
4. Excluded from adjusted EBITDA.

JANUARY 30, 2020 17RFP Q4 2019 RESULTS
PENSION2019 Pension Plans Deficit
Accounting
Basis
Funding
Purposes2 Variance
Net pension
liabilities
(US$mm)
1,326 497 829
Funded ratio (%) 74% 88%
Discount rate (%) 3.0% 5.6%
Assumptions used for 2020
Discount rate: going concern 5.6%
Canadian dollar US$ 0.7780
90
100
110
120
130
140
2017 2018 2019 2020
Mill
ion
s o
f U
SD
Actual/estimate
Total Pension Contributions
1
1. The assumptions for 2020 estimated total pension contributions can be found in the table “Assumptions used for 2020” above
which includes defined benefit and defined contribution plans.
2. Funding for pension plans in Quebec are on a going concern basis; in Ontario, also on going-concern basis as we exited special
funding regulations on December 31, 2018; and in the U.S. on a 25-year average interest rate basis.

JANUARY 30, 2020 18RFP Q4 2019 RESULTS
2020 PRIORITIES
Safety & people
• 2019 = 2nd consecutive year below 0.5 OSHA incident rate
• Continue to build on world-class safety performance
• Support initiatives around workforce attraction and retention
Sawmill
acquisitions• Integrate U.S. sawmill assets quickly and efficiently
Tissue• Customer portfolio optimization initiatives to improve margins
• Close the converting gap to improve product mix
Costs• Maximize operational performance and value generation from
existing assets
Business
transformation
• Focus on acquisitions and organic opportunities
• Construction of cellulose filament plant in Kenogami

JANUARY 30, 2020 19RFP Q4 2019 RESULTS
OUTLOOK
Market
Pulp
• Expect to build up from bottom-of-cycle pricing
• Softwood pulp: stronger operating rates = indicators of long-term demand
growth for quality pulp
Tissue• Build on recent improvements around sales growth and productivity gains
for progressive earnings growth in 2020
Paper
• Focus on maximizing earnings power and cash generation
• Sustained pricing pressures as operating rates remain low
• Modest expectations to 2020 earnings
Wood
Products• Positive housing starts data and improving pricing environment

0
5
10
15
20
25
30
35
Q1 Q2 Q3 Q4
Lo
st p
rod
uctio
n (0
00
's m
t)
JANUARY 30, 2020 20RFP Q4 2019 RESULTS
OUTLOOK
2020 Estimate
2019 Actual
2020 Scheduled Market Pulp Outages

APPENDIX A
JANUARY 30, 2020 22RFP Q4 2019 RESULTS
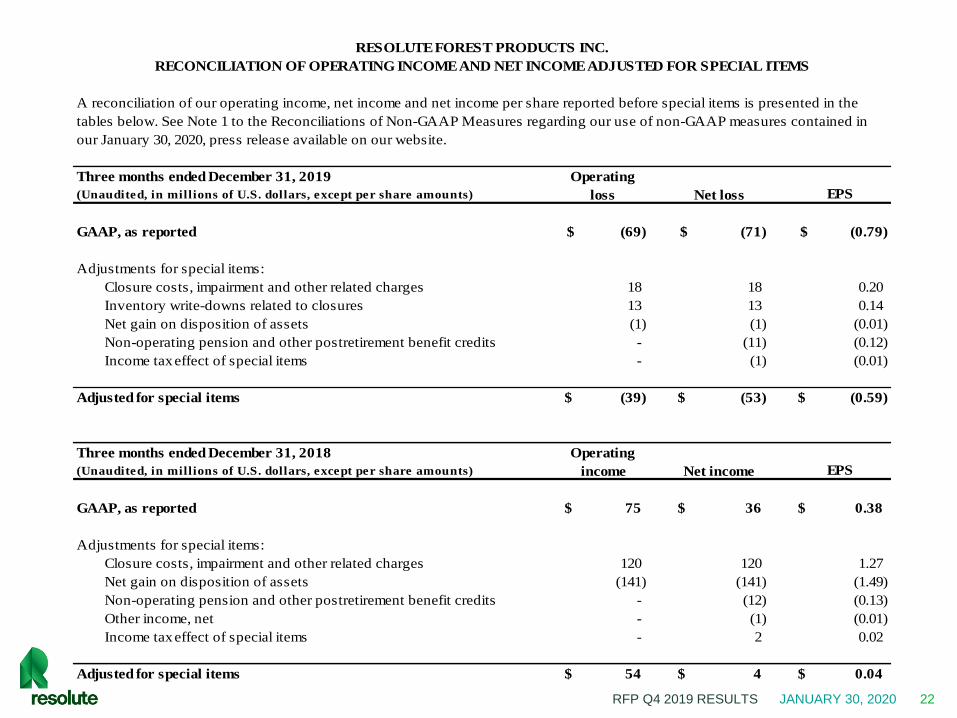
Three months ended December 31, 2019
(Unaudited, in millions of U.S. dollars, except per share amounts) EPS
GAAP, as reported (69)$ (71)$ (0.79)$
Adjustments for special items:
Closure costs, impairment and other related charges 18 18 0.20
Inventory write-downs related to closures 13 13 0.14
Net gain on disposition of assets (1) (1) (0.01)
Non-operating pension and other postretirement benefit credits - (11) (0.12)
Income tax effect of special items - (1) (0.01)
Adjusted for special items (39)$ (53)$ (0.59)$
Three months ended December 31, 2018
(Unaudited, in millions of U.S. dollars, except per share amounts) EPS
GAAP, as reported 75$ 36$ 0.38$
Adjustments for special items:
Closure costs, impairment and other related charges 120 120 1.27
Net gain on disposition of assets (141) (141) (1.49)
Non-operating pension and other postretirement benefit credits - (12) (0.13)
Other income, net - (1) (0.01)
Income tax effect of special items - 2 0.02
Adjusted for special items 54$ 4$ 0.04$
RESOLUTE FOREST PRODUCTS INC.
RECONCILIATION OF OPERATING INCOME AND NET INCOME ADJUSTED FOR SPECIAL ITEMS
Net income
Operating
income
Operating
loss Net loss
A reconciliation of our operating income, net income and net income per share reported before special items is presented in the
tables below. See Note 1 to the Reconciliations of Non-GAAP Measures regarding our use of non-GAAP measures contained in
our January 30, 2020, press release available on our website.

JANUARY 30, 2020 23RFP Q4 2019 RESULTS
Year ended December 31, 2019
(Unaudited, in millions of U.S. dollars, except per share amounts) EPS
GAAP, as reported 17$ (47)$ (0.51)$
Adjustments for special items:
Closure costs, impairment and other related charges 18 18 0.19
Inventory write-downs related to closures 13 13 0.14
Net gain on disposition of assets (2) (2) (0.02)
Non-operating pension and other postretirement benefit credits - (47) (0.51)
Other expense, net - 22 0.24
Income tax effect of special items - (3) (0.03)
Adjusted for special items 46$ (46)$ (0.50)$
Year ended December 31, 2018
(Unaudited, in millions of U.S. dollars, except per share amounts) EPS
GAAP, as reported 379$ 235$ 2.52$
Adjustments for special items:
Closure costs, impairment and other related charges 121 121 1.30
Inventory write-downs related to closures (1) (1) (0.01)
Start-up costs 8 8 0.09
Net gain on disposition of assets (145) (145) (1.55)
Non-operating pension and other postretirement benefit credits - (50) (0.54)
Other income, net - (5) (0.06)
Income tax effect of special items - 20 0.21
Adjusted for special items 362$ 183$ 1.96$
Operating
income Net income
Operating
income Net loss

JANUARY 30, 2020 24RFP Q4 2019 RESULTS
Three months ended December 31, 2019
(Unaudited, in millions of U.S. dollars) Market pulp Tissue (2)
Wood products Newsprint
Specialty
papers
Corporate and
other Total
Net loss including noncontrolling interests (18)$ (1)$ (5)$ -$ (1)$ (46)$ (71)$
Interest expense 7 7
Income tax provision 6 6
Depreciation and amortization 6 5 9 7 11 5 43
EBITDA (12)$ 4$ 4$ 7$ 10$ (28)$ (15)$
Closure costs, impairment and other related charges 18 18
Inventory write-downs related to closures 13 13
Net gain on disposition of assets (1) (1)
Non-operating pension and other postretirement benefit credits (11) (11)
Adjusted EBITDA (12)$ 4$ 4$ 7$ 10$ (9)$ 4$
Three months ended December 31, 2018
(Unaudited, in millions of U.S. dollars) Market pulp Tissue (2)
Wood products Newsprint
Specialty
papers
Corporate and
other Total
Net income (loss) including noncontrolling interests 41$ (9)$ (8)$ 28$ 17$ (33)$ 36$
Interest expense 11 11
Income tax provision 41 41
Depreciation and amortization 5 4 9 17 11 5 51
EBITDA 46$ (5)$ 1$ 45$ 28$ 24$ 139$
Closure costs, impairment and other related charges 120 120
Net gain on disposition of assets (141) (141)
Non-operating pension and other postretirement benefit credits (12) (12)
Other income, net (1) (1)
Adjusted EBITDA 46$ (5)$ 1$ 45$ 28$ (10)$ 105$
RESOLUTE FOREST PRODUCTS INC.
RECONCILIATION OF EBITDA AND ADJUSTED EBITDA
A reconciliation of our net income including noncontrolling interests to EBITDA and Adjusted EBITDA is presented in the tables below. See Note 1 to the Reconciliations of Non-GAAP
Measures regarding our use of the non-GAAP measures EBITDA and Adjusted EBITDA contained in our January 30, 2020, press release available on our website.

JANUARY 30, 2020 25RFP Q4 2019 RESULTS
Year ended December 31, 2019
(Unaudited, in millions of U.S. dollars) Market pulp Tissue (2)
Wood products Newsprint
Specialty
papers
Corporate and
other Total
Net income (loss) including noncontrolling interests 39$ (16)$ (6)$ 49$ 33$ (146)$ (47)$
Interest expense 31 31
Income tax provision 58 58
Depreciation and amortization 23 18 34 29 43 20 167
EBITDA 62$ 2$ 28$ 78$ 76$ (37)$ 209$
Closure costs, impairment and other related charges 18 18
Inventory write-downs related to closures 13 13
Net gain on disposition of assets (2) (2)
Non-operating pension and other postretirement benefit credits (47) (47)
Other expense, net 22 22
Adjusted EBITDA 62$ 2$ 28$ 78$ 76$ (33)$ 213$
Year ended December 31, 2018
(Unaudited, in millions of U.S. dollars) Market pulp Tissue (2)
Wood products Newsprint
Specialty
papers
Corporate and
other Total
Net income (loss) including noncontrolling interests 172$ (30)$ 169$ 74$ 40$ (190)$ 235$
Interest expense 47 47
Income tax provision 152 152
Depreciation and amortization 27 15 32 66 47 25 212
EBITDA 199$ (15)$ 201$ 140$ 87$ 34$ 646$
Closure costs, impairment and other related charges 121 121
Inventory write-downs related to closures (1) (1)
Start-up costs 8 8
Net gain on disposition of assets (145) (145)
Non-operating pension and other postretirement benefit credits (50) (50)
Other income, net (5) (5)
Adjusted EBITDA 199$ (15)$ 201$ 140$ 87$ (38)$ 574$
2. The operating results of our Calhoun (Tennessee) tissue operations have been recorded in our tissue segment since April 1, 2018.

APPENDIX B

JANUARY 30, 2020 27RFP Q4 2019 RESULTS
Resolute Forest Products Inc.
Financial and Operating Statistics (Page 1 of 5)
(In millions of U.S. dollars, except per share amounts and otherw ise indicated) First Second Third Fourth Total First Second Third Fourth Total checks
Income Statement Data
Sales 874$ 976$ 974$ 932$ 3,756$ 795$ 755$ 705$ 668$ 2,923$
Operating income (loss) 48 121 135 75 379 64 40 (18) (69) 17
Interest expense (13) (11) (12) (11) (47) (9) (7) (8) (7) (31)
Net income (loss) attributable to Resolute Forest Products Inc. 10 72 117 36 235 42 25 (43) (71) (47)
Diluted net income (loss) per share attributable to Resolute Forest Products Inc. common shareholders 0.11$ 0.77$ 1.25$ 0.38$ 2.52$ 0.45$ 0.27$ (0.47)$ (0.79)$ (0.51)$
Special dividend declared per common share -$ -$ -$ 1.50$ 1.50$ -$ -$ -$ -$ -$
Average diluted shares outstanding (in thousands) 92,999 93,197 93,393 94,442 93,257 93,868 93,633 90,869 89,780 91,356
Ending shares outstanding (in thousands) 90,315 90,342 90,345 90,730 90,730 91,099 90,400 89,294 86,694 86,694
Financial Position
Cash and cash equivalents 13$ 6$ 72$ 304$ 304$ 69$ 98$ 69$ 3$ 3$
Working capital (1) 626 664 749 573 573 616 596 543 562 562
Fixed assets, net 1,684 1,669 1,545 1,515 1,515 1,492 1,479 1,477 1,459 1,459
Total assets 4,122 4,025 4,145 3,935 3,935 3,802 3,752 3,671 3,626 3,626
Current portion of long-term debt 1 1 1 223 223 1 1 1 1 1
Long-term debt, net of current portion 778 674 644 422 422 422 422 423 448 448
Net debt (2) 766 669 573 341 341 354 325 355 446 446
Liquidity (3) 452 517 654 821 821 595 590 566 583 583
Total Resolute Forest Products Inc. shareholders' equity 1,615 1,691 1,809 1,534 1,534 1,579 1,599 1,551 1,234 1,234
Noncontrolling interests 1 1 1 1 1 1 1 1 1 1
Total equity 1,616 1,692 1,810 1,535 1,535 1,580 1,600 1,552 1,235 1,235
Cash Flow Information
Cash flows provided by (used in) operating activities 62$ 158$ 131$ 84$ 435$ 23$ 72$ 25$ (35)$ 85$
Cash invested in fixed assets (25) (28) (41) (61) (155) (26) (19) (37) (31) (113)
Dispositions of assets - 2 - 334 336 - 2 - 1 3
(Increase) decrease in countervailing duty cash deposits on supercalendered paper, net (5) (6) 24 35 48 1 - - - 1
Increase in countervailing and anti-dumping duty cash deposits on softwood lumber (14) (27) (21) (15) (77) (14) (19) (13) (13) (59)
(Increase) decrease in countervailing duty cash deposits on uncoated groundwood paper (2) (4) - - (6) 6 - - - 6
Cash flows (used in) provided by investing activities (46) (63) (38) 293 146 (33) (36) (50) (43) (162)
Purchases of treasury stock - - - - - - (5) (7) (12) (24)
Net (repayments) borrowings under revolving credit facilities (9) (105) (30) - (144) - - - 71 71
Payment of special dividend - - - (136) (136) - - - - -
Payments of debt - - - - - (225) - - (46) (271)
Cash flows (used in) provided by financing activities (10) (105) (30) (136) (281) (225) (7) (7) 11 (228)
2018 2019

JANUARY 30, 2020 28RFP Q4 2019 RESULTS
Resolute Forest Products Inc.
Financial and Operating Statistics (Page 2 of 5)
(In millions of U.S. dollars, except per unit items and otherw ise indicated) First Second Third Fourth Total First Second Third Fourth Total
Sales
Market pulp 257$ 264$ 288$ 276$ 1,085$ 231$ 189$ 201$ 176$ 797$
Tissue (4) 22 35 38 35 130 39 43 43 40 165
Wood products 209 254 203 157 823 161 168 146 141 616
Newsprint 198 230 232 247 907 212 209 180 172 773
Specialty papers 188 193 213 217 811 152 146 135 139 572
Total sales 874$ 976$ 974$ 932$ 3,756$ 795$ 755$ 705$ 668$ 2,923$
Shipments to Third Parties (thousands of units)
Market pulp (mt) 362 353 367 342 1,424 286 257 320 293 1,156
Tissue (st) (4) 15 23 23 23 84 24 25 25 23 97
Wood products (mbf) 455 494 445 452 1,846 428 484 429 390 1,731
Newsprint (mt) 355 393 371 388 1,507 335 350 314 316 1,315
Specialty papers (st) 279 275 289 287 1,130 199 193 185 197 774
Average Transaction Price per Unit
Market pulp ($/mt) 710$ 747$ 784$ 809$ 762$ 808$ 739$ 625$ 601$ 690$
Tissue ($/st) (4) 1,480 1,551 1,585 1,562 1,551 1,664 1,695 1,741 1,743 1,711
Wood products ($/mbf) 459 514 457 347 446 374 348 341 363 356
Newsprint ($/mt) 558 584 629 634 602 634 597 573 543 588
Specialty papers ($/st) 675 701 737 756 718 768 753 732 702 739
20192018

JANUARY 30, 2020 29RFP Q4 2019 RESULTS
Resolute Forest Products Inc.
Financial and Operating Statistics (Page 3 of 5)
(In millions of U.S. dollars, except per unit items and otherw ise indicated) First Second Third Fourth Total First Second Third Fourth Total
Operating Income (Loss)
Market pulp 33$ 41$ 57$ 41$ 172$ 42$ 27$ (12)$ (18)$ 39$
Tissue (4) (1) (10) (10) (9) (30) (8) (4) (3) (1) (16)
Wood products 53 79 45 (8) 169 6 (3) (4) (5) (6)
Newsprint (4) 18 32 28 74 28 17 4 - 49
Specialty papers (7) 4 26 17 40 15 15 4 (1) 33
Corporate and other (26) (11) (15) 6 (46) (19) (12) (7) (44) (82)
Total operating income (loss) 48$ 121$ 135$ 75$ 379$ 64$ 40$ (18)$ (69)$ 17$
Selling, General and Administrative Expenses
Market pulp 9$ 9$ 8$ 9$ 35$ 7$ 7$ 7$ 6$ 27$
Tissue (4) 1 3 4 3 11 3 3 2 2 10
Wood products 7 8 6 6 27 6 6 5 6 23
Newsprint 9 9 8 9 35 9 9 9 8 35
Specialty papers 7 6 6 5 24 5 4 4 5 18
Corporate and other 10 7 8 8 33 7 7 3 6 23
Total selling, general and administrative expenses 43$ 42$ 40$ 40$ 165$ 37$ 36$ 30$ 33$ 136$
Operating Cost per Unit
Market pulp ($/mt) 619$ 631$ 629$ 688$ 641$ 664$ 630$ 664$ 663$ 656$
Tissue ($/st) (4) 1,585 1,973 2,003 1,982 1,916 1,984 1,853 1,885 1,769 1,873
Wood products ($/mbf) 342 355 355 366 354 360 355 351 377 360
Newsprint ($/mt) 568 538 543 562 552 550 547 560 545 550
Specialty papers ($/st) 698 688 647 697 682 695 676 705 708 696
Operating Cost per Unit, Excluding Depreciation and Amortization
Market pulp ($/mt) 600$ 610$ 609$ 673$ 622$ 646$ 610$ 643$ 642$ 636$
Tissue ($/st) (4) 1,508 1,762 1,796 1,794 1,736 1,781 1,681 1,710 1,578 1,688
Wood products ($/mbf) 325 340 337 346 337 342 336 331 354 340
Newsprint ($/mt) 524 496 499 518 509 528 525 537 522 528
Specialty papers ($/st) 657 644 604 661 641 643 619 647 652 640
Product Inventory (thousands of units)
Market pulp (mt) 91 108 116 80 80 78 110 74 68 68
Tissue (st) (4) 11 8 7 5 5 7 7 6 8 8
Wood products (mbf) 140 128 162 157 157 159 122 122 133 133
Newsprint (mt) 93 85 96 101 101 135 105 104 105 105
Specialty papers (st) 68 70 78 54 54 54 55 49 40 40
2018 2019

JANUARY 30, 2020 30RFP Q4 2019 RESULTS
Resolute Forest Products Inc.
Financial and Operating Statistics (Page 4 of 5)
(In millions of U.S. dollars) First Second Third Fourth Total First Second Third Fourth Total
Net Income (Loss) Including Noncontrolling Interests
Market pulp 33$ 41$ 57$ 41$ 172$ 42$ 27$ (12)$ (18)$ 39$
Tissue (4)(1) (10) (10) (9) (30) (8) (4) (3) (1) (16)
Wood products 53 79 45 (8) 169 6 (3) (4) (5) (6)
Newsprint (4) 18 32 28 74 28 17 4 - 49
Specialty papers (7) 4 26 17 40 15 15 4 (1) 33
Corporate and other (64) (60) (33) (33) (190) (41) (27) (32) (46) (146)
Total net income (loss) including noncontrolling interests 10$ 72$ 117$ 36$ 235$ 42$ 25$ (43)$ (71)$ (47)$
Interest Expense 13$ 11$ 12$ 11$ 47$ 9$ 7$ 8$ 7$ 31$
Income Tax Provision 31$ 47$ 33$ 41$ 152$ 21$ 19$ 12$ 6$ 58$
Depreciation and Amortization
Market pulp 7$ 8$ 7$ 5$ 27$ 5$ 5$ 7$ 6$ 23$
Tissue (4) 1 5 5 4 15 5 4 4 5 18
Wood products 8 7 8 9 32 8 9 8 9 34
Newsprint 16 17 16 17 66 7 8 7 7 29
Specialty papers 12 12 12 11 47 10 11 11 11 43
Corporate and other 9 5 6 5 25 5 5 5 5 20
Total depreciation and amortization 53$ 54$ 54$ 51$ 212$ 40$ 42$ 42$ 43$ 167$
EBITDA (5)
Market pulp 40$ 49$ 64$ 46$ 199$ 47$ 32$ (5)$ (12)$ 62$
Tissue (4) - (5) (5) (5) (15) (3) - 1 4 2
Wood products 61 86 53 1 201 14 6 4 4 28
Newsprint 12 35 48 45 140 35 25 11 7 78
Specialty papers 5 16 38 28 87 25 26 15 10 76
Corporate and other (11) 3 18 24 34 (6) 4 (7) (28) (37)
Total EBITDA 107$ 184$ 216$ 139$ 646$ 112$ 93$ 19$ (15)$ 209$
Special Items (5)
Closure costs, impairment and other related charges -$ 1$ -$ 120$ 121$ -$ -$ -$ 18$ 18$
Inventory write-downs related to closures (1) - - - (1) - - - 13 13
Net gain on disposition of assets - (4) - (141) (145) - - (1) (1) (2)
Non-operating pension and other postretirement benefit credits (13) (12) (13) (12) (50) (12) (12) (12) (11) (47)
Start-up costs 8 - - - 8 - - - - -
Other expense (income), net 7 3 (14) (1) (5) 4 1 17 - 22
Total special items 1$ (12)$ (27)$ (34)$ (72)$ (8)$ (11)$ 4$ 19$ 4$
Adjusted EBITDA (5)
Market pulp 40$ 49$ 64$ 46$ 199$ 47$ 32$ (5)$ (12)$ 62$
Tissue (4) - (5) (5) (5) (15) (3) - 1 4 2
Wood products 61 86 53 1 201 14 6 4 4 28
Newsprint 12 35 48 45 140 35 25 11 7 78
Specialty papers 5 16 38 28 87 25 26 15 10 76
Corporate and other (10) (9) (9) (10) (38) (14) (7) (3) (9) (33)
Total adjusted EBITDA 108$ 172$ 189$ 105$ 574$ 104$ 82$ 23$ 4$ 213$
20192018

JANUARY 30, 2020 31RFP Q4 2019 RESULTS
Resolute Forest Products Inc.
Financial and Operating Statistics (Page 5 of 5)
Notes
3 We define liquidity as cash and cash equivalents and availability under our credit facilities.
1 We define working capital as current assets less current liabilities excluding cash and cash equivalents, restricted cash, debt, and operating lease liabilities.
2 We define net debt as total debt less cash and cash equivalents.
EBITDA and adjusted EBITDA are not financial measures recognized under U.S. generally accepted accounting principles (or “GAAP”). We believe that using these non-GAAP measures is useful because they are consistent with the indicators
management uses internally to measure the Company’s performance, and it allows the reader to more easily compare our operations and financial performance from period to period. EBITDA and adjusted EBITDA are internal measures, and therefore
may not be comparable to those of other companies. These non-GAAP measures should not be viewed as substitutes to financial measures determined under GAAP in our consolidated statements of operations in our filings with the U.S. Securities
and Exchange Commission.
Adjusted EBITDA means EBITDA, excluding special items, such as closure costs, impairment and other related charges, inventory write-downs related to closures, start-up costs, gains and losses on disposition of assets, non-operating pension and
other postretirement benefit costs and credits and other income and expense, net. Special items are allocated to corporate and other.
4 The operating results of our Calhoun (Tennessee) tissue operations, previously recorded under corporate and other, have been recorded in our tissue segment since April 1, 2018.
5 Earnings before interest expense, income taxes, and depreciation and amortization (or “EBITDA”) by reportable segment is calculated as net income (loss) including noncontrolling interests from the consolidated statements of operations, allocated to
each of our reportable segments (market pulp, tissue, wood products, newsprint and specialty papers) in accordance with Financial Accounting Standards Board Accounting Standards Codification 290, “Segment Reporting,” adjusted for depreciation and
amortization. EBITDA for corporate and other is calculated as net income (loss) including noncontrolling interests from the consolidated statements of operations, after the allocation to reportable segments, adjusted for interest expense, income taxes,
and depreciation and amortization.

JANUARY 30, 2020
RESOLUTE FOREST
PRODUCTS
Q4 2019 RESULTS
Top Related