


Languages
Pages
Legal


1
Giovanni Abramo Laboratorio di Studi sulla Ricerca e
il Trasferimento Tecnologico
Istituto di Analisi dei Sistemi e Informatica (IASI)
Consiglio Nazionale delle Ricerche
“Research evaluation: comparing
methodologies and indicators” Viterbo, 12th November, 2014
2
I introduce myself

2
3
I introduce myself
4
Articulation
Introduction
The most popular indicators,
methodologies and rankings
The DSS-ORP
3
5
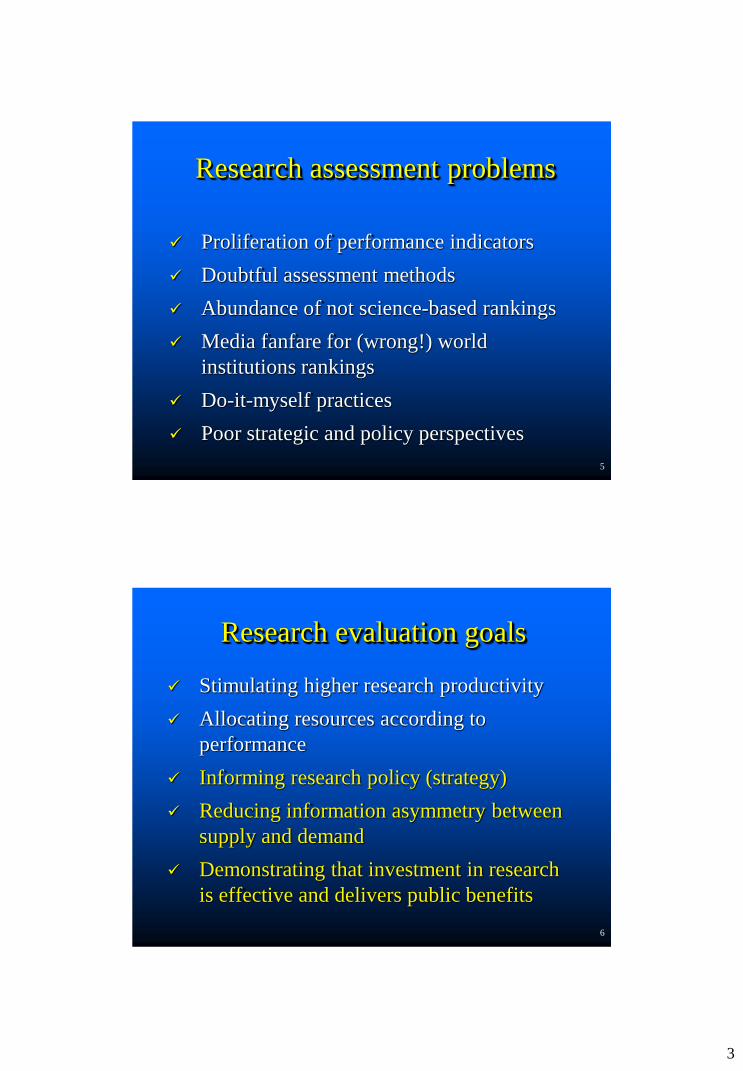
Research assessment problems
Proliferation of performance indicators
Doubtful assessment methods
Abundance of not science-based rankings
Media fanfare for (wrong!) world
institutions rankings
Do-it-myself practices
Poor strategic and policy perspectives
6
Research evaluation goals
Stimulating higher research productivity
Allocating resources according to
performance
Informing research policy (strategy)
Reducing information asymmetry between
supply and demand
Demonstrating that investment in research
is effective and delivers public benefits
4
7
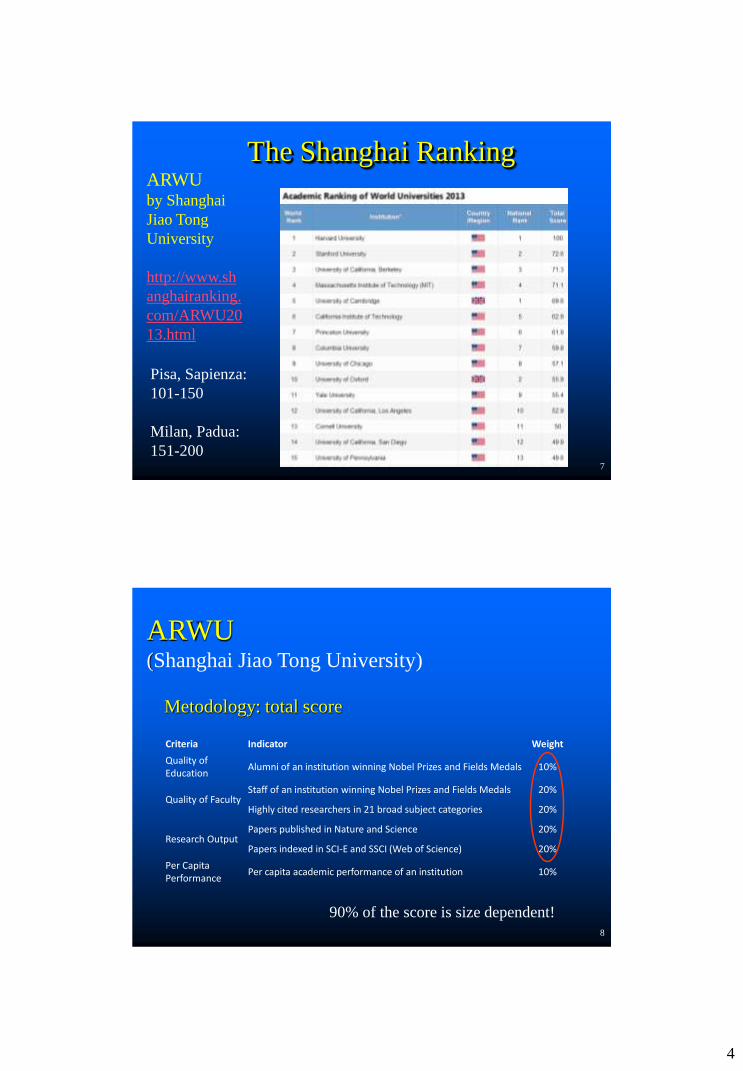
ARWU by Shanghai
Jiao Tong
University
http://www.sh
anghairanking.
com/ARWU20
13.html
Pisa, Sapienza:
101-150
Milan, Padua:
151-200
The Shanghai Ranking
8
ARWU (Shanghai Jiao Tong University)
Criteria Indicator Weight
Quality of Education
Alumni of an institution winning Nobel Prizes and Fields Medals 10%
Quality of Faculty Staff of an institution winning Nobel Prizes and Fields Medals 20%
Highly cited researchers in 21 broad subject categories 20%
Research Output Papers published in Nature and Science 20%
Papers indexed in SCI-E and SSCI (Web of Science) 20%
Per Capita Performance
Per capita academic performance of an institution 10%
Metodology: total score
90% of the score is size dependent!

5
9
10
Research-based (?!) Leiden rankings http://www.leidenranking.com/ranking.aspx
Mean citation score (MCS). The average number of citations
of the publications of a university.
Mean normalized citation score (MNCS). The average
number of citations of the publications of a university,
normalized for field differences, publication year, and
document type. An MNCS value of two for instance means
that the publications of a university have been cited twice
above world average.
Proportion top 10% publications (PPtop 10%). The proportion
of the publications of a university that, compared with other
similar publications, belong to the top 10% most frequently
cited. Publications are considered similar if they were
published in the same field and the same year and if they
have the same document type.

6
11
Research-based (?!) 2013 CWTS ranking
12
Validity of the most popular
indicators
The CWTS new crown indicator
(MNCS): The average number of citations of
the publications of a university …
Univ. A = (10)
Univ. B = (10, 10, 10, …,9)
=> MNCS = 10
=> MNCS < 10
7
13
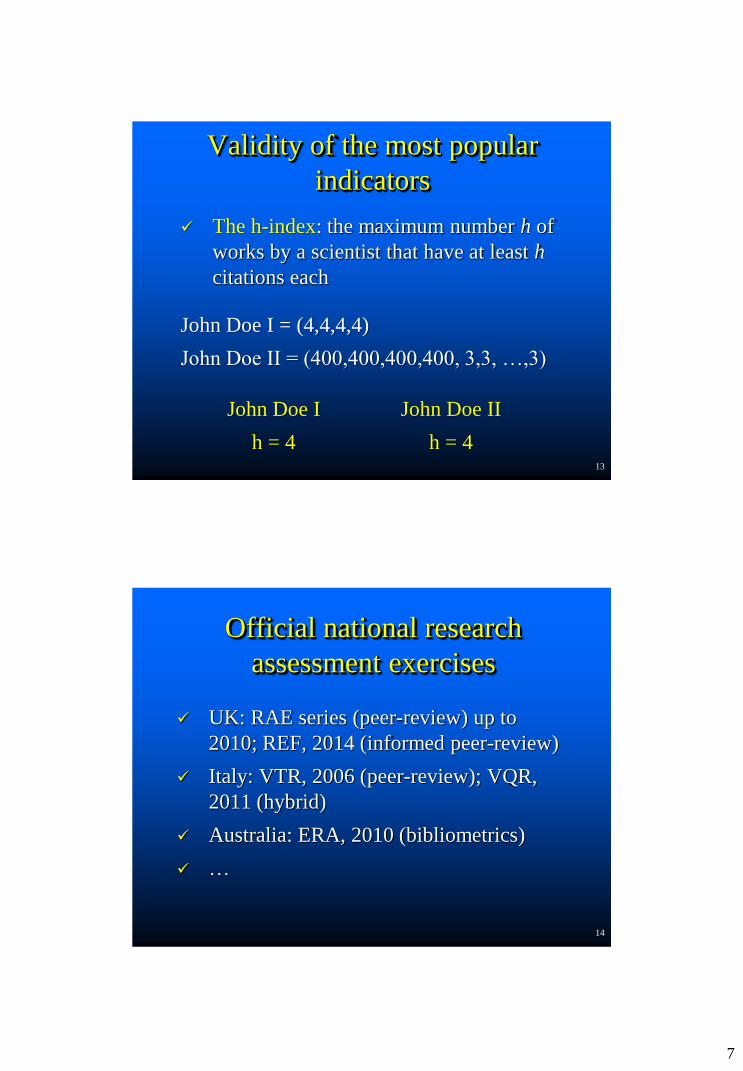
Validity of the most popular
indicators
The h-index: the maximum number h of
works by a scientist that have at least h
citations each
John Doe I = (4,4,4,4)
John Doe II = (400,400,400,400, 3,3, …,3)
John Doe I
h = 4
John Doe II
h = 4
14
Official national research
assessment exercises
UK: RAE series (peer-review) up to
2010; REF, 2014 (informed peer-review)
Italy: VTR, 2006 (peer-review); VQR,
2011 (hybrid)
Australia: ERA, 2010 (bibliometrics)
…
8
15
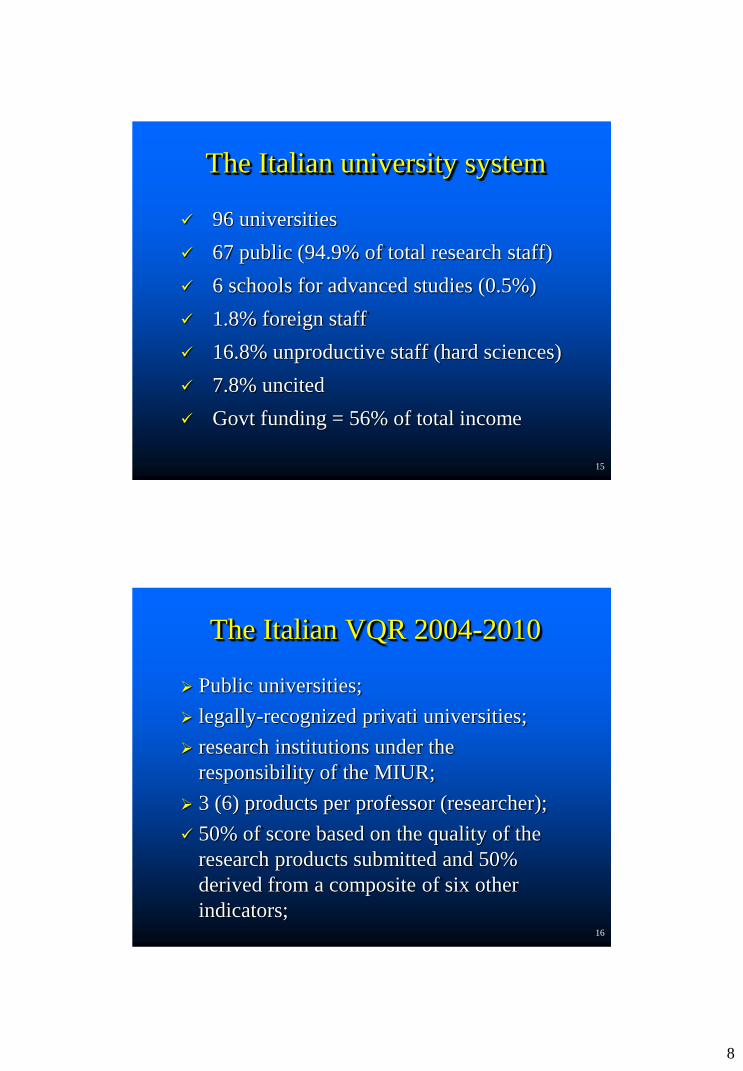
The Italian university system
96 universities
67 public (94.9% of total research staff)
6 schools for advanced studies (0.5%)
1.8% foreign staff
16.8% unproductive staff (hard sciences)
7.8% uncited
Govt funding = 56% of total income
16
The Italian VQR 2004-2010
Public universities;
legally-recognized privati universities;
research institutions under the
responsibility of the MIUR;
3 (6) products per professor (researcher);
50% of score based on the quality of the
research products submitted and 50%
derived from a composite of six other
indicators;
9
17
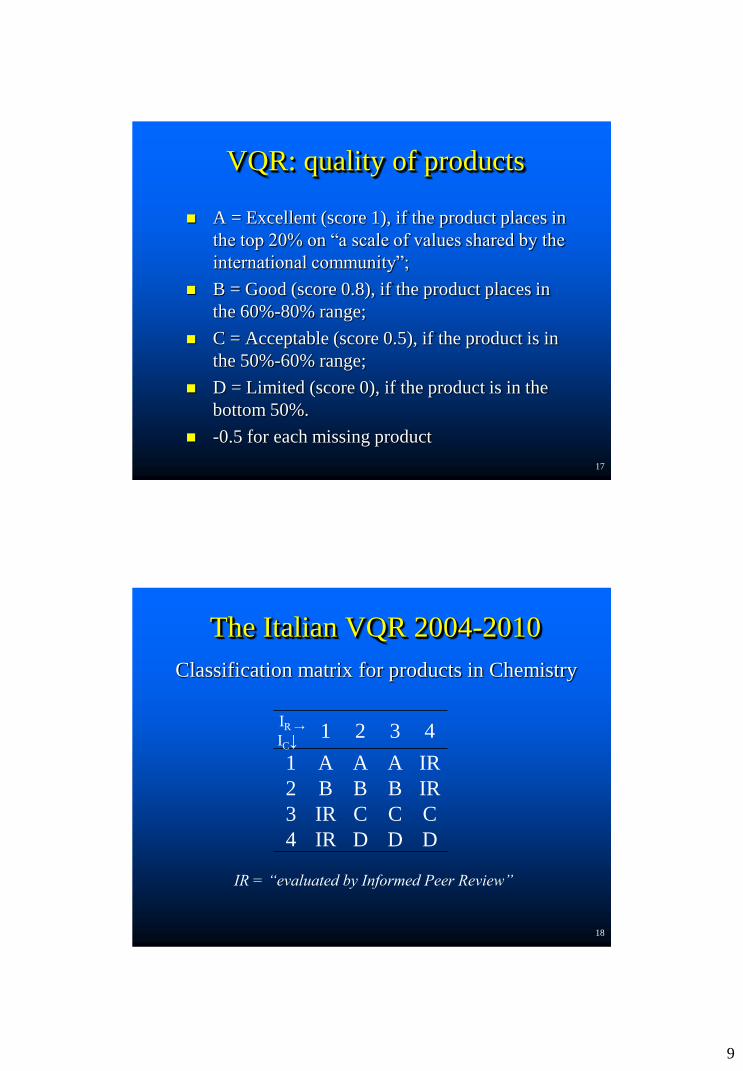
VQR: quality of products
A = Excellent (score 1), if the product places in
the top 20% on “a scale of values shared by the
international community”;
B = Good (score 0.8), if the product places in
the 60%-80% range;
C = Acceptable (score 0.5), if the product is in
the 50%-60% range;
D = Limited (score 0), if the product is in the
bottom 50%.
-0.5 for each missing product
18
The Italian VQR 2004-2010
Classification matrix for products in Chemistry
IR →
IC↓ 1 2 3 4
1 A A A IR
2 B B B IR
3 IR C C C
4 IR D D D
IR = “evaluated by Informed Peer Review”

10
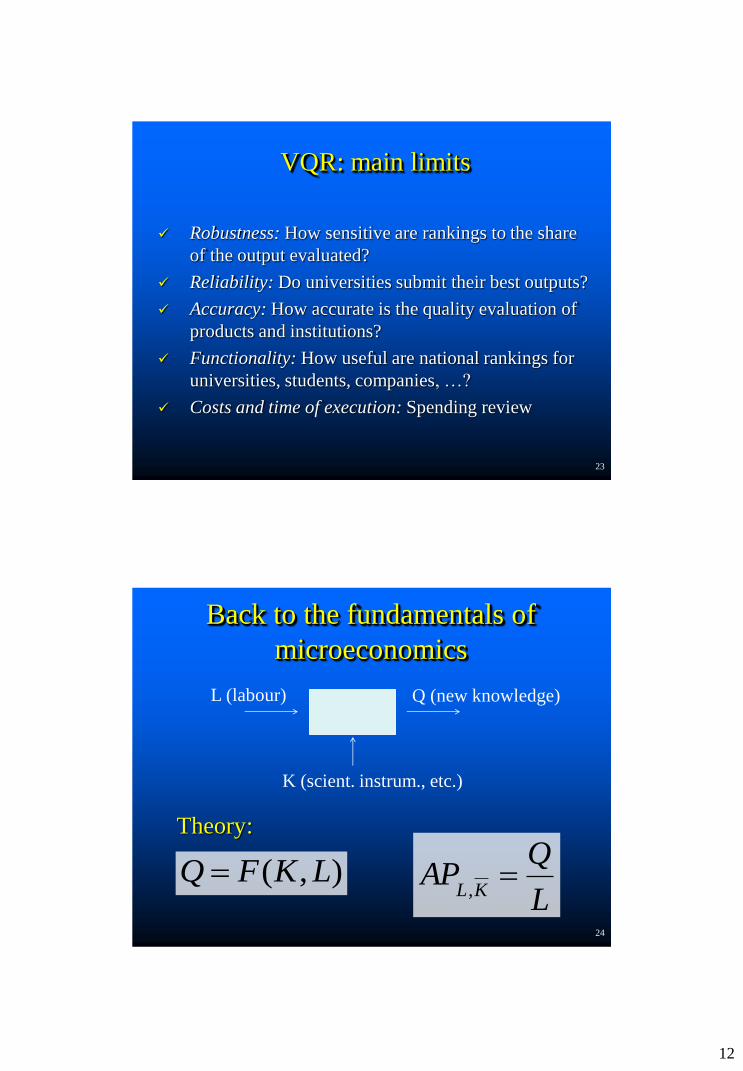
VQR: main limits
Robustness: How sensitive are rankings to the share
of the output evaluated?
Reliability: Do universities submit their best outputs?
Accuracy: How accurate is the quality evaluation of
products and institutions?
Functionality: How useful are national rankings for
universities, students, companies, …?
Costs and time of execution: Spending review
19
Rankings sensitivity to the share of output
20 Median and range of variation (max – min) of rankings in Physics, when varying output share 8 times
11
Reliability: how effective is
selection of outputs by universities?
21
Universities’ do-it-oneself selection worsened
the maximum score achievable in the hard
sciences by 23% to 32%, compared to the score
from an efficient selection.
Accuracy: VQR main problems
22
• The use of the journal impact factor;
• the failure to consider products’ quality
values as a continuous range;
• the full counting of the submitted
publications regardless of the number of co-
authors and their position in the byline;
• aggregation of SDSs (medicine);
• academic rank not accounted for;
• scores referred to world benchmark.
12
VQR: main limits
Robustness: How sensitive are rankings to the share
of the output evaluated?
Reliability: Do universities submit their best outputs?
Accuracy: How accurate is the quality evaluation of
products and institutions?
Functionality: How useful are national rankings for
universities, students, companies, …?
Costs and time of execution: Spending review
23
24
Back to the fundamentals of
microeconomics
Theory:
L
QAP
KL
,),( LKFQ
L (labour) Q (new knowledge)
K (scient. instrum., etc.)
13
25
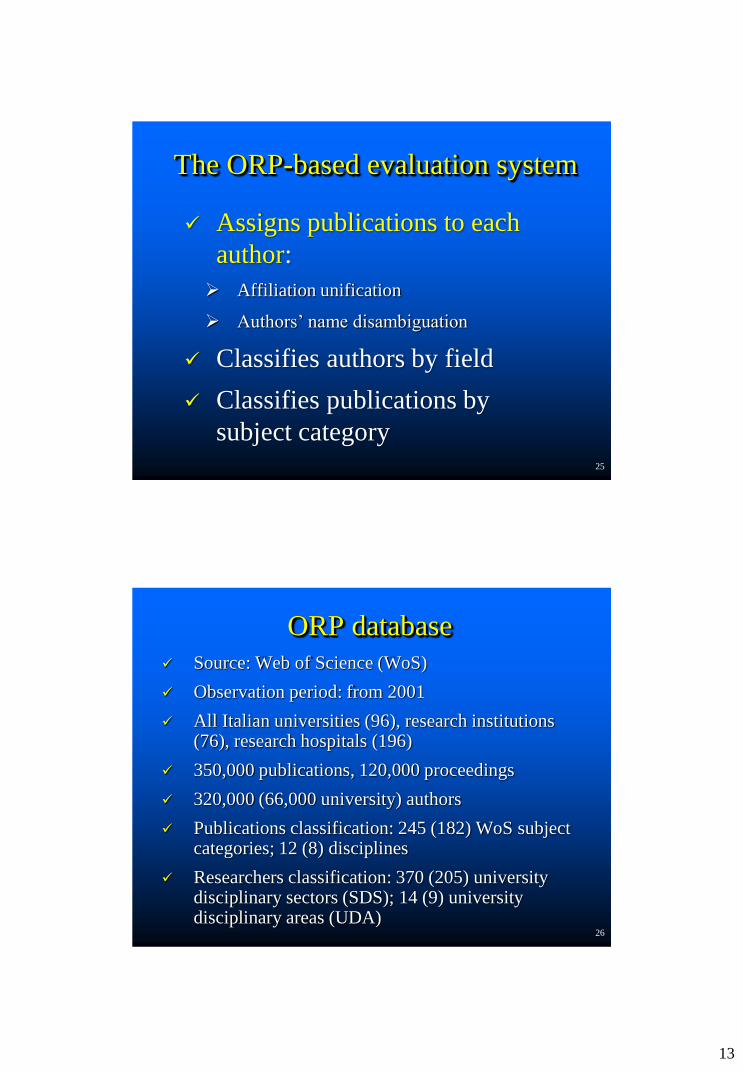
The ORP-based evaluation system
Assigns publications to each
author:
Affiliation unification
Authors’ name disambiguation
Classifies authors by field
Classifies publications by
subject category
26
ORP database
Source: Web of Science (WoS)
Observation period: from 2001
All Italian universities (96), research institutions (76), research hospitals (196)
350,000 publications, 120,000 proceedings
320,000 (66,000 university) authors
Publications classification: 245 (182) WoS subject categories; 12 (8) disciplines
Researchers classification: 370 (205) university disciplinary sectors (SDS); 14 (9) university disciplinary areas (UDA)
14
27
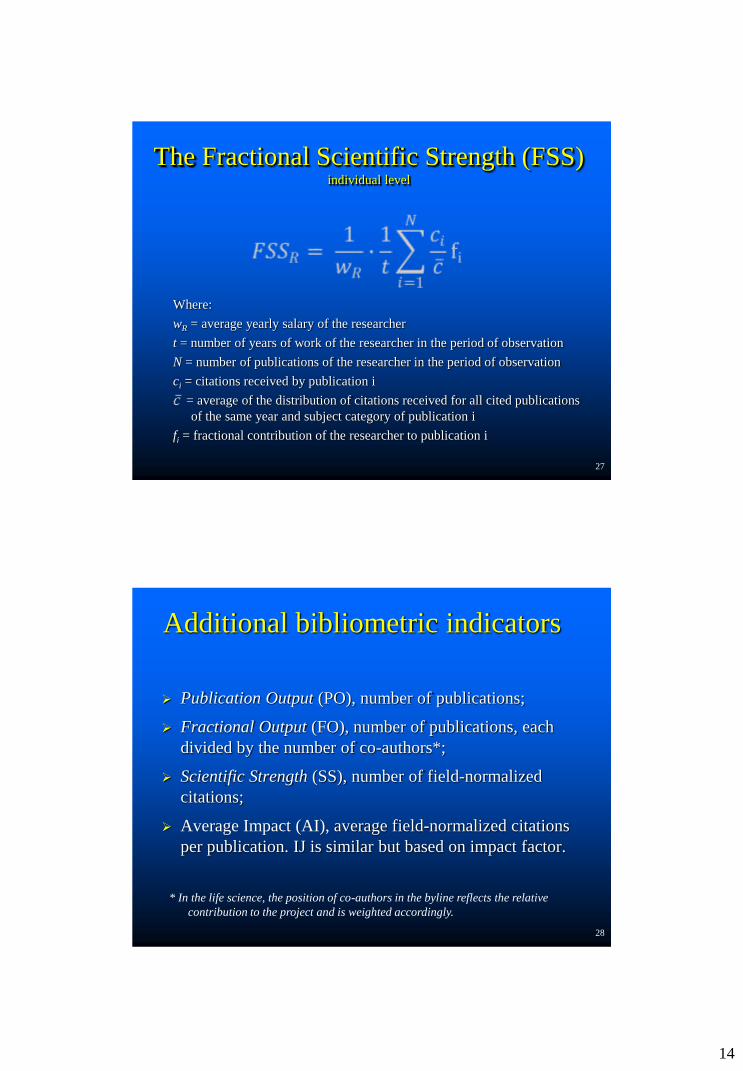
The Fractional Scientific Strength (FSS) individual level
Where:
wR = average yearly salary of the researcher
t = number of years of work of the researcher in the period of observation
N = number of publications of the researcher in the period of observation
ci = citations received by publication i
= average of the distribution of citations received for all cited publications
of the same year and subject category of publication i
fi = fractional contribution of the researcher to publication i
28
Additional bibliometric indicators
Publication Output (PO), number of publications;
Fractional Output (FO), number of publications, each
divided by the number of co-authors*;
Scientific Strength (SS), number of field-normalized
citations;
Average Impact (AI), average field-normalized citations
per publication. IJ is similar but based on impact factor.
* In the life science, the position of co-authors in the byline reflects the relative
contribution to the project and is weighted accordingly.
15
29
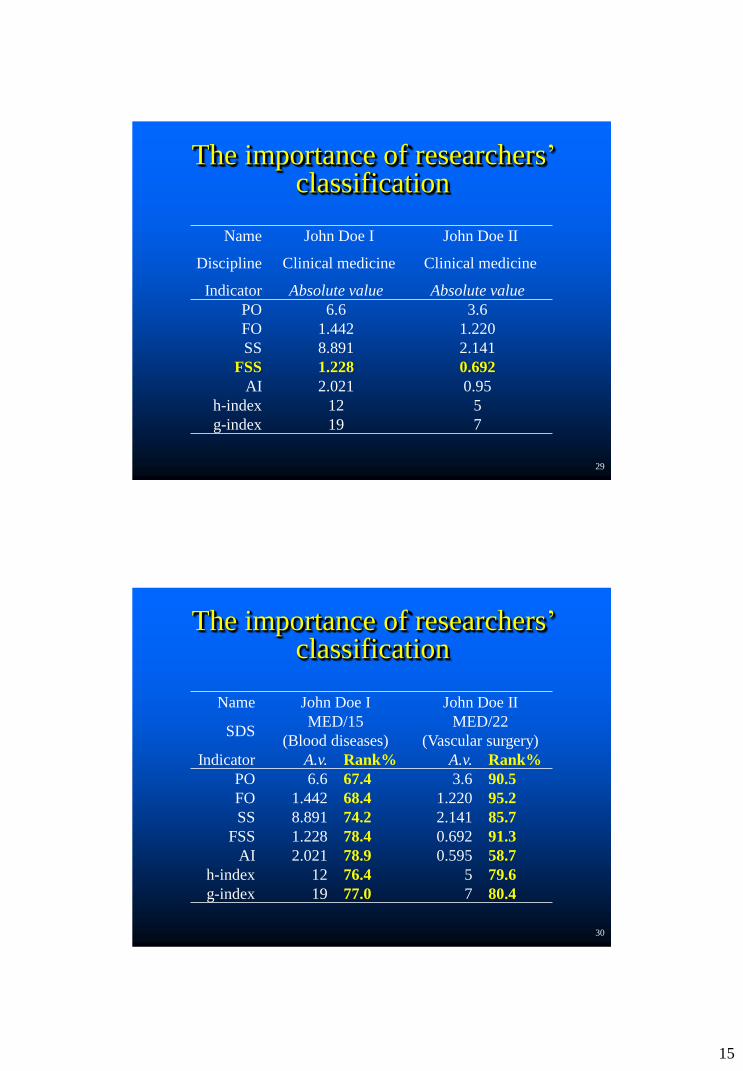
The importance of researchers’ classification
Name John Doe I John Doe II
Discipline Clinical medicine Clinical medicine
Indicator Absolute value Absolute value
PO 6.6 3.6
FO 1.442 1.220
SS 8.891 2.141
FSS 1.228 0.692
AI 2.021 0.95
h-index 12 5
g-index 19 7
30
The importance of researchers’ classification
Name John Doe I John Doe II
SDS MED/15
(Blood diseases)
MED/22
(Vascular surgery)
Indicator A.v. Rank% A.v. Rank%
PO 6.6 67.4 3.6 90.5
FO 1.442 68.4 1.220 95.2
SS 8.891 74.2 2.141 85.7
FSS 1.228 78.4 0.692 91.3
AI 2.021 78.9 0.595 58.7
h-index 12 76.4 5 79.6
g-index 19 77.0 7 80.4
16
31
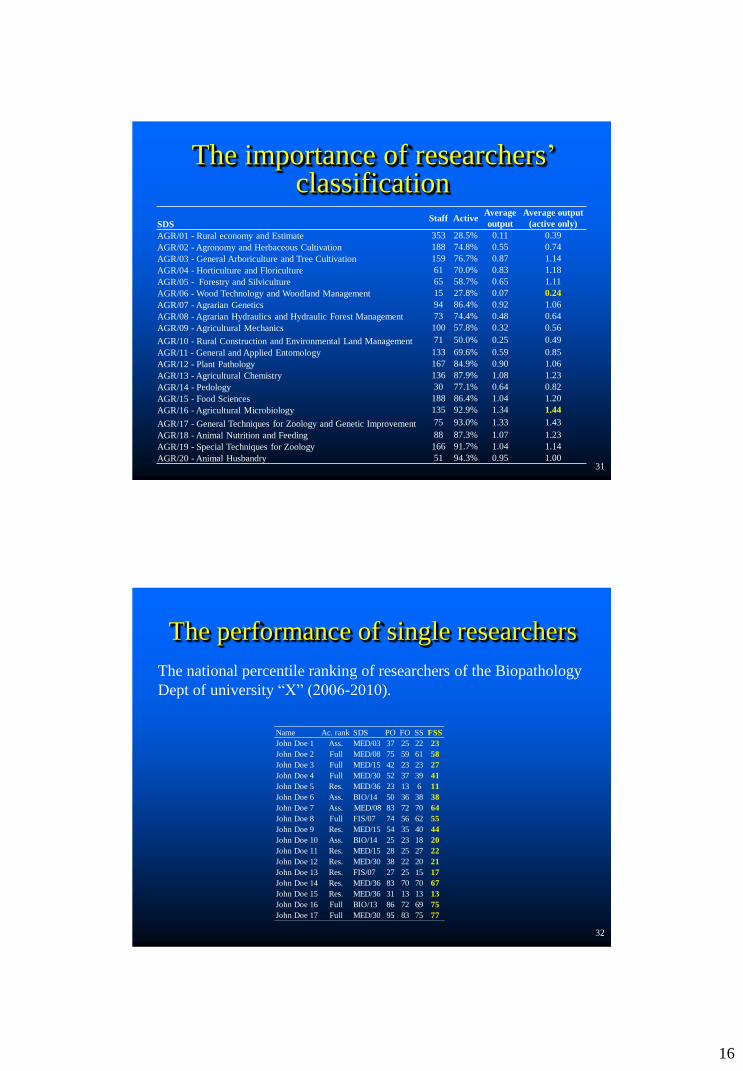
The importance of researchers’ classification
SDS Staff Active
Average
output
Average output
(active only)
AGR/01 - Rural economy and Estimate 353 28.5% 0.11 0.39
AGR/02 - Agronomy and Herbaceous Cultivation 188 74.8% 0.55 0.74
AGR/03 - General Arboriculture and Tree Cultivation 159 76.7% 0.87 1.14
AGR/04 - Horticulture and Floriculture 61 70.0% 0.83 1.18
AGR/05 - Forestry and Silviculture 65 58.7% 0.65 1.11
AGR/06 - Wood Technology and Woodland Management 15 27.8% 0.07 0.24
AGR/07 - Agrarian Genetics 94 86.4% 0.92 1.06
AGR/08 - Agrarian Hydraulics and Hydraulic Forest Management 73 74.4% 0.48 0.64
AGR/09 - Agricultural Mechanics 100 57.8% 0.32 0.56
AGR/10 - Rural Construction and Environmental Land Management 71 50.0% 0.25 0.49
AGR/11 - General and Applied Entomology 133 69.6% 0.59 0.85
AGR/12 - Plant Pathology 167 84.9% 0.90 1.06
AGR/13 - Agricultural Chemistry 136 87.9% 1.08 1.23
AGR/14 - Pedology 30 77.1% 0.64 0.82
AGR/15 - Food Sciences 188 86.4% 1.04 1.20
AGR/16 - Agricultural Microbiology 135 92.9% 1.34 1.44
AGR/17 - General Techniques for Zoology and Genetic Improvement 75 93.0% 1.33 1.43
AGR/18 - Animal Nutrition and Feeding 88 87.3% 1.07 1.23
AGR/19 - Special Techniques for Zoology 166 91.7% 1.04 1.14
AGR/20 - Animal Husbandry 51 94.3% 0.95 1.00
32
The performance of single researchers
The national percentile ranking of researchers of the Biopathology
Dept of university “X” (2006-2010).
Name Ac. rank SDS PO FO SS FSS
John Doe 1 Ass. MED/03 37 25 22 23
John Doe 2 Full MED/08 75 59 61 58
John Doe 3 Full MED/15 42 23 23 27
John Doe 4 Full MED/30 52 37 39 41
John Doe 5 Res. MED/36 23 13 6 11
John Doe 6 Ass. BIO/14 50 36 38 38
John Doe 7 Ass. MED/08 83 72 70 64
John Doe 8 Full FIS/07 74 56 62 55
John Doe 9 Res. MED/15 54 35 40 44
John Doe 10 Ass. BIO/14 25 23 18 20
John Doe 11 Res. MED/15 28 25 27 22
John Doe 12 Res. MED/30 38 22 20 21
John Doe 13 Res. FIS/07 27 25 15 17
John Doe 14 Res. MED/36 83 70 70 67
John Doe 15 Res. MED/36 31 13 13 13
John Doe 16 Full BIO/13 86 72 69 75
John Doe 17 Full MED/30 95 83 75 77
17
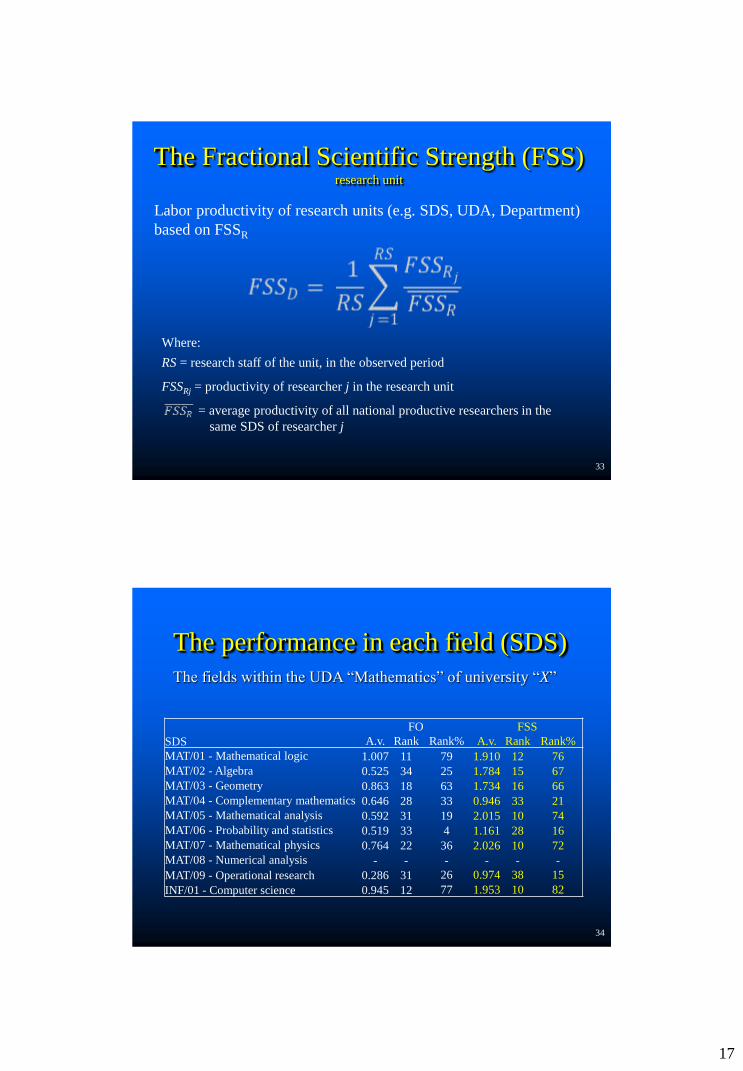
33
The Fractional Scientific Strength (FSS) research unit
Labor productivity of research units (e.g. SDS, UDA, Department)
based on FSSR
Where:
RS = research staff of the unit, in the observed period
FSSRj = productivity of researcher j in the research unit
= average productivity of all national productive researchers in the
same SDS of researcher j
34
The performance in each field (SDS)
The fields within the UDA “Mathematics” of university “X”
FO FSS
SDS A.v. Rank Rank% A.v. Rank Rank%
MAT/01 - Mathematical logic 1.007 11 79 1.910 12 76
MAT/02 - Algebra 0.525 34 25 1.784 15 67
MAT/03 - Geometry 0.863 18 63 1.734 16 66
MAT/04 - Complementary mathematics 0.646 28 33 0.946 33 21
MAT/05 - Mathematical analysis 0.592 31 19 2.015 10 74
MAT/06 - Probability and statistics 0.519 33 4 1.161 28 16
MAT/07 - Mathematical physics 0.764 22 36 2.026 10 72
MAT/08 - Numerical analysis - - - - - -
MAT/09 - Operational research 0.286 31 26 0.974 38 15
INF/01 - Computer science 0.945 12 77 1.953 10 82
18
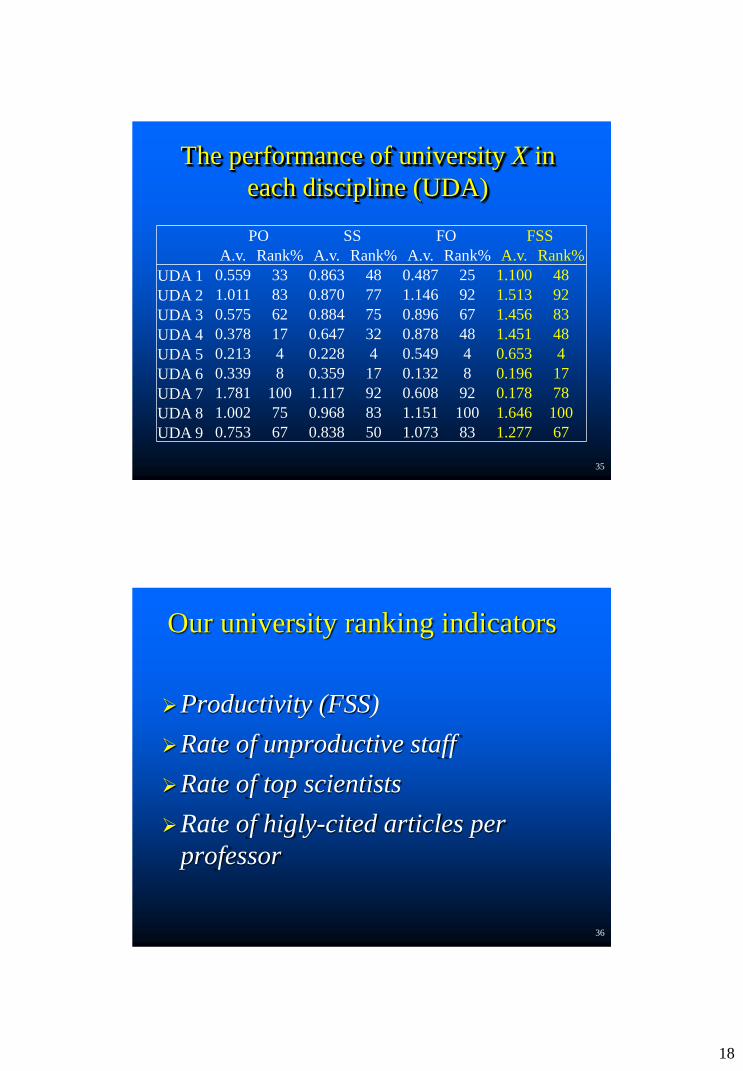
35
The performance of university X in
each discipline (UDA)
PO SS FO FSS
A.v. Rank% A.v. Rank% A.v. Rank% A.v. Rank%
UDA 1 0.559 33 0.863 48 0.487 25 1.100 48
UDA 2 1.011 83 0.870 77 1.146 92 1.513 92
UDA 3 0.575 62 0.884 75 0.896 67 1.456 83
UDA 4 0.378 17 0.647 32 0.878 48 1.451 48
UDA 5 0.213 4 0.228 4 0.549 4 0.653 4
UDA 6 0.339 8 0.359 17 0.132 8 0.196 17
UDA 7 1.781 100 1.117 92 0.608 92 0.178 78
UDA 8 1.002 75 0.968 83 1.151 100 1.646 100
UDA 9 0.753 67 0.838 50 1.073 83 1.277 67
36
Our university ranking indicators
Productivity (FSS)
Rate of unproductive staff
Rate of top scientists
Rate of higly-cited articles per
professor
19
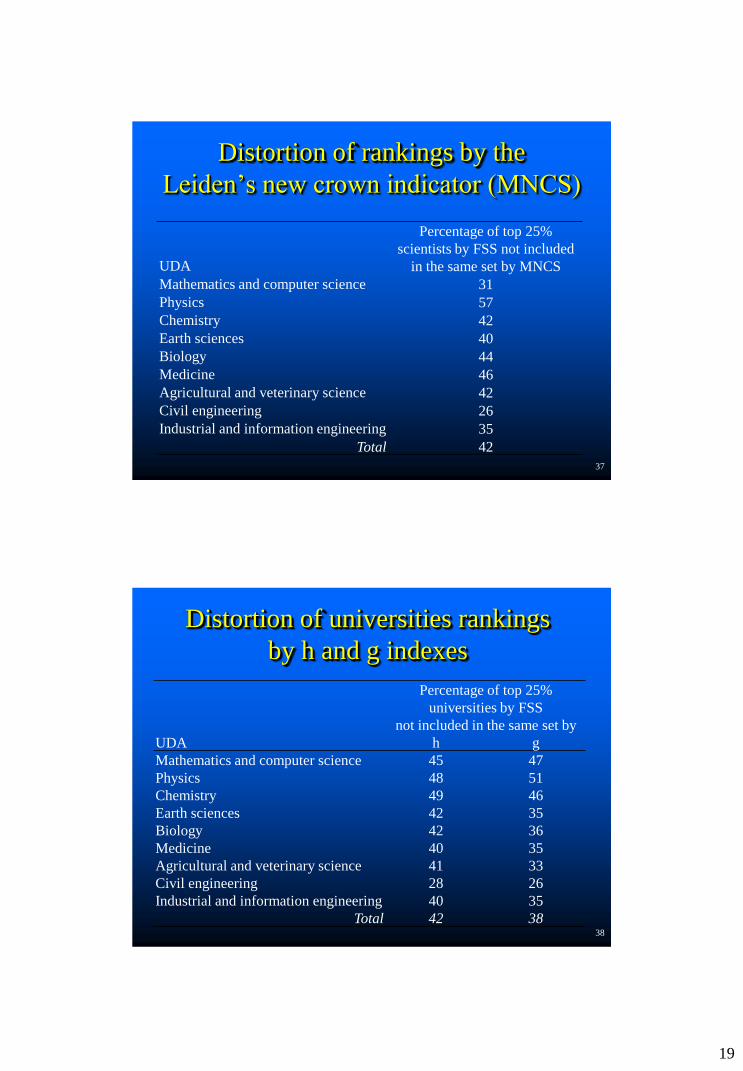
37
Distortion of rankings by the
Leiden’s new crown indicator (MNCS)
UDA
Percentage of top 25%
scientists by FSS not included
in the same set by MNCS
Mathematics and computer science 31
Physics 57
Chemistry 42
Earth sciences 40
Biology 44
Medicine 46
Agricultural and veterinary science 42
Civil engineering 26
Industrial and information engineering 35
Total 42
38
Distortion of universities rankings
by h and g indexes
Percentage of top 25%
universities by FSS
not included in the same set by
UDA h g
Mathematics and computer science 45 47
Physics 48 51
Chemistry 49 46
Earth sciences 42 35
Biology 42 36
Medicine 40 35
Agricultural and veterinary science 41 33
Civil engineering 28 26
Industrial and information engineering 40 35
Total 42 38

20
39
Comparison of VQR and FSS
quartile university ranking lists
UDA No. of
universities
% shifting
quartile Correlat.
From top
to non top
Mathematics and
computer science 50 46.0% 0.60 46.2%
Physics 43 60.5% 0.25 38.5%
Chemistry 42 59.5% 0.69 45.5%
Earth sciences 30 60.0% 0.52 37.5%
Biology 50 52.0% 0.60 69.2%
Medicine 43 48.8% 0.73 45.5%
Agricultural and
veterinary sciences 28 46.4% 0.77 42.9%
Industrial and
information engineering 46 47.8% 0.56 50.0%
40
Conclusions Count only what counts and be aware of what
you cannot count
The most popular research performance
indicators are invalid
Field classification of scientists is absolutely
required to compare performance at the
individual level
Research performance at the individual level is
absolutely required to measure performance at
organizational level
Avoid the “do it myself” temptation
21
41
Giovanni Abramo
Laboratory for Studies of Research and Technology Transfer
at the Institute for System Analysis and Computer Science
(IASI-CNR)
National Research Council of Italy
Via dei Taurini 19, 00185 Roma – ITALY
Tel. +39 06 72597362
http://www.disp.uniroma2.it/laboratorioRTT/eng/index_eng.html
Top Related