


Languages
Pages
Legal


1KESDM
Research and Development Center forElectricity, New and Renewable Energy Technology, and Energy
ConservationMinistry of Energy and Mineral Resources
Republic of Indonesia
DEVELOPING INDONESIA’S GIS-BASED
RENEWABLE ENERGY RESOURCES MAP
Presented at ASEAN-India New & Renewable Energy WorkshopNovember 5-6, 2012 , New Delhi , India

2KESDM
1. Introduction2. Background3. Purpose4. Methodology5. Case Study
OUTLINE

3KESDM
INTRODUCTION
FOSSIL ENERGY RESOURCES PROVEN RESERVES PRODUCTIONRSV/ PROD
RATIO(YEARS)*)
OIL 56,6 Billion barrels 4,04 Billion barrels 329 Million barrels 12
GAS 334,5 TSCF 104,7 TSCF 3,07 TSCF 34
Coal Bed Methane/CBM 453 TSCF - - -
COAL 161,3 Billion tons 5,53 Billion tons 353 Million tons 16
NON-FOSSIL ENERGY RESOURCES INSTALLED CAPACITY
Hydro 75.670 MW (e.q. 845 million BOE) 6.654,25 MW
Biomass 49.810 MW 1.618,40 MW
Geothermal 29.038 MW 1.226,00 MW
Wind 3-6 m/s 1,87 MW
Uranium 3.000 MW (e.q. 24,112 ton) for 11 year* 30 MW
Mini/ Micro Hydro 769,69 MW 228,98 MW
Solar 4,80 kWh/m2/day 12,1 MW*) Kalan – West Kalimantan
ENERGY RESOURCES AND PRODUCTION 2011

4KESDM
BACKGROUND
High demand on energy vs known limited resources; Conventional energy with depleting resources as main supply; Insignificant current utilisation of renewable energy vs available
resources; Need to increase share of RE in total national energy mix; RE resources vary considerably from one geographic location to
another; Poor RE resources data.
5KESDM
PURPOSE
Developing GIS-based RE Resources Database
Mapping RE resources: Micro Hydro, Wind, Biomass (includes algae), and Solar
Facilitating utilisation of RE in Indonesia
Providing reliable and accurate data on RE Resources and public access to the Database
6KESDM
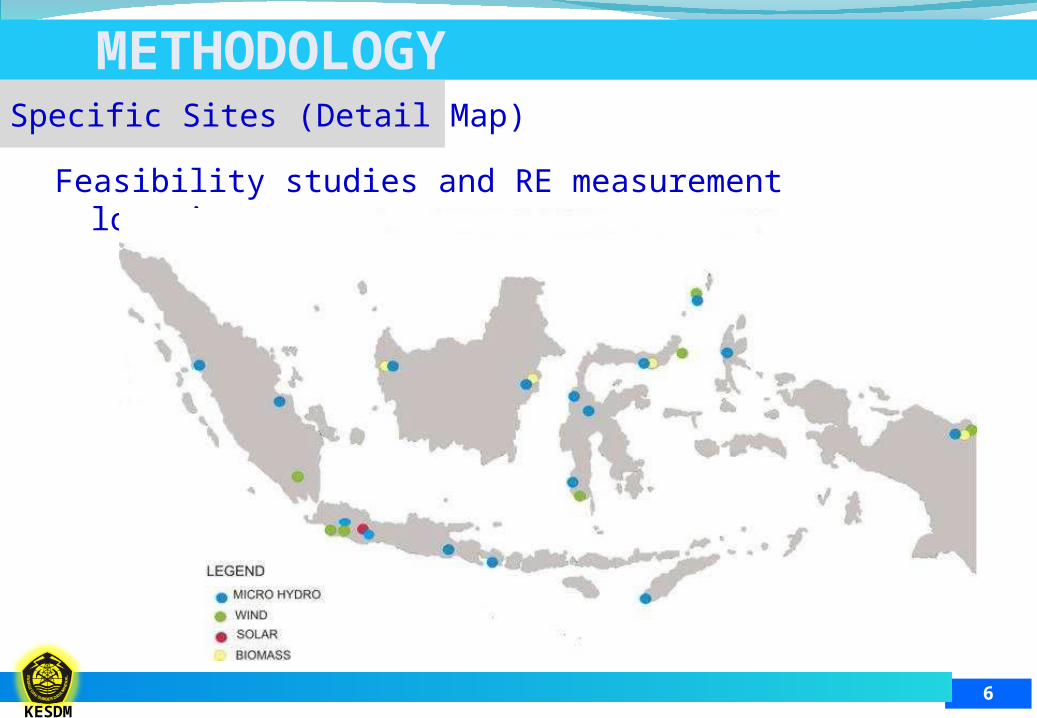
METHODOLOGY
Feasibility studies and RE measurement locations
Specific Sites (Detail Map)
7KESDM
METHODOLOGY cont’d
Regional Level (Meso-scale Map)
- Global climate re-analysis data of Indonesia: rainfall, temperature,
radiation, sunshine duration, etc;
- Indonesia’s condition: Topography, land cover, land use, land
change over certain period of time, population distribution, location
of power generation, national grid, etc;
- Analysis: Map is built by thematic data layers and intersection of
defined parameters;
- Verification and validation.

8KESDM
CASE STUDYSpesific Sites Detail Map
Location: Taman Jaya, Sukabumi, West JavaAnn. mean speed: 6.65 m/s (h=45m)
Windfarm : 10.5 MWTurbin Suzlon : 2.1 MW (5 units)Capacity Factor : 40%Net Ann. Prod. : 34.86 Gwh
Wind Potential Map
9KESDM
CASE STUDY cont’dRegional Level Meso-scale Map
Micro Hydro industry in Indonesia has been established, the regional MH Potential Map is expected to further increase domestic utilisation of MH.
Map of Micro hydro potential consists of thematic data layers such as: Head (developed from DEM Slope Head) River, Debit of river, Additional data: administrative boundary, road, population,
electricity grid, etc

10KESDM
CASE STUDY cont’dHEAD LAMPUNG

11KESDM
CASE STUDY cont’dHEAD + RIVER

12KESDM
CASE STUDY cont’dELECTRICITY POTENTIAL @ Debit = 100m3/s

13KESDM
Top Related