


Languages
Pages
Legal


National Travel Profiles Part A: Description of Daily Travel Patterns Steve Abley, Michael Chou Abley Transportation Engineers Ltd Malcolm Douglass Douglass Consulting Services Ltd
Land Transport New Zealand Research Report 353

*ISBN 978-0-478-33408-1 **ISSN 1177-0600
© 2008, NZ Transport Agency
Private Bag 6995, Wellington 6141, New Zealand Telephone 64-4 894-5400; Facsimile 64-4 894-6100 Email: [email protected] Website: www.nzta.govt.nz
Abley, S.1, Chou, M.1, Douglass, M.2 2008. National travel profiling part A: description of daily travel patterns. NZ Transport Agency Research Report 353. 150 pp.
1 Abley Transportation Engineers Ltd 2 Douglass Consulting Services Ltd
Keywords: annual, average, daily, household, modes, New Zealand, personal, purposes, rural, surveys, travel, trip legs, urban, weekday, weekend

An important note for the reader
The NZ Transport Agency is a Crown entity established under the Land Transport Management Amendment Act 2008. The objective of the NZ Transport Agency is to undertake its functions in a way that contributes to an affordable, integrated, safe, responsive, and sustainable land transport system. Each year, the NZ Transport Agency invests a portion of its funds on research that contributes to this objective. This report is the final stage of a project commissioned by Land Transport New Zealand before 31 July 2008 and is published by the NZ Transport Agency. While this report is believed to be correct at the time of its preparation, the NZ Transport Agency, and its employees and agents involved in its preparation and publication, cannot accept any liability for its contents or for any consequences arising from its use. People using the contents of the document, whether directly or indirectly, should apply and rely on their own skill and judgement. They should not rely on its contents in isolation from other sources of advice and information. If necessary, they should seek appropriate legal or other expert advice in relation to their own circumstances, and to the use of this report. The material contained in this report is the output of research and should not be construed in any way as policy adopted by the NZ Transport Agency but may be used in the formulation of future policy.

Acknowledgments
New Zealand Trips and Parking, and the researchers acknowledge the assistance provided for this research project by:
• the Ministry of Transport, who made the basic survey datasets available, and the advice of officers that was generously offered during the work; and
• the peer reviewers and study group members for their critical and productive comments as the draft reports were reviewed and amended.
In particular, we would like to thank Lynley Povey of the Ministry of Transport for her assistance with detailed definitions that were essential for a precise interpretation of the New Zealand Household Travel Survey.

5
Contents
Executive summary ........................................................................................... 7 Abstract............................................................................................................. 9
1. Introduction ............................................................................................11
1.1 Background .......................................................................................11 1.2 Research objective .............................................................................12 1.3 Report structure.................................................................................13
2. Background..............................................................................................14
2.1 About the Household Travel Survey.......................................................14 2.2 Survey procedure ...............................................................................14 2.3 Data description.................................................................................15
2.3.1 Categories ................................................................................15 2.3.2 Stratification .............................................................................16 2.3.3 Participants...............................................................................16 2.3.4 Off-road travel ..........................................................................16
2.4 Weights ............................................................................................16 2.5 Filters ...............................................................................................17 2.6 Day of travel and selection of individuals ...............................................17 2.7 Definitions of trips and purposes...........................................................17
2.7.1 Usage ......................................................................................17 2.7.2 Trip legs ...................................................................................17 2.7.3 Trip leg purpose ........................................................................18 2.7.4 Modes ......................................................................................19 2.7.5 Trip chains................................................................................20
2.8 Uses of the NZHTS .............................................................................20
3. Literature review .....................................................................................21
3.1 Introduction ......................................................................................21 3.2 Great Britain......................................................................................21 3.3 Australia ...........................................................................................22 3.4 United States.....................................................................................23 3.5 New Zealand .....................................................................................24 3.6 Summary ..........................................................................................27
4. Personal travel.........................................................................................28
4.1 Introduction ......................................................................................28 4.2 Mean trip leg distance and time, and number of trip legs per person ..........28 4.3 Proportion of trip legs taken by private and public modes .........................31 4.4 Summary ..........................................................................................32
5. Travel mode .............................................................................................33
5.1 Introduction ......................................................................................33 5.2 Trip legs/person/day, mean distance and time by mode and area ..............33 5.3 Proportion of trip legs/person/day by age, gender and mode ....................36 5.4 Walking trip leg duration by age and gender...........................................43 5.5 Comparing the proportion of trip legs by modes on weekday and weekends...............44 5.6 Walking duration by purpose in MUAs....................................................46 5.7 Cycle duration by purpose in MUAs .......................................................48 5.8 Summary ..........................................................................................49

6
6. Travel purpose ........................................................................................ 50 6.1 Introduction...................................................................................... 50 6.2 Trip legs and total distance/person/day by purpose ................................ 50 6.3 Mean distance and time by purpose...................................................... 51 6.4 Proportion of trip legs/person/day by age, gender and purpose ................ 53 6.5 Trip legs by purpose and day of the week.............................................. 60
6.5.1 Proportion of weekday and weekend trip legs by selected purposes .. 60 6.5.2 Trip leg duration by purpose – weekdays and weekends ................. 61
6.6 Summary ......................................................................................... 63
7. Travel by trip leg purpose and travel mode.............................................. 64
7.1 Introduction...................................................................................... 64 7.2 Trip legs/person/day by purpose and mode ........................................... 64 7.3 Distance travelled/person/day by purpose and mode .............................. 65 7.4 Trip leg proportion by purpose and mode .............................................. 66 7.5 Summary ......................................................................................... 68
8. Social inclusion and accessibility ............................................................. 69
8.1 Introduction...................................................................................... 69 8.2 Variation in travel by household car availability ...................................... 69 8.3 Variation in travel by household size..................................................... 70 8.4 Trip legs/person/day by mode and personal income................................ 72 8.5 Distance travelled by mode and personal income.................................... 76 8.6 Summary ......................................................................................... 77
9. Travel by time of day............................................................................... 78
9.1 Introduction...................................................................................... 78 9.2 Proportion of home-based daily departures by purpose and time of day..... 78 9.3 Proportion of daily arrivals purpose and time of day................................ 83 9.4 Proportion of weekday and weekend arrivals for all purposes by time of day in MUAs.... 89 9.5 Summary ......................................................................................... 90
10. Summary and recommendations ............................................................. 92
10.1 Summary ......................................................................................... 92 10.2 Some ongoing matters ....................................................................... 93 10.3 Recommendations ............................................................................. 95
10.3.1 Recommendations to NZTA......................................................... 95 10.3.2 Recommendations to the MoT ..................................................... 95
11. References .............................................................................................. 96
Appendices ...................................................................................................... 97
7
Executive summary
The opportunity to undertake this research resulted from a discussion and an offer from
Ministry of Transport officers in 2006. They indicated that the very extensive survey
information collected in the New Zealand Household Travel Survey (NZHTS), while being
collected in primarily for government policy purposes, was also intended to be a database
of continuing information for use by transportation researchers and practitioners. As a
result, in 2007, Land Transport New Zealand (now part of the NZ Transport Agency)
awarded this research contract to the New Zealand Trips and Parking Database Bureau.
The objective of this research is to describe New Zealand travel behaviour by different
modes and for different purposes as defined in the NZHTS. In the first instance, this is a
comprehensive coverage from the database as it relates to travel patterns by mode and
purpose. The NZHTS provides continuous, up-to-date data on personal travel, and
monitors changes in travel behaviour over time. This report provides a detailed
description of individual travel profiles in different areas, along with tables and plots of
trip leg related survey results from the continuous travel survey data collected in 2003–
2006.
The report is designed to be useful to practitioners in their understanding of travel
patterns in the:
• Major Urban Areas: populations over 30 000;
• Secondary Urban Areas: populations between 10 000 and 30 000; and
• Rural Areas: lesser populations and all other rural areas.
Following the introductory background and literature review, the report deals with the
survey results in the following sequence:
• personal travel,
• travel mode,
• travel purpose,
• travel by trip purpose and mode of travel,
• social inclusion and accessibility, and
• travel by time of day.
The surveys provide a vast array of information. A few selected items give a sample of
the type of information available from the NZHTS:
• The NZHTS survey breaks journeys up into ‘trip legs’, each having its own origin
and destination, and relating to each particular mode used in the journey. Overall,
the average number of trip legs/person/day for all areas is 4.4.
• Nationally, trip legs made as ‘vehicle drivers’ exceed all other modes and, on
average, represent 55% of all trip legs. The mode percent varies from 52% in
MUAs to 58% in SUAs.
• Trip legs ‘to home’ make up the largest trip leg purpose, closely followed by the ‘to
work – main job’ trip legs.

NATIONAL TRAVEL PROFILES PART A: DESCRIPTION OF DAILY TRAVEL PATTERNS
8
• It will not be a surprise that individuals whose dominant travel mode is as a ‘vehicle
driver’ make more trip legs and travel greater distances per year for all purposes
compared to individuals using all other modes of travel.
• Individuals who fall into the $10,001–$15,000 income category make fewer trip
legs than those with larger incomes.
This report explains the NZHTS mode and purpose definitions, and includes a wide range
of comparative information describing travel in New Zealand. It may provide a suitable
framework to continue recording the NZHTS results for publication in the years ahead.
Complementing the description of travel, this report includes some conclusions and
recommendations for future consideration. At the head of the list is a recommendation for
further analysis of the NZHTS, with a view to improve the description of the predictive
variables associated with different modes of travel and journeys, made up of trip chains,
for various trip leg purposes. This should enable improved travel predictions for the
future. It will be possible, with the completion of four survey years in 2007, to
demonstrate trends in travel changes over time. It is also recommended that geographic
regional comparisons be made and compared with the results arising from recent regional
household surveys and transportation planning studies undertaken in Auckland,
Wellington and Christchurch.

1. Introduction
9
Abstract Gaining a thorough understanding of daily travel for all trip purposes and by all modes of
travel is essential to policy and planning. The Ministry of Transport’s New Zealand Home
Travel Surveys (NZHTS) have, since 2003, been undertaken as continuous ongoing
surveys. The dataset resulting from these years of survey include 13 000 people from
6000 households. This large database is a valuable resource covering accidents and safety
issues as well as travel profiles. The national statistics are broken down into major and
secondary urban areas, and also rural areas as the basis of reporting and presentation.
This report makes this information more readily available to researchers and practitioners
involved with transportation. The report provides a wide range of tables and graphs
relating to modes, purposes and trip legs for weekdays and weekend travel. It concludes
with recommendations that the research should continue to provide more detailed
investigation of trips, travel trends and regional comparisons. It also recommends that
the variables surveyed in the NZHTS be further assessed for use in the development of
transportation models for future travel projection.

NATIONAL TRAVEL PROFILES PART A: DESCRIPTION OF DAILY TRAVEL PATTERNS
10
1. Introduction
11
1. Introduction
1.1 Background
The first Ministry of Transport New Zealand Household Travel Survey (NZHTS) was
undertaken in 1989/90, followed by the second in 1997/98. These surveys were designed
to provide a databank of personal travel information for New Zealand. The results of these
one-off travel surveys have been used by transport planners, road safety researchers and
engineers to formulate transportation policies, and to improve the safety and efficiency of
the New Zealand transportation system. However, in earlier research documents
undertaken using this survey data, little focus has been placed on analysing trip profiles.
Trip profiles, such as trip length and trip durations categorised by different modes and trip
purposes, are particularly valuable for future planning for sustainable transportation
modes and transport assessments. The 1989/90 and 1997/98 surveys were discrete.
Since 2003, these have now been complemented by ongoing continuous survey
processes.
Given that researchers need to investigate and describe New Zealand travel profiles more
fully, Land Transport New Zealand1 (LTNZ) commissioned the New Zealand Trips Parking
Database Bureau to undertake analysis on ‘National Travel Profiling: Description of Daily
Travel Patterns’ in 2007. This report provides a detailed description of the individual
household travel profiles in major urban, secondary urban and rural local government
areas, along with tables and plots of trip related survey results from the 2003 to 2006
continuous travel survey data. This report has not attempted to analyse trends or
undertaken any time series analysis.
The datasets (dated 23rd of April 2007) used in this analysis included the information from
the 2002/03 surveys which were low samples and could not be adjusted to account for a
full year’s seasonal variations. The analysis in this research has not been able to include
more detailed regional comparisons or trends over time. When the 2007 surveys have
been added to the dataset, it will be possible for more detailed regional and trend analysis
to be undertaken.
1 While this report was being prepared for publication, LTNZ was merged with Transit New Zealand to
form the NZ Transport Agency (NZTA).

NATIONAL TRAVEL PROFILES PART A: DESCRIPTION OF DAILY TRAVEL PATTERNS
12
1.2 Research objective
The objective of this research is to investigate and determine New Zealand travel
behaviour for main urban and rural areas by different modes related to different land uses
for varying trip purposes. This will provide practitioners with better quality information to
make transport planning decisions from.
The analysis includes daily trip leg profiles (including arrivals) by:
• purpose,
• mode,
• types of households with defined vehicle ownerships.
Daily trip leg arrival profiles are analysed by region and area type (main urban, secondary
urban or rural). All the trip leg purposes included in the national travel survey data have
been considered, including trip legs to home, work (main job, other job, employer’s
business), education, shopping, social welfare, personal services, medical/dental,
social/recreation, accompanying someone else and to change mode.
This research project was defined as Part A (description of daily travel patterns). It was
seen as an opportunity to describe the travel profile of the whole of New Zealand on a
typical weekday or weekend. This preliminary travel profile investigation has been
summarised according to Major Urban Areas (MUAs), Secondary Urban Areas (SUAs) and
Rural Areas (RAs) as defined by the Statistics Department. In this report, the trip legs
have not been related to specific land uses but rather to types of activity (e.g. work,
education, shopping, etc.). Because of the limitations of only having four years of data, it
was not possible to consider trends over time. Similarly, it has not been possible to
undertake detailed regional comparisons. Such analysis should be undertaken as a further
project.
Much more information is available from the NZHTS data files, which can be analysed for
a variety of purposes, including travel trends in each of the regions and developing travel
projection models based on the trip modes and purposes already surveyed in the NZHTS.
This project shows the value of the NZHTS as a national information database. This, in
turn, leads to a recommendation for further analysis designed to identify regional
contrasts and to develop transportation models for assisting future transformation
planning.

1. Introduction
13
1.3 Report structure
This report includes the following sections:
• Background: descriptions of the NZHTS survey procedure and database, and its
uses;
• Literature review: international research on travel profiling consulted during
research;
• Personal travel: includes information on area variations and personal travel from
2003 to 2006;
• Travel mode: includes details about how residents travel within New Zealand,
categorised by mode;
• Travel purpose: includes details about why residents in New Zealand travel;
• Travel by trip purpose and mode of travel: details individuals’ travel,
categorised by the purpose of the trip and mode of transport;
• Social inclusion and accessibility: includes information on how vehicle
availability and income affect households’ and individuals’ travel profiles;
• Travel by time of day: includes information on personal travel patterns,
categorised by time and purpose; and
• Summary and recommendation: a list of recommendations for further research
topics.
The supplementary material in the Appendices covers:
• Appendix A: the household form used for the NZHTS;
• Appendix B: the person form used for the NZHTS;
• Appendix C: the coding tables used for analysing the NZHTS responses;
• Appendix D: unweighted trip legs by time of day for home-based arrivals and
departures; and
• Appendix E: glossary, abbreviations and acronyms.

NATIONAL TRAVEL PROFILES PART A: DESCRIPTION OF DAILY TRAVEL PATTERNS
14
2. Background
2.1 About the Household Travel Survey
The NZHTS is a series of travel surveys designed to provide a databank of personal travel
information for New Zealand. It is part of a continuous survey that began in 2003 and will
be useful in enabling identification of long-term travel trends. This databank will continue
to be an important source of information to influence government policies and monitor
transport and safety performances. The Ministry of Transport (MoT) states that ‘the aim of
this survey is to increase our understanding of travel behaviour by people in New
Zealand, including travel by car as a driver or passenger, walking and cycling,’ (MoT
2007).
The current travel survey differs from the previous one-off surveys that were conducted in
1989/90 and again in 1997/98 in that the survey is now continuous rather than discrete.
Discrete surveys are not as reliable in developing valid estimations of changes in accident
risks and travel patterns occurring over time. The continuous survey ensures the
availability of up-to-date travel data to formulate new transport and road safety policies.
2.2 Survey procedure
The NZHTS dataset analysed in this report includes travel by approximately 13 000
people from some 6000 households in sample areas throughout New Zealand between
2003 and 2006. The NZHTS is administered by an independent contract on behalf of the
MoT. Households are selected and an initial letter is sent from the MoT to each household,
which includes a pamphlet briefly describing the aims and content of the survey.
The interviewer then calls at the address to gather household information, explains the
purpose of the survey and informs the household what days are their ‘travel days’. The
‘travel days’ are two consecutive days for which the household records all travel. The two
consecutive days may be two consecutive weekdays or weekends. An even spread
according to the day of the week was maintained by systematic allocation of travel days.
The survey includes trips beginning between 0400h on Day 1 to 0359h on Day 3, a 48-
hour period. A memory-jogger was left behind for the respondents to use for recording
travel. The survey is voluntary. The response rate calculated in 2003/2004 was 64%
(MoT 2007).
Finally, the interviewer returns to conduct the interviews as soon as possible after the
travel days. The 2003 household travel survey form and person form are included in
Appendix A and Appendix B respectively. It should be noted that Questions 26 to 76 in
the person form relate to alcohol and accidents, and are not applicable to purposes of this
particular National Travel Profiling research project.
A detailed description of the NZHTS methodology can be found on the MoT website
(MoT 2008a).

2. Background
2.3 Data description
2.3.1 Categories
This research relies on a household travel survey undertaken in fourteen local
government areas in New Zealand. Approximately 12 700 people were interviewed from
5650 households between March 2003 and June 2006. The data supplied by the MoT was
dated 23rd of April 2007. In general, the data collected divides into the categories shown
in Table 2.1 and the inter-relationships shown in Figure 2.1. This research project only
focuses on analysing household, person and trip data to achieve the research objectives.
The variables supplied by MoT and used in these surveys and this analysis are listed in
Appendix C.
Table 2.1 Main data categories and descriptions in the NZHTS.
Main data category Description
Household Details about the household and its response to the survey Person Details about people in the household (information such as age,
gender, experience, accident totals, occupation, income, driving, and work and school locations)
Trip Purpose, mode, date, time and distance of each trip leg, and vehicle information
Vehicles Type, make, model, year, engine CCs and owner information for vehicles driven during the survey
Alcohol Drinking session times and locations Accidents Accident involvement over the last two years Address Text description of trip destinations Accident locations Text description of accident locations Trip geocoding Trip location (map references) and geocoded distance estimates Address geocoding Address location (map references)
Figure 2.1 Inter-relationships of the main HTS variables.
Note: grey fill indicates the variables considered by this study.
15

NATIONAL TRAVEL PROFILES PART A: DESCRIPTION OF DAILY TRAVEL PATTERNS
16
2.3.2 Stratification
The sample strata and substrata were geographically based using Statistics NZ definitions
for the 1996 Census of Population and Dwellings (see Statistics NZ 2008). The strata were
based on the fourteen Local Government regions, further stratified into MUAs, which have
a population of at least 30 000; SUAs, which have a population between 10 000 and
30 000; and RAs, which includes minor urban areas with populations less than 10 000 and
all other rural areas.
The sample sizes per Local Government Region were proportional to 2001 Census
populations except the initial survey emphasis was as follows:
• Less than proportional: Auckland, Canterbury, Wellington;
• More than proportional: Hawkes Bay, Nelson/Marlborough, Northland, Southland,
Taranaki, Gisborne and the West Coast Regions.
2.3.3 Participants
All household members, including babies, were eligible for inclusion in the survey. Travel
by household members aged nine and under was reported by a parent or caregiver who
had been with the child on all travel.
2.3.4 Off-road travel
Off-road travel, such as on off-road tracks or around private property (e.g. farms), was
excluded from the survey. All on-road travel, including farmers' work travel, was included
in the survey criteria.
2.4 Weights
Since the sample is not a simple random sample of the population, a simple total of the
sample observations is not appropriate for estimating population means and totals.
Weighted means and totals are used, where the weights are approximately equal to the
reciprocals of the probability of selection of the respondents. Weights are also used to
reduce the inevitable bias due to non-response.
The appropriate weights provided by the MoT and included in the datasets have been
applied in calculation of all the travel profiles contained in this research.

2. Background
17
2.5 Filters
‘Filters’ are applied to select households, people and trips by people with full responses
only. Filters applied to the ‘household’, ‘person’ and ‘trip’ datasets provided by the MoT
are presented in Table 2.2.
Table 2.2 Filters used with each dataset of the NZHTS.
Dataset Filter Description
Household hhrespstat=1 Households with full response only Person perespstat=1 People in the survey with full responses Trip perespstat=1 Trips by people with full responses
2.6 Day of travel and selection of individuals
After applying the filters, the entire analysis has accounted for those people who travelled
on both Day 1 and Day 2. The analysis also includes people who did not travel on their
designated travel days.
2.7 Definitions of trips and purposes
2.7.1 Usage
The definition of ‘trip legs’, ‘modes’ and ‘trip purposes’ can often vary between countries.
The perception of these terms also varies between research documents depending on how
the terms are applied in practice. For example, the Travel Survey – 1997/1998 (Land
Transport Safety Authority (LTSA) 2000) has used trip legs to understand
New Zealanders’ travel behaviour. It is noted that O’Fallon & Sullivan (2005) have used
‘trip chains’ to understand how New Zealanders link their travel into journeys.
Consequently, it is important to define these terms to ascertain the results contained
inside this report. This allows practitioners to understand how the travel profiles are
generated, and allows for comparisons with other national and international research.
For this research, all the analysis uses ‘trip legs’ and ‘trip leg purposes’ as defined by the
MoT (2007). This section outlines how ‘trips legs’, ‘trip chains’ and ‘trip leg purposes’ are
defined.
2.7.2 Trip legs
The ‘Trip data’ contain over 108 400 separate rows, one for each trip leg. The MoT
(2008b) defines a trip leg as follows:
A trip leg is a section of travel by a single mode with no stops. Thus if one
walks to the bus stop, catches the bus to town and walks to his/her
workplace, he/she has completed three trip legs (home-bus stop, bus stop 1
to bus stop 2, bus stop 2-work).
Trip leg departures consider the start time of a trip leg for a given purpose. Trip leg
arrivals consider when the trip leg ends. ‘Home-based’ departures and arrivals are made
to and from home, but a ‘home-based daily departure’ refers to the first trip leaving home

NATIONAL TRAVEL PROFILES PART A: DESCRIPTION OF DAILY TRAVEL PATTERNS
18
at the start of the day for a given purpose, while a ‘home-based arrival’ is any trip leg
that ends at home irrespective of the time of day (i.e. subsequent trip legs away from
home may be made).
2.7.3 Trip leg purpose
Each trip leg has a trip leg purpose and the trip legs contained in the ‘TR14’ database are
categorised by the ‘Tractiv’ column. This column provides details of what activity is done
at a trip leg destination. Fifteen activities (trip leg purposes) are listed:
• Home: This is used where the person is returning home or to a temporary place of
residence at the end of a trip leg.
• Work – main job: This indicates trip legs to work at a fixed work address. The
main job is the job at which most hours are worked.
• Work – other job: This is used to describe trip legs to a secondary or other job at
a fixed work address.
• Work – employer's business: This describes all work-related stops that are not
to a fixed work address. Employed or self-employed people without a fixed place of
work (e.g. plumber) are included in this category.
• Education: This includes travel as a student to institutions such as primary and
secondary schools, colleges of advanced education, technical colleges, universities
etc. This also includes school-related activities that are not at school, e.g. school
outings, school patrol or school sports in school time. Sports at the weekend or
after school are coded as ‘recreation’. This does not include trip legs to pre-school
care/education facilities, as these are considered to be ‘social visits’.
• Shopping: This describes any trip leg ending at premises which sell goods or hire
goods out for money. Premises which provide services only (e.g. solicitors, banks)
or repairs only (e.g. appliances or shoe repairs) should be coded as ‘personal
business/services’. Shopping is defined as any time the respondent enters a shop,
whether or not a purchase is made.
• Social welfare: This includes stops made at government agencies involved in
welfare, e.g. WINZ, guidance counsellors, employment offices, etc. and also
includes collecting pension or unemployment benefit cheques. In this report,
however, trips that fall under this definition are usually included in ‘personal
business/services’ unless otherwise stated.
• Personal business/services: This includes stops made to transact personal
business where no goods are involved, e.g. banks, hairdressers, laundromats,
libraries, veterinary surgeons and government offices other than social welfare
agencies (e.g. City Councils and voluntary work).
• Medical/dental: This includes any stop made for personal medical or dental
needs. Stops made by a respondent who is accompanying another person are
coded under the purpose of ‘accompany[ing] someone else’.
• Social visits: These include visits to a private home; visits to a non-private
dwelling (e.g. visiting a friend in hospital, visiting a friend staying in a hotel); pre-
school activities such as kindergarten, crèche, day-care, kohanga reo or nursery
school; and all entertainment activities occurring in a public or private place. Such

2. Background
19
entertainment activities include dining out, clubs, hotels, concerts, religious
meetings, and off-road driving or motocross. Walking or cycling for social purposes
involve exercise and are therefore coded as ‘recreational’.
• Recreational: This includes participation in sporting activities and travelling to
sporting or recreational activities (e.g. driving to the park to go jogging). It
excludes watching someone else play sport, which is a ‘social visit’; and off-road
driving or motorcycling, which are coded as ‘social visits’ as these have no exercise
component.
• Change mode: This records all cases where the purpose of the stop was to change
to another mode of transport.
• Accompany someone else: This is used in cases where the purpose of the travel
was to go somewhere for someone else's purpose. This is usually to pick up, drop
off or accompany another person (or persons) e.g. a parent who walks to school in
the afternoon to pick up their children.
• Left country: This is used where the respondent leaves New Zealand during the
travel days. Their travel while in New Zealand should be recorded but any travel
outside New Zealand is not part of the study and does not need to be recorded.
• Other: This covers any other trip leg purposes not defined by all the trip leg
definitions above.
2.7.4 Modes
The following definitions were used when defining modes:
• Trip legs made by motorbike (either as driver or passenger) were classified as
‘vehicle driver’ or ‘vehicle passenger’ rather than as cycling.
• For the analysis of motorised modes (see Chapter 9.4), buses and taxis were not
included. Motorised trip legs included trip legs as vehicle drivers or passengers only.
• Trip legs made by walking included skateboards, scooters, prams, tricycles and
children carried in backpacks, but mobility scooters and wheelchairs were classed
as ‘other’.
• Trips legs made by professional taxi and bus drivers as part of their work were
classified as ‘vehicle driver’ (with the purpose classified as ‘work – employer’s
business’) rather than as public transport.
• Emergency vehicles (e.g. ambulances, police cars) were classified as vehicles rather
than as a form of public transport.
• Public mode includes train, bus, ferry, plane and taxi.
• Private mode includes vehicle driver, vehicle passenger, bicycle and walking.

NATIONAL TRAVEL PROFILES PART A: DESCRIPTION OF DAILY TRAVEL PATTERNS
20
2.7.5 Trip chains
For some purposes, it is desirable to link travel into longer trip chains. For example, if one
drives from work to home but stops 200 metres from home to buy bread, this may be
considered as a single trip chain (work to home travel).
The current dataset does not permit the analysis of trip chains, but this work is being
done under a separate commission.
2.8 Uses of the NZHTS
The NZHTS provides detailed information on where individuals’ travel, distance, time and
purpose as well as what kinds of individuals are doing the travelling and their frequency of
travel. The Pedestrian Planning and Design Guide, published by LTNZ (2006), made use of
the 1997/98 NZHTS data to show the proportion of all walking trips categorised by
different trip purposes. Other important uses of the NZHTS that relate to travel profiles
may include:
• identifying changes in personal travel over time for different types of travel modes
and areas;
• understanding how individuals travel to different activities;
• examining travel among different age groups, gender and income categories of
individuals; and/or
• identifying travel demands at different time periods of the day, different days of the
week and for different travel purposes.

3. Literature review
21
3. Literature review
3.1 Introduction
A review of international literature on household travel surveys has been undertaken. The
principal aim of this was to consult valuable outputs that have been generated
internationally and that would assist in producing travel profiles in New Zealand. This
chapter summarises the basic survey methodologies that have been developed in
different countries and highlights some of the travel profile outputs that are pertinent to
this research. The most constructive travel surveys consulted were those of Britain,
Australia and the United States. The final subsection summarises several research
projects that have been undertaken in New Zealand, and places this topic in the context
of where further research in New Zealand’s travel profile may prove of value.
3.2 Great Britain
The continuous travel survey in Great Britain began in 1988. Field work is carried out
every month of the year so that weekly, monthly and seasonal variations in travel
patterns are fully monitored. The initial survey made use of data collected from 5050
household samples; subsequently, the number of households surveyed increased to
around 8300 households in 2006.
The sample sizes are drawn randomly each year. In general, the selected households are
informed by mail explaining the purpose of the travel survey. Those who respond are
followed up by ‘placement’ interviews that gather information about the household, its
individual members, household vehicles and long-distance journeys that household
members have recently made. A seven-day travel diary is then given to each of the
household members after the interview.
Households that have agreed to do the survey receive a reminder call prior to the
specified travel week, a mid-week checking call, and a subsequent pick-up call to collect
the travel records and check the information recorded with the informants.
In 2002, an experiment was undertaken by the British Ministry of Transport to examine
the effect of offering incentives to the selected sample. Each household was given a £5
voucher and a signed promissory note if all household members completed the placement
interview and a travel record. Hallar et al. (2005) state that ‘there was a significant and
large rise in response rate using a £5 incentive, caused primarily by a shift from partial to
full responses’. In 2003 and 2004 – after the incentives were employed – the response
rate was 60%, compared with a response rate of 54% in 2002.

NATIONAL TRAVEL PROFILES PART A: DESCRIPTION OF DAILY TRAVEL PATTERNS
22
In summary, the 2006 National Travel Survey (Department for Transport 2006) includes
the following sections that touched on personal and household travel profiles:
• Trends in personal travel: This section shows changes in personal travel from
1988 to 2006 including mean trips, distance and time travelled per person per year.
In addition, trends in distance travelled by mode are also illustrated.
• How people travel: This section provides details about how individuals travel in
Great Britain, using different modes. It also includes information about how far
people travelled and how many trips were made, by gender and age group.
• Why people travel: This section focuses on trip purpose, illustrating mean trips,
distance and time travelled per person per year by purpose, gender and age group.
• Social inclusion and accessibility: This section shows how income levels and
vehicle accessibility affects personal and household travel. It also shows personal
travel by ethnicity, and individuals’ frequency of bicycle use, public transport and
international flights. Moreover, the accessibility of bus services and local facilities is
also presented.
• Other factors affecting travel: This section shows some of the other factors that
affect travel, including car mileage, car occupancy, working at home and time of
day. Of most relevance in this section is travel by time of day, which identifies
morning and evening peak periods where the highest trip demands occur.
3.3 Australia
The New South Wales (NSW) household travel survey has been conducted annually since
June 1997. It is a continuous survey that covers the travel patterns of residents of the
Greater Sydney Metropolitan Region. Approximately 8500 people in 3500 households are
surveyed annually.
Households are chosen at random to participate in the survey and selected households
are notified by mail prior to the survey. Those who respond are given a travel diary that
collects information on all travel undertaken by all household members for a nominated
24-hour period. Subsequently, travel data are collected though face-to-face interviews.
The travel survey is voluntary. The response rate was 67% in 2006 (NSW Government
Department of Planning 2007).
The latest 2005 Household Travel Survey Summary Report (NSW Ministry of Transport
2007) contains the following sections that are relevant to this research:
• Purpose of travel: This section illustrates the annual proportion of trips and
distance travelled on weekdays or weekends, categorised by purpose.
• Mode of travel: This section focuses on an individual’s choice of travel mode. It
shows the annual number and proportions of trips categorised by mode on
weekdays and weekends.
• Purpose by mode: This section illustrates proportion of trips by purpose and mode
in 2005.
• Trip duration: This section illustrates mean trip duration by purpose and mode on
weekdays annually.

3. Literature review
23
• Time of day of travel: This section illustrates the number of people travelling,
categorised by time of day on weekdays and weekends. The proportion of
motorised trips categorised by purpose is also included in this section.
• Profile of travellers: This section compares the travel pattern of individuals
categorised by gender and age, and includes the proportions of trips categorised by
mode, gender and age group.
The 2005 Household Travel Survey Summary Report also includes tables showing the
different reasons in percentages for individuals travelling to work by public and private
modes on weekdays. The 2005 results indicate the top three reasons for travelling by
public transport:
• It avoids parking problems (48%).
• Some public transport users do not have a car (25%).
• Public transport is cheaper than private transport (24%).
On the other hand, those who travel to work by private transport do so because:
• they feel that their vehicle is faster (48%),
• public transport is unavailable/inaccessible (33%) and
• public transport is problematic (26%).
3.4 United States
The National Household Travel Surveys (NHTS) conducted in the US are discrete as
opposed to continuous. The first NHTS was conducted in 1969, followed by surveys in
1977, 1983, 1990 and 1995. The latest survey was undertaken in 2001. Samples were
selected by creating a random-digit dialling (RDD) list of telephone numbers. The sample
size includes 60 282 individuals from 26 038 households and represents 0.02% of the
population.
The data collection consists of three main phases:
• A household interview collected demographics and vehicle ownership data.
• A personal interview collected the travel data for all the one-way trips that were
taken during a designated 24-hour period. The designated travel day started at
0400h and ended at 0400h the next day.
• Two vehicle odometer readings were collected for each household vehicle. The first
was at or around the time of the personal interviews. The second was at least two
months later. The dates of each reading were recorded to facilitate the estimation
of annual mileage.
Cash incentives were offered to the selected households by including $5 in the pre-
interview letter and $2 in the travel diary mailing. The overall response rate in 2001 was
only 41% (FHWA 2004).
The 2001 NHTS report Summary of Travel Trends (Hu 2004) details the United States
travel profiles extensively, covering the following sections:

NATIONAL TRAVEL PROFILES PART A: DESCRIPTION OF DAILY TRAVEL PATTERNS
24
• Travel and demographic summary: This section is a summary of travel trends of
the individual NHTS that were undertaken in the previous years, including 2001.
• Household travel: This section focuses on household travel profiles. Of relevance
are the mean annual person miles travelled, person trips and trip distance
categorised by the trip purpose. Trips per household categorised by household
income are also presented in this section.
• Person travel: This section provides information on personal travel profiles
covering trip distance, time and mean number of trips, categorised by purpose,
gender and mode.
• Private vehicle travel: This section focuses on vehicle travel, showing mean
distance, time spent in vehicle per person and mean vehicle occupancy for selected
trip purposes.
• Commute travel patterns: This section compares vehicle commuting trips by
year looking at annual commuting trips per worker. It also illustrates the proportion
of commuting trips by usual mode, and mean commute trip distance, trip time and
speed in different years.
• Temporal distribution: This section shows distribution of person trips, categorised
by trip purposes and the start time of the trip.
3.5 New Zealand
The previous NZHTSs, undertaken in 1989/90 and 1997/98, have resulted in the
publication of New Zealand Household Travel Survey (Ministry of Transport 1990) and The
New Zealand Travel Survey – 1997/1998 (Land Transport Safety Authority 2000)
respectively. The survey procedures for these discrete surveys are equivalent to the
current continuous NZHTS procedure, as mentioned earlier. The full response rate from all
household members for the 1997/98 travel survey was 74.9%.
LTSA (2000) provides detailed tables and plots showing New Zealanders’ travel profiles in
the ‘Travel’ section. The section contains the following areas that are relevant to this
research:
• Comparing travel modes: This includes trips and distance travelled by mode and
overall purpose; trips by mode, categorised by gender and age groups; and trip
distance and duration by mode, categorised by duration and distance intervals.
• Time of day and day of week (all drivers and motorcycle riders): This
includes distance driven by day of week and hour of day.
• Trips by private modes (i.e. vehicle driver, vehicle passenger, walking and
cycling): This includes trips and distance travelled by age groups and gender, trip
distance per trip categorised by age groups and gender, and total annual distance
and time travelled categorised by age groups for the 1989/90 and 1997/98
comparison.
• Trips by public modes (i.e. bus and taxi trips): This includes trips and distance
travelled, categorised by age groups.

3. Literature review
25
• Urban and rural residents: This includes comparisons between urban and rural
areas of trips per year by mode, percentage of trips by purpose, and distance and
hours spent travelling per person per week by mode.
• Regional analysis: This includes trips; annual distance travelled by mode,
categorised by region; and annual kilometres travelled per person as a vehicle
driver, passenger or cyclist, categorised by region.
O’Fallon & Sullivan (2005) used the 1997/1998 New Zealand Household Travel Survey
database to derive ‘trip chains’ and ‘tours’ to understand New Zealanders’ travel
behaviour. O’Fallon & Sullivan (2005) define a trip chain as:
a series of one or more segments [trip legs] defined by starting a new chain
whenever:
• The segment [trip leg] is the first one recorded in the respondent’s travel
diary (excluding trip legs by plane).
• The starting point of the segment [trip leg] is home or their workplace.
• The origin of the trip is neither home nor work, but the respondent has been
at that location for more than 90 minutes (and the purpose of the
immediately preceding segment [trip leg] was not change mode).
On the other hand, O’Fallon & Sullivan (2005) define a ‘tour’ as ‘a series of segments [trip
legs] that start from home and ends at home’. The authors class tours into ten different
types, as shown in Table 3.1.
Table 3.1 Classes of tours used by O’Fallon & Sullivan (2005).
Tour description Sequencea
Simple work hb–wc–h
Multi-part work h–w–(–w–)–w–h Composite to work h–nwd/ee–(nw/w/e)–w–h Composite from work h–w(–nw/w/e)–nw/e–h Composite to and from work h–nw/e–(nw/w/e)–w–(nw/w/e)–nw/e–h Composite at work h–w–(nw/w/e)–nw/e–(nw/w/e)–w–h Simple/multi-part education h–e–(e)–h Composite education and non-work h–nw–e–(nw)–h and h–(nw)–e–nw–h Simple non-work/non-education h–nw/ne–h Multi-part non-work/non-education h–nw/ne–nw/ne–(-nw/ne-)–h Notes to Table 3.1: a The bracketed terms represent additional trips that may be in the tour. b h = home c w = work d nw = non work (including personal business, shopping and leisure/recreational purposes) e e = education
Given the definition of a ‘trip chain’, 124 089 trip legs contained in the 1997/98 database
were aggregated into 65 077 trip chains. The trip chain analysis revealed the following
key points:
• On average, an individual travels 2.3 trip chains per day, compared with 4.4
segments (trip legs) per day.
• Nearly half (48.3%) of all trip chains consist of one segment (trip leg). On average,
a trip chain consists of 1.9 segments (trip legs).

NATIONAL TRAVEL PROFILES PART A: DESCRIPTION OF DAILY TRAVEL PATTERNS
26
• Ninety percent of all trip chains use a single mode of transport, and trips made as a
‘vehicle driver’ make the highest proportion (48%) of all the modes used within a
trip chain.
• Of the trip trains with ‘vehicle driver’ as the main mode, 42% have a total trip chain
distance of greater than 6 km.
• For all modes of travel, trip chains by ‘subsistence’ (work or education),
‘maintenance’ (personal business, shopping, etc.) and ‘discretionary’ (social,
recreational, leisure) occur in fairly equal proportions, 24%, 21% and 24%,
respectively.
Similarly, 37 565 ‘tours’ were validated from the database. The ‘tours’ analysis shows
that:
• on average, an individual travels 1.3 tours per day;
• 56% of the tours have two trip chains in each tour;
• 66% of the tours are non-work/non-education tours and 23% are for work
purposes;
• 84% of all tours use a single mode, with ‘vehicle driver’ accounting for the highest
proportion of all the modes used within a tour (47%);
• more than 28% of all tours are less than 4 km in distance and over 50% of all tours
are less than 10 km in distance;
• the proportion of tours made as a ‘vehicle driver’ in Wellington (40.5%) is relatively
lower than in Auckland (45.8%) and Christchurch (44.2%). On the other hand,
Christchurch has higher proportions of cycling tours (3.8%) than Wellington and
Auckland (3.2% and 1.9%, respectively);
• individuals make higher proportions of shorter trips (up to 1.99 km) in
Christchurch, (14.7%) compared with Auckland (10.9%) and Wellington (12.9%).
O’Fallon & Sullivan (2003) also used the 1997/98 NZHTS to investigate the weekday and
weekend travel patterns for three main urban centres (Auckland, Wellington and
Christchurch).
Key points revealed from the weekday and weekend analysis include:
• Sundays have the lowest trip legs (3.6 trip legs/person) compared with weekdays
and Saturdays (5.2 and 4.4 trips legs/person, respectively).
• Fridays have the highest number of trip legs per person (5.8). Individuals travel
less on Sundays, making only 3.6 trip legs per person.
• The proportion of trip legs made for a work purpose is higher on weekdays
compared with weekends. On the other hand, proportions of social/recreational and
shopping trip legs are higher in the weekend compared with weekdays.
• Over 50% of weekend trips depart between 0900 and 1500, while just over 37% of
weekday trips occur during this period.
• The proportion of trip legs made as a ‘vehicle driver’ are relatively lower on
Sundays (43.1%) compared with weekdays (48.3%) and Saturdays (48.1%).
• The proportion of trip legs made by public transport (bus and train) and walking are
relatively higher on weekdays compared with weekends.

3. Literature review
27
• A higher proportion of trip legs are made as a ‘vehicle passenger’ on the weekends.
• Wellington has a higher proportion of trip legs made by public transport (bus and
train) and walking on weekdays compared with Auckland and Christchurch. This
also explains why the proportion of trip legs by ‘vehicle driver’ and ‘vehicle
passenger’ is relatively lower in Wellington.
3.6 Summary
The literature reviewed in this section has a twofold function. Primarily, it provides
supplementary information regarding travel patterns within New Zealand and around the
world. Additionally, it operates as a control on the methodology used in the NZHTS as
well as in the analysis of the data collected. By consulting outputs generated
internationally, we were able to ensure that both the survey and subsequent analysis of
the results were in line with international methods for investigating travel behaviour. This
results in high quality information upon which transport planning decisions can be made.

NATIONAL TRAVEL PROFILES PART A: DESCRIPTION OF DAILY TRAVEL PATTERNS
28
4. Personal travel
4.1 Introduction
Tables and charts in this chapter show the personal travel profiles for all travel surveyed
between 2003 to 2006 in different areas. The analysis includes all areas, MUAs, SUAs and
RAs. The personal travel profiles included are:
• mean trip leg distance, trip leg time and number of trip legs/person/day; and
• proportion of trip legs by categorised by private and public modes.
Trip leg distances used in the travel profiles were calculated by mapping the quickest
route (or via a given waypoint) between origin and destination. Trip leg distances were
calculated for road-based modes only; these modes were vehicle driver, vehicle
passenger, bicycle, bus and taxi.
4.2 Mean trip leg distance and time, and number of trip legs per person
The distance, number of trip legs and mean trip leg time travelled per person per day
categorised by area are presented in Table 4.1. The mean number of trip
legs/person/day, mean trip leg distance and mean trip leg time are illustrated in
Figures 4.1 to 4.3.
The analysis of the mean trip leg distance, trip leg time and the number of trip
legs/person/day shows that:
• The mean amount of trip legs /person/day for all areas is around 4.4 trip legs.
• SUAs have the highest mean amount of trip legs /person/day, with 4.7 trip legs.
• RAs have a mean trip leg distance of about 13 km per trip leg. This reflects the
remoteness from origin to destination in rural areas.
• SUAs have the lowest time per trip leg (13.4 min) compared with other area types.
This reflects less congestion than MUAs and shorter trip lengths than in RAs.

4. Personal travel
Table 4.1 Mean trip leg distance, trip leg time and amount of trip legs/person/day, categorised by area.
Area Distance travelled/person
/day (km)*
Trip legs/ person/day
Time travelled /person
/day (min)
Mean trip leg
distance
Mean trip leg time
(min)
Unweighted sample size
(people)
All 35.6 4.4 67 9.7 15.3 12 698 MUA 32.1 4.5 69 8.7 15.4 7645 SUA 39.1 4.7 63 9.4 13.4 1189 RA 44.5 4.0 64 13.0 16.0 3864
* Only includes vehicle passenger, vehicle driver, bicycle and bus and taxi trip leg distances.
Figure 4.1 Mean trip legs/person/day, categorised by area.
29

NATIONAL TRAVEL PROFILES PART A: DESCRIPTION OF DAILY TRAVEL PATTERNS
Figure 4.2 Mean trip leg categor area. distance, ised by
Figure 4.3 Mean trip leg time, categorised by area.
30

4. Personal travel
31
4.3 Proportion of trip legs taken by private and public modes
The proportions of trip legs made by modes, categorised by area, are presented in
Table 4.2. The proportion of trip legs taken by selected private and public transport
modes are illustrated in Figures 4.4 and 4.5, respectively. These show the selected mode
as a proportion of total trip legs by all modes.
The analysis of the proportions of trip legs taken by selected private and public transport
modes shows that:
• Travel mode as a ‘vehicle driver’ has the highest trip leg proportion, accounting for
over 50% of all trip legs taken from 2003 to 2006 in all area types.
• The proportion of ‘vehicle driver’ trip legs in SUAs is 58%, which is relatively higher
compared with 53% and 56% in MUAs and RAs, respectively.
• The proportion of walking trips legs in MUAs is 16%, which is relatively higher
compared with 11% and 14% in SUAs and RAs, respectively.
which is relatively higher compared with 2.4% and 0.8% in MUAs and SUAs,
respectively. This is possibly because in SUAs and RAs, bus trip legs are more inter-
taking the bus to school.
Table 4.2 The proportions of trip legs made by modes, categorised by area.
• In terms of public modes, the proportion of trip legs made by bus in RAs is 2.9%,
town/regional, and probably reflects the high proportion of rural school children
Trip leg proportion Mode description
All areas MUAs SUAs RAs
Walk 15.5% 16.5% 11.3% 13.7%
Vehicle driver 54.1% 53.0% 58.5% 56.1%
Vehicle 24.9% passenger 25.5% 25.5% 26.9%
Bicycle 1.4% 1.2% 1.9% 1.8%
Bus 2.4% 2.4% 0.8% 2.9%
Train 0.3% 0.3% 0.1% 0.1%
Taxi 0.4% 0.5% 0.4% 0.2%
Other* 0.5% 0.6% 0.3% 0.4%
Total 100% 100% 100% 100% Unweighted trip legs (all modes) 108 482 67 589 10 775 30 097 * The ‘other’ category may include trips by train, ferry, plane and mobility scooter, as well
as trips which were classified as ‘other’ on the survey forms. These may include travel by boat, horse, electric wheelchairs etc.

NATIONAL TRAVEL PROFILES PART A: DESCRIPTION OF DAILY TRAVEL PATTERNS
Figure 4 The proportions of trip legs made by private transport modes, categorise 4. d by area.
Figurearea.
4.4
his chapter has provided details about how New Zealanders travel in different areas and
reg Highlights of the analysis by different area types and regions include:
Overall, the mean number of trip legs /person/day for all areas is around 4.4 trip
legs; and
Trips where the mode was ‘vehicle driver’ have the highest trip leg proportion,
accounting for over 50% of all trip legs taken on a national basis.
4.5 The proportions of trip legs made by public transport modes, categorised by
Summary
T
ions.
•
•
32

5. Travel mode
33
Intro n
This chapter prov tails about how residents of New Zealand travelled using different
rt modes 2003 and 6. It also shows the individu hoice of trave
fyi rent area t and days of the week. In a on, the number of
ip legs made pe n by memb fferent age groups and genders are also
shown. It is noted trip leg is a bitrary unit on stops; every trip le
represents a new purpose or oppor for mode ch .
l figures and he categor ’ may incl trips by tr ferry, plane
ty scooter, as well as trips which were classified as ‘other’ on the survey forms
(these may include travel by boat, horse, electric whe rs etc.).
ip l erson/ , mean distance and time by mode and area
The number of trip legs/person/day, total travelling time/person/day and the mean trip
leg distance and duration, categorised de of travel are presented in
e 5.1. The number of trip legs/pers n/day by mode and area are ill n
1. Figure 5. ws the mean trip duration by mode and area, while Figure 5.
shows the mean trip distance by mode and area.
lysis of the ber of trip le erson/day an e mean trip g distance, as
, sho s that:
• The number rip legs/person ay made as a ‘ hicle driver’ substantially
higher compared with other travel modes. On average, an individual travels 2.4 trip
legs per day as a vehicle driver nationally.
• The amount of trip legs/person/day made as a ‘vehicle driver’ and ‘vehicle
passenger’ are 2.8 and 1.3 trip legs, respectively, in SUAs. This is a relatively
higher number of trips than reported in other area types.
• Individuals in As travel mo ip legs by walk g compared h other area
On average, an individual travels 0.7 tri s per day by walking in MU
g duration in odes (16 mi utes) compar
with SUAs (13 minutes) and MUAs (15 minutes).
• Similarly, RAs have the highest mean trip leg duration and distance for ‘vehicle
driver’ and ‘vehicle passenger’ compared with other area types.
5. Travel mode
5.1 ductio
ides de
transpo between 200 al c l
mode by identi ng diffe ypes dditi
tr r perso ers of di
that a n ar based not g
tunity oice
In al tables, t y ‘other ude ain, and
mobili
elchai
5.2 Tr egs/p day
by mo and area,
Tabl o ustrated i
Figure 5. 2 sho 3
The ana num gs/p d th le
categorised by the mode of travel w
of t /d ve is
MU re tr in wit
types. p leg As.
• RAs have the highest mean trip le all m n ed

NATIONAL TRAVEL PROFILES PART A: DESCRIPTION OF DAILY TRAVEL PATTERNS
34
Table 5.1 The number of trip legs/person/day, total travelling time/person/day and the mean trip leg distance and time, categorised by mode of travel and area
Mode description*
Unweighted trip legs
Trip legs/person/day
by mode
Mean trip leg length
(km)
Mean trip duration
(min)
Total travelling time/day/person
(min)
Area: All
Walk 16 530 0.7 – 12 8.1
Vehicle driver 58 239 2.4 9.1 15 35.1
Vehicle passenger 28 384 1.1 11.2 17 18.5
Bicycle 1901 0.1 2.8 15 0.9
Bus 2200 0.1 11.7 27 2.9
Taxi 442 0.02 7.4 17 0.3
Other 786 0.03 - 196 1.4
All modes 108 482 4.4 9.7 15 67.2
Area: MUA
Walk 11 066 0.7 – 12 9.0
Vehicle driver 35 326 2.4 8.1 15 35.4
Vehicle passenger 17 768 1.1 10.0 16 18.8
Bicycle 1065 0.1 3.0 16 0.9
Bus 1422 0.1 9.8 26 2.8
Taxi 353 0.02 7.5 17 0.3
Other 589 0.04 – 193 1.6
All modes 67 589 4.5 8.7 15 68.8
Area: SUA
Walk 1374 0.5 – 13 6.9
Vehicle 32.7 driver 6182 2.8 8.3 12
Vehicle passenger 2851 1.3 11.4 15 19.4
Bicycle 216 0.1 1.7 11 1.0
Bus 76 – – – –
Taxi 42 – – – –
Other 34 – – – –
All modes 10 775 4.7 9.4 13 63.1
Area: RA
Walk 4090 0.5 – 11 6.1
Vehicle driver 16 710 2.2 12.4 16 34.8
Vehicle passenger 7765 1.0 15.1 18 17.4
Bicycle 620 0.1 2.5 15 1.1
Bus 702 0.1 14.1 30 3.4
Taxi 47 – – – –
Other 163 0.02 – 199 0.8
All modes 30097 4.0 11.2 16 63.6 * Estimates could not be made in categories where the number of trip legs sampled was less
than 120.

5. Travel mode
Figure 5.1 The mean number of trip legs/person/day, categorised by mode of travel and area.
Figure 5.2 The mean trip leg duration, categorised by mode of travel and area.
35

NATIONAL TRAVEL PROFILES PART A: DESCRIPTION OF DAILY TRAVEL PATTERNS
ip leg distance d by mo of travel an rea.
5.3 Proportion of trip legs/person/day by age, gender and mode
porti le
n Table 5.2. The numbers of trip legs/person/day are illustrated in
.4; F re sho the p le istance travelle y
lysis of the travel profile between people of different age groups and genders
that:
• The number of trip legs/person/day broadly increases from ages 5–9 until 40–49,
after w g c g e n v p er per bro
increases from age 10–14 0 an en re a t ge 9.
p un e of fe s make more t g av e m of t
same age gr . B nd ma ma es.
• Males travel f er es era g 39 km per day compared with 32
km for fema
Children aged 14 and und ak ve % e p l as icle
passe t a o r t g made on
foot. M s a fem s 14 and under have the same vehi pa ger d
lking mode use.
Figure 5.3 The mean tr , categorise de d a
The pro ons of trip gs/person/day, as categorised by age, gender and mode of
travel, are shown i
Figure 5
igu 5.5 ws tri g d d per person per da .
The ana
shows
hich, it be ins de reasin . Th dista ce tra elled er p son day adly
to 4 –49 d th dec ases bove he a of 4
• U til th age 50, male rip le s on erag than ales he
oup eyo 50, les ke more trip legs than femal
22% urth than femal , av gin
les.
• er m e o r 50 of th ir tri egs veh
ngers, with he m jority f the emainder of their rip legs bein
ale nd ale cle ssen an
wa
36

5. Travel mode
37
Table 5.2 The weighted proportions of trip legs/person/day, categorised by age, gender and mode of travel.
Mode 0–4 5–9 10–14 15–19 20–24 25–29 30–39 40–49 50–64 65+ All
ages
All people
All ages (Trip legs/
person/day)
Walk 12% 16% 26% 25% 20% 16% 13% 11% 13% 18% 16% 0.7
Vehicle driver 0% 0% 0% 30% 56% 60% 72% 75% 71% 59% 54% 2.4
Vehicle passenger 87% 76% 59% 35% 17% 19% 11% 11% 13% 20% 25% 1.1
Bicycle 0% 3% 7% 2% 0% 1% 1% 1% 1% 1% 1% 0.1
Bus 0% 4% 7% 6% 5% 2% 1% 1% 1% 1% 2% 0.1
Taxi 0% 0% 0% 1% 1% 1% 0% 0% 0% 1% 0% 0.02
Other 0% 1% 1% 2% 1% 1% 1% 1% 1% 1% 1% 0.03
All modes 100% 100% 100% 100% 100% 100% 100% 100% 100% 100% 100% 4.4
Distance travelled/day (km)* 26 25 25 27 35 37 41 49 45 22 36 All trip legs (trip legs/ person/day) 3.3 3.4 3.7 3.9 4.6 4.7 4.9 5.2 5.0 3.4 4.4 Unweighted sample size (people) 885 905 942 846 730 671 1781 1873 2169 1897 12699
Males
Walk 13% 14% 24% 22% 16% 15% 11% 9% 10% 17% 13% 0.6
Vehicle driver 0% 0% 0% 37% 65% 67% 79% 83% 81% 72% 61% 2.7
Vehicle passenger 86% 75% 58% 31% 14% 13% 6% 5% 6% 8% 20% 0.9
Bicycle 0% 4% 10% 3% 1% 1% 2% 1% 1% 1% 2% 0.1
Bus 0% 5% 7% 5% 3% 3% 1% 1% 1% 1% 2% 0.1
Taxi 0% 0% - 1% 1% 1% 0% 0% 0% 0% 0% 0.02
Other 0% 1% 1% 2% 1% 1% 1% 1% 1% 0% 1% 0.04
All modes 100% 100% 100% 100% 100% 100% 100% 100% 100% 100% 100% 4.4
Distance velled/day
(km) 23 23 24 27 36 43 47 57 53 25 39 tra
All trip legs (trip legs/ person/day) 3.3 3.2 3.5 3.8 4.7 4.5 5.1 5.2 5.3 3.8 4.4 Unwe
( 1059 848 6105
ighted sample size people) 444 462 479 434 347 304 823 905
Females
Walk 10% 18% 27.2% 27.4% 25% 18% 16% 13% 15% 20% 18% 0.8
Vehicle dr1
iver 0% 0% 0% 23% 46% 55% 65% 67% 61% 45% 47% 2.
Vehicle passenge 21% 24% 16% 17% 20% 31% 31% 1.4 r 89% 77% 61% 39%
Bicycle 0% 1% 4% 1% 0% 1% 1% 1% 1% 0% 1% 0.04
Bus 0% 3% 8% 8% 7% 2% 1% 2% 1% 2% 3% 0.1
Taxi 0% 0.02 0% 0% 0% 1% 1% 0% 0% 0% 0% 1%
Othe03
r 0% 0% 1% 2% 1% 1% 0% 1% 1% 1% 1% 0.
All Modes 4.4 100% 100% 100% 100% 100% 100% 100% 100% 100% 100% 100%
Distance travelled 32 30 27 25 29 33 32 36 43 37 20 All trip leg(trip legs/
on/day) 3.2 3.5 3.8 4.1 4.6 4.8 4.8 5.2 4.8 3.1 4.4
s
persUnweighted sample size (people) 441 443 463 412 383 367 958 968 1110 1049 6594
* Distance travelled per day only includes vehicle passenger, vehicle passenger, bicycle, bus and taxi trip leg distances.

NATIONAL TRAVEL PROFILES PART A: DESCRIPTION OF DAILY TRAVEL PATTERNS
Figure 5.4 The number of trip legs/person/day, categorised by age group and gender.
Figure 5.5 Distance travelled per person per day, categorised by age group and gender.
38

5. Travel mode
39
e trip legs categorised by age
an
• ortion of their trip legs as vehicle drivers
• tion of trip legs made as vehicle drivers increases with age to a peak of
83% among males in the 40–49 age group and 67% among females of the same
age group. The peaks decline after this age group.
• The proportion of trip legs made as vehicle passengers decreases with age to a
lowest proportion of 5% among males in the 40–49 age group and 16% among
females in the 30–39 age group. The lowest trip leg proportion for all people as
vehicle passengers occurs in the 40–49 age group.
It should be noted that the trip leg proportions of car drivers and passengers do not add
to 100% as other modes make up the difference, and sometimes, vehicle drivers make
trip legs without carrying passengers.
Analysis of the proportions of the mean amount of vehicl
d gender, as illustrated in Figure 5.6, shows that:
On average, males make a higher prop
compared with females (61% as opposed to 47%). Linked to this, females make a
higher proportion of their trip legs as a vehicle passenger compared with males
(31% compared with 20%).
The propor
Figure 5.6 The proportion of the mean amount of vehicle trip legs, categorised by age and gender.

NATIONAL TRAVEL PROFILES PART A: DESCRIPTION OF DAILY TRAVEL PATTERNS
Figure 5.7 shows that with regards to walking trip legs:
• On average, females make higher proportion of their trip legs by walking compared
with males (18% compared to 13%).
40
age
• The proportion of trip legs made by walking increases with age to a peak of 27%
among females in the 15–19 age group and 24% among males in the 10–14age
group. This trend declines after these age groups and then increases after the
of 40–49.
Figure 5.7 The proportion of walking trip legs, categorised by age and gender.

5. Travel mode
41
make a higher proportion of their trip legs by cycling compared
•
ales in the same age
Figure 5.8 shows that with regards to cycling trip legs:
• On average, males
with females (2% compared to 1%).
The proportion of trip legs made by cycling increases with age to a peak of 10%
among males in the 10–14 age group and 4% among fem
group. This peak declines rapidly after these age groups and then fluctuates
between 0.5% and 1.8% for both genders.
Figure 5.8 The proportion of cycling trip legs, categorised by age and gender.

NATIONAL TRAVEL PROFILES PART A: DESCRIPTION OF DAILY TRAVEL PATTERNS
42
Figure 5.9, which illustrates the proportion of trip legs made by bus, categorised by age
nd
at
• The proportion of trip legs made by bus increases with age to a peak of around 8%
his declines rapidly after this age group (when the legal driving age is
and ge er, shows that:
• On average, females make a higher proportion of their trip legs by bus (3%)
compared with males (2%). This difference is minor, although it still shows th
females are more likely to make a trip leg using the bus.
among females in the 10–14 age group and 7% among males in the same age
group. T
reached) and levels off below 2% after the 25–29 age group.
Figure 5.9 roportion of publ nsport trip legs, catego by age and gender. The p ic tra rised

5. Travel mode
43
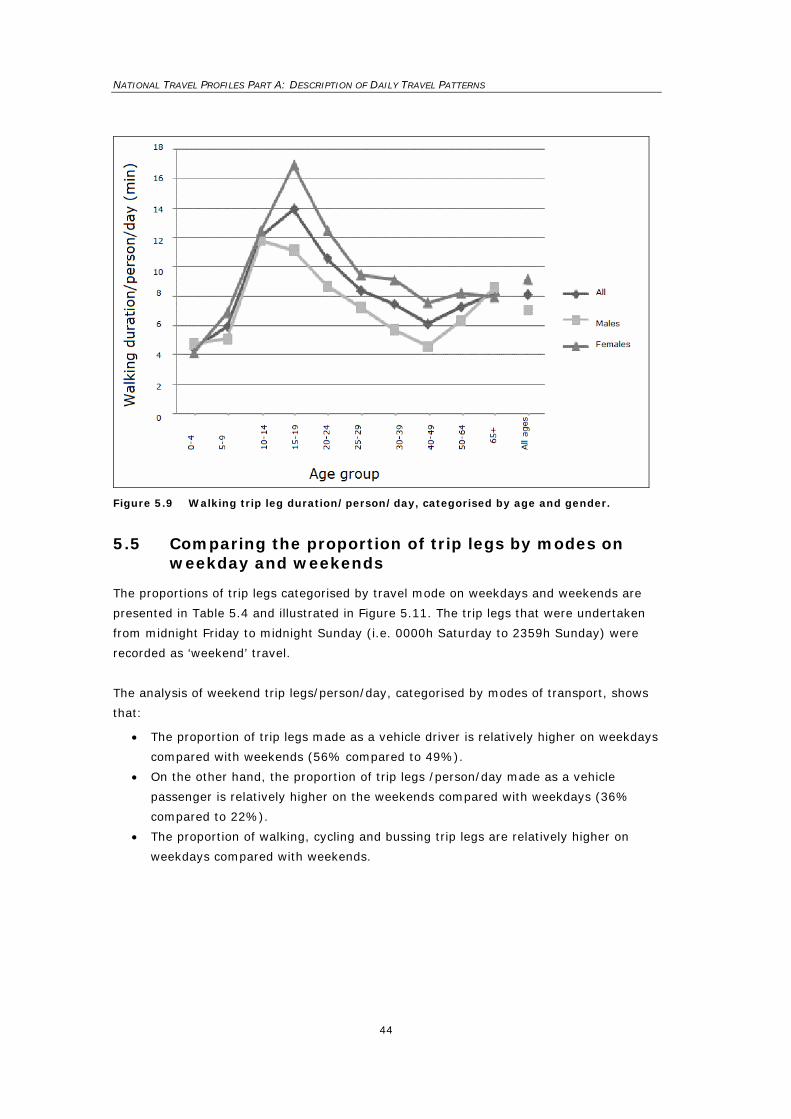
5.4 Walking trip leg duration by age and gender
n
Table 5.3 and illustrated in Figure 5.10. The surveys provide walking times but not
g d
The analysis of walking trip leg duration/person/day, categorised by age and gender,
7.1 minutes/person/day).
• The walking trip leg duration /person/day increases with age to a peak of
in the 10–14 age group. This trend declines after this age and then increases from
the age of 50 onwards
s (i.e. those over the legal
Table 5.
Walking trip leg duration/person/day, categorised by age and gender, is presented i
walkin istances so ‘walking trip leg’ distances are not recorded in this analysis.
shows that:
• On average, females spend more time walking per day compared with males
(9.2 minutes/person/day compared to
17 minutes among females in the 15–19 age group and 11.8 minutes among males
• People aged 40–49 (males and females) walked for the shortest amount of time per
person per day compared with other adult age group
driving age of 16).
3 Walking trip leg duration/person/day, categorised by age and gender.
Age group Unweighted sample
size (people) Walking duration/person/day
(min) All people
0–4 885 4.5 5–9 905 6.0 10–14 942 12.1 15–19 846 13.9 20–24 730 10.6 25–29 671 8.4 30–39 1781 7.5 40–49 1873 6.1 50–64 2169 7.3 65+ 1897 8.2 All 12 699 8.1 Males 0–4 444 4.8 5–9 462 5.1 10–14 479 11.8 15–19 4 11.34 1 20–24 347 8.7 25–29 3 7.3 04 30–39 8 5.7 23 40–49 905 4.6 50–64 1059 6.3 65+ 84 8.6 8 All 6105 7.1 Females 0–4 44 4.2 1 5–9 4 6.43 9 10–14 463 12.5 15–19 4 1712 .0 20–24 383 12.5 25–29 367 9.5 30–39 958 9.1 40–49 968 7.6 50–64 1110 8.3 65+ 1049 8.0 All 6594 9.2
NATIONAL TRAVEL PROFILES PART A: DESCRIPTION OF DAILY TRAVEL PATTERNS
44
Figure 5.9 Walking trip leg duration/person/day, categorised by age and gender.
5.5 Comparing the proportion of trip legs by modes on weekday and weekends
The proportions of trip legs categorised by travel mode on weekdays and weekends are
presented in Table 5.4 and illustrated in Figure 5.11. The trip legs that were undertaken
from midnight Friday to midnight Sunday (i.e. 0000h Saturday to 2359h Sunday) were
recorded as ‘weekend’ travel.
The analysis of weekend trip legs/person/day, categorised by modes of transport, shows
that:
• The proportion of trip legs made as a vehicle driver is relatively higher on weekdays
compared with weekends (56% compared to 49%).
• On the other hand, the proportion of trip legs /person/day made as a vehicle
passenger is relatively higher on the weekends compared with weekdays (36%
compared to 22%).
• The proportion of walking, cycling and bussing trip legs are relatively higher on
weekdays compared with weekends.

5. Travel mode
45
Table 5.4 The proportion of trip legs, categorised by mode, on weekdays and weekends.
Proportion of trips Mode
Weekdays Weekends
Walk 17% 12%
Vehicle driver 56% 49%
Vehicle passenger 22% 36%
Bicycle 2% 1%
Bus 3% 1%
Taxi 0.3% 1%
Other 1% 1%
All modes 100% 100% Number of trip legs (unweighted) 80 188 28 294
Figure 5.11 The proportion of trip legs by mode on weekdays and weekends.

NATIONAL TRAVEL PROFILES PART A: DESCRIPTION OF DAILY TRAVEL PATTERNS
46
5.6 Walking duration by purpose in MUAs
tile, 15th p mean walking duration by purpose in MUA for all
trip leg arrivals and for home-based trip leg a iva e presented able 5.5 a
Figure 5.12. Walk rip legs from a l the trip leg arr ls include trip s
home-based, such as arrivals from ‘work – main job’, ‘social/recreati
edical/dental’. Home-bas lking trip leg urations are ca lated using the st
hat the individuals m t the start of day leaving h e. Those trip l
y people who returned home at some poi and then wen t again have n
d in this analysis.
t out tha pondents we rompted to in e all walking t
along a lic road or footpath, or where ad was crosse
very s trip legs migh end to be unde reported. Trip le
were eligible for the survey if they met these criteria.
rs were trained to probe for this information.
lysis of walking trip leg durations, categorised by purpose for home-based arrivals
ws that:
Recreational trip legs have the highest mean walking durati n average, an
dual will walk 17 mi recreational trip leg arri ls, and 18 mi
-based recreational arrivals.
•
).
•
is because trip leg purpose by ‘work’ includes
other short walking distance trip legs such as walking from the bus stop or a stop to
work. This therefore reduces the mean for ‘work’ walking trip leg duration.
The 85th percen ercentile and
rr ls ar in T nd
illustrated in ing t l iva leg
that may not be on’
or ‘m ed wa d lcu fir
trip leg t ake a the om egs
made b nt t ou ot
been include
It is important to poin t res re p clud rip
legs of 100 m or more pub a ro d. In
practice, it is likely that
from a car park to work
hort t t r- gs
Interviewe
The ana
in MUAs, sho
• on. O
indivi nutes for all va nutes
for home
Trip legs made to ‘change mode’ have the lowest mean walking duration
(8 minutes
The ‘work (HB)’ category has a higher walking trip leg duration (16 min) compared
with trip leg purpose by ‘work’. This

5. Travel mode
47
Table leg dura in MUAs. 5.5 Walking trip tion by purpose
Walking t durarip leg tion (min) Trip leg purpose
Unweighted sample size (trip legs) 15th %ile Mean 85th %ile
Ch ge modan e 1518 2 8 10
Change mode (HB 332 2 6 10 a)
Workb 1209 2 9 15
Work (HB) 151 5 16 30
Shopping 1462 2 10 16
Shopping (H 283 5 12 20 B)
Accompany someone else 528 2 11 20
Ac(HB
company someone else )
146 5 12 21
Personal business/services 11 15 462 2
Person busine(HB) c
al ss/services 83 – – –
Social visits 1166 3 11 20
Social visits (HB) 16 30 144 3
Education 679 4 14 21
Educa B)tion (H 352 5 16 25
Home 2862 4 15 25
Recreational 370 5 17 30
Recreational (H 339 5 18 30 B)
a HB indb ‘work’ i
businec Estima ness and services (HB)’ cannot be made because the number of
trips l
icates a home-based arrival. ncludes trip legs for ‘work – main job’, ‘work – other job’ and ‘work – employer’s ss’. tes for ‘personal busi
egs sampled was less than 120.

NATIONAL TRAVEL PROFILES PART A: DESCRIPTION OF DAILY TRAVEL PATTERNS
Figure 5.12 Walking trip leg duration by purpose in MUAs.** Estimates for ‘personal business and services (HB)’ cannot be made because the number
of trips legs sampled was less than 120.
5.7 Cycle duration by purpose in MUAs
The 85th percentile, 15th percentile and mean cycling duration by purpose in MUAs for
‘home’ and ‘work’ trip leg arrivals are presented in Table 5.6. It is noted that cycling
duration by other trip leg purposes apart from ‘home’ and ‘work’ cannot be made because
the number of trip legs for those purposes was less than 120.
Table 5.6 shows that, on average, a person takes about 14 minutes to cycle to work in
MUAs. The mean cycling duration arriving home from all origins is about 16 minutes.
Table 5.6 Cycling trip leg duration by purpose in MUAs.
Duration (min) Trip leg purpose
Unweighted sample size (trip legs) 15th %ile Mean 85th %ile
Home 386 5 16 25
Work* 263 4 14 23 * ‘Work’ includes trip legs for ‘work – main job’, ‘work – other job’ and ‘work – employer’s
business’.
48

5. Travel mode
49
5.8 Summary
7 shows the propo p legs by mode of travel for the whole country. Some
• Individuals make approximately 80% of all trip legs per person per day as
ge
ntil the
• Trip legs made as a vehicle driver continue to make up the highest proportion
nd
ales
Table 5
er’ category may include trip leg by trains, ferr lanes, taxis scooters, as w as trips which wer assified as ‘other’ on the survey forms ay include t y boat, horse ic wheelchairs
Table 5. rtion of tri
other key conclusions include:
vehicle drivers and vehicle passengers. Nationally, these amount to an
average of 3.5 trip legs per person per day.
• Individuals in the 40–49 age group make more trip legs as vehicle drivers per
day than any other age group.
• The use of public transport rises steeply for males and females from 5–14
years, reaching over 7 % of all trip legs. Then males’ public transport usa
reduces rapidly, while females continue high use of public transport u
age of 25–29.
of personal trip legs among all the travel modes on both weekdays (56%) a
weekends (49%).
• On average, females spend more time walking per day compared with m
(9.2 minutes v. 7.1 minutes).
• On average, trip legs made for the purpose of recreation in MUAs with home-
based trip leg arrivals have the highest walking duration of 18 minutes per
trip leg.
• On average, a person takes about 14 minutes to cycle to work in a MUA.
.7 National proportions of trip legs by selected mode.
Mode description Trip leg proportion
Walk 15.5%
Vehicle driver 54.1%
Vehicle passenger 25.5%
Bicycle 1.4%
Bus 2.4%
* The ‘oth
mobilitys made
e clies, p and
ell(these m ravel b , electr etc.).
Othe 9% r* 0.

NATIONAL TRAVEL PROFILES PART A: DESCRIPTION OF DAILY TRAVEL PATTERNS
50
6. Travel purpose
.1 Introduction
are contained in the ‘TR14’ database provided from the NZHTS.
Th r
sectio uding walking. The analysis
sho s
shows
proportion of trip legs, defined by purpose, on weekdays and weekends are also
in
rip legs and total distance t lled per person per day by trip purpose
ble 6.1. Only trip legs made by vehicle drivers, vehicle passengers,
dered when consi ering distance. This analysi
ng the trip leg definitions provided, the proportion of trip legs/pe to
prevalent (35%).
s made for ‘work – main job’ or ‘shopping’ are the second an d most
lent personal travel trip legs, accounting for 15% and 14%, re vely, of
ip legs made per day.
dividual travels 11.7 kilometres per day to home, whi counts
% of his/her total distance trav per day.
• On the other hand, travel for ‘work – main job’ and ‘recreation’ account for the
second and the third highest proportions of daily distance, at 16% and 14%,
respectively.
Table 6.1 Number of trip legs and distance/person/day, categorised by trip purpose*.
6
Each trip leg has a trip leg purpose. The trip leg purpose definitions are described in
Chapter 2.7.2 and they
e t ip leg purposes provide details of what activity is done at a trip leg destination. This
n provides details of travel purposes for all modes, excl
w the mean trip leg distance and duration, categorised by different purposes. It also
the proportion of trip legs per person by age group, gender and purpose. The
illustrated this chapter.
6.2 Trip legs and total distance/person/day by purpose
The number of t rave
are shown in Ta
bicycle, bus and taxi are consi d s shows that:
• Usi rson/day
home is the most
• Trip leg d thir
preva specti
the tr
• On average, an in ch ac
for 37 elled
Purpose Trip
legs/person/day Trip legs/person/day
(%) Kilometres/ person/day
Kilometres/ person/day (%)
Home 1.4 35% 11.7 37%
Work – main job 0.6 15% 5.2 16%
Work – other job 0.02 0.5% 0.2 0.5%
Work – employer’s business 0.1 2% 1.0 3%
Education 0.2 4% 0.8 2%
Shopping 0.5 14% 3.3 10%
Personal business/services 0.01 0% 0.0 0%
Medical/dental 0.2 6% 1.6 5%
Social visits 0.03 1% 0.2 1%
Recreational 0.5 12% 4.6 14%
Change mode 0.2 6% 2.6 8%
Accompany someone else 0.2 5% 0.8 3%
Total 3 100% 32.0 100% * Unweighted sample size (people) = 12 698.
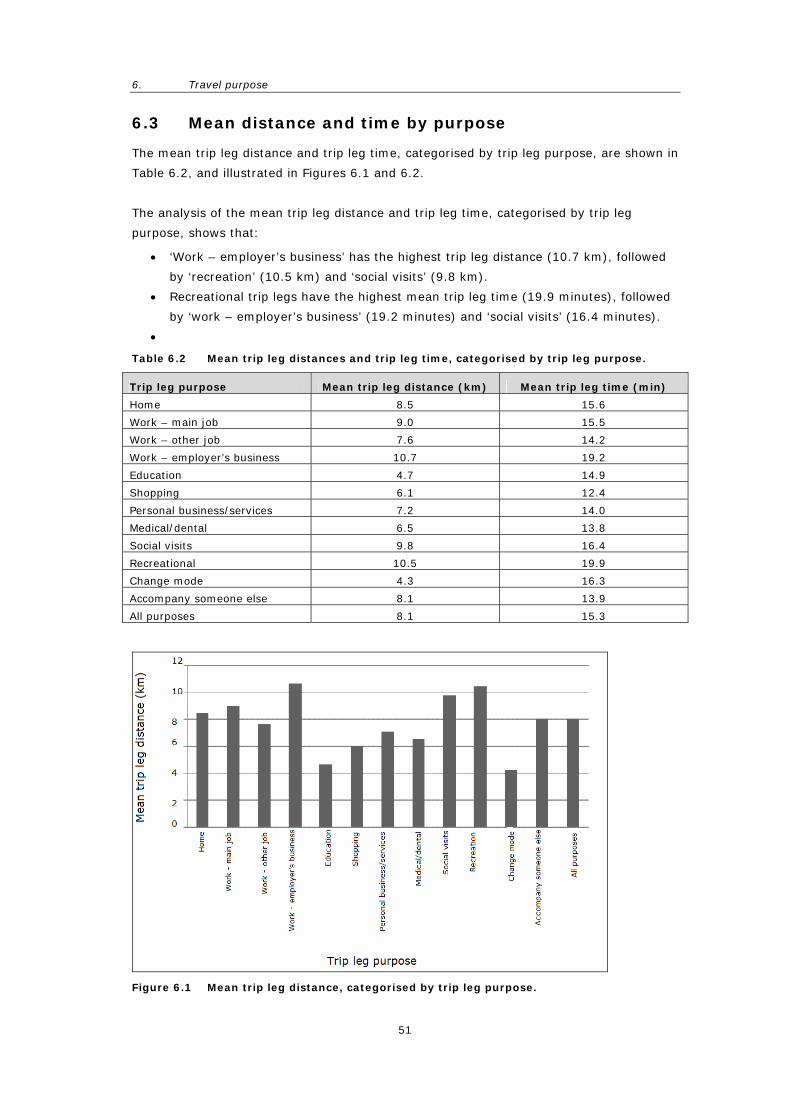
6. Travel purpose
6.3 Mean distance and time by purpose
51
The mean trip leg distance and trip leg time, categorised by trip leg purpose, are shown in
Table 6.2, and illustrated in Figures 6.1 and 6.2.
The analysis of the mean trip leg distance and trip leg time, categorised by trip leg
purpose, shows that:
• ‘Work – employer’s business’ has the highest trip leg distance (10.7 km), followed
by ‘recreation’ (10.5 km) and ‘social visits’ (9.8 km).
• Recreational trip legs have the highest mean trip leg time (19.9 minutes), followed
by ‘work – employer’s business’ (19.2 minutes) and ‘social visits’ (16.4 minutes).
•
Table 6.2 Mean trip leg distances and trip leg time, categorised by trip leg purpose.
Trip leg purpose Mean trip leg distance (km) Mean trip leg time (min)
Home 8.5 15.6
Work – main job 9.0 15.5
Work – other job 7.6 14.2
Work – employer’s business 10.7 19.2
Education 4.7 14.9
Shopping 6.1 12.4
Personal business/services 7.2 14.0
Medical/dental 6.5 13.8
Social visits 9.8 16.4
Recreational 10.5 19.9
Change mode 4.3 16.3
Accompany someone else 8.1 13.9
All purposes 8.1 15.3
Figure 6.1 Mean trip leg distance, categorised by trip leg purpose.

NATIONAL TRAVEL PROFILES PART A: DESCRIPTION OF DAILY TRAVEL PATTERNS
Figure ean trip leg duration, categorised by trip leg purpose.. 6.2 M
52

6. Travel purpose
53
pose
proportions of trip legs/person/day, d by age, gender and trip leg pur
hown i bl 3– A in e t s ll g
• Overa a a ig rip t s t g rson/d
.3 n ag ale ak 4 and 0. o ip /p n for th
po of rk ain ’ o ork m er si ’, ou emale
make m sho ng le e
Trip legs made to ‘accompany someone else’ make up the highest proportion of trip
legs for those in the 0–4 age group, accounting for 43% of all trip legs.
Education was the second most frequent trip leg purpose for those in the 10–14
group, with a proportion of 16%.
e relative importance of ‘work – main job’ trip legs increases with age. Among
peopl d 4, p job’.
ti n p l ncreases wi ng trip legs
ccoun or t sec highest propor le
roup
cat ris by a ip pospeopl
6.4 Proportion of trip legs/person/day by age, gender and pur
The
are s
categorise pose,
n Ta es 6. 6.5. nalys g th se sta istics hows the fo owin :
ll, m les m ke sl htly more t legs han female (4.4 rip le s/pe ay
v. 4 ). O aver e, m s m e 0. 05 m re tr legs erso /day e
pur ses ‘wo – m job r ‘w – e ploy ’s bu ness alth gh f s
0.1 ore ppi trip gs /person/day than mal s.
•
•
age
• Th
e age 50–6 20% of tri legs are for the purpose of ‘work – main
• The propor on of shoppi g tri egs also i th age. Shoppi
a t f he ond tion of trip gs for those in the 65+ age
g .
Table 6.3 Proportions of trip legs/person/day, ego ed ge and tr leg pur e
for all e*.
Age bracket Trip leg purpose
0–4 5–9 10–14 15–19 20–24 25–29 30–39 40–49 50–64 65+ All ages
All trip legs (trip legs/
person/day)
Home 35% 34% 35% 32% 29% 31% 31% 30% 30% 35% 31% 1.4
Work – main job 0% 0.1% 1% 6% 15% 17% 18% 20% 20% 4% 13% 0.6
Work – ot 0% 1% 1% 0% 0% 1% 1% 0% 0% 0.02
her job 0% 0.1%
Work – employer’s
0% 0% 0% 1% 4% 2% 3% 3% 3% 0% 2%
business0.1
Education 4% 17% 16% 12% 5% 2% 1% 1% 1% 0% 4% 0.2
Shopping 2% 4% 6% 11% 11% 13% 14% 13% 14% 20% 12% 0.5
Personal business/services
1% 1% 2% 3% 4% 5% 6% 6% 7% 9% 5% 0.2
Medical/dental 1% 0% 0% 1% 0% 1% 1% 1% 1% 2% 1% 0.03
Social visits 10% 10% 10% 14% 14% 12% 10% 9% 10% 13% 11% 0.5
Recreational 4% 7% 9% 6% 4% 5% 5% 5% 6% 8% 6% 0.2
Change mode 1% 4% 6% 7% 7% 6% 4% 4% 4% 4% 4% 0.2
Accompany someone else
43% 22% 14% 6% 6% 7% 8% 8% 4% 4% 10% 0.4
Total 100% 100% 100% 100% 100% 100% 100% 100% 100% 100% 100% 4.4
Unweighted sample siz(people)
e 9 885 905 942 846 730 671 1781 1873 2169 1897 12 69
* Whe he number of trip legs in am wa s t 12 e rac the estim s m be u iable
re t the s ple s les han 0, th accu y of ate ay nrel .

NATIONAL TRAVEL PROFILES PART A: DESCRIPTION OF DAILY TRAVEL PATTERNS
54
Table 6.4 Proportions of trip legs/person/day, as categorised by age and trip leg purpose for males*.
* Where the number of trip legs in the sample was less than 120, the accuracy of the estimates may be unreliable.
Table 6.5 Proportions of trip legs/person/day, as categorised by age and trip leg purpose for females*.
Trip Leg Purpose
0–4 5–9 10–14 15–19 20–24 25–29 30–39 40–49 50–64 65+ All Ages
All trips (trip legs/
person/day)
Home 34% 34% 34% 33% 29% 32% 32% 31% 31% 33% 32% 1.4
Work – main job 0% 0% 1% 7% 11% 12% 11% 13% 14% 2% 9% 0.4
Work – other job 0% 0% 0% 0% 1% 0% 0% 1% 1% 0% 0% 0.02
Work – employers’ business
0% 0% 0% 1% 0% 2% 2% 2% 2% 0% 1% 0.05
Education 3% 17% 16% 13% 7% 1% 2% 1% 1% 0% 4% 0.2
Shopping 2% 4% 7% 9% 13% 16% 15% 16% 18% 22% 14% 0.6
Personal business/services
0% 1% 2% 3% 4% 5% 7% 7% 8% 9% 6% 0.2
Medical/dental 1% 0% 0% 0% 1% 1% 1% 1% 1% 2% 1% 0.04
Social visits 10% 9% 10% 15% 15% 13% 11% 10% 12% 15% 12% 0.5
Recreational 4% 7% 9% 6% 3% 5% 5% 6% 6% 7% 6% 0.2
Change mode 1% 3% 7% 7% 10% 6% 4% 4% 4% 5% 5% 0.2
Accompany someone else
45% 23% 13% 5% 6% 7% 11% 10% 5% 5% 11% 0.5
Total 100% 100% 100% 100% 100% 100% 100% 100% 100% 100% 100% 4.3
Unweighted sample size (people)
441 443 463. 412 383 367 958 968 1110 1049 6594
* Where the number of trip legs in the sample was less than 120, the accuracy of the estimates may be unreliable.
Age bracket Trip leg purpose
0–4 5–9 10–14 15–19 20–24 25–29 30–39 40–49 50–64 65+ All Ages
All trips (trip legs/
person/day)
Home 35% 35% 35% 33% 28% 29% 30% 29% 30% 36% 31% 1.4
Work – main job 0% 0% 2% 7% 19% 23% 25% 27% 25% 5% 17% 0.8
Work – other job 0% 0% 0% 0% 0% 0% 1% 1% 1% 0% 0% 0.02
Work – employer’s business
0% 0% 0% 1% 7% 2% 5% 4% 4% 1% 3% 0.1
Education 4% 16% 16% 13% 3% 3% 1% 0% 0% 0% 4% 0.2
Shopping 2% 3% 6% 9% 10% 10% 12% 10% 12% 18% 10% 0.5
Personal business/services
1% 1% 2% 3% 4% 4% 5% 5% 7% 10% 5% 0.2
Medical/dental 0% 0% 0% 0% 0% 0% 0% 0% 1% 2% 1% 0.03
Social visits 10% 10% 10% 15% 14% 12% 8% 8% 8% 11% 10% 0.4
Recreational 4% 7% 9% 6% 5% 5% 5% 5% 5% 8% 6% 0.3
Change mode 1% 5% 5% 7% 5% 5% 4% 4% 4% 3% 4% 0.2
Accompany someone else
42% 22% 15% 5% 5% 7% 5% 6% 4% 4% 8% 0.4
Total 100% 100% 100% 100% 100% 100% 100% 100% 100% 100% 100% 4.4
Unweighted sample size (people)
444 462 479 434 347 304 823 905 1059 848 6105
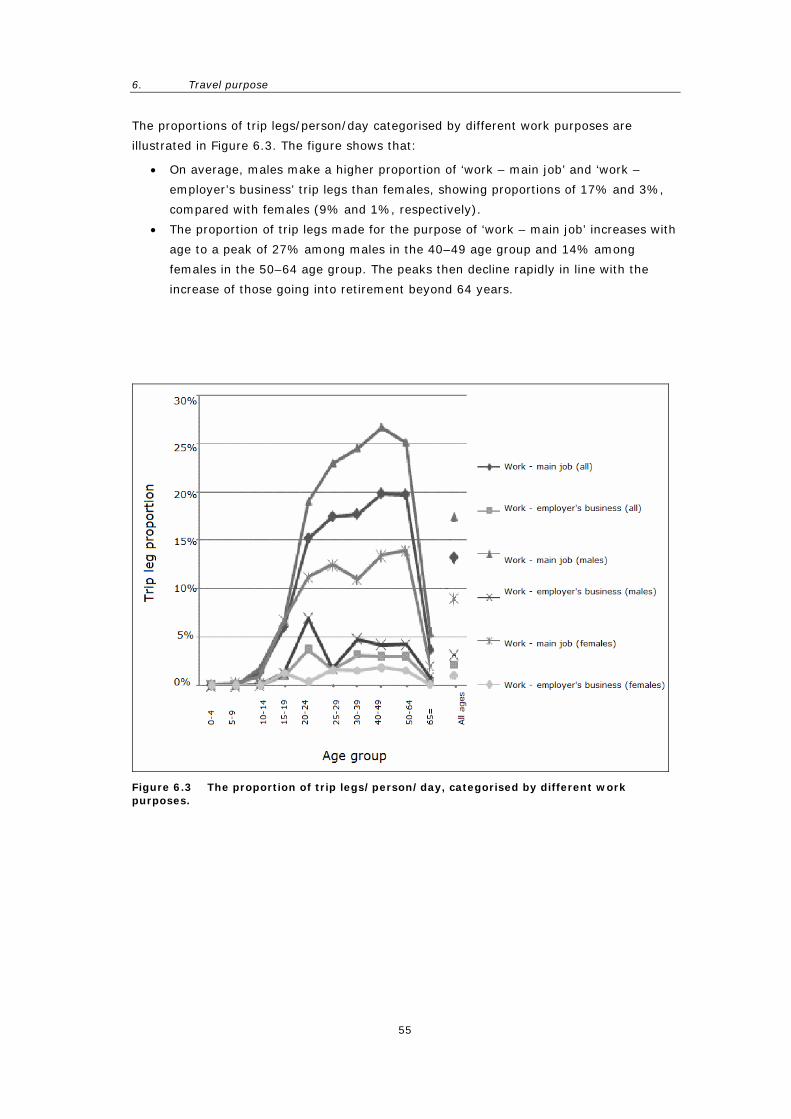
6. Travel purpose
The proportions of trip legs/person/day categorised by different work purposes are
illustrated in Figure 6.3. The figure shows that:
• On average, males make a higher proportion of ‘work – main job’ and ‘work –
employer’s business’ trip legs than females, showing proportions of 17% and 3%,
compared with females (9% and 1%, respectively).
• The proportion of trip legs made for the purpose of ‘work – main job’ increases with
age to a peak of 27% among males in the 40–49 age group and 14% among
females in the 50–64 age group. The peaks then decline rapidly in line with the
increase of those going into retirement beyond 64 years.
Figure 6.3 The proportion of trip legs/person/day, categorised by different work purposes.
55

NATIONAL TRAVEL PROFILES PART A: DESCRIPTION OF DAILY TRAVEL PATTERNS
The proportions of trip legs/person/day made for the purpose of shopping are illustrated
in Figure 6.4.
The analysis of the proportion of trip legs/person/day made for the purpose of shopping
shows that:
• On average, females have higher shopping trip leg proportions compared with
males (14% compared to 10%).
• The shopping trip leg proportion increases with age to a peak of 18% among males
in the 65+ age group and 22% among females in the same age group.
Figure 6.4 The proportion of shopping trip legs/person/day, categorised by gender.
56

6. Travel purpose
The proportions of social visit trip legs/person/day are illustrated in Figure 6.5.
The analysis of the proportion of social visit trip legs/person/day shows that:
• On average, females have a higher proportion of ‘social visit’ trip legs compared
with males (12% compared to 10%).
• The proportion of the number of trip legs for a ‘social visit’ increases with age to a
peak of 16% among males and females in the 15–19 and 20–24 age groups. Both
curves follow a similar pattern after the peaks, with the proportion of trip legs for
both females and males declining, reaching minimum points of 10% and 8% in the
40-49 age group.
Figure 6.5 The proportion of social visit trip legs/person/day, categorised by gender.
57

NATIONAL TRAVEL PROFILES PART A: DESCRIPTION OF DAILY TRAVEL PATTERNS
The proportions of trip legs/person/day to accompany someone else are illustrated in
Figure 6.6. This analysis shows that:
• On average, females make 2 % more trip legs to ‘accompany someone else’ than
males.
• The trip leg proportion for trip legs made for the purpose of ‘accompany[ing]
someone else’ for females declines rapidly with age but increases again to a peak of
12% in the 30–39 age group. The males’ trip leg proportion curve follows a similar
trend as the females from the 0–4 to 20–24 age groups before levelling off below
6%.
Figure 6.6 The proportion of ‘accompany someone else’ trip legs/person/day, categorised by gender.
58

6. Travel purpose
The proportions of recreational trip legs /person/day are illustrated in Figure 6.7.
Analysis of this figure shows that:
• On average, both males and females make the same proportion of recreational trip
legs, showing a 6% mean.
• The recreational trip proportions for both males and females increase with age to a
peak of 9% and 10%, respectively, in the 10–14 age group. The peaks decline
rapidly, reaching minimum points of 5% in the 25–29 age group for males and 4%
in the 20–24 age group for females.
• Recreational trip legs are significant in the 65+ age group for both genders,
achieving the fifth highest trip proportion of all trip purposes.
Figure 6.7 The proportion of recreational trip legs/person/day, categorised by gender.
59

NATIONAL TRAVEL PROFILES PART A: DESCRIPTION OF DAILY TRAVEL PATTERNS
60
6.5 Trip legs by purpose and day of the week
6.5.1 Proportion of weekday and weekend trip legs by selected purposes
The proportions of trip legs categorised by selected purposes on a weekday and weekend
are presented in Table 6.6 and illustrated in Figure 6.8.
The analysis of the proportion of trip legs, categorised by selected purposes, shows that:
• Trip legs made for the purposes of ‘work – main job’ or ‘shopping’, or to
‘accompany someone else’ account for the second, third and fourth highest trip leg
proportions on an average weekday. The trip legs made during the week that make
up the highest proportion are those made for the purpose of going home (over
30%).
• ‘Social visits’ trip legs are the second most prevalent trip legs on the weekend,
accounting for 17% of all the trip legs in the weekend.
• Shopping trip legs and trip legs made to accompany someone else have the third
and the fourth highest trip leg proportions during the weekend, respectively.
• The trip leg proportion for ‘work – main job’ trip legs is substantially higher on a
weekday compared with those for the same purpose on the weekend, showing a
difference of 11%. The trip leg proportions of shopping and social visits are (16%
less 11%) 5% and (17% less 9%) 8% higher during the weekend than on a
weekday.
Table 6.6 The proportion of trip legs, categorised by trip leg purpose, on weekdays and weekends.
Description Trip leg proportion
(weekday) Trip leg proportion
(weekend) Home 31% 34% Work – main job 16% 5% Work – other job 1% 0.3% Work – employer’s business 3% 1% Education 5% 1% Shopping 11% 16% Personal business/services 5% 5% Medical/dental 1% 0.2% Social visits 9% 17% Recreational 5% 9% Change mode 5% 2% Accompany someone else 9% 10% Total 100% 100% Total number of trip legs (unweighted) 79 927 28 211

6. Travel purpose
Figure 6.8 The proportion of trip legs, categorised by trip leg purpose on weekdays and weekends.
.5.2 Trip leg duration by purpose – weekdays and weekends
he mean trip leg durations, defined by different purposes on weekdays and weekends,
are presented in Table 6.7 and illustrated in Figure 6.9.
• On average, tri k - e siness’ trip legs have a r
duration red p l ee
On the weekend, r purpose ve the highes eg duration
th trip legs made for other purposes.
on from weekday to weekend mean trip leg duration
trips made to ‘accompany someone else’ – an increase of four minutes.
e highest drop in on from we on (two
seen rk – employer’s business’ trip l 9 minutes during the
ek; 17 minutes at the weekend.
6
T
Points to be noted in the figure and table include:
p legs for ‘wor
(19%) compa
mployer’s bu
with other tri
elatively
kday. higher eg purposes on a w
• ecreational s ha t trip l
(22 minutes) compared wi
• The highest increase in proporti
was seen in
Th proporti ekday to weekend mean durati
minutes) was in ‘wo egs: 1
we
61

NATIONAL TRAVEL PROFILES PART A: DESCRIPTION OF DAILY TRAVEL PATTERNS
62
Table 6.7 Mean trip leg duration and trip leg sample size, categorised by trip leg purpose, on weekdays and weekends.
Description Unweighted weekday trip
legs
Average trip leg duration
(min)
Unweighted weekend trip legs
Average trip leg duration
(min)
Home 24 440 15 9324 17
Work – main job 12 464 16 1544 15
Work – other job 498 14 123 15
Work – employer’s business
2153 19 209 17
Education 3509 15 136 17
Shopping 8882 12 4422 13
Personal business/services
4332 13 1210 16
Medical/dental* 838 14 58 –
Social visits 6903 16 4904 18
Recreational 4014 19 2481 22
Change mode 3999 16 760 17
Accompany someone else
7895 13 3040 17
Totals and averages 75 913 15 28 211 17
* Es imates for ‘medical/dental’ weekend trip leg duration cannot be made because the nu ber of trips legs sampled was less than 120.
tm
Figure 6.9 Mean trip leg duration, categorised by trip leg purpose, on weekdays and weekends.

6. Travel purpose
63
6.6 Summary
Aft hest
proportion of personal trip legs among all the selected trip purposes.
‘W shopping’ trip legs have the second and the third highest
Trip y
som proportions
r compared to other trip legs on
both weekdays and weekends.
• er trip legs to ‘home’, trip legs to ‘work – main job’ make up the second hig
• ork – main job’ and ‘
trip proportions per person for all age groups.
• ‘Work – employer’s business’ has the highest mean trip leg distance (10.7 km).
• Recreational trip legs have the highest mean trip leg time (19.9 minutes).
• Overall, males make more trip legs per person than females, and males make more
work-related trip legs than females.
• legs for the purpose of ‘work – main job’ and ‘shopping’, and to ‘accompan
eone else’ accounted for the second, third and fourth highest trip
on a weekday.
• Recreational trip leg duration is relatively highe
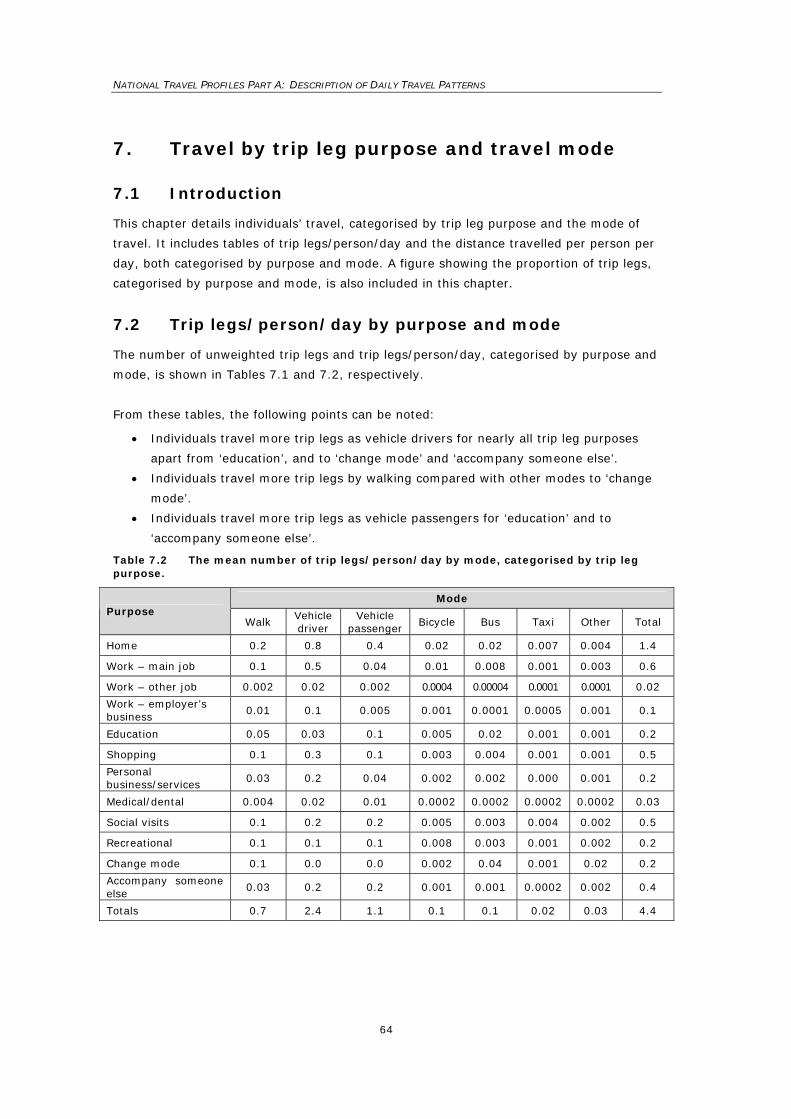
NATIONAL TRAVEL PROFILES PART A: DESCRIPTION OF DAILY TRAVEL PATTERNS
64
.1 Introduction
This chapter details individuals’ travel, categorised by trip leg purpose and the mode of
travel per
day, b
catego
7.2
Th
mode, is shown in Tables 7.1 and 7.2, respectively.
From these tables, the following points can be noted:
• s travel more s le drivers for nearly all trip leg purposes
apart from ‘education’, ‘c de ccompany someone el
• uals travel more t gs by walking co red w the es ange
• l more t gs as cle passengers uc ’ and
s
Table 7 mean number ip leg rson/day by mod teg by trip leg purpos
7. Travel by trip leg purpose and travel mode
7
. It includes tables of trip legs/person/day and the distance travelled per person
oth categorised by purpose and mode. A figure showing the proportion of trip legs,
rised by purpose and mode, is also included in this chapter.
Trip legs/person/day by purpose and mode
e number of unweighted trip legs and trip legs/person/day, categorised by purpose and
Individual trip leg
and to
as vehic
hange mo ’ and ‘a se’.
Individ rip le mpa ith o r mod to ‘ch
mode’.
Individuals trave rip le vehi for ‘ed ation to
‘accompany someone el e’.
.2 The of tr s/pe e, ca orised e.
Mode Purpose
Walk Vehicle driver
Vehicle pa er sseng
Bicycle Bus Taxi Other Total
Home 0.2 0.8 0.4 0.02 0.02 0.007 0.004 1.4
Work – main job 0.1 0.5 0.04 0.01 0.008 0.001 0.003 0.6
Work – other job 0.002 0.02 0.002 0.0004 0.00004 0.0001 0.0001 0.02
Work – ebusiness
mployer’s 0.01 0.1 0.005 0.001 0.0001 0.0005 0.001 0.1
Education 0.05 0.03 0.1 0.005 0.02 0.001 0.001 0.2
Shopping 0.1 0.3 0.1 0.003 0.004 0.001 0.001 0.5
Personal business/services
0.03 0.2 0.04 0.002 0.002 0.000 0.001 0.2
Medical/dental 0.004 0.02 0.01 0.0002 0.0002 0.0002 0.0002 0.03
Social visits 0.1 0.2 0.2 0.005 0.003 0.004 0.002 0.5
Recreational 0.1 0.1 0.1 0.008 0.003 0.001 0.002 0.2
Change mode 0.1 0.0 0.0 0.002 0.04 0.001 0.02 0.2
Accompany someone else
0.03 0.2 0.2 0.001 0.001 0.0002 0.002 0.4
Totals 0.7 2.4 1.1 0.1 0.1 0.02 0.03 4.4

7. Travel by trip leg purpose and travel mode
65
and mode
distances in kilometres.
o
travel distances less than
•
purposes, and to accompany someone else.
Table 7.3pu
7.3 Distance travelled/person/day by purpose
The distances travelled per person per day, categorised by trip leg purpose and mode of
transport, are shown in Table 7.3 as mean
Analysis of the data displayed in this table shows that:
• Individuals travel greater trip leg distances as vehicle drivers for most trip leg
purposes. Only ‘work – other job’, ‘education’ and ‘medical/dental’ purposes, and t
‘change mode’ and ‘accompany someone else’ have mean
1 kilometre.
Individuals travel greater trip leg distances as vehicle passengers for shopping,
social visits and recreational
• Individuals travel the greatest trip leg distances by bus to change mode.
Mean distance travelled/person/day (in kilometres), categorised by trip leg rpose and mode of transport.
Mode Purpose Vehicle
driver Vehicle
passenger Bicycle Bus Taxi Total
Home 7.0 4.4 0.1 0.2 0.05 11.7
Work – main job 4.7 0.4 0.03 0.1 0.01 5.2
Work – other job 0.1 0.03 0.001 0.0001 0.001 0.2
Work – employer’s business
0.9 0.1 0.001 0.001 0.004 1.0
Education 0.2 0.3 0.01 0.3 0.01 0.8
Shopping 2.1 1.1 0.005 0.02 0.005 3.3
Personal business/services
1.2 0.4 0.003 0.02 0.001 1.6
Medical/dental 0.2 0.1 0.0004 0.0004 0.001 0.2
Social visits 2.4 2.0 0.01 0.1 0.03 4.6
Recreational 1.1 1.3 0.03 0.1 0.01 2.6
Change mode 0.3 0.2 0.003 0.4 0.01 0.8
Accompany someone else
1.2 2.2 0.002 0.05 0.0004 3.4

NATIONAL TRAVEL PROFILES PART A: DESCRIPTION OF DAILY TRAVEL PATTERNS
66
.4 Trip leg proportion by purpose and mode
Trip leg proportions, categorised by trip leg purpose and mode of transport, are presented
7.4 and illustrated in F 1.
ng at the figure e t we c the ing
made eh iver’ e up t ighe opo f t s
for wo pur . Sh , personal bu s/se s vis
al/den rip purposes show a simil atte
legs made eh ssen ake he h t p ion
ade for ‘educ and ccom some else h p ion 9%
nd 54%, respecti y.
the dominant mode of transport for trip legs made to ‘change mode’
f all ‘cha de legs
y used mode of public transport, g the fourth
st mode f cat d th nd h t fo ng ’ tr gs.
7
in Table igure 7.
Looki and th able, an see follow :
• Trip legs as a ‘v icle dr mak he h st pr rtion o rip leg
travelled rking poses opping sines rvices, ocial it
and medic tal t ar p rn.
• Trip as a ‘v icle pa ger’ m up t ighes roport of trip legs
m ation’ to ‘a pany one ’, wit roport s of 3
a
• Walking is
vel
(42% o nge mo ’ trip ).
• Buses were the most frequentl bein
highe or edu ion an e seco ighes r ‘cha e mode ip le

7. Travel by trip leg purpose and travel mode
67
Table 7.4 Trip leg proportions categorised by trip leg purpose and mode of transport*.
Mode Purpose
Walk Vehicle driver
Vehicle passenger
Bicycle Bus Taxi Other Total
Home 14% 56% 27% 2% 1% 1% 0.3% 100%
Work – main job 11% 78% 7% 2% 1% 0.2% 0.5% 100%
Work – other job 9% 77% 10% 2% 0.2% 1% 0..4% 100%
Work – employer’s business
6% 87% 5% 1% 0.2% 0.5% 1% 100%
Education 30% 15% 39% 3% 12% 0.5% 0.5% 100%
Shopping 16% 61% 22% 1% 1% 0.2% 0.2% 100%
Personal business/services
14% 69% 15% 1% 1% 0.05% 0.03% 100%
Medical/dental 11% 62% 25% 1% 0.4% 1% 1% 100%
Social visits 15% 49% 33% 1% 1% 1% 1% 100%
Recreational 27% 38% 30% 3% 1% 0.3% 1% 100%
Change mode 42% 17% 9% 1% 22% 0.5% 8% 100%
Accompany someone else
7% 38% 54% 0.3% 0.3% 0.1% 1% 100%
* Where the number of unweighted trip legs in the sample was less than 120, the accuracy of the estimates may be unreliable.
Figure 7.1 Trip leg proportions, categorised by trip leg purpose and mode of transport.

NATIONAL TRAVEL PROFILES PART A: DESCRIPTION OF DAILY TRAVEL PATTERNS
68
This chapter has considered how New Zealanders travel, by trip leg purpose and mode of
section include:
ing purposes, trip legs made as a ‘vehicle driver’ (56%) make up the
• h have the highest proportion of trips made as a vehicle
• The purposes that showed the highest proportion of individuals walking were
‘ed
e’
to ‘work’ (1%), and for ‘medical/dental’ (1%)
and social (1%) purposes.
7.5 Summary
transport. Highlights from this
• Individuals travel more trip legs and trip leg distance as vehicle drivers for nearly
all purposes apart from ‘education’, and to ‘change mode’ and to ‘accompany
someone else’.
• For all work
highest proportion. Shopping, personal business/services, social visits and
medical/dental trip legs purposes show a similar pattern.
The purposes whic
passenger are ‘education’ (39%), ‘social visits’ (33%) and recreation (30%).
ucation’ (30%), followed by ‘shopping’ (16%).
• The purposes that showed the highest proportion of bus use were ‘change mod
(22%) and ‘education’ (12%).
• Recreation and education show the greatest proportion of bicycle use (3% each),
followed by work trips (2%).
• Taxis are a minor contributor for trips

8. Social inclusion and accessibility
69
8. Social inclusion and accessibility
8.1 Introduction
This chapter provides information regarding how vehicle availability and different income
categories affected households’ and individuals’ travel profiles, and includes tables and
figures showing:
• variations in travel time, distance and trip legs according to car availability;
• variations in travel time, distance and trip legs according to the number of people in
a household; and
• variations in travel mode and distance according to personal income bracket.
8.2 Variation in travel by household car availability
Table 8.1 and Figure 8.1 show how travel patterns differ according to household car
availability. Trip legs, distance and time per household per day are indexed to show the
relative difference of variations in household car availability. For this index, a reading of
100 indicates the average, which is equivalent to 15 trips per household, 121 km per
Analysing aria orised by household car availability shows that:
• Hou three cars generate more trip legs than households with
one car or no cars.
On velled greater distances
household and 227 minutes per household.
the v tions in travel categ
seholds with more than
• average, households with more than three cars also tra
and spent more time travelling than those with one or no cars.
Table 8.1 Variations in travel by household car availability.
Number of cars in household
Unweighted sample size
(households)
Trips/ household/
day
Distance/ household/
day (km)
Travel time/ household/
day (min)
No Car 360 6 57 102
1 Car 1818 10 80 153
2 Cars 1783 17 141 262
3+ Cars 848 24 202 382
Totals andmeans
4809 15* 121* 227*
* These values were used to calculate the 100 index for Figure 8.1.

NATIONAL TRAVEL PROFILES PART A: DESCRIPTION OF DAILY TRAVEL PATTERNS
Figure 8.1 Mean variations in travel categorised by household car availability.
* Index 100 = 15 trip legs/household = 121 km/household = 227minutes/household (as set out in Table 8.2)
riation in travel by household size
Variation in travel behaviour, categorised by number of people in a household, is shown in
Table 8.2. Trip legs, distance and time travelled per household per day are illustrated in
• Trip legs per household per day and travel time per household per day increase
wit
• The number of trip legs (6), the distance (50 km) and travel time (90 minutes) per
th the number of people in a
Table of people in a household.
8.3 Va
Figure 8.2, Figure 8.3 and Figure 8.4, respectively. The table shows that:
h the number of people in a household.
person per day in a household is pretty much constant until the household size
reaches 6+ people.
• Households with five people travel the greatest distance: 244 km per day.
• Trip legs and distances travelled increase rapidly wi
household.
8.2 Variations in travel by number
70
No. of people in household
Unweighted sample size
(households)
Trip legs/ household/
day
Distance/ household/day
(km)
Travel time/ household/day
(min)
1 1169 6 47 91 2 1809 12 99 188 3 749 18 147 282 4 687 25 200 376 5 272 28 244 421 6+ 124 29 230 426 All 4810 15 121 227

8. Social inclusion and accessibility
71
Figure 8.2 Trip legs per household per day, categorised by number of people in thehousehold.
Figure 8.3 Distance per household per day, categorised by number of people in the household.
+

NATIONAL TRAVEL PROFILES PART A: DESCRIPTION OF DAILY TRAVEL PATTERNS
Figure 8.4 Travel time per household per day, categorised by number of people in a old.
8.4 Trip legs/person/day by mode and personal income
rsonal income on travel patterns. Table 8.3
shows the (unweighted) number of trip legs/person/day, while the mean distances
travelled per person per day are shown in Table 8.4. Trip legs/person/day according to
personal income are presented in graph form as follows:
• Figure 8.5 shows all modes combined,
• Figure 8.6 shows vehicle trip legs (driver and passenger),
• Figure 8.7 shows walking trip legs,
• Figure 8.8 shows cycling trip legs, and
• Figure 8.9 shows bus trip legs.
The incomes are those provided by the individuals surveyed. Total household incomes
have not been derived in this analysis. Given that only ages 16+ were asked their
personal income, the analysis is based on ages 16+ only.
The analysis of the numbers of trip legs/person/day, categorised by mode of travel and
personal income bracket, shows that:
• The numbers of trip legs/person/day increase slightly with personal income.
(Figure 8.5).
increasing personal income. The number of trip legs made as vehicle passenger
decrease as personal income rises (Figure 8.6).
househ
This section considers the influence of pe
• The number of trip legs/person/day made as vehicle drivers increase with
72

8. Social inclusion and accessibility
73
i
legs per day than those in the other personal income ranges. The number of
walking trip legs made per person decreases after the ‘under $10,000’ category and
reach the minimum point of 0.55 trip legs per person in the ‘$20,001–$30,000’
personal income bracket (Figure 8.7).
• On the other hand, those who earn $20,001–$30,000 per annum make the highest
amount of cycling trip legs (0.08) per day (Figure 8.8).
• Individuals earning under $10,000 make more trip legs by bus than those in other
personal income brackets. The minimum number of bus trip legs/person/day occurs
within the ‘$15,001–$20,000’ personal income bracket.
Table 8.3 Mean number of trip legs/person/day, categorised by travel mode and personal income bracket.
• Indiv duals who have a personal income under $10,000 make more walking trip
Trip legs/person/day Mode
Income bracket
Walk Vehicle driver
Vehicle passenger
Bicycle Bus Taxi Other All
modes (total)
Unweighted sample
size (people)
No income 0.89 1.63 1.00 0.03 0.16 0.02 0.03 3.76 660 Under $10,000
1.01 2.10 0.94 0.05 0.17 0.02 0.03 4.32 1011
$10,001–$15,000
0.70 2.26 0.72 0.04 0.08 0.02 0.03 3.86 1346
$15, –$20,
0.65 2.69 0.92 0.03 0.05 0.02 0.03 4.40 106001000
4
$20,001–$30,000
0.55 3.50 0.75 0.08 0.07 0.03 0.04 5.01 1301
$30,001–$40,000
0.61 3.70 0.60 0.05 0.07 0.02 0.03 5.08 1262
$40,001–0.63 3.90 0.48 0.04 0.09 0.01 0.05 5.21 894
$50,000 $50,001–$70,000
0.66 4.23 0.42 0.05 0.06 0.02 0.06 5.48 785
$70,$
5 001–
100,000 0.77 4.34 0.47 0.06 0.09 0.04 0.07 5.83 33
$100,000+ 0.87 4.81 0.48 0.03 0.04 0.04 0.05 6.32 234

NATIONAL TRAVEL PROFILES PART A: DESCRIPTION OF DAILY TRAVEL PATTERNS
Figure 8. m trip pers ay, eg d sona me bracket.
5 Mean nu ber of legs/ on/d cat orise by per l inco
Figure 8.6 Mean number of vehicle driver and passenger trip legs/person/day, categorised by personal income bracket.
74

8. Social inclusion and accessibility
Figure 8.7 Mean number of walking trip legs/person/day, categorised by personaincome bracket.
l
Figure 8.8 Mean number of cycling trip legs/person/day, categorised by personal income bracket.
75

NATIONAL TRAVEL PROFILES PART A: DESCRIPTION OF DAILY TRAVEL PATTERNS
Figure 8.9 Mean number of bus trip legs/person/day, categorised by personal income bracket.
8.5 Distance travelled by mode and personal income
The distances travelled per person per day, categorised by travel mode and personal
income bracket, are shown in Table 8.4.
The analysis of the distance travelled per person per day, categorised by mode of
transport and personal income bracket shows that:
erage, individuals who earn more
than $100,000 per annum travel twice the distance compared with those who fall
into the $10,001–$15,000 personal income bracket.
times the distance compared with those who fall into the
• Individuals who earn $70,001–$100,000 per day cycle more distance than those in
other personal income brackets, travelling, on average, 0.8 km per day.
• Individuals who earn less than $10,000 per annum travel more distance by bus
than those in the other personal income brackets, travelling 3.8 km per day.
• Generally, the distance travelled per person per day increases with personal
income. Considering all modes of travel, on av
• For vehicle drivers, on average, individuals who earn more than $100,000 per
annum travel almost four
‘under $10,000’ personal income bracket.
76

8. Social inclusion and accessibility
77
Table 8.4 Mean distance travelled/person/day, categorised by mode of transport.
Trip legs/person/day Mode Income
bracket Vehicle driver
Vehicle passenger
Bicycle Bus Taxi All
modes (total)
Unweighted sample size
(people)
No income 12.7 8.0 0.1 0.7 0.1 21.5 660
Under $10,000
29.9 23.4 0.4 3.8 0.2 57.7 1011
$10,001–$15,000
36.2 18.1 0.3 2.5 1.1 58.1 1346
$15,001–$20,000
43.2 24.2 0.3 1.1 0.3 69.1 1064
$20,001–$30,000
55.0 19.9 0.4 1.6 0.2 77.1 1301
$30,001–$40,000
75.6 21.6 0.4 1.8 0.2 99.7 1262
$40,001–$50,000
83.2 17.9 0.4 1.2 0.2 102.9 894
$50,001–$70,000
99.4 15.0 0.6 1.4 0.4 116.8 785
$70,001–$100,000
94.9 13.7 0.8 1.5 0.5 111.5 335
$100,000+ 101.6 14.9 0.5 0.6 0.8 118.5 234
8.6 Summary
• Trip legs, distance and time travelled per day per household increase with car
availability.
• Trip legs and travel time per household per day increase with the number of people
in a household. Households with five people travel the greatest distance: 244 km
er of trip legs made and the distance travelled per person per
day also increase with personal income. Individuals who fall into the ‘no income’
category made fewer trip legs than those with other personal income ranges.
• The number of trip legs made per person as a vehicle driver increased relative to
personal income level. On the other hand, the number of trip legs made per person
as a vehicle passenger decreased with rising personal income.
per day.
• Generally, the numb

NATIONAL TRAVEL PROFILES PART A: DESCRIPTION OF DAILY TRAVEL PATTERNS
78
9. Travel by time of day
n
This chapter provides informa travel patterns categorise of day,
e week vel purpose. The tables ure the ip l r all
modes together
Proportion of home-based e artur by purpose and time of day
ons of home-based daily trip l res (i me that indivi rst
me at t t’ of ), c ed ected purposes and the time of day,
strated in s 9. 8. T 1 sh the m and ing
ure times from home for different purpose wee nd nds.
ons of d sh the s are orted
l t e estimates in
is chap
ategoris ose, are less than 120. The total number of unweighted trip legs for
9.1 Introductio
tion on personal d by time
day of th and tra
.
and fig s show total tr egs fo
9.2 daily d p es
The proporti eg departu .e. the ti duals fi
leave ho he ‘star a day ategoris by sel
are illu Figure 1 to 9. able 9. ows orning even peak
depart s on kdays a weeke These
proporti aily flow own in graph rep for the end of the hour shown
(e rip legs made from 1301h to 1400h would be classified as ‘14’). Th.g. al
th ter have not been made where the total number of unweighted trip legs,
ed by purpc
all modes together are categorised by trip leg purposes and day of the week, and are
given in detail in Appendix D.
Figure 9.1 Departure time from home for work (main job and other job) as a proportion of daily flow on weekdays and weekends.

9. Travel by time of day
Fig 2 Departure time from home for education as a proportion of daily flow on s.
ure 9.weekday
ote: Estimates for weekend education cannot be made because the total number of trip legs mples was less than 120 (see Appendix D).
Nsa
Figure 9.3 Departure times from home for shopping trips as a proportion of daily flow on weekdays and weekends.
79

NATIONAL TRAVEL PROFILES PART A: DESCRIPTION OF DAILY TRAVEL PATTERNS
Figure 9.4 Departure time from home for ‘personal business/services’ trip legs as a proportion of daily flow on weekdays on weekends.
Figure 9.5 Departure time from home for ‘medical/dental’ trip legs as a proportion of daily flow on weekdays.
Note: Estimates for weekend ‘medical/dental’ trip legs are not included because the total number samples was less than 120 (see Appendix D).
80

9. Travel by time of day
Figure 9.6 Departure time from home for social visits as a proportion of dailweekends and weekdays.
y flow for
Figure 9.7 Departure time from home for recreation as a proportion of daily flow for weekends and weekdays.
81

NATIONAL TRAVEL PROFILES PART A: DESCRIPTION OF DAILY TRAVEL PATTERNS
Figure 9.8 Departure times from home to change mode as a proportion of daily flow on weekdays and weekends.
Table 9.1 Morning and evening peak times for leaving home for different purposes on weekdays and weekends.
Weekday Weekend
Trip purpose a.m. peak
period
a.m. peak %
p.m. peak
period
p.m. peak %
a.m. peak
period
a.m. peak %
p.m. peak
period
p.m. peak %
Worka 2% 07–08 36% 15–16 3% 08–09 21% 13-14
Educationb 08–09 76% 12–13 2% – – – –
Shopping 10–11 11% 12–13 11% 10–11 23% 13–14 8%
Personabusine
09–10 19% 13–14 5% 09–10 30% 12–14 8% l
ss/services
Medical/dental 09–10 17% 14–15 12% – – – –
Social 8% visits 09–10 20% 12–13 8% 09–10 21% 13–14
Recreational 8% 09–10 21% 13–14 5% 10–11 22% 13–14
Change mode 07–08 41% 12–13 3% 08–10 17% 12–13 15%
Notes: a ‘Work’ trip leg purposes includes ‘work – main job’ and ‘work – other job’. b Estimates could not be made in categories where the number of trip legs sampled was less
than 120.
In summary, these home-based departures reflect the four major home-based departures
in the weekdays and weekends. These occur on the weekday at approximately hourly
intervals between 0800h and 1100h. The patterns relate to trips on weekdays to:
• work (with a peak up to 0800h),
• education (with a peak up to 0900h),
• personal business/services (with a peak up to 1000h), and
• shopping (with a peak up to 1100h).
82

9. Travel by time of day
83
9.
The p ,
are ill y morning and evening peaks and
pro
propo of the hour shown (e.g. all times from 0801h to
0900h are classed as ‘9’). The analysis looks at when individuals arrive after setting out
from home, considering all modes and purposes (home-based arrivals).
It is important to point out that estimates in this section cannot be made where the
number of unweighted trip legs, categorised by trip leg purpose, are less than 120. The
total number of unweighted trip legs, categorised by trip leg purposes and day of the
week for all modes, are shown in detail in Appendix D.
In general, compared with arrivals and departures that are home-based or for education,
the other trip leg purposes are spread more evenly throughout the day, resulting in
typical peak hours varying between 10% and 18% for different trip purposes.
Table 9.2 Morning and evening peak arrival times on weekdays and weekends, categorised by purpose.
3 Proportion of daily arrivals purpose and time of day
roportions of daily trip leg arrivals, categorised by selected purpose and time of day
ustrated in Figures 9.9 to 9.19. The dail
portions for the selected purposes are summarised in Table 9.2. In these figures, the
rtions are reported for the end
Weekday Weekend Trip leg purpose*
a.m. peak
period
a.m. peak
%
p.m. peak
period
p.m. peak
%
p.m. peak
period
p.m. peak
%
p.m. peak
period
p.m. peak
%
Home 10–11 6% 14–15; 16–17
15% 10–11 8% 16–17 11%
Work – main job
07–08 19% 12–13 8% 07–08 13% 13–14 7%
Work – other job
07–08 15% 15–16 9% 07–08 17% 15–16 9%
Work – employer’s
ss 08–09 14% 13–14 10%
06–07; 09–10
12% 12–13 8% busineEducation 07–08 64% 11–12 5% 07–08 26% 11–12 8% Shopping 09–11 11% 12–13 10% 09-10 14% 14–15 10% Personal business/ services
08–09 11% 14–15 11% 09–10 14% 12–13 9%
Medical/ dental
09–10 18% 13–14 12% – – – –
Social visits 10–11 7% 16–17 10% 10–11 10% 17–18 9% Recreational 08–09 7% 15-17 10% 09–10 12% 12–13 11% Change mode
07–08 15% 14–15 13% 10–11 10% 12–13 12%
* Estimates could not be made in categories where the number of trip legs surveyed was less than 120.

NATIONAL TRAVEL PROFILES PART A: DESCRIPTION OF DAILY TRAVEL PATTERNS
Figure 9.9 Proportion of daily trip leg arrivals at home from all origins by time of day.
Figure 9.10 Proportion of daily trip leg arrivals at ‘work – main job’ by time of day.
84

9. Travel by time of day
Figure ons of daily trip leg arrivals at ‘work – other job’ by time of day.
9.11 Proporti
igure 9.12 Proportions of daily trip leg arrivals at ‘work– employer’s business’ by time of Fday.
85

NATIONAL TRAVEL PROFILES PART A: DESCRIPTION OF DAILY TRAVEL PATTERNS
Figure
9.13 Proportions of daily trip leg arrivals for education by time of day.
Figure 9.14 Proportions of daily trip leg arrivals for shopping by time of day.
86

9. Travel by time of day
9.15 Proportions of daily trip leg arrivals for ‘personal business/services’ by tim.
Figure e of day
Figure 9.16 Proportions of daily arrivals for ‘medical/dental’ trip legs by time of day*.
* Estimates for weekend ‘medical/dental’ trip legs cannot be made because the total number of trip legs sampled was less than 120 (see Appendix D).
87
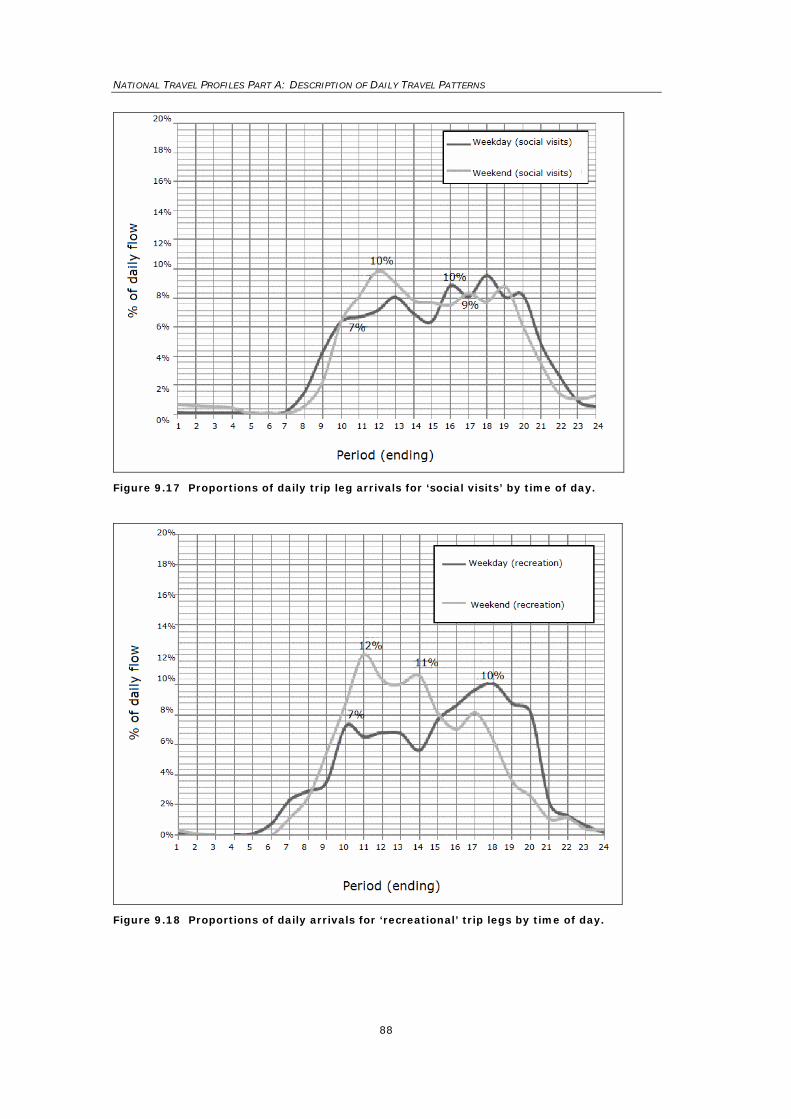
NATIONAL TRAVEL PROFILES PART A: DESCRIPTION OF DAILY TRAVEL PATTERNS
Figure
9.17 Proportions of daily trip leg arrivals for ‘social visits’ by time of day.
Figure
9.18 Proportions of daily arrivals for ‘recreational’ trip legs by time of day.
88

9. Travel by time of day
Figure 9.19 Proportions of daily trip leg arrivals to ‘change mode’ by time of day.
9.4 Proportion of weekday and weekend arrivals for all purposes by time of day in MUAs
e proportioTh n of total weekday and weekend trip leg arrivals using motorised modes by
me of day for all purposes and for all destinations in MUAs is illustrated in Figure 9.20.
Th end trip leg arrivals using motorised
odes, by time of the day, are given in Appendix D. The unweighted samples on
nd
sur evelopment of the NZHTS questionnaire design compared with
revious surveys.
Th d trip leg arrivals,
tegorised by time of day in MUAs, shows that:
est.
d the second afternoon
peak occurs at approximately 1700h.
est
ti
The graph reflects traffic patterns occurring throughout a typical weekday and weekend.
e numbers of unweighted weekday and week
m
weekdays (37 983) and weekends (15 711) are large. The introduction of the weeke
veys is an important d
p
e analysis of the proportions of total weekday and weeken
ca
• Three peak hours are typical: the morning peak (approximately 0800h) is high
The first afternoon peak occurs at approximately 1500h an
• The weekend peaks are not quite as great as the weekday peaks, and the high
occur at 1100h and 1200h.
89

NATIONAL TRAVEL PROFILES PART A: DESCRIPTION OF DAILY TRAVEL PATTERNS
Figure 9.20 Total weekday and weekend arrival timess for motorised modes of transport as a proportion of daily flow.
9.5 Summary
This chapter has brought together all the modes and sorted them by purpose, by
departure time and arrival time. The typical daily variations and peak hours (and the off-
peaks), which might be used for design and policy formulation, are illustrated in Figures
9.1 to 9.20.
Departures from home are analysed in Section 9.2, and the graphs and tables illustrate
how they are distributed for the defined trip leg purposes according to time of day. Both
the typical weekday and weekend are included on all the graphs.
The departures from home in the 0800h–0900 hperiod are, of course, dominated by the
trip legs to work and the trip legs to education providers (school or university). However,
a range of shopping, recreation, social and other trip legs are also undertaken on an
ongoing basis throughout the day. The unweighted number of trip legs surveyed that
were used to derive these graphs are set out in Appendix D. The analysis of departures
has not included non-home based trips i.e. all these graphs have trip legs starting from
home. The data used in this analysis includes the travel surveyed in all three area types
(MUAs, SUAs and RAs).
In Section 9.3, the arrival patterns at the destinations are analysed. This covers all trip
leg purposes, including those from home to other destinations, along with the arrivals at
an activity from all other origins. Again, the unweighted trip legs contributing to these
graphs and tables are included in Appendix D. 90

9. Travel by time of day
91
in ips tend to
peak bet n at 1600h. However, recreation also has
another peak This information gives a clear
poses.
To give an understanding of overall daily travel patterns, an analysis of the movement in
the MUAs alone is provided in Section 9.4. The analysis considers arrivals using motorised
transport for all trip purposes at all destinations for typical weekdays and at weekends
(Figure 9.20). On weekdays, two arrival times dominate: 0700–0800h and also 1400–
1500h. These each represent 11 % of all trip legs by all modes during the day. In the
weekend, a slightly lower peak of 10% between 1100h and 1200h is typical, with the
afternoon maintaining a steady 9% through to 1600h before it declines.
Shopping, personal bus ess/services, medical/dental, social and recreation tr
ween 1100h and 1200h, and agai
after work between 1700h and 1800h.
indication as to the times when more detailed traffic surveys, and pedestrian and vehicle
counts might be undertaken to study these trip leg pur

NATIONAL TRAVEL PROFILES PART A: DESCRIPTION OF DAILY TRAVEL PATTERNS
92
10. Summary and recommendations
10.1 Summary
This report was commissioned as part of a National Travel Profile research project to
analyse and make a ‘Description of Daily Travel Patterns’ from the continuing NZHTS
2003 to 2006. It was designed to provide a summarised description of New Zealand travel
profiles on a national basis. It originated from a desire to provide a readily available
information source which was convenient to researchers and transportation planners. It
also provides an initial step toward later research as a basis for further analysis of the
NZHTS data to describe trends and travel variables suited to the future prediction of
travel. It is presented through tables, graphs and diagrams in a concise form to meet the
information needs of a wide range of persons and institutions who are involved in
transportation policy and planning issues.
The range of tables and graphs included cover comparisons of:
• personal travel,
• travel mode,
• travel purpose,
• social inclusion and accessibility, and
• travel by time of day.
The data has been sorted according to MUAs, SUAs and RAs.
The trip purposes, mode definitions and local government population groupings used here
are those defined in the Ministry of Transport’s NZHTS. The 2003–2006 dataset used here
has not provided a basis for assessing trend analysis, or regional or more detailed
comparison of urban settlements of different sizes. Such trends and inter-regional
comparisons will, however, be capable of analysis when the fourth year (2007) of NZHTS
surveys are included in the continuing dataset.
This report meets the research objectives of describing, on a national basis, the daily
travel profile derived from the NZHTS.

10. Summary and recommendations
93
10.2 Some ongoing matters
During this research, several issues emerged, some of which require further intensive
investigation as research projects. This way, greater use could be made of the NZHTS
datasets in the future. Other matters would also benefit from further analysis of the
existing datasets. These would integrate the current research with a range of other
related research projects.
Three aspects warranting more analysis and research, and which also receive priority in
the recommendations which follow, are:
• As already mentioned, this present project and report is limited by not having a
five-year dataset. When the 2007 NZHTS surveys are added, this will enable
regional and city-based analyses and comparisons of travel trends over the five
year period to be undertaken.
• The present three groupings (MUA, SUA, RA) are defined by local government
boundaries which, in some cases, do not reflect transportation catchments and the
differences of travel generated by urban and rural settlement patterns. In some
metropolitan urban regions, e.g. Auckland and Wellington, the present groupings
will, after the 2007 surveys are added, enable comparative analysis. But in others,
such as Canterbury, Nelson and the Bay of Plenty, the data should be
disaggregated and regrouped, allowing valid comparison of MUA and RA household
travel patterns.
The conclusion of this research project is that such re-sorting of the dataset would
bring a better understanding of the variations in travel patterns. It would also
improve the prospect of being able to develop transportation models for trip
calculation and prediction purposes from the NZHTS surveys. This would have
significant benefits to those practitioners wishing to take advantage of the NZHTS
data when developing transportation policy, planning and Regional Land Transport
Strategies.
• The trip legs used in the NZHTS survey database are related to trip purposes with
only some of the land uses defined at each end (e.g. home, shops and education
are defined, but industries and offices are not). Progress is being made in other
research that links the ‘trip chains’ and ‘tours’. However, for transportation planning
purposes, this will also need to be extended to include definitions of the land uses
at each end of the significant trip chains so the information can be used in future
spatial land-use/transportation modelling.
Further work reconciling these two aspects, some of which is in hand in other research
projects, would give the NZHTS greater usefulness in developing models for Regional
Land Transport Strategies and transportation assessments necessary for the spatial
planning associated with urban development strategies and district plan.
The NZHTS datasets contain a wealth of information and many additional analyses might
have been undertaken in this research using the present NZHTS dataset. In this group,
NATIONAL TRAVEL PROFILES PART A: DESCRIPTION OF DAILY TRAVEL PATTERNS
94
other matters are identified here where, if time had permitted, additional analysis could
have been undertaken:
• Vehicle trip types: Research should extend the analysis of the existing NZHTS
data file to identify the proportion of trip legs or trip chains falling within the traffic
engineering definitions of primary trips, bypass trips and diverted trips for different
purposes. The research outcome would enable practitioners making development
transportation assessments to identify these component parts and the transport
effects caused by various types of development at different locations along a trip
chain. This would then enable an assessment of whether the visits are newly
generated trips, or whether they are diversions of existing trips or the primary
destination of a particular trip.
• Active mode trips: Extending the analysis of the distance, time, locations and
land uses visited by active modes (pedestrians and cyclists) would provide more
detail and possible models to explain travel by these modes. This analysis might
also identify walking/cycling thresholds on different street classes in different sizes
of settlement to assist in future planning for sustainable transportation. This is
complementary to the approved NZTA project Accessibility Research (LTR 50/07).
• Personal vehicle availability: Research should extend the household information
analysis to discover each individual’s use of household cars. This would involve
merging the vehicle use and the vehicle database in the existing dataset to assess
the trips, distance and time per person per year related to households having no
car, one car, or two or more cars. It would also yield information on the frequency
of vehicle driver and passenger trips in each of the household’s cars.
It is also observed that some of the information derived from this project as well as from
the further analysis outlined above has immediate application to other research already
commissioned by NZTA.
This present project was proposed as a preliminary study. This was seen as leading to
further analysis and grouping of variables for predicting future transportation planning.
The matters referred above are relevant to testing variables for travel prediction and
development of spatial planning policies at regional and district levels. Such regional and
district planning will derive additional benefits from the results of the NZHTS when these
are in a suitable form for assisting transportation planning, both at regional and district
levels.
10. Summary and recommendations
95
10.3 Recommendations
10.3.1 Recommendations to NZTA
• This report should be published and made available to practitioners working in the
transportation field as a national summary of travel profiles 2003–2006 derived
from the NZHST.
• Arising from the conclusions now available, including the addition of the fourth year
(2003–2007) of the NZHTS survey, a further report should be prepared to identify
trends in these travel profiles over time, and to ascertain the regional comparisons
for the three MUAs, the SUAs and the RAs identifying travel patterns for
communities of different sizes.
• The next stage in this research should be to investigate the variables obtained in
the NZHTS. This would improve the definition of household characteristics, but it
would also identify trip chains or tours which contribute to making up trip purposes
between significant and defined land uses at the origin and destination of journeys.
This would allow researchers and planners to:
– assess how well the factors surveyed in the NZHTS act as predictive variables in
forecasting future travel patterns of trip generation and trip attractions;
– investigate variables used in the household characteristics surveyed in the
NZHTS to determine if they can be used to define ‘household categories’ suited
for use in future travel prediction;
– compare the NZHTS household survey results with the Regional Council
household surveys undertaken in Auckland, Wellington and Christchurch, and
compare the NZHTS travel characteristics and surveyed variables with the
predictive variables which have been selected in these complementary regional
studies; and
– establish the degree of contrast between rural areas, urban settlements of
varying sizes, major cities and the three metropolitan areas so as to provide
descriptions of the differences. This information can then be applied to the
Regional Long-Term Strategy in the different local government regions.
10.3.2 Recommendations to the MoT
• When the next phase of reporting the NZHTS is completed, a report covering the
2003–2007 surveys (similar to that presented here) should be prepared, including
travel trends over that period, and comparisons between metropolitan areas, other
urban areas and rural settlements.
• Questions should be added to the survey that cover the personal situation and
reasons (e.g. convenience, safety, economy, temporary situation etc.) for
individuals selecting to travel ‘to work’ or ‘to shop’ by their selected mode. If,
because of the length of the present survey, this cannot be included in the present
NZHTS then some other national research, based on household surveys, is
desirable to cover the reasons for choice of mode being made by individuals in
different communities.

NATIONAL TRAVEL PROFILES PART A: DESCRIPTION OF DAILY TRAVEL PATTERNS
96
ferences
ey: 2006. London: Department for
Transport.
FHWA. 2004. 2001 National Household Travel Survey User’s Guide. Washington, DC: US
Department of Transportation, Federal Highway Administration.
Hallar, O., McDonnell, P., Mottau, C., Salathiel, D. 2005. National Travel Survey 2003 &
2004 Technical Report. London: Department for Transport, UK.
Hu, P. 2004. 2001 National Household Travel Survey Summary of Travel Trends.
Washington, DC: US Department of Transportation, Federal Highway Administration.
Land Transport Safety Authority. 2000. Travel Survey Report 1997/1998. Wellington:
Land Transport Safety Authority.
Land Transport New Zealand. 2006. Pedestrian Planning and Design Guide. Wellington:
Land Transport New Zealand.
Ministry of Transport. 1990. New Zealand Household Travel Survey, July 1989–June
1990. Traffic Research Report No.43. Wellington: MoT Traffic Research & Statistics
Section.
Ministry of Transport. 2007. Preliminary results of Household Travel Survey 2003-2004.
Wellington: Ministry of Transport.
Ministry of Transport. 2008a. Travel survey. http://www.transport.govt.nz/ongoing-
travel-survey-index/.
Ministry of Transport. 2008b. Transport monitoring indicator framework – glossary of
terms. http://www.transport.govt.nz/tmif/Glossary.htm.
NSW Ministry of Transport. 2007. 2005 Household Travel Survey Summary Report.
Sydney: Transport Data Centre, NSW Ministry of Transport.
NSW Government Department of Planning. 2007. TPDC News. Sydney: Transport &
Population Data Centre, NSW Department of Planning.
O’Fallon, C., Sullivan, C. 2005. Trip chaining: understanding how New Zealanders link
their travel. Transfund New Zealand Research Report No. 268. Wellington: Transfund
New Zealand. 70 pp.
11. Re
Department for Transport. 2006. National Travel Surv

11. References
97
O'Fallon, C. Sullivan, C. 2003. Understanding and managing weekend traffic congestion.
Paper presented at the ATRF Conference, October 2003, Wellington, New Zealand.
Statistics New Zealand. 2008. Glossary of common terms.
http://www2.stats.govt.nz/domino/external/omni/omni.nsf/wwwglsry?openview&count=500.
.

NATIONAL TRAVEL PROFILES PART A: DESCRIPTION OF DAILY TRAVEL PATTERNS
98
Appendix A: NZHTS interviewer household response – form 1
This appendix contains a facsimile of the household survey form used by investigators to
collect the household information used in the NZHTS.

Appendices
99

NATIONAL TRAVEL PROFILES PART A: DESCRIPTION OF DAILY TRAVEL PATTERNS
100

Appendices
101

NATIONAL TRAVEL PROFILES PART A: DESCRIPTION OF DAILY TRAVEL PATTERNS
102

Appendices
103

NATIONAL TRAVEL PROFILES PART A: DESCRIPTION OF DAILY TRAVEL PATTERNS
104
Appendix B: NZHTS personal questionnaire – form 2 This appendix contains a facsimile of the personal survey form used by investigators to
collect the personal information used in the NZHTS.

Appendices
105

NATIONAL TRAVEL PROFILES PART A: DESCRIPTION OF DAILY TRAVEL PATTERNS
106

Appendices
107

NATIONAL TRAVEL PROFILES PART A: DESCRIPTION OF DAILY TRAVEL PATTERNS
108

Appendices
109

NATIONAL TRAVEL PROFILES PART A: DESCRIPTION OF DAILY TRAVEL PATTERNS
110

Appendices
111

NATIONAL TRAVEL PROFILES PART A: DESCRIPTION OF DAILY TRAVEL PATTERNS
112

Appendices
113

NATIONAL TRAVEL PROFILES PART A: DESCRIPTION OF DAILY TRAVEL PATTERNS
114

Appendices
115

NATIONAL TRAVEL PROFILES PART A: DESCRIPTION OF DAILY TRAVEL PATTERNS
116

Appendices
117

NATIONAL TRAVEL PROFILES PART A: DESCRIPTION OF DAILY TRAVEL PATTERNS
118

Appendices
119

NATIONAL TRAVEL PROFILES PART A: DESCRIPTION OF DAILY TRAVEL PATTERNS
120
Appendix C: Household and personal data coding form
These tables show the coding used for creating the graphs shown in this report, along
with the definitions and possible answers to each of the survey questions.
Table C1 Coding and definitions used for household data as part of the NZHTS.
Variable name Data type Description Question no. samno N Sample number hhwload N Workload number hhdate1 N First travel day hhdate2 N Second travel day Hhdaywk1 N Day of week of first travel day (Sunday=1) Hhdaywk2 N Day of week of second travel day (Sunday=1) Hhintvr N Scheduled interviewer number actintvr N Actual interviewer number Hhphone A1 phone connected OBSOLETE
Hhstruc N
Home structure type: 1 = Separate house 2 = Two flats or houses joined together 3 = Three or more flats or houses joined together 4 = Flat or house attached to a business or shop 5 = Retirement village 6 = Bach, crib or hut (not a work camp) 7 = Caravan, cabin or tent 8 = Non private dwelling
hhsecure N
Security in place: 0 = No system 1 = Residence with locked gates 2 = Apartment block with entry phone 3 = Gated community 4 = Retirement village with security entry 9 = Other
hhsecureother A20 Other security entry system hhnumcyc N Number of bicycles 3 hhnilveh A1 Nil vehicles in household 4a
Hhtype N
Household type 1 = Person living alone 2 = Married/de facto couple only 3 = Other adults only 4 = Family (including extended) with children 5 = Family with adults only 6 = Single adult with other adult only 7 = Single adult living with children 8 = Other
2
hhtypeother A50 Other household type 2
hhrespstat N
Response status: 1 = Full response of all eligible people 2 = All person in household ‘out of survey’ 3 = Vacant dwelling 4 = Dwelling under construction 5 = Non-dwelling/vacant lot 6 = Derelict dwelling 7 = Dwelling demolished 8 = Hotel/motel/rest home 9 = No contact with household 10 = Refused pre-contact interview 11 = Language problems 12 = Death/illness in household 13 = should be empty. Previously referred to post-travel interviews incomplete, but has been split into 14 and 15 14 = Partial – pre-contact only (no post-travel interviews completed) 15 = Partial – one or more post-travel interviews completed.
RR

Appendices
121
Table C1 cont. Coding and definitions used for household data as part of the NZHTS.
Variable name Data type
Description Question number
comments2 255 Interviewer comments RR Refusal_report 255 Refusal report RR Hhaunit N Area unit OBSOLETE homeaddn N Home address number Hhnc N Number post-travel interviews completed RR
Hhnhh N Number of eligible people in household (i.e. in NZ on travel days AND normally resident OR visitors who will be there on travel days).
RR
Hhnormal_residents
N Number of people normally resident in household (excludes visitors but includes people out of NZ on travel days).
NEW LJP
Hhnotes A2000
+ General purpose notes
area2 A5
**Missing if hhweight is missing** CENTR = Central Auckland MUA = Main Urban Area NORTH = Northern Auckland SOUTH = Southern Auckland WESTE = Western Auckland rural = Rural This is the variable for stratum2
Areatype A5
**Missing if hhweight is missing** ‘Urban’ = Main urban areas ‘Rural’ = Rural areas and secondary and minor urban areas ****NB the previous definition of this was wrong! Secondary urban areas are NOT included within the ‘Urban’ definition.***** Preferable to use AREATYPE2.
Areatype2 A5
‘MUA’ = Main urban areas (pop 30 000 or more) ‘SUA’ = Secondary urban area (pop 10 000–29 999) ‘Rural’ = Rural areas and rural centres (pop<1000)
Region A18
Local government region: AUCKLAND BAY OF PLENTY CANTERBURY GISBORNE HAWKES BAY MANAWATU/WANGANUI NELSON/MARLBOROUG/TASMAN NORTHLAND OTAGO SOUTHLAND TARANAKI WAIKATO WELLINGTON WEST COAST
Meshid N int(samno/1000) hhweight N Household weight
Hhnumhv N Number of household vehicles (usually parked overnight)
HH4a
HHnumothv N Number of non-household vehicles used by this household
HH4a & TR(E1 & E2)
Hhweight N Household weight (weighted to national annual total households)
Hh4avgwgt Household weight/4, gives estimates per year when using four-year dataset.

NATIONAL TRAVEL PROFILES PART A: DESCRIPTION OF DAILY TRAVEL PATTERNS
122
Table C2 Coding and definitions used for person data as part of the NZHTS.
Variable name Data type Description Question number
samno N Sample number person N Person number HH1
pename A20 First name/identifier HH1(a), RR(a)
perelat A3
Relationship to head of household: A = Aunt BDR = Boarder BOY = Boyfriend BRL = Brother-in-law BRO = Brother COD = Cousin’s daughter COS = Cousin’s son COU = Cousin COW = Cousin’s wife D = Daughter DL = Daughter-in-law F = Father FL = Father-in-law FLT = Flatmate FR = Friend GRD = Granddaughter GRF = Grandfather GRL = Girlfriend GRM = Grandmother GRS = Grandson H = Self HUS = Husband M = Mother ML = Mother-in-law NCE = Niece NPH = Nephew PTR = Partner S = Son SA = Step-aunt SBR = Stepbrother SD = Stepdaughter SF = Stepfather SIL = Sister-in-law SIS = Sister SL = Son-in-law SM = Stepmother SS = Stepson SSI = Stepsister SU = Step-uncle U = Uncle UNK = Unknown VIS = Visitor/guest W = Wife
HH1(b)
sex A1 Person’s sex HH1I age N Age computed from date of birth or estimated HH1(e) estage A1 Age was estimated HH1(e)
peinout N
In survey: 1 = HH member 2 = Visitor (surveyed) 3 = Visitor (gone) 4 = Out of NZ
HH1(f), RR(f)
Hh_member A1
Distinguishes between people listed on pink form as household members, (including visitors or out of NZ), and those outside household who appear in the trips database as drivers or non-household passengers. HH_member is No for non-household drivers and passengers; otherwise it is Yes, which means it is Yes for visitors and out of NZ. To exclude them all, use both hh_member and peinout.

Appendices
123
Table C2 cont. Coding and definitions used for person data as part of the NZHTS.
Variable name Data type Description Question number
perespstat N
Response status: 1 = Yes – completed 2 = No – not completed 3 = Partially completed
86, RR(g)
peproxy N Person/proxy peemp01 A1 Not yet at school (Y/N) 1 peemp02 A1 Student full time (Y/N) 1 peemp03 A1 Student part time (Y/N) 1 peemp04 A1 Work full time (Y/N) 1 peemp05 A1 Work part time (Y/N) 1 peemp06 A1 Work casual (Y/N) 1 peemp07 A1 Looking for work (Y/N) 1 peemp08 A1 Keeping house (Y/N) 1 peemp09 A1 Retired/aged pensioner (Y/N) 1 peemp10 A1 Other beneficiary (Y/N) 1 peemp11 A1 Other (Y/N) 1 peempother A20 Other description 1 Pesaddn N School address number 3 Pejobs A1 More than one job 5 Peoccup A100 Occupation 7 peoccupcode A5 Occupation code
Peemplo N
Employee status: 1 = For an employer for wages or salary 2 = In your own business with employees 3 = In your own business without employees 4 = Without pay in a family business 5 = Other
8
Pewaddn N Work address number 9 pe1mjog A1 Travel Day 1 memory jogger 11 pe1anyw A1 Travel Day 1 went anywhere 12
pe1strt N
Travel Day 1 start of day location: 1 = Home 2 = Work – main job 3 = Work – other job 4 = Social/recreation 5 = Hospital/medical 6 = Other
14
pe1addn N Travel Day 1 start of day address number 15
pe1numstops N Travel Day 1 number of stops Sometimes 1 more or less than actual trips and has 0 instead of missing. Use tripcnt1.
Tripcnt1 N Travel Day 1 number of stops as counted from trip dataset
pe2mjog A1 Travel Day 2 memory jogger 19 pe2anyw A1 Travel Day 2 went anywhere 20
pe2strt N
Travel Day 2 start of day location: 1 = Home 2 = Work – main job 3 = Work – other job 4 = Social/recreation 5 = Hospital/medical 6 = Other
22
pe2addn N Travel Day 2 start of day address number 23
pe2numstops N Travel Day 2 number of stops Sometimes 1 more or less than actual trips and has 0 instead of missing. Use tripcnt2.
Tripcnt2 N Travel Day 2 number of stops as counted from trip dataset
pe0alco A1 Alcohol used – day before travel Day 1 26 pe1alco A1 Alcohol used – travel Day 1 27 pe2alco A1 Alcohol used – travel Day 2 30 peanyax1 A1 Any accidents in last year 32

NATIONAL TRAVEL PROFILES PART A: DESCRIPTION OF DAILY TRAVEL PATTERNS
124
Table C2 cont. Coding and definitions used for personal data as part of the NZHTS.
Variable name Data type Description Question number
peaccn1 N Accidents – number in last year 33 peanyax2 A1 Any accidents in previous year 34 peaccn2 N Accidents – number in previous year 35
Peanycyc A1
Cycled in last year? NB: in years 1–4: this defaults to No – to find actual number of Nos use ‘no answer to pefreqcyc’
78
Pefreqcyc N
How often bicycle ridden in last four weeks: 1 = Not at all this month 2 = On 1–4 days 3 = On 5–9 days 4 = On 10–19 days 5 = On 20 days or more
79
Peexp N
Lifetime driving experience: 1 = Never driven 2 = Less than 2000 km 3 = 2001–20 000 km 4 = 20 001–200 000 km 5 = More than 200 000 km 6 = Don’t know
80
pekmcar N
km driven in car last year: 1 = 0–99 km 2 = 100–1999 km 3 = 2000–4999 km 4 = 5000–9999 km 5 = 10 000–14 999 km 6 = 15 000–19 999 km 7 = 20 000–29 999 km 8 = 30 000–49 999 km 9 = 50 000–99 999 km 10 = 100 000+ km 11= Don’t know
81
pekmmc N
km driven on motorbike last year: 1 = 0–99 km 2 = 100–999 km 3 = 1000–1,999 km 4 = 2000–2999 km 5 = 3000–4999 km 6 = 5000–9999 km 7 = 10 000= km
81
peclicn A1 Car licence held 82
pectype N
Car licence type: 1 = Full 2 = Restricted 3 = Learner
82
pecyear N Car licence number of years held 82 pecmonth N Car licence number of months held 82 peblicn A1 Motorbike licence held 82
pebtype N
Motorbike licence type: 1 = Full 2 = Restricted 3 = Learner
82
pebyear N Motorbike licence number of years held 82 pebmonth N Motorbike licence number of months held 82 petlicn A1 Truck licence held 82
pettype N
Truck licence type: 1 = Full 2 = Restricted 3 = Learner
82
petyear N Truck licence number of years held 82 petmonth N Truck licence number of months held 82

Appendices
125
Table C2 cont. Coding and definitions used for personal data as part of the NZHTS.
Variable name Data type Description Question number
peracat01 A1 Racial category: NZ European 84 peracat02 A1 Racial category: NZ Maori 84 peracat03 A1 Racial category: Other European descent 84 peracat04 A1 Racial category: Samoan 84 peracat05 A1 Racial category: Cook Island Maori 84 peracat06 A1 Racial category: Tongan 84 peracat07 A1 Racial category: Niuean 84 peracat08 A1 Racial category: Other Pacific 84 peracat09 A1 Racial category: Chinese 84 peracat10 A1 Racial category: Indian/Pakistani 84 peracat11 A1 Racial category: Other Southeast Asian 84 peracat12 A1 Racial category: Other 84 peracat13 A1 Racial category: object to stating 84 peracatother A30 Racial category: other description 84
peincome A1
Personal income category: L = No income M = Under $10,000 N = $10,001–$15,000 P = $15,001–$20,000 R = $20,001–$30,000 S = $30,001–$40,000 T = $40,001–$50,000 U = $50,001–$70,000 W = $70,001–$100,000 Q = $100,000+ X = Don’t know Z = Object to stating
85
proxyreason N
Reason for proxy: 1 = Child under ten 2 = Language difficulties 3 = Hearing impaired 4 = Speech impaired 5 = Insufficient comprehension 6 = Long-term illness
licdisq A1 Driver’s licence disqualified 82 pelivewith A1 Lives with husband/wife/partner 83
agegp N
Age group of non-household member: 1 = 0–9 2 = 10–14 3 = 15–19 4 = 20–24 5 = 25–29 6 = 30–79 7 = 80+
notcompletedreason
N
Reason forms not completed: 1 = Refusal 2 = Non-contact 3 = Language problems 4 = Death/illness/disability
87, RR(h)
Pe1home A1 Travel Day 1 did NOT end at home 17 pe2home A1 Travel Day 2 did NOT end at home 25 peIntEditTime N Time interviewer spent editing peOtherEditTime N Time others spent editing
pequality A1
Interviewer estimate of data quality: E = Excellent A = Adequate D = Dubious
88, RR(j)
peweight N Person weight
Pe4avgwgt N Person weight/4, gives estimates per year when using four-year dataset.
hhdate1 N First travel day hhdate2 N Second travel day Hhdaywk1 N Day of week of first travel day (Sunday=1) Hhdaywk2 N Day of week of second travel day (Sunday=1)

NATIONAL TRAVEL PROFILES PART A: DESCRIPTION OF DAILY TRAVEL PATTERNS
126
Table C3 Coding and definitions used for trip data as part of the NZHTS.
Variable name Data type Description Question number
Year N
Survey year number: 1 = 2002/03 2 = 2003/04 3 = 2004/05 4 = 2005/06
Samno N Sample number Person N Person number
Yearnm N Survey year name (in format 200203, 200304 etc.)
hhdate1 N First travel day hhdate2 N Second travel day Hhdaywk1 N Day of week of first travel day (Sunday=1) Hhdaywk2 N Day of week of second travel day (Sunday=1)
Daywk N Day of week of the travel day this trip takes place on (Sunday=1). Based on hhdaywk1 and hhdaywk2.
Tripday N Trip day Tripno N Trip number Trleave N Departure time 17A, 25A trleaveh
N Departure time in hours with decimal (+24 if next day)
A
trleavetm Sastime Departure time, SAS time format A
Trleavenextday A1 Departure time is next day (after midnight and before 0400)
A
Traddno N Destination address number B Trarriv N Arrival time C Trarrivtm SAStime Departure time, SAS time format C
Trarrivh N Departure in hours with decimal (+24.00 if next day)
C
Trnextday A1 Arrival time is next day C Duration N Duration of trip (hours) Durmin N Duration (minutes)
Tractiv N
Activity – what done there: 1 = Home 2 = Work – main job 3 = Work – other job 4 = Work – employer’s business 5 = Education 6 = Shopping 7 = Social welfare 8 = Personal business/services 9 = Medical/dental 10 = Social visits 11 = Recreational 12 = Change mode 13 = Accompany someone else 14 = Left country 15 = Other
D
Purpose N Overall journey purpose, where a journey is a series of trips with purpose = change mode. Same codes as tractiv.
Vehicle A1 Vehicle number E
Trmode N
Travel mode: 1 = Vehicle driver 2 = Vehicle passenger 3 = Bicycle 4 = Train 5 = Bus 6 = Ferry 7 = Plane 8 = Taxi 9 = Other 10 = Mobility Scooter 0 = Walk
E

Appendices
127
Table C3 cont. Coding and definitions used for personal data as part of the NZHTS.
Variable name Data type Description Question number
trmodeother A15 Travel mode other E trquickest A1 Quickest route taken G trmidaddno N Route taken address no G Trdistn N Reported distance in km F Trpeopl N Number of people in vehicle H
Trwpark N
Where parked: 1 = Not parked 2 = Off street – resident’s property 3 = Off street – private 4 = Off street – public 5 = On street – time limit 6 = On street – no time limit 7 = Other
I
trwparkother A20 Where parked other I Trroads N Number of roads crossed K Trpedes N Number of pedestrian crossings used L startaddno N Start address number tractivother A30 Activity other D CalculatedDistance N Critchlow’s calculated distance calcdist
N Same as CalculatedDistance but easier to type
BestDist N Best available distance - Calculated dist if credible, or else estimated dist
distused A7
Indicates which distance estimate used for analysis: Geodist = CalculatedDistance Estdist = Respondent estimated distance (trdistn) Neither = both distance sources failed criteria, bestdist and duration set to missing. BadGeo = should not arise – means do not use calculated distance but no alternative explored.
Trip_comments A1
Method of calculation for the trip: Q = Quickest route W = Waypoint used X = Waypoint provided but not used N = Trip not generated
Vyear N Year of manufacture HH4a(d)
Vtype N
Body type: 1 = Car/stationwagon 2 = Van/ute/passenger van 3 = 4-wheel drive 4 = Truck 5 = Taxi 6 = Motorbike 7 = Other
HH4a(e)
Vcc N Engine capacity HH4a(f)
Vowner N
Vehicle owner: 1 = Member of household 2 = Company owned/leased 3 = Rental 4 = Other
HH4a(h)
Vfuel N
Vehicle fuel: 1 = Petrol 2 = Diesel 3 = LPG/CNG 4 = Dual fuel 5 = Electric 6 = Other
HH4a(g)

NATIONAL TRAVEL PROFILES PART A: DESCRIPTION OF DAILY TRAVEL PATTERNS
128
Table C3 cont. Coding and definitions used for personal data as part of the NZHTS.
Variable name Data type Description Question number
area2 A5
**Missing if hhweight is missing** CENTR = Central Auckland MUA = Main Urban Area NORTH = Northern Auckland SOUTH = Southern Auckland WESTE = Western Auckland rural = Rural This is the variable for stratum2
Areatype A5
**Missing if hhweight is missing** ‘Urban’ = Main urban areas ‘Rural’ = Rural areas and secondary and minor urban areas ****NB the previous definition of this was wrong! Secondary urban areas are NOT included within the ‘Urban’ definition.***** Preferable to use AREATYPE2.
Areatype2 A5
‘MUA’ = Main urban areas (pop 30 000 or more) ‘SUA’ = Secondary urban area (pop 10 000–29 999) ‘Rural’ = Rural areas and rural centres (pop<1000)

Appendices
129

NATIONAL TRAVEL PROFILES PART A: DESCRIPTION OF DAILY TRAVEL PATTERNS
130
Appendix D: Table of unweighted trip legs by time of day
D1 Home-based departures by purpose and time of day: unweighted sample size.
Table D1 Departure times from home for work trips on weekdays and weekends (unweighted sample size).
Weekday unweighted sample
size
Weekend unweighted sample
size Period (start)
No. of departures (trip legs)
00 1 1
01 0 0
02 0 0
03 11 1
04 98 17
05 274 47
06 699 67
07 1601 117
08 993 150
09 266 88
10 99 59
11 58 32
12 31 21
13 32 11
14 56 15
15 33 7
16 15 6
17 14 2
18 2 0
19 3 0
20 1 0
21 2 0
22 0 1
23 0 0
Total 4289 642

Appendices
131
Table D2 Departure times from home for education trips on weekdays and weekends (unweighted sample size).
Weekday unweighted sample
size
Weekend unweighted sample
size Period (start)
No. of departures
00 0 0
01 0 0
02 0 0
03 0 0
04 1 0
05 0 3
06 3 0
07 203 6
08 1690 26
09 94 17
10 34 6
11 11 2
12 25 6
13 10 3
14 6 1
15 4 1
16 0 0
17 1 0
18 2 0
19 0 0
20 0 0
21 0 0
22 0 0
23 0 0
Total 2084 71

NATIONAL TRAVEL PROFILES PART A: DESCRIPTION OF DAILY TRAVEL PATTERNS
132
Table D3 Departure times from home for shopping trips on weekdays and weekends (unweighted sample size).
Weekday unweighted sample
size
Weekend unweighted sample
size Period (start)
No. of departures
00 0 1
01 0 0
02 0 0
03 0 0
04 1 0
05 2 0
06 14 12
07 29 42
08 56 93
09 52 212
10 58 242
11 56 163
12 57 94
13 59 99
14 54 74
15 57 53
16 56 42
17 49 36
18 35 11
19 29 3
20 22 2
21 14 1
22 7 0
23 6 0
Total 713 1180

Appendices
133
Table D4 Departure times from home for ‘personal business/services’ trips on weekdays and weekends (unweighted sample size).
Weekday unweighted sample
size
Weekend unweighted sample
size Period
(start) No. of departures
00 0 0
01 0 0
02 0 0
03 0 0
04 2 0
05 11 0
06 35 11
07 108 26
08 185 30
09 193 129
10 146 91
11 92 30
12 58 28
13 59 30
14 39 19
15 32 13
16 20 5
17 10 7
18 3 3
19 1 1
20 0 0
21 0 0
22 0 0
23 0 0
Total 994 423

NATIONAL TRAVEL PROFILES PART A: DESCRIPTION OF DAILY TRAVEL PATTERNS
134
Table D5 Departure times from home for medical/dental trips on weekdays and weekends (unweighted sample size).
Weekday unweighted sample
size
Weekend unweighted sample
size Period
(start) No. of departures
00 0 0
01 0 0
02 0 0
03 0 0
04 1 0
05 0 0
06 2 0
07 21 1
08 69 3
09 137 7
10 116 4
11 102 3
12 43 1
13 73 0
14 84 2
15 83 0
16 42 0
17 12 0
18 4 0
19 4 0
20 1 0
21 1 0
22 0 0
23 0 0
Total 795 21

Appendices
135
Table D6 Departure times from home for ‘social visits’ trips on weekdays and weekends (unweighted sample size).
Weekday unweighted sample
size
Weekend unweighted sample
size Period
(start) No. of departures
00 0 0
01 0 0
02 0 0
03 0 0
04 2 0
05 5 7
06 20 6
07 78 31
08 171 110
09 202 211
10 206 175
11 99 127
12 82 82
13 64 83
14 50 64
15 25 57
16 24 31
17 22 31
18 17 19
19 23 14
20 7 2
21 2 3
22 0 0
23 0 0
Total 1099 1053

NATIONAL TRAVEL PROFILES PART A: DESCRIPTION OF DAILY TRAVEL PATTERNS
136
Table D7 Departure times from home for recreational trips on weekdays and weekends (unweighted sample size).
Weekday unweighted sample
size
Weekend unweighted sample
size Period
(start) No. of departures
00 0 0
01 0 0
02 0 0
03 0 0
04 2 0
05 35 4
06 104 23
07 84 51
08 141 102
09 162 142
10 107 124
11 59 113
12 47 54
13 46 58
14 30 43
15 26 21
16 19 14
17 18 10
18 13 11
19 15 3
20 2 1
21 0 0
22 0 0
23 0 1
Total 910 775

Appendices
137
Table D8 Departure times from home for ‘change mode’ trips on weekdays and weekends (unweighted sample size).
Weekday unweighted sample
size
Weekend unweighted sample
size Period
(start) No. of departures
00 0 0
01 0 0
02 0 0
03 2 0
04 2 0
05 21 1
06 84 5
07 328 13
08 272 23
09 55 23
10 49 15
11 23 13
12 20 20
13 16 6
14 6 8
15 4 3
16 3 5
17 1 1
18 1 1
19 0 0
20 0 0
21 0 0
22 0 0
23 0 0
Total 887 137

NATIONAL TRAVEL PROFILES PART A: DESCRIPTION OF DAILY TRAVEL PATTERNS
138
D2 Daily trip leg arrivals by purpose and time of day: unweighted sample size
Table D9 Arrival time at home on weekends and weekdays (unweighted sample size).
Weekday unweighted sample
size
Weekend unweighted sample
size Period
(start) No. of arrivals
00 82 108
01 47 53
02 18 37
03 17 41
04 10 6
05 26 14
06 109 18
07 274 82
08 627 156
09 732 280
10 877 528
11 1316 777
12 1730 876
13 1131 633
14 1312 736
15 3768 824
16 2948 965
17 3566 1019
18 2057 658
19 1130 417
20 897 367
21 866 292
22 572 261
23 328 176
Total 24 440 9324

Appendices
139
Table D10 Arrival time at work (main job) on weekends and weekdays (unweighted sample size).
Weekday unweighted sample
size
Weekend unweighted sample
size Period
(start) No. of arrivals
00 5 13
01 9 10
02 15 6
03 15 3
04 96 19
05 248 41
06 608 72
07 1827 115
08 2350 211
09 1198 200
10 777 147
11 710 102
12 861 98
13 1029 95
14 812 119
15 649 73
16 529 70
17 348 55
18 141 26
19 88 44
20 43 11
21 31 7
22 52 6
23 23 1
Total 12 464 1544

NATIONAL TRAVEL PROFILES PART A: DESCRIPTION OF DAILY TRAVEL PATTERNS
140
Table D11 Arrival time at work (other job) on weekends and weekdays (unweighted sample size).
Weekday unweighted sample
size
Weekend unweighted sample
size Period
(start) No. of arrivals
00 0 0
01 0 2
02 1 0
03 12 0
04 20 0
05 16 1
06 27 0
07 22 10
08 69 14
09 53 15
10 34 8
11 30 14
12 27 10
13 29 8
14 28 7
15 38 8
16 26 13
17 20 5
18 19 4
19 11 0
20 5 0
21 5 1
22 3 0
23 3 3
Total 498 123

Appendices
141
Table D12 Arrival time at work (employer’s business) on weekends and weekdays (unweighted sample size).
Weekday unweighted sample
size
Weekend unweighted sample
size Period
(start) No. of arrivals
00 3 0
01 0 0
02 2 0
03 2 0
04 7 0
05 17 4
06 43 3
07 128 15
08 249 19
09 282 25
10 205 21
11 194 20
12 178 17
13 162 15
14 199 15
15 173 9
16 113 11
17 88 12
18 46 11
19 33 8
20 9 4
21 9 0
22 3 0
23 8 0
Total 2153 209

NATIONAL TRAVEL PROFILES PART A: DESCRIPTION OF DAILY TRAVEL PATTERNS
Table D13 Arrival time at education on weekends and weekdays (unweighted sample size).
Weekday Weekend
142
unweighted sample size
unweighted sample size
Period
(start) No. of arrivals
00 0 0
01 0 0
02 0 0
03 0 0
04 0 0
05 0 3
06 2 0
07 104 7
08 2452 37
09 301 22
10 94 15
11 57 5
12 122 14
13 118 9
14 61 10
15 97 5
16 28 5
17 20 2
18 26 1
19 25 1
20 2 0
21 0 0
22 0 0
23 0 0
Total 3509 136

Appendices
Table D14 Arrival time at shopping on weekends and weekdays (unweighted sample size).
143
Weekday unweighted sample
size
Weekend unweighted sample
size Period
(start) No. of arrivals
00 0 4
01 1 1
02 0 1
03 0 5
04 5 2
05 4 0
06 28 9
07 126 47
08 308 112
09 630 335
10 985 606
11 1017 579
12 979 497
13 907 411
14 763 456
15 845 391
16 745 293
17 684 261
18 403 207
19 239 100
20 116 66
21 76 20
22 9 13
23 12 6
Total 8882 4422

NATIONAL TRAVEL PROFILES PART A: DESCRIPTION OF DAILY TRAVEL PATTERNS
144
Table D15 Arrival time at personal business/services on weekends and weekdays (unweighted sample size).
Weekday unweighted sample
size
Weekend unweighted sample
size Period
(start) No. of arrivals
00 1 3
01 1 2
02 0 1
03 1 2
04 0 0
05 13 0
06 38 17
07 108 24
08 307 46
09 439 160
10 438 181
11 403 138
12 375 113
13 395 114
14 443 98
15 463 89
16 345 80
17 237 47
18 126 39
19 97 25
20 48 17
21 30 9
22 14 4
23 10 1
Total 4332 1210

Appendices
145
Table D16 Arrival time for ‘medical/dental’ trip legs on weekends and weekdays (unweighted sample size).
Weekday unweighted sample
size
Weekend unweighted sample
size Period
(start) No. of arrivals
00 0 0
01 0 1
02 0 0
03 0 0
04 1 0
05 0 0
06 1 0
07 9 0
08 67 2
09 123 12
10 135 14
11 128 12
12 53 2
13 64 2
14 92 5
15 90 1
16 44 3
17 20 1
18 4 0
19 5 2
20 1 0
21 1 0
22 0 1
23 0 0
Total 838 58

NATIONAL TRAVEL PROFILES PART A: DESCRIPTION OF DAILY TRAVEL PATTERNS
146
Table D17 Arrival time for social visits on weekends and weekdays (unweighted sample size).
Weekday unweighted sample
size
Weekend unweighted sample
size Period
(start) No. of arrivals
00 16 37
01 2 35
02 4 22
03 5 18
04 3 3
05 5 7
06 17 7
07 95 29
08 267 135
09 427 289
10 491 397
11 503 448
12 597 476
13 503 421
14 449 365
15 658 414
16 553 385
17 637 367
18 558 395
19 563 293
20 296 167
21 160 75
22 59 61
23 35 58
Total 6903 4904

Appendices
147
Table D18 Arrival time at recreation on weekends and weekdays (unweighted sample size).
Weekday unweighted sample
size
Weekend unweighted sample
size Period
(start) No. of arrivals
00 6 11
01 0 2
02 0 0
03 0 0
04 2 0
05 34 0
06 102 21
07 128 54
08 151 150
09 283 210
10 270 242
11 265 240
12 291 246
13 253 259
14 276 242
15 364 221
16 389 199
17 377 150
18 347 90
19 307 62
20 85 41
21 48 22
22 28 11
23 8 8
Total 4014 2481
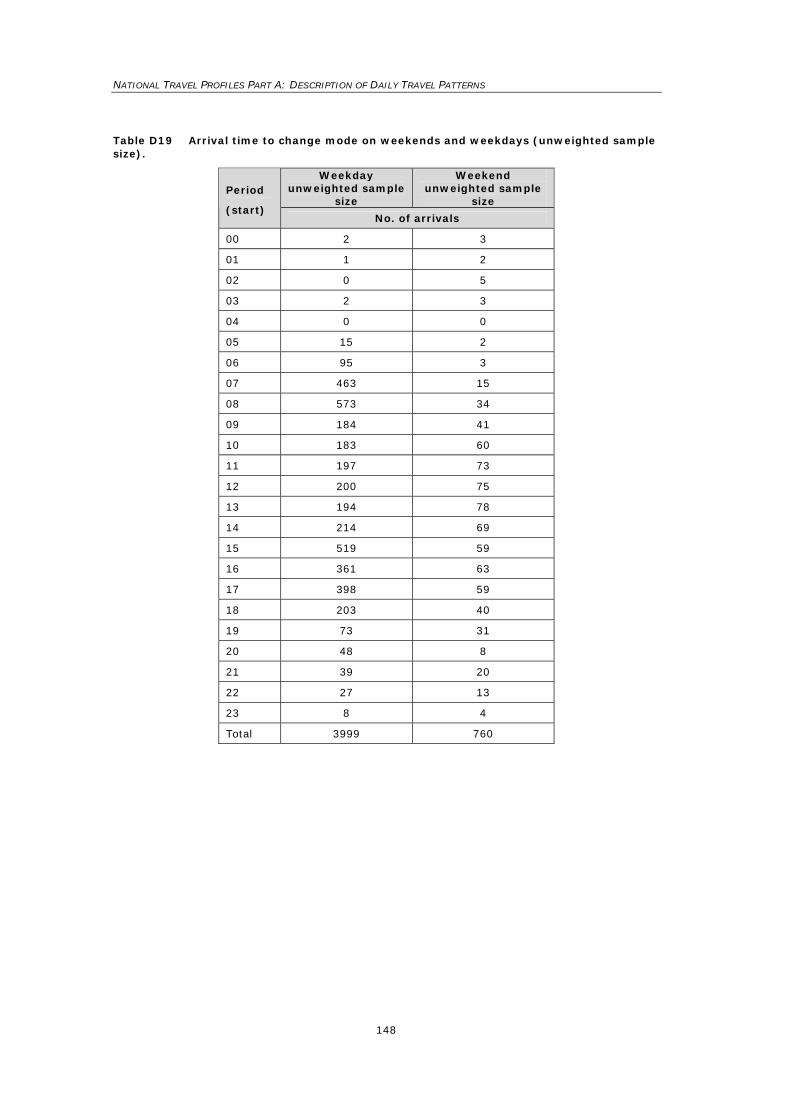
NATIONAL TRAVEL PROFILES PART A: DESCRIPTION OF DAILY TRAVEL PATTERNS
148
Table D19 Arrival time to change mode on weekends and weekdays (unweighted sample size).
Weekday unweighted sample
size
Weekend unweighted sample
size Period
(start) No. of arrivals
00 2 3
01 1 2
02 0 5
03 2 3
04 0 0
05 15 2
06 95 3
07 463 15
08 573 34
09 184 41
10 183 60
11 197 73
12 200 75
13 194 78
14 214 69
15 519 59
16 361 63
17 398 59
18 203 40
19 73 31
20 48 8
21 39 20
22 27 13
23 8 4
Total 3999 760

Appendices
149
D3 Arrival times for motorised modes in MUAs (all purposes) on weekends and weekdays.
Table D20 Arrival times for motorised trip legs in MUAs on weekdays and weekends (unweighted sample size).
Weekday unweighted sample
size
Weekend unweighted sample
size Period (start)
No. of arrivals
0 70 86
1 31 59
2 25 34
3 34 32
4 92 16
5 213 38
6 492 74
7 1629 212
8 4030 494
9 2480 1019
10 2279 1356
11 2408 1454
12 2748 1472
13 2318 1245
14 2546 1286
15 3867 1294
16 3189 1273
17 3429 1129
18 2197 892
19 1465 591
20 881 426
21 796 274
22 485 204
23 279 151
Total 37 983 15 111

NATIONAL TRAVEL PROFILES PART A: DESCRIPTION OF DAILY TRAVEL PATTERNS
150
Appendix E Glossary and abbreviations
Active modes Walking and cycling.
Average day Based on the average over Monday to Sunday. To calculate the total
annual estimates, figures for an average day are multiplied by 365.
LTNZ Land Transport New Zealand
MoT Ministry of Transport New Zealand
Motorised trip legs Trip legs as vehicle drivers or passengers only.
MUA Major Urban Areas. Areas with a population of at least 30 000.
NSW New South Wales
NTHS National Household Travel Survey (United States)
NZHTS New Zealand Household Travel Survey. This has been commissioned
by the MoT.
Private mode Includes vehicle driver, vehicle passenger, bicycle and walking.
Public mode Includes train, bus, ferry, plane and taxi.
RA Rural Areas. Areas with a population less than 10,000 and all other
rural areas.
SUA Secondary Urban Areas. Areas with a population between 10 000
and 30 000.
Travel Includes all on-road travel by any mode; any walk which involves
crossing a road or walking for 100 metres or more along a public
footpath or road; cycling on a public road or footpath; some air and
sea travel. Excludes off-road activities such as tramping, mountain
biking, walking around the mall or around the farm.
Trip chains A connected series of trip legs. For example, a journey from work to
home but where the individual stops 200 m from home to buy bread
would be considered a single trip chain but two trip legs.
Trip leg distance For road-based trip legs, distances are calculated by measuring the
distance from the start address along the roads to the finish
address. If an unusual route was used, the interviewer records an
intermediate point to indicate the route; otherwise, the journey is
assumed to follow the quickest available route.
Trip leg duration The time between the reported departure time in minutes of a trip
leg and the reported arrival time.
Trip leg purpose The activity that is done at a trip leg destination.
Trip leg A section of travel by a single mode with no stops.
Weekday travel Average amount of travel over Monday to Friday. Using the 24 hour
clock, it is 0000h Monday to 2359h Friday (i.e. midnight Sunday to
midnight Friday).
Weekend travel Average amount of travel undertaken over Saturdays and Sundays.
Using the 24 hour clock, it is 0000h Saturday to 2359h Sunday (i.e.
midnight Friday to midnight Sunday).

Appendices
151


National Travel Profiles Part A: Description of Daily Travel Patterns NZ Transport Agency Research Report 353
Top Related