


Languages
Pages
Legal

Report on
Transit Fares
August 2014

Department of Transportation
Metro Transit Division
King Street Center, KSC-TR-0415
201 S Jackson St.
Seattle, WA 98104
206-553-3000 TTY Relay: 711
www.kingcounty.gov/metro

King County Metro | Report on Transit Fares
1
Contents Executive Summary ........................................................................................................................ 3
Introduction ..................................................................................................................................... 5
Ordinance 17476, Section 116, Proviso 1 ................................................................................... 5
Fare Policy Goals ............................................................................................................................ 7
Balancing policy goals .............................................................................................................. 10
Background ................................................................................................................................... 13
Structure of Metro’s fare system............................................................................................... 13
Fare revenue and farebox recovery ........................................................................................... 18
Metro’s average fare per boarding ............................................................................................ 21
Fare evasion .............................................................................................................................. 22
Business accounts ..................................................................................................................... 23
The ORCA system .................................................................................................................... 24
New low-income fare ................................................................................................................ 25
The Road to a Cashless System .................................................................................................... 27
Fare Options .................................................................................................................................. 35
Appendices .................................................................................................................................. A-1
Appendix A: Fare Policy Goals and Methods Table .............................................................. A-3
Appendix B: Metro’s Fare History ......................................................................................... A-4
Appendix C: Revenue and Ridership Projections ................................................................... A-7
Appendix D: Fare Options Data ........................................................................................... A-10
Appendix E: Peer Comparisons ............................................................................................ A-16
Appendix F: Impact of Service Hour Changes on Ridership and Revenue .......................... A-25
Appendix G: Glossary of Fare Terms and Concepts as Used by Metro ............................... A-26

King County Metro | Report on Transit Fares
2

King County Metro | Report on Transit Fares
3
Executive Summary
The primary purpose of Metro’s fares is to recover a portion of operating costs, but designing the
fare system is about much more than setting fare levels to achieve a target amount of revenue.
Fares, the fare structure, and fare payment methods affect many aspects of service that also must
be considered, such as ridership, operating speed and costs, customer satisfaction, and
affordability for people with low incomes.
To guide fare decisions, King County has adopted a range of fare policy goals: meet revenue
targets, increase ridership, be easy to understand, align with regional transit partners, reduce
costs, reflect the cost of service, enable all people—including those with low incomes—to use
public transportation, and comply with regulations. Attaining all of these goals can be difficult
because fare practices that advance one policy goal often work against others. As policy makers
make decisions concerning the fare structure, they face the challenge of considering all the
potential outcomes and balancing the tradeoffs.
Metro’s history is characterized by numerous adjustments to the fare system to achieve the right
balance. Depending on circumstances, fare changes were made to generate more revenue,
simplify the fare system, attract new riders, or achieve other goals.
Past decisions have led to remarkable progress in recent years:
Metro’s bus fare revenue increased from $78 million in 2007 to $146 million in 2013, an
increase of 87 percent that has helped Metro preserve service while revenue from sales
tax fell short of projections. Four fare increases between 2008 and 2011, closure of the
Ride Free Area in downtown Seattle in 2012, and increasing ridership all contributed to
this fare revenue growth.
Metro achieved a 29 percent farebox recovery rate—well above the 25 percent target—in
2012 and 2013. Metro’s ratio was the 13th highest among the 30 largest bus agencies in
the U.S. in 2012 (the latest year for which peer data is available). The new low-income
fare that takes effect in March 2015 will put downward pressure on the farebox recovery
rate, although in the short-term the rate will remain above the target.
Metro has moved toward alignment of our fares with our partner agencies in the region
by eliminating non-regional (Metro-only) passes. In addition, Metro’s adult one-zone
peak, youth and senior/disabled fares are currently in alignment with Sound Transit’s
“in-county” bus fares. Metro’s fares will change in March 2015, however. Following the
2015 fare change, Metro’s off-peak adult fare will continue to align with Sound Transit’s
fare.
The pass program for employers and schools has grown tremendously since its inception.
By partially or fully paying for transit passes for employees or students, participating
businesses and institutions are an important source of revenue for Metro and support the
local economy by helping employees get to work and by reducing traffic congestion.
Changes in fare levels could affect the level of participation in the future.

King County Metro | Report on Transit Fares
4
The ORCA system, rolled out in 2009, has transformed fare payment and supports
seamless fare payment on transit throughout the region. Metro and its partners have
actively promoted ORCA and expanded the network of sites where customers can
purchase and revalue their cards, and the percentage of Metro boardings paid with ORCA
cards has grown to 66 percent. The penetration of ORCA now puts Metro in position to
strive for a potential new major milestone: a cashless fare payment system that could
reduce fare system costs, speed operations, and boost customer satisfaction.
The adoption of a new reduced fare for customers with low incomes promises to make
Metro service more affordable for tens of thousands of people. This new fare will be
available only on ORCA cards, so the program will also increase ORCA use and the
associated benefits.
A number of potential fare changes could build on these successes to move Metro further toward
fare goals and help improve our financial situation. This paper presents six options, analyzing
how the outcomes would affect revenue, ridership, and other goals. It should be noted, however,
that the assumptions underlying these options will change between now and when the Executive’s
budget is submitted to and then ultimately adopted by the County Council. Data should be
treated as preliminary, with the focus being on the relative changes to ridership, revenue, farebox
recovery ratio and ORCA market penetration rather than the bottom-line numbers.

King County Metro | Report on Transit Fares
5
SECTION 1
Introduction This report provides the information requested in Section 116, Proviso 1 of King County
Ordinance 17476, which adopted the Metro Transit Division’s 2013-14 budget.
The report reviews the fare policy goals King County has established for Metro, describes the
current fare system, and reviews major fare issues and developments in Metro’s history. It
examines a critical issue for the future: how to move toward a cashless fare system. The report
also presents a number of potential fare changes and examines projected outcomes.
Additional information is provided in appendices.
Ordinance 17476, Section 116, Proviso 1
“The executive shall transmit a report on transit fares, which includes detailed
information on transit division plans to implement strategy 6.3.2 of the Strategic Plan for
Public Transportation (“Establish fare structures and fare levels that are simple to
understand, aligned with other service providers, and meet revenue targets established by
Metro's fund management policies”). The report shall also summarize fare changes
adopted after July 2010, as well as discuss market changes resulting from the ongoing
implementation of the ORCA fare media and shall provide data on the fare revenue and
ridership impacts of these changes. The report shall be developed through collaborative
input obtained through briefings of the council’s transportation, economy and
environment committee or its successor including a first quarter briefing on fare
categories, customers and ridership, and a second quarter briefing on the effect of pricing
on customers. The briefings and report shall be developed from input obtained through
meetings that occur, at least monthly, of an interbranch staff workgroup consisting of
executive, division and council staff. The report shall, at a minimum, include:
A. The role of fares in meeting the needs of customers while achieving the goals and
objectives of the Strategic Plan for Public Transportation;
B. The types of fares or fare categories including their discounts or additions to regular adult
fares, their rationale and methodology, including their relationship to King County Strategic
Plan, Strategic Plan for Public Transportation and equity and social justice goals, the rate
of discount, consistency with regional fares and qualification criteria. These types of fares
or fare categories currently include, but are not limited to youth, senior and disabled,
Access, zone-based, peak, short-term and ongoing prepaid fares;
C. A discussion of potential fare changes with their expected impacts;
D. A methodology for considering a fare increase or decrease; and
E. A year by year comparison of forecasted ridership and fare revenue for each fare type for
the period from 2002 to 2012.”
The original deadline of August 1, 2013 for submitting this report was later extended to August 1,
2014 via Ordinance 17619, Section 49.

King County Metro | Report on Transit Fares
6

King County Metro | Report on Transit Fares
7
SECTION 2
Fare Policy Goals The King County Council has adopted a variety of policies related to fares over the years. Recent
policy developments stemmed in part from the 2009 Performance Audit of Transit.
The audit recommended that Metro develop and propose fare policy goals to the Regional
Transit Committee and the Council. Metro did so, developing recommendations in coordination
with the other transit agencies in the region in 2010. In 2011, the County Council adopted
Metro’s Strategic Plan for Public Transportation, which incorporated policy guidance directly or
indirectly related to fares. Metro’s Fund Management Policies, which established a fare revenue
recovery target, were also adopted in 2011.
The audit also recommended that Metro revise senior, disabled and youth fare discounts to align
with peers, and peg discounted fares to base fares by specifying a percentage discount.
Responding to this recommendation as well as a proviso to the 2010-2011 budget, Metro
collaborated with other transit agencies in the region to develop recommendations for aligning
Metro’s fares for those groups with Sound Transit’s fares. Metro also recommended that fare
simplification be given high priority, and that regional fare integration be a strategy to support
this goal.
The following are adopted fare policy goals, with references to the policy documents noted.
Metro’s fare system should:
Meet fare revenue targets and comply with the Fund Management Policies,
including maintaining a target cost recovery ratio of 25 percent.
The Transit Financial plan assumes approximately $10 million per year in additional revenue,
beginning in 2015, from a fare increase. However, the 2015 fare increase will yield less than this
$10 million annual revenue target because of the inclusion of a new reduced fare for Metro
customers with low incomes.
Metro’s target cost recovery ratio is established in the Public Transportation Fund Management
Policies, adopted through Ordinance 17225 in 2011. The Fund Management Policies state:
“The Transit Division will maintain a target of recovering a minimum of 25
percent of passenger related operating costs from farebox revenues for bus
service. …The farebox recovery ratio is one of many factors to be considered in
evaluating fare proposals. Achieving a specified farebox recovery ratio is, by
itself, neither sufficient reason for a fare increase nor for any particular level of
increase.”
If changes to the farebox recovery target are contemplated, policy considerations could include:
The extent to which the cost of providing transit service should be shared by riders—as
well as employers and schools that provide transit passes to their employees and
students—and by all others in the community who benefit from the congestion relief,
contributions to the economy, and environmental advantages that transit provides.

King County Metro | Report on Transit Fares
8
Goals for ridership, including those included in the region’s transportation plan, and how
the fare prices needed to achieve the farebox recovery target would affect ridership.
Reference: Strategic Plan Financial Stewardship Goal 6, Strategy 6.3.2, Strategy 6.3.3; Fund
Management Policies for the Public Transportation Fund, Ordinance 17225
Be easy for customers to understand and use.
Metro’s current fare structure is relatively complex, including five (soon to be six) customer
categories, two zones with an adult-fare surcharge on trips crossing the zone boundary during
peak, and a peak surcharge. This structure can be difficult for customers to understand and use.
Nationally, only 14 of Metro’s peer agencies have fares that vary by distance, fare zone or time
of day, and Metro’s is the only structure that varies for all three.
Simplification could make Metro service easier to use, boost customer satisfaction, make fare
payment faster, and reduce fare disputes. A simple fare structure could be one with the smallest
number of different fares, or one with variations based on a few easily understood concepts.
Simplification has an important social justice dimension. King County is home to a large number
of people who have limited English proficiency and may rely heavily on public transportation.
The simpler the system is, the easier it will be to explain to these customers.
Reference: Strategic Plan vision statement, Service Excellence Goal 5, Objective 5.1, Strategy 5.1.1;
Economic Growth and Built Environment Strategy 3.1.2; Financial Stewardship Strategy 6.3.2
Align with regional transit partners.
Although the Puget Sound Region’s transit agencies participate in the ORCA regional fare
payment system, each agency controls its own fares, and fares are not identical throughout the
region.
Alignment would benefit riders transferring among services, eliminate confusion, and meet the
public expectation that transit agencies coordinate. The most common multi-agency trips involve
Metro and Sound Transit, so alignment with Sound Transit is most important for Metro.
Metro developed recommendations for simplifying and aligning fares in 2010 and implemented a
number of them in 2011. We also recommended longer-term efforts to further simplify the system.
Reference: Strategic Plan Economic Growth and Built Environment Strategy 3.2.2, Financial
Stewardship Strategy 6.3.2
Reduce costs.
Fare collection costs include the cost of bus operations while fares are collected, the costs of
operating the ORCA system, and the costs of the farebox system, including processing cash,
printing and distributing tickets and transfer slips, selling tickets, and maintaining fareboxes.
Quick, easy fare payment speeds up boarding and bus operations and also contributes to
customer satisfaction. Speeding operations in downtown Seattle is especially important since the
end of the Ride Free Area. Increased use of ORCA and the reduction or elimination of cash
payment could reduce fare collection costs, defer or avoid the cost of replacing fareboxes, and
result in operating efficiencies.
King County Metro | Report on Transit Fares
9
Metro sizes its fleet to meet peak service requirements, and peak surcharges that encourage
riders to shift to off-peak travel can help reduce the cost of the fleet.
Reference: Strategic Plan Service Excellence Objective 5.1, Strategies 5.1.2 and 5.1.3; Financial
Stewardship Objective 6.2, Strategy 6.2.1
Reflect the cost of service, with higher fares for higher-cost service.
Metro’s current fare structure reflects cost of service in two ways: an adult peak surcharge that
reflects higher total cost of peak-period service, and a two-zone system for adult peak-period
fares that charges more for typically longer two-zone trips.
The zone structure and peak surcharge have drawbacks and limitations. Zones are an imprecise
method for capturing cost of service; passengers taking relatively short trips may pay the higher
fee because they happen to pass the boundary. The youth, senior/disabled and low-income fares
do not do not have peak-period and zone surcharges, so these fares do not reflect the different
costs of service or offer an incentive for off-peak travel. And both the zone structure and the
peak surcharge are counter to the goal of a simple-to-understand system.
Reference: Strategic Plan Financial Stewardship strategy 6.3.2.
Enable all people in King County, including those with low incomes, to use
public transportation.
The affordability of transit for people with low incomes is a long-standing concern, amplified by
the commitment in King County’s strategic plan to building equity and social justice. The
magnitude of the need is suggested by the 2012 American Community Survey estimate that
approximately 500,000 individuals have incomes below 200 percent of the federal poverty level
in King County—about 25 percent of our population.
Metro has addressed this issue over the years through discounted fares for seniors, youth, and
people with disabilities and through the Human Services Ticket Program (described in the next
section). A more direct approach begins next year when a reduced fare for qualified individuals
with low-incomes is introduced March 1, 20151.
Reference: Strategic Plan vision statement, Human Potential Strategy 2.1.2.
Increase ridership.
Metro plays a critically important role in the region’s transportation system, both by transporting
passengers and by reducing congestion and creating roadway capacity for drivers. As the
region’s population grows, Metro must accommodate an increasing number of riders to fulfill
this function. The Puget Sound Regional Council’s Transportation 2040 plan assumes that
transit ridership in the four-county region will double from the 2010 level by 2040.
Increasing transit ridership and reducing vehicle miles traveled and associated emissions is also a
goal of the County’s Strategic Climate Action Plan. The transportation sector is the biggest
contributor to greenhouse-gas emissions locally, and Metro service is a major tool for reducing
emissions.
1 Ordinance 17757, adopted Feb. 24, 2014, instituted the low-income fare and set the fare at $1.50, for all times of
day and one- or two-zone travel, subject to further King County Council action.

King County Metro | Report on Transit Fares
10
Fares that are set at prices customers consider to be reasonable and affordable encourage ridership;
set too high, they will depress ridership.
Reference: Strategic Plan Vision statement, Economic Growth and Built Environment Objective
3.1, Objective 3.2, Objective 3.4, Strategy 3.2.1; Environmental Sustainability Objective 4.1,
Strategy 4.1.1.
Move the Access paratransit fare toward parity with the base adult fare for
regular transit service.
Metro intends to achieve parity between the Access fare and the off-peak adult fare over time.
Parity will be measured by dividing the access fare by the off-peak adult fare; the Access fare will
achieve full parity if the ratio is 1.0. Metro will provide the annual projected ratios as part of
financial information included during the budget adoption process.
Reference: Fund Management Policy VI.B
Comply with state and federal regulations.
The primary regulation affecting fares is a federal requirement that off-peak fares for seniors,
people with disabilities, and Medicare cardholders can be no more than half the regular/adult
peak fare. Metro is in compliance with this regulation.
Federal regulations also cap the fares on paratransit service to twice the fare for an equivalent
fare on regular bus service. The only state requirement pertaining to fares concerns paratransit
service. A court decision in Fell v. Spokane Transit Authority, 128 Wash. 2d 618, 911 P.2d 1319
(1996), established that in Washington, transit agencies cannot charge a fare for paratransit
service that is greater than the equivalent adult fare charged for fixed-route transit service.
Reference: Strategic Plan Financial Stewardship Strategy 6.3.2
Balancing policy goals
Our ability to attain all of the fare policy goals is hampered by the fact that any fare practice that
advances one goal is likely to have negative impact on at least one other goal. Policymakers have
the challenge of adopting fare system elements that balance competing priorities.
The following are some examples of fare system changes and policy tradeoffs:
Several potential methods exist for increasing revenue: raise fare levels, increase pass
prices, eliminate cash transfers, or maintain or increase the peak and zone fare
surcharges2. These potential changes would support the policy goals of meeting revenue
targets and reflecting the cost of service. However, maintaining the zone and peak fare
structure would run counter to the policy goal of further simplifying fares.
2 The peak and zone fare structure segments the market by providing different fares for different rider groups. Peak
riders are generally less responsive to fare changes than off-peak riders, so Metro’s peak surcharge helps recover additional revenue while also reducing the loss in ridership. Similarly, riders making longer trips are generally less responsive to fare changes than riders making shorter trips, and the zone surcharge during peak hours generally also helps increase revenue while reducing loss in ridership.

King County Metro | Report on Transit Fares
11
The introduction of a low-income fare discount in 2015 will advance the goal of
minimizing the impact of fares on low-income customers, but will work against the goal
of increasing revenue to fund service. On the other hand, the low-income fare could
mitigate the impacts of other fare structure changes, such as eliminating cash transfers,
which in turn would support the goal of reducing operating cost and speeding operations.
Metro’s fare structure could be made simpler and better aligned with the region’s other
transit agencies by eliminating the zones and the off-peak discount while maintaining the
adult one-zone peak fare at the current level and the youth and senior/disabled fares at
their current levels. However, this change would substantially reduce the fare revenue
that Metro would collect, reducing Metro’s ability to fund service and meet the farebox
revenue target. It would also have an impact on riders who travel during off-peak hours to
take advantage of lower fares. A table showing how changes to the fare structure would result in policy tradeoffs is in Appendix A.

King County Metro | Report on Transit Fares
12

King County Metro | Report on Transit Fares
13
SECTION 3
Background The fare system today and how we got here
To provide context for policy makers as they explore potential fare system changes, this section
describes Metro’s current fare structure and the major events and policy decisions in Metro’s
history that led to this structure. It also summarizes several important issues and developments:
farebox recovery, average fare per boarding, fare evasion, business pass accounts, the ORCA
system, and the new low-income fare. A chronological history of fare changes is shown in a table
on page 18 and is detailed in Appendix B.
Structure of Metro’s fare system
Two zones: A higher fare is charged for two-zone trips during peak periods.
When Metro began operations in 1973, it inherited a transit system with 38 zones that had been
established to reflect the higher cost of longer-distance trips. The adult fare was $0.20, with a
$0.10 surcharge for each zone. In 1977, the Metro Council reduced the number of zones to two
with the boundary at the Seattle city limits—the current zone structure. Policy makers were
striking a new balance between the goals of simplifying fares and reflecting cost of service.
In 1999, the King County Council eliminated the zone surcharge during off-peak periods,
emphasizing the goals of fare simplification and reducing fare impacts on low-income riders.
Since off-peak riders are more responsive to price, this action also helped promote increased
ridership.
The policy goal of the zone structure is to have fares reflect the cost of service; generally two-
zone trips are longer and have higher operating costs. However, zones do not precisely reflect
distance traveled. Many passengers taking relatively short trips pay the higher fare because those
trips happen to cross the zone boundary.
The zone structure also slows fare payment, as operators may have to manually override the
default zone setting in the farebox or ORCA reader for some passengers, slowing operations. The
two-zone surcharge also complicates the fare structure, making it harder for customers to
understand.
Peak surcharge: A higher fare is charged for peak-period trips than for off-peak trips.
A surcharge for trips during peak hours (6-9 a.m. and 3-6 p.m.) was added to Metro’s fare
structure in 1982. While complicating the fare structure, this policy decision better reflected the
higher cost of providing service during peak periods. It gave riders a price incentive to shift to
off-peak travel, enabling more efficient use of Metro’s fleet, and provided a lower-cost travel
option for riders. Since off-peak riders are more responsive to price, this action also helped
promote increased ridership.
However, the effectiveness of the peak surcharge in moving riders to off-peak hours has been
eroded by the substantial number of passengers who use Passport passes or pay the senior/
disabled or youth fare, and will be further weakened when some riders begin paying the new

King County Metro | Report on Transit Fares
14
low-income fare. Passport passes are provided to employees by their employers and cover all
rides, so users do not see a price advantage for non-peak travel3. The senior/disabled, youth, and
low-income fares are not subject to the peak surcharge, so those who pay these fares also do not
have an incentive to ride during the off-peak period.
Transfers: Provided free, with time and zone limitations.
Metro has for many years issued paper transfer slips to riders who pay with cash or tickets.
Transfer slips enable riders to make free transfers between buses for 2 to 2.5 hours. Since riders
who pay with cash and tickets are more likely to be lower-income riders, free transfers have
supported the goal of enabling people with low incomes to use the public transportation system.
However, free cash transfers are part of the cash fare payment system, which slows fare payment
and service and results in costs for cash handling and farebox maintenance. Also, transit
operators and customers often note that cash transfers are a source of fare evasion and can lead to
fare disputes.
Some transit agencies across the country require a surcharge (often $0.25) for transfers, while
others do not accept transfers for round trips. With the start of ORCA in 2009, riders using E-
Purse got a two-hour window for transfers among all transit modes and all ORCA transit
agencies, and agencies stopped accepting cash transfer slips from other agencies. Sound Transit,
Community Transit and Everett Transit have eliminated issuing cash transfer slips altogether,
and Pierce Transit is moving forward to eliminate them. Metro’s implementation of a low-
income fare via ORCA in 2015 will remove the strong policy link between cash transfers and
minimizing fare impacts on low-income riders.
Discounts for prepayment: Discounts for long-term fare prepayment through the pass program.
Over the years, Metro’s monthly pass prices have varied between 31-32 and 40-43 times the cash
fare for a trip. At times, pass prices were decreased to emphasize the goal of increasing ridership
by encouraging more riders to purchase a pass. A rider using a pass pays no cost for each
additional trip, and this promotes growing ridership and use of the transit system for
discretionary trips. At other times, pass prices were increased to emphasize raising revenue.
With adoption of the Regional Fare Agreement in 1999, Metro, Sound Transit, Pierce Transit,
Community Transit and Everett Transit established a system of regional passes priced at 36 times
the equivalent cash fare. Regional transit fare payment through the ORCA system continues to
maintain regional pass pricing at 36 times the cash fare. Any change to regional pass pricing
must be approved by all transit agency participants in the ORCA system. ORCA data show that
adult monthly passes purchased directly by passengers are used, on average, for about 50
boardings per month. Based on average system transfer rates, this rate of boardings would be the
equivalent of about 38 fare paid boardings.
3 The Passport price paid by employers is based on a blend of peak/non-peak fares.

King County Metro | Report on Transit Fares
15
Discounts for seniors and people with disabilities: At least 50 percent of the regular adult one-zone peak fare; requires Regional Reduced Fare Permit.
When Metro began operation in 1973, the fare for seniors was set at 50 percent of the adult fare,
with no zone surcharges. Metro established the same discounted fare for riders with disabilities
in 1976, to comply with newly adopted federal requirements.
This element of the fare structure reflects the goal of enabling all people to use public
transportation, and helps promote increased ridership since seniors and people with disabilities
are more responsive to price. Metro and our partner transit agencies in the Central Puget Sound
Region established the Regional Reduced Fare Permit system in 1982 to simplify and streamline
reduced fares for these customers throughout the region. The RRFP is now available only on an
ORCA card.
Children: Under age 5 ride free with a fare-paying adult (up to four children per adult).
All of Metro’s ORCA partner transit agencies have this policy, and free fares for children are
common among Metro’s national peer agencies. This element of the fare structure reduces the
impact of fares on low-income families and encourages ridership by the next generation. It also
simplifies and speeds fare payment.
Youth: Fares discounted for youth ages 5 through 17, or those over 17 who attend regular sessions of junior or senior high school.
When Metro began operation, the youth fare was set as equal to the adult fare but without the
zone surcharges. When the peak surcharge was introduced in 1982, it was applied to the youth
fare. Youth continued to pay fares equal to the adult one-zone peak and off-peak fares until 1993,
when a flat reduced fare for youth was established.
This reduced youth fare supports the goal of minimizing the impacts of fares on low-income
riders, and in so doing promotes increased ridership by these price-sensitive riders. By promoting
ridership among young riders, this reduced fare also supports long-term ridership growth by
attracting the next generation of commuters. A low youth fare also reduces the cost of student
transportation for school districts that purchase Metro passes.
Discounts for people with low or no incomes: Provided through discounted tickets distributed through human service agencies; a discounted flat fare will take effect March 1, 2015.
The former Metro Council established the Human Services Ticket Program in 1993, after the
organization Share established a homeless shelter outside of downtown and asked Metro to help
residents get to and from the city core. Since then, Metro has partnered with human services agencies
to help them meet their clients’ mobility needs. Metro sells bus tickets at a significant discount to
the agencies, which provide tickets to their clients so they can get to shelters, medical appointments,
job training/interviews, etc. This program is administered by the King County Department of
Community and Human Services and the City of Seattle’s Human Services Department.
The program originally required participating human services agencies to pay 25 percent of the
value of the tickets, and limited Metro’s subsidy to $200,000 per year. The subsidy limit has
been raised as fares have increased over the years. In 2001, the County Council approved

King County Metro | Report on Transit Fares
16
reducing the percentage paid by human services agencies to 20 percent. The King County Code
currently limits the total annual subsidy to $1,875,000.
The new low-income fare is described later in this section (p. 25).
Access: Fares set with the intent of achieving parity with regular adult fares.
The Americans with Disabilities Act, signed into law in 1990, requires transit agencies to
provide paratransit in the same areas and at the same times that fixed-route service operates. This
service must be available for all customers who are unable to use the regular fixed-route system
because of a disability.
Federal regulations cap the fares on paratransit service to twice the fare for an equivalent fare on
regular bus service. However, based on the court decision in Fell v. Spokane Transit Authority,
128 Wash. 2d 618, 911 P.2d 1319 (1996), it is held that in Washington state, transit agencies
cannot charge a fare for paratransit service that is greater than the equivalent adult fare charged
for fixed-route transit service.
In 1999, Metro adopted the goal that the Access fare should move toward parity with the one-
zone, off-peak, fixed-route fare; this was reaffirmed in 2011. A 50-cent fare increase will raise
Access fares to $1.75 in 2015, moving toward this goal.
The paratransit system does not use a zonal fare structure. The fare is the same for all trips at all
times, on all days. Customers who use multiple vehicles to complete a single trip pay only one
fare. Metro has an agreement with Community Transit in Snohomish County and Pierce Transit
in Pierce County that riders who travel by paratransit from one county to another are not required
to pay the fare twice. The fare is paid only at the beginning leg of the trip in the county where the
customer resides.
Access vans are not equipped with ORCA readers. Metro staff developed a back-office method
for customers who have passes on ORCA cards, but currently there is no way for customers to
use the ORCA E-purse on Access. This has resulted in a fare payment system that is confusing,
particularly for customers who use regular bus services for some trips and Access for others.
Currently, there are no plans to install ORCA readers on Access vans.
Because customers break even with a pass only when they take 36 or more trips per month, most
Access customers do not use passes. This results in most Access customers using cash. Some
Access customers are able to use regular bus service for some of their trips and use Access only
where they cannot use the bus. The inability to use the E-purse on Access may be preventing
some customers who use both Access and the bus from switching to ORCA. Access customers
could potentially benefit from being able to use the ORCA E-purse, as some have trouble
handling cash due to their disabilities and others may have their finances administrated by
another person. The E-purse eliminates the need for customers to handle money and allows a
third party to manage the funds on the card.
Metro is one of three agencies in Washington that have paratransit fares below the minimum
adult fixed-route fare. Most agencies have paratransit fares equivalent to the fixed-route fare.
Among Metro’s national peer agencies, all except two have a higher paratransit fare than King
County. Metro is one of four agencies that have paratransit fares below the minimum adult fixed-
route fare; 22 agencies have paratransit fares above the minimum adult fixed-route fare.

King County Metro | Report on Transit Fares
17
Current fares
Adults:
- Off-peak, both zones: $2.25
- Peak, one zone: $2.50
- Peak, two zones: $3.00
Seniors: $0.75 all times, both zones
Riders with disabilities: $0.75 all times, both zones
Youth (6-18): $1.25 all times, both zones
Children (0-5): free with fare-paying adult
Access paratransit service: $1.25 all times
Adopted fare changes effective March 1, 2015
$0.25 increase in all current Metro fare categories — adults, seniors, people with
disabilities and youth—for all regularly scheduled transit services
$0.50 increase in Access fares
New reduced fare of $1.50 for qualifying riders who have low incomes
Fare product types
E-purse held on ORCA card; 2-hour transfer credit
Puget Pass – regional monthly pass on ORCA card
Regional Day Pass (pilot) – regional pass valid for unlimited rides for a day
Business Passport – employer-provided pass purchased under contract
Business Choice – employer-provided pass purchased monthly
U-Pass – University of Washington pass program
Paper transfers – free for cash-paying customers; time and zone limits

King County Metro | Report on Transit Fares
18
Fare revenue and farebox recovery
Metro has raised fares roughly every two years for most of its history to keep pace with rising
costs. The longest periods without an adult fare increase were 1993 to 1998, and 2001 to 2008.
The yearly increases from 2008 through 2011, adopted to help make up for the recession-induced
drop in Metro’s revenue, were also unusual. The table below shows Metro’s fares from the start
of operations through March 1, 2015, when adopted fares will take effect.
Metro Fare History
Adult Youth
Senior and
Disabled4
Low
Income
1 Zone 2 Zone 1 or 2 Zones 1 Zone 2 Zone 1 or 2
Zones
Date
Monthly
Pass =
# of
cash
rides5 Off Peak Peak Off Peak Peak Off Peak Peak
Off Peak & Peak
Off Peak
& Peak
Off Peak
& Peak
Jan ‘73 $0.206 $0.20 $0.20 $0.10 $0.10
Feb ‘76
Jan ‘77 40-43 $0.30 $0.30 $0.50 $0.50 $0.30 $0.30
Jan ‘79 35 $0.40 $0.60 $0.60 $0.40 $0.40
Feb ‘80 35 $0.40 $0.15 $0.15
May ‘80 35 $0.50 $0.50 $0.75 $0.75 $0.50 $0.50
Feb ‘82 35 $0.60 $0.90 $0.60
Oct ‘83 32.5
Feb ‘85 36.5 $0.55 $0.65 $0.85 $1.00 $0.55 $0.65 $0.20 $0.20
Oct ‘87 36.5 $0.25 $0.25
Feb ‘89 36.5 $0.75 $1.25 $0.75
Feb ‘91 31-32 $0.75 $1.00 $1.00 $1.50 $0.75 $1.00
Feb ‘93 36 $0.85 $1.10 $1.10 $1.60 $0.75
Jun ‘98 36 $1.00 $1.25 $1.25 $1.75
Dec ‘99 36 $1.00
Jul ‘01 36 $1.25 $1.50 $1.25 $2.00 $0.50 $0.50
Mar ‘08 36 $1.50 $1.75 $1.50 $2.25
Jul ‘08 36 $0.75 $0.75 $0.50 $0.50
Feb ‘09 36 $1.75 $2.00 $1.75 $2.50
Jan ‘10 36 $2.00 $2.25 $2.00 $2.75 $0.75 $0.75
Jan ‘11 36 $2.25 $2.50 $2.25 $3.00
Sept ‘11 36 $1.25 $1.25
Mar ‘15 36 $2.50 $2.75 $2.50 $3.25 $1.50 $1.50 $1.00 $1.00 $1.50
4 Reduced fares for riders with disabilities began in 1976
5 Adult passes
6 $0.20 base; $0.20 each zone; separate transfers for each route by dir.

King County Metro | Report on Transit Fares
19
Farebox recovery As noted earlier, the Public Transportation Fund Management Policies state that “Achieving a
specified farebox recovery ratio is, by itself, neither sufficient reason for a fare increase nor for
any particular level of increase.” Other considerations have guided past fare changes. For
example, Metro increased fares four times in 2008 through 2011, including years when the
farebox recovery ratio was above the 25 percent target. These increases were undertaken to
provide revenue to sustain system operations.
The chart below shows Metro’s farebox performance since 2003. The rate reached a high point
of about 29 percent in 2012 and 2013. (Note: For many years, Metro’s financial policies
established as a target that transit operations revenue recover 25 percent of transit operating
costs. Operations revenue includes farebox revenue and other revenue associated with transit
operations—the largest component of which was advertising revenue. The 2009 Performance
Audit recommended that the revenue target be established based on farebox revenue rather than
on operations revenue. The chart shows Metro’s performance on this fare revenue/operating
expense measure.)
Among the ORCA peer agencies, Metro’s farebox recovery rate for bus service was second only
to Sound Transit’s rate in 2013, as shown in the chart on the following page.
20.6% 20.7% 21.5%
20.4% 19.8%
23.4%
25.4% 26.9%
28.9% 29.0% 29.1%
0.0%
5.0%
10.0%
15.0%
20.0%
25.0%
30.0%
35.0%
2003 2004 2005 2006 2007 2008 2009 2010 2011 2012 2013
Fare Revenue/Operating Expense

King County Metro | Report on Transit Fares
20
Among the 30 largest bus agencies in the U.S., Metro’s farebox recovery was above the average
in 2012 (the latest year for which national peer data is available).
31%
29%
24%
22%
18%
11%
0% 5% 10% 15% 20% 25% 30% 35%
Sound Transit
King County Metro
Community Transit
Kitsap Transit
Pierce Transit
Everett Transit
2013 Bus Farebox Recovery - Local Peer Agency Comparison

King County Metro | Report on Transit Fares
21
Metro’s average fare per boarding
Another way to asses fare levels is to measure average fare per boarding. Metro’s average fare
per boarding in 2013 was about $1.24. There a number of reasons why this fare per boarding is
lower than posted adult fares.
The first is the difference between a trip and a boarding. When a rider pays a fare, that fare is for
a trip that may include one or more transfers between Metro buses, or between bus or rail
services provided by other transit agencies. Metro provides a two-hour transfer window, meaning
that each time a rider gets on a bus within two hours of initial fare payment, the first fare
payment is credited toward the next leg of the trip. If the fares for the second and subsequent
boardings within this two-hour window are equal to or less than the initial fare paid, the
subsequent boardings are free. If the fare for subsequent boardings is higher, the rider is to pay a
fare upgrade. We estimate that roughly one-third of all boardings involve a transfer with another
Metro bus or another agency’s transit service for which we receive little or no additional fare.
A second reason is that riders who purchase monthly passes may take many trips using that
pass. The region’s transit agencies have standardized regional pass prices at a multiple of 36
times the cash fare. We estimate that riders who purchase passes take more than 36 trips per
month, on average, with every trip beyond 36 being essentially “free.” And, as noted above, each
trip on average results in more than one boarding.
Third, Metro provides significantly reduced fares for youth, students, seniors and riders with
disabilities. Youth and students with school district passes account for about 13 percent of
Metro’s boardings; senior and disabled riders make up about 10 percent.
Another contributing factor is the use of free tickets distributed through the Transit Incentives
Program (about 960,000 in 2013). Tickets sold at an 80 percent discount through the Human
Services Ticket Program (about 1.3 million in 2013) also affect average fare per boarding.
Finally, about 6 percent of boardings on Metro are taken without payment of fare. Roughly 1.3
percent are taken by children 5 years and younger who ride free. Metro estimates fare evasion
occurs on about 4.8 percent of total boardings.
Note that the Passport and U-Pass programs do not receive a fare discount. Passport and U-Pass
customers pay for their boardings in roughly the same manner that an individual using the ORCA
E-purse would pay for their transit boardings—reflecting peak/off-peak and one- and two-zone
trips and transfers to other Metro buses and other agencies’ services. The average fare per
boarding for these programs is toward the high end of the average fare per boarding for adult
riders. The average fare per boarding for school district contracts reflects the lower youth fare.
Estimates of the percentage of ridership by fare category and the average fare revenue collected
from those boardings are shown in the table on the following page.

King County Metro | Report on Transit Fares
22
Ridership and Fare Revenue Collected, by Customer Category
Per
Trip
Fare
Percentage of Overall Boardings
Average Fare Per Boarding*
Cash E-Purse Pass Cash E-Purse Pass
Adult
One-Zone Peak $2.50 5.7% 3.6% 7.3% $1.21 $1.49 $1.66
Two-Zone Peak $3.00 1.2% 0.8% 2.5% $1.52 $1.87 $2.23
Off-Peak $2.25 11.2% 7.0% 8.2% $1.10 $1.34 $1.30
Youth $1.25
6.5% 4.0% 0.5%
$0.54 $0.66 $0.76
Senior/Disabled $0.75 2.1% 1.3% 6.3% $0.37 $0.45 $0.49
U-Pass
8.6%
$1.90
Passport
14.6%
$1.93
School District
2.4%
$1.02
SLUS**
0.6%
$1.00
No Revenue 5.8% $0.00
Total
100%
$1.24
* Average fare per boarding for the individual fare categories in this table is a calculated estimate based on a
number of assumptions about ridership and revenue collection across the fare categories.
** South Lake Union Streetcar
Fare evasion
Fare evasion is a problem for Metro and all transit agencies, resulting in lost revenue and irritating
customers who pay their fares. Metro directs operators to not act as active fare enforcers, because
fare disputes can escalate into assaults on drivers. For their protection, operators are instructed to
avoid disputes and to ask for fares only once, if they feel safe in doing so.
Metro conducted a study of fare evasion in 2010 in response to a County Council proviso in the
ordinance adopting the 2010-2011 budget. Based on the findings, we estimated that fare evasion
resulted in the loss of about $62,000 in the week studied, or roughly 2.5 percent of total fare
revenue.
As strategies to reduce fare evasion, Metro recommended simplifying fares and exploring the
relationship of fare evasion to the Ride Free Area in downtown Seattle, the effectiveness of
emphasis patrols by Transit Police, and the effectiveness of the proof-of-payment method on
RapidRide and potentially on buses throughout the system. Adding enough fare enforcement
officers to significantly reduce fare evasion was not recommended because the cost of doing so
would outweigh the revenue collected.
In the years since the study was done, Metro took steps to simplify fares, including eliminating
non-regional passes and fares. The proof-of-payment system was extended to all RapidRide
lines, and Transit Police have continued emphasis patrols. The Ride Free Area was eliminated in
2012. We have not yet conducted a follow-up study to assess the impact of these measures on
fare evasion.

King County Metro | Report on Transit Fares
23
Business accounts
Metro’s pass program for businesses and schools provides significant financial support for the
transit system.
Metro was one of the first transit agencies in the nation to implement pass partnerships with
employers. Metro launched the University of Washington U-Pass program for students, faculty
and staff in 1991.
A business pass demonstration program began in 1993 with four employers, 2,900 eligible
employees and an estimated 144,000 annual transit trips. Originally called FlexPass, the name
was changed to Passport with the start of ORCA. By 2013, the program had grown to 780 accounts
with 298,000 eligible employees and students, about 30 million trips on Metro, $54 million in
Metro fare revenue and $33 million in fare revenue for other transit agencies in the region.
We estimate that today, the Passport programs with employers account for about 15 percent of
Metro’s ridership and 24 percent of fare revenue. U-Pass accounts for about 9 percent of Metro’s
ridership and 14 percent of fare revenue.

King County Metro | Report on Transit Fares
24
In addition to the Passport program, in which businesses purchase employee passes under annual
contracts, Metro offers the Choice program, which allows businesses to purchase passes on a
monthly basis. Currently, 789 businesses have Choice accounts. These accounts are self-
managed by the businesses, so Metro is not able to separate Choice ridership and revenue
numbers from the systemwide totals.
Fare increases could affect employers’ decisions to continue participating in the pass programs.
The ORCA system
The start of the ORCA fare payment system was a turning point in efforts to simplify the fare
structure and fare payment, improve operational efficiency, and enhance customer satisfaction.
The origins of ORCA can be traced to a regional fare policy forum held in 1997. The forum
resulted in a new policy goal: seamless regional travel. Two years later, five of the region’s
transit agencies adopted the Puget Pass Agreement, creating a system of regional passes valid on
Metro, Community Transit, Everett Transit, Pierce Transit and Sound Transit.
These agencies, plus Kitsap Transit, launched the ORCA system in 2009, providing for seamless
fare payment among the region’s transit services for passengers using the ORCA card.
ORCA brings customers the benefits of fast, easy fare payment for travel throughout the region.
Transit agencies realize faster operations, more accurate ridership data, and improved revenue
data and regional revenue reconciliation.
Since ORCA was launched, Metro and its partner agencies have actively promoted ORCA and
expanded the network of retail locations and ticket vending machines where customers may
purchase and/or reload ORCA cards. These efforts are described in the next section, “The Road
to a Cashless System.”
Today, Metro’s percentage of ORCA fare payment is about equal to the regional average for all
ORCA transit agencies, as shown in the table on the following page.
Metro’s ORCA percentage trails Sound Transit’s Sounder and regional Express Bus service and
Community Transit’s bus service—all of which are highly commute-oriented and serve frequent
riders, many of whom have ORCA passes. Metro also trails Kitsap Transit, which has a high
percentage of ORCA pass use due to its low-income ORCA pass program (54 percent of cards
issued by Kitsap Transit in 2012 were for low-income customers, and low-income cards accounted
for about 23 percent of Kitsap Transit’s ORCA boardings.) Metro has a higher ORCA percentage
than Pierce Transit, which is not as highly commute-oriented as other agencies in the region.
Metro’s pass partnerships with the UW, employers and other institutions play a significant role
in shaping Metro’s rider market and how riders pay their fares. In 2013, ORCA cards were used
for 71 million Metro boardings. Of these, about 30 million were paid using passes provided
through pass partnerships. Boardings from these pass partnerships accounted for about 25
percent of total Metro boardings and about 36 percent of Metro’s total fare revenue.

King County Metro | Report on Transit Fares
25
ORCA Average Weekday Boardings as a Percent of
Total Average Weekday Boardings by Agency
March 2014
Agency
Average
Weekday
ORCA
Boardings
Average
Weekday
Total
Boardings
ORCA as
% of Total
Average
Weekday
Boardings
Community Transit 24,029 28,979 83%
Everett Transit 3,940 6,598 60%
King County Metro 260,208 395,289 66%
Kitsap Transit 9,560 12,526 76%
Pierce Transit 14,514 33,051 44%
Sound Transit Bus 49,340 59,416 83%
Sound Transit Sounder 11,165 11,843 94%
Sound Transit Link 17,551 33,073 53%
TOTAL 390,307 580,775 67%
New low-income fare
Metro offered discounted fares for youth and seniors from its beginning in 1973; a reduced fare
for people with disabilities was introduced in 1976. To assist people with low incomes, Metro
began offering a 15 percent ticket book discount in 1991, but this was found to be ineffective and
was ended two years later. Metro then began the Human Services Ticket Program, which
provides ticket books to human service agencies at a deep discount.
In 2013, the County formed a Low-Income Fare Options Advisory Committee, which
recommended that Metro establish a discounted low-income fare. In 2014, the County Council
adopted a flat $1.50 fare for qualified individuals whose incomes are at or below 200 percent of
the federal poverty level; this fare will take effect March 1, 2015. Metro will become one of only
a few large transit agencies that offer such a fare. Metro offers other programs that assist people
with low incomes, such as the Human Services Ticket Program, that will continue.
The low-income fare will be available only with an ORCA card; cash will not be accepted for
low-income fare payment on the bus. The advisory committee recommended ORCA as the most
practical and desirable method for low-income fare payment because increased ORCA card
usage lowers administrative costs associated with cash handling and improves operational
speeds. Use of ORCA cards will also avoid any stigma that might have been associated with a
fare medium unique to the low-income fare. The use of ORCA for this fare is expected to expand
the percentage of all Metro customers who use ORCA by a little more than 10 percentage points.
Metro estimates that the fare increases which will take effect in March 2015 will generate less
than the $10 million assumed in the Transit Financial Plan that supported the 2013/2014 adopted
budget because of the inclusion of the discounted low-income fare. Using Metro’s fares and

King County Metro | Report on Transit Fares
26
elasticity model, we have estimated the loss in fare revenue in 2015 to be nearly $4 million per
year. This is expected to increase in 2016 and 2017 to approximately $4.75 million per year. The
low-income fare will also put downward pressure on the farebox recovery rate, and will result in
an additional $3 to 4 million in annual administrative costs.
The low-income fare is expected to benefit tens of thousands of King County residents.
Estimates of the number of eligible people who will apply for a reduced-fare card range from
45,000 to 100,000. The fare supports strategy 2.1.2 in Metro’s strategic plan: “Provide travel
opportunities for historically disadvantaged populations, such as low-income people…” It also
advances the County’s effort to promote equity and social justice.

King County Metro | Report on Transit Fares
27
SECTION 4
The Road to a Cashless System Collection of cash fares is time consuming and costly, and presents opportunities for fare evaders
to pay less than the full fare or to use invalid paper transfers. Metro could address these issues by
encouraging more use of ORCA cards and less use of cash, tickets and paper transfers—a shift
that might eventually lead to a cashless fare payment system. Reduced or no use of cash could
have many benefits for Metro customers, although the transition to ORCA or other prepaid fare
media could pose challenges for some riders who now rely on cash payment.
This section reviews the benefits and challenges of expanding the use of prepaid fare media, the
successful efforts by Metro and the partner ORCA agencies to increase ORCA use to date, and
policies and programs that might support greater adoption of ORCA and make sure no one is left
behind in a transition toward a cashless system.
Benefits of moving from cash to prepaid fares Reducing fare payment with cash (including tickets and paper transfers) and increasing payment
with ORCA and other prepaid fare media could have a number of benefits:
Speed up boarding and bus operations. The amount of time it takes customers to pay their
fares affects bus boarding speed. Research has estimated that smart-card fare payment can save
from 4.5 to 6.8 seconds per boarding compared to cash7. Increasing ORCA fare payment could
result in substantial time savings for Metro service.
Speeding up boarding has been particularly important since the end of the Ride Free Area in
downtown Seattle and the start of pay-on-entry. Buses typically are taking longer to move
through the city center, both on surface streets and in the Downtown Seattle Transit Tunnel,
particularly during the heavily congested afternoon peak period. About 58 percent of Metro’s
total bus trips serve downtown Seattle from locations around the county, and about half of
Metro’s ridership travels to and from the downtown core. It’s important to keep buses and
customers moving swiftly through downtown Seattle to reduce travel time, ease traffic
congestion, maintain service reliability, reduce operating costs, and keep customers satisfied.
Ridership growth adds to the pressure to improve our boarding speed. Metro’s systemwide
ridership grew 8 percent from 2010 through 2013, and is projected to grow by close to 2 percent
in 2014. This upward trend is likely to continue as the economy recovers. Metro does not have
the financial resources to expand service to meet this growth—and in fact must reduce service
hours to meet budget constraints—so we must optimize the operation of existing services to
accommodate additional riders.
7 Welde, Morten, “Are Smart Card Ticketing Systems Profitable? Evidence from the City of Trondheim,” Journal of
Public Transportation, Vol. 15, No. 1, 2012.

King County Metro | Report on Transit Fares
28
Reduce costs. Metro’s cash fare payment system costs money—for collecting, counting and
depositing cash fares; maintaining fareboxes; printing and distributing tickets and transfer slips;
and selling tickets. In 2011, these costs approached $3 million, as shown in the table below.
Estimated 2011 Cash Fare Collection Costs
Ticket book sales* $197,435
Retail ticket books/transfers $194,667
Cash collection and processing** $1,113,131
Fare collection equipment $1,324,460
TOTAL $2,829,693
*Estimated as 10% of King Street and Westlake
Customer Service Office costs
**Includes cost of ticket book/transfer storage and
distribution
In addition to reducing these costs, decreasing cash fare payment could help Metro defer or avoid
the cost of replacing our aging farebox system. Metro’s fareboxes are 20 years old. The farebox
vendor is having difficulty obtaining some electronic components needed to manufacture them,
and has notified customers it will discontinue production after 2014. The vendor expects to be
able to supply spare parts for some time, and we are trying to find other sources. However, in
five to 10 years we could be faced with a need to purchase new fareboxes at a cost of about $17
million. Reducing cash payment and the use of fareboxes could reduce maintenance needs and
extend farebox life. If Metro were to eliminate cash fare payment, we could avoid the cost of a
new farebox system entirely.
Reduce drivers’ interaction with the fare system. A reduction in the share of passengers
paying with cash would mean operators would spend less time issuing and checking transfers.
Reduce fare evasion. Paper transfers are intended to be non-transferable, but in practice they
can easily be given from one passenger to another. Riders also sometimes use invalid transfers
that are hard to detect. We could reduce fare evasion by eliminating paper transfers, as other
transit agencies in the region have done.
Boost customer satisfaction. Faster boarding and operating speed and the convenience of ORCA
cards contribute to customer satisfaction. Metro’s 2013 Rider/Non-Rider Survey found that overall,
96 percent of all riders are satisfied with the ease of paying fares on Metro. However, only 55
percent of riders who pay with cash said they were “very satisfied,” compared to 82-88 percent of
those who use ORCA cards (including those with U-Passes and Regional Reduced Fare Permits).
Challenges of moving from cash to prepaid fares Infrequent riders are less likely to have ORCA cards. The 2013 Rider/Non-Rider Survey
found that 68 percent of frequent riders use ORCA cards, compared to 59 percent of those who
ride a moderate amount and 52 percent of those who ride infrequently.
We assume that tourists and visitors are less aware of the ORCA card or less likely to see the
value of obtaining one. A challenge for us is to inform infrequent or short-term customers about
ORCA and its advantages, or offer them alternative forms of prepayment.

King County Metro | Report on Transit Fares
29
Riders with low incomes have faced barriers to acquiring and maintaining ORCA cards.
Riders with low incomes are less likely to have ORCA cards. Metro’s 2013 Rider/Non-Rider
Survey found that one-third of cash riders have household incomes below $35,000. Metro and
the other ORCA agencies have taken many actions to lower the barriers our low-income
customers have faced, and Metro is planning extensive outreach and education about ORCA as
part of the low-income fare implementation program.
One obstacle has been that it can be difficult for customers with low incomes to add passes or
E-Purse value to a card. They may lack sufficient funds, or they may not have bank accounts or
Internet access that enable them to add value online, and must find retail outlets or ticket
machines to purchase and maintain their cards. Metro and the ORCA partners have expanded the
network of ORCA vending machines and retailers where people can purchase or add value to
ORCA cards to mitigate this challenge.
The $5 card fee can also be a barrier, which will be addressed by charging no fee for the low-
income fare ORCA card.
Metro has done extensive outreach in low-income communities where many people have limited
English proficiency, and found that people were uninformed about where to reload ORCA cards,
did not understand how ORCA works, or did not trust ORCA technology. We are planning
extensive outreach and education about ORCA as part of the low-income fare implementation
program. This will include providing information in multiple languages and formats. We will
engage organizations that serve people with low incomes as well as individuals who may be
eligible for the new reduced fare.
Increasing ORCA use—what has worked
The percentage of Metro’s average weekday boardings paid with ORCA has grown steadily since
the card was introduced in 2009, to about 66 percent today. We estimate that the new low-income fare,
available only on ORCA, will bring the share of ORCA boardings up to about 76 percent.
The share of riders paying with cash has decreased, from 35 percent in 2010 to 28 percent in 2013.
0%
10%
20%
30%
40%
50%
60%
70%
Ap
r-09
Jul-
09
Oct-
09
Jan
-10
Ap
r-10
Jul-
10
Oct-
10
Jan
-11
Ap
r-11
Jul-
11
Oct-
11
Jan
-12
Ap
r-12
Jul-
12
Oct-
12
Jan
-13
Ap
r-13
Jul-
13
Oct-
13
Jan
-14
Ap
r-14
ORCA as a Percent of Average Weekday Boardings

King County Metro | Report on Transit Fares
30
This growth in ORCA use did not just happen. It resulted from policy changes, informational and
promotional programs, and actions to make it easy and convenient for people to buy and add
passes or value to their cards. Steps taken to date include:
For nine months after the April 2009 ORCA rollout, cards were issued at no charge.
In December 2009, the ORCA agencies converted retail transit passes to ORCA.
Metro converted employer, school district and U-Pass programs to ORCA as contracts
came up for renewal; conversions were completed in June 2012.
Sound Transit and Community Transit replaced paper transfers with electronic transfers
on ORCA in January 2010. Metro has continued to offer paper transfers, but they are
good on Metro buses only.
Metro and our partner agencies created numerous sites where people can buy ORCA
cards and add value or passes to them:
- Metro’s two downtown customer service offices.
- A network of 768 grocery and drug stores around King County where transit
customers can add value to their ORCA cards and—in most cases—also purchase
cards. These sites are shown on the map on the next page.
- Ticket vending machines at Link and Downtown Seattle Transit Tunnel stations and
major transit centers. There are nearly 100 ticket vending machines (TVMs) around
the region where people can buy ORCA cards and add products; 70 are located at 24
sites in King County. These include five TVMs that Metro installed in 2012 at the
King Street Customer Assistance Office, the Burien, Eastgate, and Northgate transit
centers, and the Convention Place transit tunnel station. Metro plans to install vending
machines at the Renton, Redmond, and Aurora Village transit centers by the end of
2015. In the first quarter of 2014, ticket vending machines sold more than $6.4
million in ORCA products.
- The ORCA website. Cards can also be purchased by mail or phone.
Metro has conducted numerous ORCA promotion programs:
- Outreach at senior centers,
community centers, major
employers, transit fairs,
senior/disabled residential facilities,
medical and veteran centers,
community agencies, schools, and
school districts. Portable customer
service terminals and an ORCA-To-
Go van have made these visits more
visible and allowed Metro
employees to issue cards at the
events. In the first four months of 2014, the pilot ORCA To Go program made 39 site
visits, issued 150 new ORCA cards, and sold fare media worth $15,186. We plan to
expand this program with the expectation that it will play an important role in serving
low-income-fare clients.
8 As of June 2014

King County Metro | Report on Transit Fares
31
ORCA Add-Value Locations

King County Metro | Report on Transit Fares
32
- In Motion. This Metro program that strives to reduce drive-alone travel in selected
communities through education, tools, and incentives, offers ORCA cards to induce
people to ride the bus.
- Special promotions. An example is Metro’s partnership with the Washington State
Department of Transportation to distribute $6 pre-loaded ORCA cards to help drivers
manage tolling and congestion in the State Route 520 and Alaskan Way Viaduct
construction corridors. Metro has also promoted particular bus routes using ORCA
cards as an incentive. We distributed more than 3,300 ORCA cards to customers in
2013 as part of our targeted route promotions.
- Promotions with other organizations. Metro has participated in ORCA promotions
with TransManage (downtown Bellevue), the City of Redmond R-TRIP program,
Commute Seattle (downtown Seattle), and the City of Kirkland (GreenTrips).
Potential future policies and programs Just as policies and programs have led to the current success of ORCA, further increases in
ORCA adoption will depend on policies and programs that break new ground. An analysis in the
2013 Rider/Non-Rider Survey report observed that “ORCA card adoption has plateaued and is
unlikely to increase significantly without further innovations.” Steps can be taken to give riders
incentives to purchase pre-paid fares, to mitigate impacts on those who rely on cash today, and to
offer new prepayment options.
One essential step is successful implementation of the low-income fare program. We are
planning robust marketing and outreach to make sure that Metro’s low-income customers are
aware of this new program, know how to apply, and understand how to use ORCA.
Collaboration with other entities is a key strategy of our marketing and outreach plan. We are
engaging the broad community of social service agencies and ethnic, community and other
organizations, and King County departments such as the Department of Community and Human
Services and Public Health – Seattle & King County.
Additional policy and program actions could include:
Offer an ORCA price incentive. One way to increase ORCA market share would be to provide
an E-purse fare that was discounted compared with the cash fare.
A discounted E-purse fare would have disadvantages, however. It would result in lost revenue
from existing E-purse users, and would likely siphon off some pass sales among riders whose
ridership is near the pass break-even point of 36 rides per month. This leaves the alternative of
increasing the cash fare while leaving the pass and E-purse fares the same.
Eliminate paper transfers. Eliminating paper transfers for cash payment and providing transfer
credit only for riders using their ORCA E-purses for fare payment would give riders an incentive
to use ORCA.
Between 30 and 40 percent of trips involve a transfer between buses, and some evidence
suggests that the percentage is even higher for cash riders, so eliminating cash transfers would be
an incentive for many riders. Sound Transit, Community Transit and Everett Transit have
eliminated cash transfers in the past few years.

King County Metro | Report on Transit Fares
33
Both of the fare policy changes described above would negatively affect low-income riders who
pay with cash and may face barriers to using ORCA. We expect to reduce these effects through
successful implementation of the new low-income fare.
Offer an ORCA Visitor Day Pass. The ORCA agencies are doing a six-month pilot project to
test this new product, intended to meet the needs of tourists, other visitors, and infrequent riders.
This regional pass will allow riders to travel by bus, train, streetcar or King County Water Taxi
all day for one price. The pass costs $9 and provides unlimited trips when the fare is $4 or less.
At the end of the six-month pilot period, the ORCA agencies will evaluate usage data to decide if
they will continue offering the pass.
Explore new alternatives to cash fare payment. In addition to increasing ORCA use, Metro
continues to explore alternatives to onboard cash fare payment.
We are installing a ticket vending machine on the Macy’s block in downtown Seattle to test
market response and operating cost of this approach to off-board fare payment, to help determine
if it can be a cost-effective way to speed buses through downtown Seattle.
Another possible approach is “mobile ticketing”—a smartphone app that allows customers to
purchase their fares and display fare payment using their smartphones. Metro’s intent for this
technology would be to provide an alternative to cash payment for infrequent riders, not to draw
ORCA-paying riders to mobile ticketing. It would also be well-suited for service to special
events, such as Husky games. We are planning to conduct a pilot or demonstration project in
2015. We would evaluate a number of issues, such as how much boarding time mobile ticketing
would save compared to cash fare payment, and how the region’s transit agencies could
coordinate use of this technology and apportion fare revenue.
Metro also is continuing to monitor developments in the use of contactless credit cards and
contactless payment using smartphones as possible paths toward reducing cash fare payment on
the bus.
The figure on the following page illustrates actions that could move Metro toward a cashless fare
system. Giving transit customers incentives and new options for cashless fare payment, and
mitigating the impacts on those who rely on cash payment today, could allow our customers to
realize a number of benefits as cash payment is reduced in the near-term and potentially
eliminated in the longer term.

King County Metro | Report on Transit Fares
34
Roadmap to a Cashless System

King County Metro | Report on Transit Fares
35
SECTION 5
Fare Options This section examines a number of potential options for increasing Metro’s fare revenue and
supporting other fare policy goals. These options include:
1. $0.25 increase across the board—all fare categories including low-income—but no fare
structure changes
2. $0.25 increase – peak only adult
3. Zone elimination – $0.50 increase for 1 zone
4. Step 1 of 2-step zone elimination – $0.25 for 1 zone
5. One county, one fare – eliminate zone and peak surcharges
6. Eliminate cash transfers
For each option we show estimates of:
The increase in 2016 fare revenue compared to a “no fare increase” baseline.9
The farebox recovery ratio
The change in total ridership (boardings)
Estimated changes to ORCA market share—the share of total boardings made with
ORCA cards
The implications for Metro’s other policy goals are also shown in a figure. In most cases we did
not include implications for the policy goal of benefitting low-income customers because, to the
extent that riders take advantage of the new low-income fare, they won’t be affected by the
options described here.
The options are described in detail in Appendix D, which shows the revenue impacts for each
fare category, the impact on the fare recovery rate, the change in ORCA market share, and the
overall change in average fare per boarding.
The budget proviso that called for this report also called for a comparison of forecasted ridership
and revenue for the period 2002 to 2012. This comparison is in Appendix C.
General assumptions To estimate the impact of these options on ridership and revenue, we made a number of
assumptions regarding the baseline ridership and revenue levels. These are consistent with
projections used in preparation of the adopted 2015 fare change.
It is important to note that these assumptions will change between now and when the
Executive’s budget is submitted to and ultimately adopted by the County Council. Data
should be treated as preliminary, with the focus being on the anticipated changes to
ridership, revenue, farebox recovery ratio and ORCA market penetration rather than the
bottom-line numbers.
9 The revenue increase shown for these options is annualized to reflect full phase-in of fare increases for Passport
programs and the U-Pass, a process that takes 12 months.

King County Metro | Report on Transit Fares
36
The analysis of the fare options is based on the following assumptions unless otherwise specified:
550,000 hours of service will be eliminated by end of 2015, resulting in a reduction in
ridership.
All ridership and revenue impacts of the fare options are measured against a baseline that
includes the adopted fare structure that takes effect March 1, 2015.
2016 baseline amounts:
- Ridership: 110.0 million boardings10
- Fare revenue: $137.9 million
- Farebox recovery: 27.7%
- ORCA market share: 75%
All fares increase on January 1, 2016.
Changes to U-Pass and Passport pricing are assumed to take place immediately, though in
actuality they would be phased in over the course of the year.
Estimates of future ridership are based not only on service hours but also on the projected
changes in employment, gas prices, and inflation shown in the following table.
2013 2014 2015 2016
CPI-W (1982-84=1.00) 1.76 1.89% 2.25% 2.30%
Retail gas prices -4.36% -2.12% -0.88% 2.12%
Employment growth 3.46% 3.20% 2.20% 1.84%
Source, employment growth: “Puget Sound Economic Forecaster,” Conway Pedersen Economics, Inc.; source, CPI-W and
gas prices: Office of Economic and Financial Analysis, March 2014 King County Economic and Revenue Forecast
All retail pass prices are set at 36 times the cash fare price.
We expect that Access fares would move in conjunction with changes to the senior/disabled
fares, although the impacts of Access fare changes on both operating costs and fare revenues
have not been included in these impacts. Changes to Access prices do not have a large impact
on revenue, but to the extent they reduce demand for Access services, they do impact the
program’s operating costs.
The methodology that Metro uses to estimate the impacts that fare options would have on
revenue and ridership assumes that different rider groups respond differently to fare changes.
Passport and U-Pass ridership is assumed to be unresponsive to the changes within the range
we are examining here. However, it is important to note that large changes in fares could
cause employers and institutions to re-examine their continued participation in these
programs. Of those riders not participating in institutional pass programs and those not
qualified for the low-income fare program, adult peak riders are assumed to be the least
responsive to changes in fares, followed by off-peak adult riders. Youth, senior/disabled and
low-income riders are assumed to be the most responsive to fare changes.
Ridership responsiveness will also be tempered by the soon-to-be implemented low-income fare
program. Low-income adult customers, who will now be eligible for a reduced fare, tend to be
most price-responsive.
10
Metro measures ridership based on boardings. A rider may transfer buses in making a trip, thus a trip may involve multiple boardings. A more thorough discussion of the relationship between trip fares, boardings and average fare per boarding is found on p. 21.

King County Metro | Report on Transit Fares
37
Option 1: $0.25 Across-the-Board Increase
This option would add $0.25 to all fares including discounted fares for youth, senior/disabled and
low-income customers and maintain Metro’s peak/off-peak fare differential, the 2-zone fare
structure during peak periods.
How this option would affect Metro’s fare policy goals
Goal Effect
Increase revenue $12.0 million additional farebox revenue.
Meet farebox recovery target Increase of 2.4% above the baseline.
Increase ridership Loss of 2.4 million boardings.
Increase ORCA market share No increase in ORCA market share.
Reflect cost of service Would continue to reflect the cost of service by maintaining the
two-zone and peak-fare structure, so that customers, in general,
pay more for trips that are more expensive to operate.
Would not address the equity issue raised by Metro’s two-zone
structure that results in some riders paying more for short two-zone
trips than some one-zone riders pay for longer trips.
Simplify fares/align with
regional transit partners
Would not further simplify Metro’s fare structure. Increased
youth and senior/disabled fares would bring them out of
alignment with Sound Transit’s fares for these groups.
Reduce costs/speed service Would not lead to a reduction in Metro’s operating costs.
Light gray text
indicates no impact.

King County Metro | Report on Transit Fares
38
Option 2: $0.25 Adult Peak Increase
This option would add $0.25 to adult peak fares, with no changes to other fares.
How this option would affect Metro’s fare policy goals
Goal Effect
Increase revenue $4.2 million additional farebox revenue.
Meet farebox recovery target Increase of 0.8% above the baseline.
Increase ridership Loss of 0.4 million boardings.
Increase ORCA market share No increase in ORCA market share.
Reflect cost of service Would continue to reflect the cost of service by maintaining the
two-zone and peak-fare structure, so that customers, in general,
pay more for trips that are more expensive to operate.
Would not address the equity issue raised by Metro’s two-zone
structure that results in some riders paying more for short two-zone
trips than some one-zone riders pay for longer trips.
Simplify fares/align with
regional transit partners
Would not further simplify Metro’s fare structure. Metro’s peak
fares would be further out of alignment with Sound Transit’s
adult fares.
Reduce costs/speed service The increased peak surcharge would provide an additional
incentive for customers to ride during off-peak periods, making
more efficient use of Metro’s fleet and ultimately reducing the
cost of fleet replacement. However, the increase in pass holders
and the flat fares for youth, senior/disabled and low-income
customers blunt the price advantage for off-peak travel.

King County Metro | Report on Transit Fares
39
Option 3: Zone Elimination – $0.50 One-Zone Peak Increase
This option would eliminate the zone surcharge during peak hours by increasing the one-zone
peak fare by $0.50. This option includes no other changes in fares.
Eliminating the surcharge for two-zone trips would be an important next step in the effort to
further simplify and coordinate regional fares that was started in 2011 pursuant to Council
direction.
Elimination of the zone surcharge would simplify and speed fare payment for customers and for
operators, who now must manually override the ORCA readers for customers not traveling in the
pre-set zone.
This change would also correct an inequity that occurs in the two-zone system: riders pay two-
zone fares for short trips if those trips happen to cross the zone boundary.
How this option would affect Metro’s fare policy goals
Goal Effect
Increase revenue $6.5 million additional farebox revenue.
Meet farebox recovery target Increase of 1.3% above the baseline.
Increase ridership Loss of 0.6 million boardings.
Increase ORCA market share No increase in ORCA market share.
Reflect cost of service Would continue to reflect the higher cost of providing peak
service. Elimination of the zone surcharge would mean that, in
general, Metro’s fares would reflect the cost of service less well.
However, this would also eliminate the inequity experienced by
riders making short, two-zone trips that cross the zone boundary.
Simplify fares/align with
regional transit partners
Would represent a major simplification of Metro’s fare structure;
adult fares would differ only by time of day. The elimination of
zones would be consistent with Sound Transit’s single-zone fare
structure in King County, with fare levels aligned during off-peak
hours.
Reduce costs/speed service Would reduce operating costs by eliminating the need for zone
overrides (interactions in which a customer must ask the driver to
override the preset zone fare because they will be taking a trip of
a different zonal length). Eliminating zone overrides would speed
boarding, decrease bus operating times, and allow Metro to
redeploy service hours and achieve cost savings.
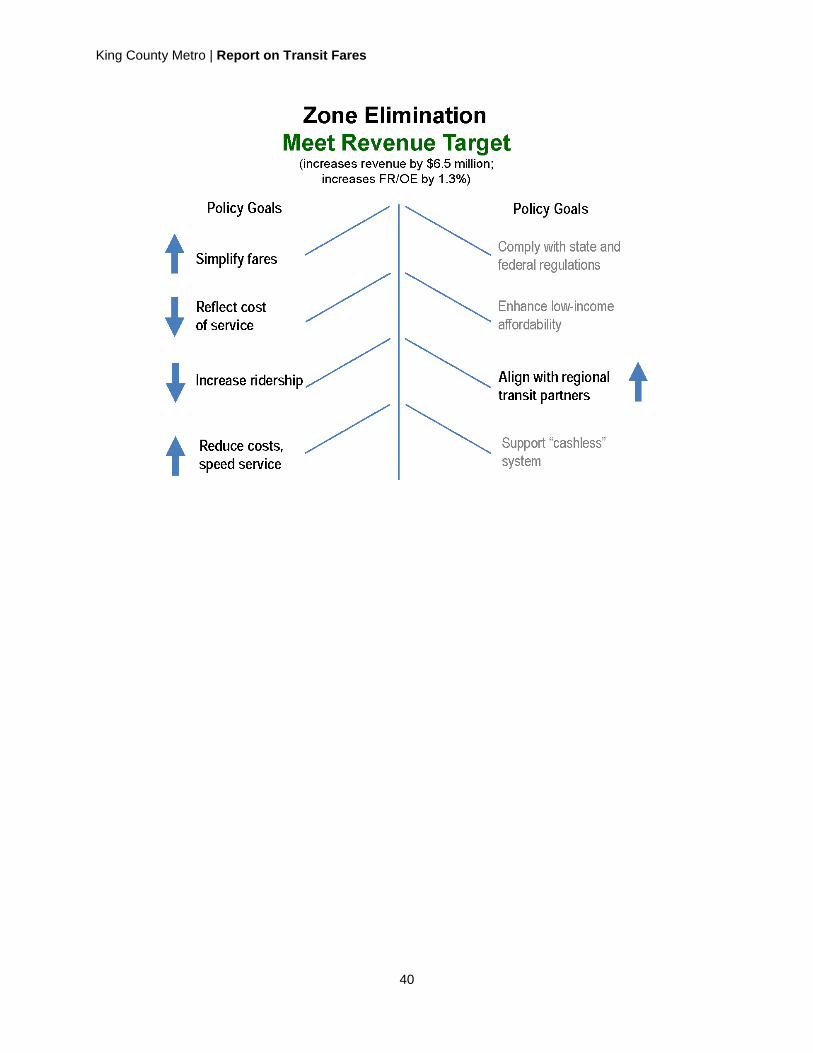
King County Metro | Report on Transit Fares
40

King County Metro | Report on Transit Fares
41
Option 4: Step One of Two-Step Zone Elimination – $0.25 One-Zone Peak Increase
This option would take the first step in a two-step move toward eliminating the zone surcharge
(as described in Option 3) by adding $0.25 to the one-zone peak fare, with no fare increases for
other customer categories. It would maintain a peak surcharge in the short-term, until the point at
which another $0.25 would be added to the one-zone peak fare with impacts described in the
previous option. (See zone fares in chart on p. 18)
How this option would affect Metro’s fare policy goals
Goal Effect
Increase revenue $3.2 million additional farebox revenue.
Meet farebox recovery target Increase of 0.7% above the baseline.
Increase ridership Loss of 0.3 million boardings.
Increase ORCA market share No increase in ORCA market share.
Reflect cost of service Maintenance of the peak surcharge would continue to reflect the
higher cost of providing peak service. Reduction of the zone
surcharge in this first step would mean that, in general, Metro’s
fares would reflect the cost of service less well. However, this
would also reduce the inequity experienced by riders making
short, two-zone trips that cross the zone boundary.
Simplify fares/align with
regional transit partners
Would move toward but not fully achieve simplification of the
fare structure.
Reduce costs/speed service Would move toward but not reduce operating costs by
eliminating the need for zone overrides.

King County Metro | Report on Transit Fares
42
Option 5: One County, One Fare – Eliminate Zone and Peak Surcharges
This option would eliminate both the zone and peak surcharges during peak hours by
establishing a flat fare for adult riders at $2.75. This option would not change adopted youth,
senior/disabled or low-income fares.
Eliminating the zone and peak surcharges would represent a significant step in the effort to
further simplify and coordinate regional fares that was started in 2011 pursuant to Council
direction.
Elimination of the zone surcharge would simplify and speed fare payment for customers and for
operators, who now must manually override the ORCA readers for customers not traveling in the
pre-set zone. This change would also correct the inequity that occurs in the two-zone system:
riders pay two-zone fares for short trips if those trips happen to cross the zone boundary.
Elimination of the peak surcharge would eliminate customer confusion resulting from schedule
delays on trips just before and after the peak hours.
How this option would affect Metro’s fare policy goals
Goal Effect
Increase revenue $2.4 million additional farebox revenue.
Meet farebox recovery target Increase of 0.5% above the baseline.
Increase ridership Loss of 0.5 million boardings.
Increase ORCA market share No increase in ORCA market share.
Reflect cost of service Elimination of the zone and peak surcharges would mean that, in
general, Metro’s fares would reflect the cost of service less well.
However, elimination of the zone would also eliminate the
inequity experienced by riders making short, two-zone trips that
cross the zone boundary.
Simplify fares/align with
regional transit partners
Would dramatically simplify Metro’s fare structure. A flat fare
would allow for alignment of Seattle Streetcar and Metro bus
fares, since the streetcars do not have a lower fare during off-peak
periods. This would also be consistent with Sound Transit’s
single adult fare for bus travel in King County, although the fare
level would be different.
Reduce costs/speed service Would reduce operating costs by eliminating the need for zone
overrides (interactions in which a customer must ask the driver to
override the preset zone fare because they will be taking a trip of
a different zonal length). Eliminating zone overrides would speed
boarding, decrease bus operating times, and allow Metro to
redeploy service hours and achieve cost savings.
Would eliminate a price incentive for riders to travel during the
off-peak period. Increased peak hour ridership could increase
Metro’s peak fleet requirement during times of expanding service.

King County Metro | Report on Transit Fares
43

King County Metro | Report on Transit Fares
44
Option 6: Eliminate Cash Transfers
This option would eliminate paper transfers for riders paying cash. Only riders paying their fares
with ORCA cards would be able to make free transfers, giving riders an incentive to switch to
ORCA card fare payment.
Additional assumptions Paper transfers are eliminated for all customers who pay cash. The analysis assumes that 90
percent of cash trips involving transfers would switch to E-purse for fare payment.
Cash and E-purse fares and pass prices are the same as in the “no fare increase” baseline.
Eliminating paper transfers does not change U-Pass and Passport pricing.
How this option would affect Metro’s fare policy goals
Goal Effect
Increase revenue $3.2 million additional farebox revenue.
Meet farebox recovery target Increase of 0.6% above the baseline.
Increase ridership Loss of 1.6 million boardings.
Increase ORCA market share 6% increase above the baseline. By providing a price incentive
for ORCA use, this option would result in the shift of more than
6 million boardings annually from cash to ORCA E-purse fare
payment.
Reflect cost of service Would continue to reflect the cost of service by maintaining the
two-zone and peak-fare structure, so that customers, in general, pay
more for trips that are more expensive to operate.
Would not address the equity issue raised by Metro’s two-zone
structure that results in some riders paying more for short two-zone
trips than some one-zone riders pay for longer trips.
Would better reflect cost of service by collecting additional
revenue from cash riders for additional boardings.
Simplify fares/align with
regional transit partners
Would not further simplify Metro’s fare structure. Would bring
cash transfer policy in alignment with Sound Transit, Community
Transit, Pierce Transit and Everett Transit.
Reduce costs/speed service Would speed service by promoting ORCA use and would reduce
costs of printing and distributing paper transfers.
Enhance low-income
affordability
The cost of using Metro would be higher for low-income adult,
senior and youth riders who do not pay with ORCA.

King County Metro | Report on Transit Fares
45
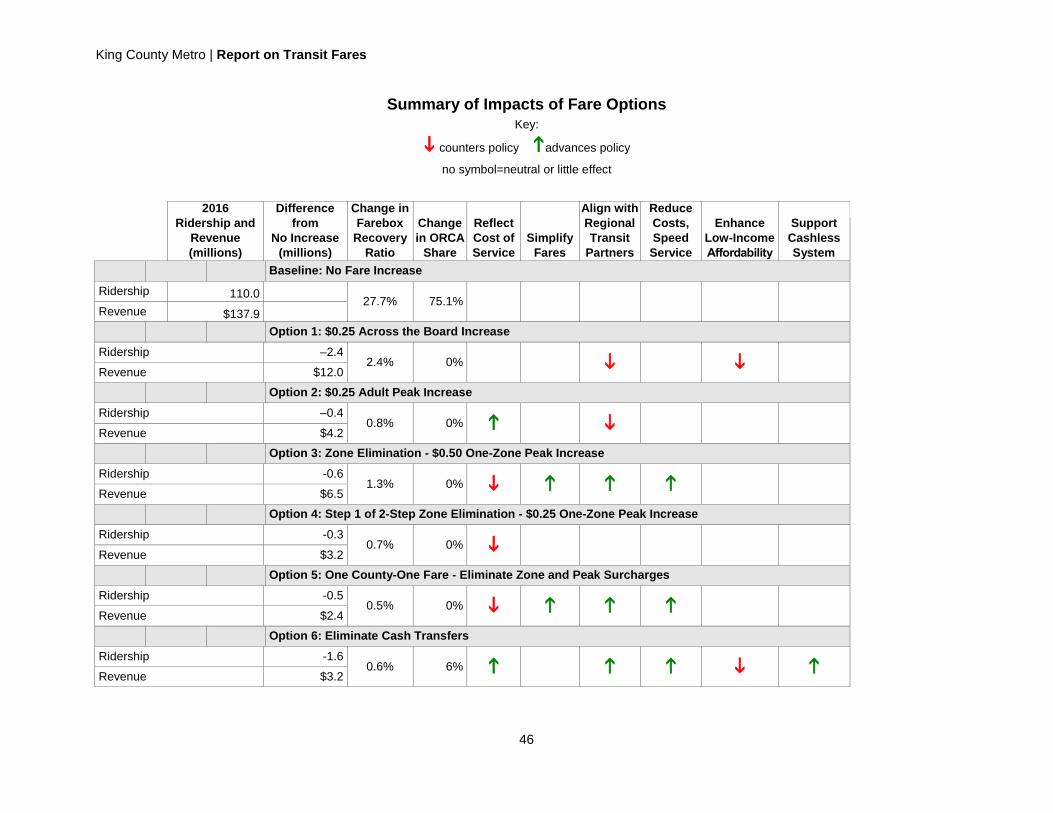
King County Metro | Report on Transit Fares
46
Summary of Impacts of Fare Options
Key:
counters policy advances policy
no symbol=neutral or little effect
2016
Ridership and
Revenue
(millions)
Difference
from
No Increase
(millions)
Change in
Farebox
Recovery
Ratio
Change
in ORCA
Share
Reflect
Cost of
Service
Simplify
Fares
Align with
Regional
Transit
Partners
Reduce
Costs,
Speed
Service
Enhance
Low-Income
Affordability
Support
Cashless
System
Baseline: No Fare Increase
Ridership 110.0 27.7% 75.1%
Revenue $137.9
Option 1: $0.25 Across the Board Increase
Ridership –2.4 2.4% 0%
Revenue $12.0
Option 2: $0.25 Adult Peak Increase
Ridership –0.4 0.8% 0%
Revenue $4.2
Option 3: Zone Elimination - $0.50 One-Zone Peak Increase
Ridership -0.6 1.3% 0%
Revenue $6.5
Option 4: Step 1 of 2-Step Zone Elimination - $0.25 One-Zone Peak Increase
Ridership -0.3 0.7% 0%
Revenue $3.2
Option 5: One County-One Fare - Eliminate Zone and Peak Surcharges
Ridership -0.5 0.5% 0%
Revenue $2.4
Option 6: Eliminate Cash Transfers
Ridership -1.6 0.6% 6%
Revenue $3.2

King County Metro | Report on Transit Fares
A-1
Appendices A. Fare Policy Goals and Methods table
B. Metro’s Fare History
C. Revenue and Ridership Projections
D. Fare Options Data
E. Peer Comparisons
F. Impact of Service Hour Changes on Ridership and Revenue
G. Glossary of Fare Terms and Concepts

King County Metro | Report on Transit Fares
A-2

King County Metro | Report of Transit Fares
A-3
Appendix A: Fare Policy Goals and Methods Table
Key:
counters policy advances policy no symbol=neutral or little effect ? =effect not clear
Policy Goals
Reflect
Cost of
Service
Simplify
Fares
Align with
Regional
Transit
Partners
Reduce
Costs,
Speed
Service
Enhance
Low-Income
Affordability
Comply with
State, Federal
Regulations Other Methods
Increase all fares 1
Increase adult fares (including low-income) 1
Maintain current senior/disabled fare (same as ST)
Maintain current youth fare (same as ST)
Maintain adopted low-income fare via ORCA ? 1
Eliminate zones 2
Eliminate peak surcharge 2
Maintain existing peak surcharge 1 311
Increase peak surcharge 3
Offer ORCA discount as incentive to switch from cash 5
Raise cash fares above ORCA fares as incentive to
switch to ORCA 5
Eliminate cash transfers to promote ORCA use 2
4, 5
Maintain low cash fares and free paper transfers
1 Fares might or might not equal Sound Transit’s
2 Fares might or might not equal Sound Transit’s, but would better align with ST’s fare structure
3 Spreads rides to off-peak period, promoting efficient use of fleet
4 Would reduce fare evasion
5 Would support transition to a cashless system

King County Metro | Report on Transit Fares
A-4
Appendix B: Metro’s Fare History
Passenger fares are a critical source of revenue for Metro, recovering about one-quarter of Metro’s
operating costs. Fares, fares structures, and fare payment methods play other important roles as well,
affecting ridership, customer satisfaction, access for people who have low incomes, boarding speed and
other aspects of bus operations, and more. As Metro has evolved over the past 40 years, the fare system
has changed to address different needs and challenges. These changes are summarized below.
1973
Metro began operation
38 zones
Adult fare: $0.20 plus $0.10 surcharge for each zone traveled
Youth fare: set at base adult fare with no zone surcharges
Senior fare: $0.10 with no zone surcharges
Ride Free Area (originally “Magic Carpet”) launched to improve mobility, reduce congestion and air
pollution, and support downtown businesses
1976
Reduced fare for riders with disabilities introduced, equal to senior fare
1977
Number of zones reduced from 38 to 2; boundaries set at Seattle city limits
Pass prices reduced to increase pass sales and benefit frequent riders
1982
Peak surcharge added, giving riders an incentive to shift to off-peak travel and enabling more efficient
use of Metro’s fleet—but making the fare structure more complicated
Regional Reduced Fare Permit established. Created a single permit good for reduced fare on regional
transit agencies and Washington State Ferries.
1983
Pass prices reduced again to increase sales and benefit frequent riders
Taxi scrip program authorized.
1985
Pass prices increased to raise fare revenue
1987
Ride Free Area closed after 9 p.m. due to concerns about operator and passenger safety
30 pass designs reduced to one, simplifying fare payment for operators
1990
The Americans with Disabilities Act is signed into law. The law requires transit agencies to provide
paratransit in the same areas and at the same times that fixed route service operates. This service must
be available for all customers unable to use the regular fixed route system because of a disability.

King County Metro | Report on Transit Fares
A-5
1991
Pass prices reduced to promote sales
15 percent ticket book discount started to provide discount to low-income riders unable to afford
monthly passes
1993
Pass prices increased to raise fare revenue
Ticket book discount eliminated because it was found to be ineffective in increasing ticket use by
low-income riders
Peak surcharge for youth eliminated to simplify fare payment and reduce fare for youth during peak
hours.
Ride Free Area closed after 7 p.m. due to concerns about operator and passenger safety
Human Services Ticket Program established in response to a request from Share, which had started a
homeless shelter beyond walking distance to downtown; tickets discounted 75 percent; subsidy
limited to $200,000 per year
1997
Regional fare policy forum of elected officials and transit board members resulted in
a new policy direction to Central Puget Sound transit agencies: make regional travel by transit
seamless for customers
Metro meets full compliance with paratransit requirements of ADA with its Access Transportation
service.
1999
Puget Pass Agreement adopted, providing for transit passes valid on Metro, Community Transit,
Everett Transit, Pierce Transit and Sound Transit. System of regional passes with regional revenue
apportionment among agencies is unique in the nation.
Two-zone surcharge in off-peak eliminated, simplifying fares and providing customers
a “flat fare” 18 hours a day on weekdays and all day on weekends and holidays
The King County Council adopts fare policies establishing that fare for Access service should move
toward parity with the adult off-peak fare for fixed route service.
The King County Council adopts the Paratransit Policy Ordinance, authorizing the Community
Access Transportation Program which allows for paratransit and community based programs for
seniors and people with disabilities that go beyond the requirements of the ADA.
2001
Youth Pass priced as a regional Puget Pass, further simplifying and aligning regional fares
Metro introduced peak fare for seniors and riders with disabilities to provide incentive for off-peak
ridership and to raise fare revenue, resulting in a more complex fare structure
2008
Peak surcharge for seniors and riders with disabilities eliminated, simplifying fares

King County Metro | Report on Transit Fares
A-6
2009
ORCA regional fare payment system launched; Kitsap Transit became participant
Performance Audit of Transit recommended that Metro should develop and propose fare policy goals
to the Regional Transit Committee and King County Council
2010
Metro, in coordination with the other transit agencies in the region, developed recommendations for
fare policy goals and fare changes. This responded to both a County Council proviso to the 2010-2011
budget and to the 2009 performance audit. Metro recommended that the goal of fare simplification be
given higher priority than in the past, and that regional fare integration become a strategy to support
this goal.
Specifically, Metro recommended eliminating non-regional passes and fares, and aligning Metro’s
fares for seniors/people with disabilities and for youth with Sound Transit’s fares for those categories.
Metro also recommended a longer term effort to further simplify fares and align adult fares in the
region, with particular emphasis on eliminating the zone surcharge.
2011
Following up on the 2010 recommendations, the County Council eliminated Metro-only passes for
seniors and riders with disabilities, eliminated other non-regional fare products and, with Sound
Transit, made fares consistent for youth, seniors and riders with disabilities on bus and light rail
service in King County.
Policy of moving Access fare toward parity with the off peak regular Metro fare reaffirmed by the
King County Council.
2012
The Ride Free Area in downtown Seattle was eliminated, mainly to recover the estimated $2 million
annually in fare revenue from trips taken in the RFA. This change also simplified fare payment with
the beginning of pay-on-entry systemwide, and addressed fare evasion and security concerns. The
City of Seattle began operating free shuttle service downtown to assist people who have little or no
income; Metro contributed vans for this service.
The change to pay-on-entry, especially in downtown Seattle, heightened the importance of speeding
up the fare payment process and boarding to keep buses moving swiftly through the downtown core.
2013
In response to concerns about the impact on low-income customers of four fare increases in
consecutive years and the elimination of the Ride Free Area in downtown Seattle, the County formed
a Low-Income Fare Options Advisory Committee. The committee recommended that Metro establish
a reduced fare for people with low incomes.
2014
The County Council adopts a low-income fare.

King County Metro | Report on Transit Fares
A-7
Appendix C: Revenue and Ridership Projections
Metro is not able to directly measure revenue and ridership for each customer category. We
estimate these each year using a methodology described below. Because they are estimates, a
detailed comparison of forecast and actual revenue and ridership by fare category is not possible.
Estimates of ridership and revenue by fare category are derived using a number of data sources.
Total annual fare revenue is the most certain of all the numbers we use. Once the financial books
on a year are closed and audited, Metro knows how much revenue we received from cash fares,
ticket sales and the apportionment of ORCA E-purse and pass revenue. This known total revenue
acts as a control for the fare category estimates; fare revenue estimates across all fare categories
must sum to this total.
Similarly, we estimate total systemwide boardings using a methodology based on Automated
Passenger Counter data. This APC-based methodology is reviewed annually during the FTA’s
audit of Metro’s National Transit Database submittal. This methodology currently provides an
estimate of systemwide boardings with a 95 percent confidence interval of + or – 0.5%. This also
serves as a control: boardings estimates across all fare categories must sum to this total.12
Data for ORCA cards, U-Pass, and Passport also represent data for which we have a high level of
certainty. The ORCA system reports Metro’s E-purse and pass boardings and revenue for adult
(total), youth, senior and disabled, U-Pass and Passport fare categories.
We have a high level of certainty about the cash and ticket revenue we receive through the
farebox system, with less certainty about total cash/ ticket boardings. Information from a 2003
on-board survey, farebox counts and total cash and ticket revenue are used to estimate cash/ticket
boardings and revenue by customer category.
Similarly, breaking out adult ORCA boardings and revenue by peak/off-peak and one-zone and
two-zone categories also relies in part on estimates based on the 2003 on-board survey of Metro
riders. Estimates of non-fare boardings are based on child ridership estimates from the 2003 on-
board survey and data from the 2010 fare-evasion study.
Of all the customer categories, the estimates of cash, ticket revenue and boardings, and non-
revenue boardings are the least reliable, and subject to the most manipulation in order to balance
revenue and ridership to the control totals. Metro has estimated, through statistical analysis of
historical data, an econometric model to forecast transit ridership based on expected changes in
King County employment and inflation-adjusted changes in gasoline prices and average transit
fares. This model has provided estimates of the responsiveness of Metro ridership to average fare
changes (systemwide fare elasticity) that have remained quite stable over the years at about -0.1.
This means that an average systemwide fare change of 10 percent is estimated to result in a one
percent decrease in ridership—all else being equal. Metro uses this systemwide estimate, along
with estimates of the differences in price responsiveness between different rider categories
derived from research conducted by others, to estimate the ridership and revenue impacts of
specific fare change proposals.
12
For information about Metro’s average fare per boarding, see page 21.

King County Metro | Report on Transit Fares
A-8
In an analysis for 2002 to 2012, we forecasted ridership in each year based on actual changes in
King County employment and inflation-adjusted changes in gasoline prices and, in years without
fare increase impacts, on inflation-adjusted changes in average transit fares. In years with fare
increase impacts (2002, 2008, 2009, 2010 and 2011), ridership impacts were estimated
separately. Metro’s econometric model forecasts and fare impact estimates tracked actual
ridership closely, with the exception of the years 2007 and 2008. These two years saw gas prices
rise above $4, as well as significant increases in local employment. These two factors coincided
in a manner unprecedented in our historical data, and working together resulted in ridership
increases well beyond our forecasts.
Over this 11-year period, our ridership forecasts, including estimated fare change impacts,
differed from actuals by an average absolute 1.8 percent. (Calculating the average absolute
difference avoids the problem of positive and negative differences canceling each other out when
calculating the average.) The average absolute percentage difference for the five years with fare
change impacts was slightly higher—2.3 percent. Excluding 2008, the year with the most
dramatic difference between forecast and actual, the average absolute percentage difference for
the 10 remaining years was 1.4 percent, while the average for the four remaining fare impact
years was 1.3 percent.
The table on the following page compares forecasted and actual revenue for the period 2008
through 2011, the years of the last four fare increases. The revenue forecasts shown for these
years were derived in two steps:
1. The current year estimated baseline revenue was calculated by multiplying the average
fare per boarding for the previous year by the actual boardings in the current year.
2. The version of Metro’s fare model in use at the time was used to derive estimates of
added revenue from the fare change in each year.
Next, the estimated fare impact, or estimate of additional fare revenue resulting from the fare
change, was added to the baseline revenue for each year. As shown in the table, the absolute
value of the percentage differences for these four years was 3.8 percent—somewhat higher than
the difference in ridership.
Looking at the pattern of differences over time shows the fare revenue estimates were low in
2008 and 2009, and high in 2010 and 2011. These differences are explained in part by the pattern
of change in Passport/U-Pass revenue. As shown in the graph on page 23, Passport/U-Pass
revenue grew at an unprecedented rate in 2008 and 2009, due largely to dramatic increases in
program participation not anticipated by our forecasts. Passport/U-Pass revenue flattened in 2010
and 2011, due to the change from a survey-based to an ORCA-based pricing methodology.
Again, the model used to develop fare revenue estimates did not anticipate this change.

King County Metro | Report on Transit Fares
A-9
Comparison of Actual and Estimated Ridership: 2002 through 2012 (ridership in millions of boardings)
Average Absolute %
Difference
Ridership 2002 2003 2004 2005 2006 2007 2008 2009 2010 2011 2012
2002-12
Excluding 2008
all years
years w/o FI
all years
years w/o FI
Actual 94.5 94.6 96.5 99.0 103.2 110.6 118.8 111.7 109.6 112.8 115.4
Forecast 94.9 95.6 96.6 99.7 101.6 105.5 113.3 111.3 113.1 113.2 114.8
Estimated fare impact
(1.0) (2.0) (1.1) (1.5) (2.2)
Forecast + fare impact
93.9 95.6 96.6 99.7 101.6 105.5 111.3 110.2 111.6 111.0 114.8
Difference: actual less (forecast + fare impact)
(0.6) 1.0 0.1 0.7 (1.6) (5.1) (7.6) (1.5) 2.0 (1.8) (0.6)
% difference: forecast + fare impact from actual
-0.6% 1.1% 0.1% 0.7% -1.6% -4.6% -6.4% -1.3% 1.8% -1.6% -0.5%
1.8% 2.3% 1.4% 1.3%
As noted above, estimates of ridership and revenue by fare category are derived using a number of sources. Some of these sources are
updated with a frequency that prevents a reliable year-to year comparison at the specific fare category level.

King County Metro | Report on Transit Fares
A-10
Appendix D: Fare Options Data

King County Metro | Report on Transit Fares
A-11

King County Metro | Report on Transit Fares
A-12

King County Metro | Report on Transit Fares
A-13

King County Metro | Report on Transit Fares
A-14

King County Metro | Report on Transit Fares
A-15

King County Metro | Report on Transit Fares
A-16
Appendix E: Peer Comparisons
How do Metro’s fares compare with other agencies? Metro has a complicated fare structure compared to other transit agencies. Of the local and larger
peers reviewed here, only TransLink in Vancouver, B.C. has both time of day and zone fares,
and their time of day pricing is simpler than Metro’s – TransLink dispenses with the zone fare
after 6:30 pm on weekdays and on weekends.
Metro and partner ORCA agencies are also unique in offering a regional pass providing full-
value transfers among the agencies. Below are key comparisons of Metro’s fare structure with
transit agencies in the state and with national peers. Metro has traditionally developed peer
comparisons with the other 29 largest bus transit agencies in the U.S. In this report, we have
added Vancouver, B.C.’s TransLink system.
Washington state agencies
Adult fare level: Metro, Sound Transit (ST), Community Transit, C-Tran (Clark County), Twin
Transit (Centralia), Columbia County Public Transportation and Yakima Transit have the highest
adult fares of the transit agencies in Washington State. The highest fares are for longer distance,
commuter express service provided by these agencies. ST has the highest base fare. Metro’s 2-
zone peak fare of $3.00 is higher than Sound Transit’s $2.50 fare for bus service in King County.
Youth fare discount: Metro is one of fifteen agencies that offer a youth cash/pass fare
discount. A number of agencies do not provide a youth fare discount for cash riders, but do sell
discounted monthly, school year or summer passes for youth riders. Metro's youth fare discount
ranges from 44 percent of the adult off-peak fare to 58 percent of the adult 2-zone peak fare.
Other agencies' cash youth fare discounts range from 0 to 63 percent.
Discount for seniors and riders with disabilities: All transit agencies in the state provide a
discount for this rider group. These discounts typically range from 50 to 75 percent. Metro’s
discount for this rider group varies from 67 percent of the adult off-peak fare, to 75 percent of
the adult 2-zone peak fare.
Zones/Distance: Metro is one of twelve agencies in the state that have zone or distance based
fare structure.
Time-of-day: Metro is the only agency in the state that has fares that vary by time of day. (Ben
Franklin Transit charges a premium fare for door-to-door service from 7 p.m. to 12:30 a.m.).
Premium/express fares: Ten agencies charge higher fares for premium or express service.
Passes: All but two agencies offer monthly passes, priced between 17 and 57 times the cash fare.
ORCA agencies’ pass prices are toward the top end of this range at 36 times the cash fare.
Seventeen agencies sell day passes valid every day. Of the ORCA agencies, only Pierce Transit
sells a day pass, which is valid only for Pierce Transit service on weekends and holidays. The
ORCA agencies are participating in a demonstration program to test a Regional All Day Pass.
Regional fares: Only the six ORCA transit agencies provide for regional fare payment.

King County Metro | Report on Transit Fares
A-17
National peers (top 30 bus transit agencies in U.S.) and Vancouver, B.C.
Adult fare level: Only seven of the national peer agencies have a base adult fare higher than
Metro's. Metro's highest adult fare is in the mid-range of the national peers. (Note that many of
the highest fares among national peers are for long-distance commuter express service, or for
travel on the Las Vegas strip.)
Youth fare discount: Twenty-six of the peers offer youth fare discounts, typically between 1/3
and 2/3 of the adult fare. Metro’s youth fare discount ranges from 44 percent of the adult off-
peak fare to 58 percent of the adult 2-zone peak fare.
Discount for seniors and riders with disabilities: All of the peers offer discounts for this rider
group, typically in the 50 to 67 percent range. Metro’s discount for this rider group varies from
67 percent of the adult off-peak fare, to 75 percent of the adult 2-zone peak fare.
Zones/Distance: Twelve of the peer agencies have zone/distance fare structures.
Time-of-day: Only three of Metro’s peers have time of day pricing for adult riders. (A number
of agencies offer fare discounts for special rider groups during mid-day.) One of these, TransLink,
eliminates the zone surcharge after 6:30 pm on weekdays and on Saturdays and Sundays.
Premium/express fares: Eighteen of the larger peer agencies charge higher fares for longer
distance, express or premium routes.
Passes: Almost all (28) of Metro’s 29 national peers plus TransLink in Vancouver B.C sell
monthly passes, typically priced between 30 and 40 times the cash fare. WAMATA
(Washington, D.C.) sells weekly instead of monthly passes and Houston Metro provides five free
rides for every 50 paid with their Metro Q fare card (Smartcard). Twenty-two agencies sell
multiday or weekly passes, typically priced between eight and 13 times the cash fare. Twenty
agencies sell day passes, typically priced between two and four times the cash fare.
E-purse or ticket discounts: Ten peer agencies provide discounts for fare prepayment using E-
purse or ticket books. Discounts typically range between 10 and 25 percent.

King County Metro | Report on Transit Fares
A-18

King County Metro | Report on Metro Fares
A-19
Peer comparison tables
Cash Fares Pre-Paid Fares
Transit Agencies City Adult
Minimum Fare
Adult Maximum
Fare
Senior/ Disabled
Fare (% discount)
Youth Fare (% discount)
Stored Value- SmartCard
(SC),Magnetic Ticket (MT) (%
discount)
Tickets (TIX),
Tokens (TOK) (% discount)
Adult Monthly Passes
Priced at # of Cash
Trips
Weekly Pass (# of cash trips)
Daily Pass (# of cash trips)
Zone/ Distance
Time of Day
Premium/ Express
Low Income
Program
Regional Pass/ Fare
Employer Programs
Other Low Income Fare
Notes
Discount for non-
cash fares Notes
State/Region
Whatcom Transit Authority
Bellingham $1.00 $2.00 $.50-$1.00
(50%) *$1-$2 (0%)
TOK (0%) 25
Y
Y
College
Provides up to 50,000 free day passes annually to social & health agencies for dist. to riders with low income or disabilities.
* No youth/student cash fares - only discount on youth pass ($15)
Kitsap Transit Bremerton $2.00 $2.00 $1.00 (50%) $1.00 (50%) SC (0%) 25-Kitsap only, 36-regional
5 Y Y College Limited cash fares
Skagit Transit Burlington $1.00 $2.00 $.50-$1.00
(50%) $.50-$1.00
(50%) MT (0%)
25
2 Y
Twin Transit Centralia $1.00 $5.00 *$1.00 (0%) *$1.00 (0%) 20 2 Y
*Senior, Disabled & Students get a discount on monthly pass.
Asotin County PTBA Clarkston $0.75 $1.00 *$.35-$.50
(50%) 27
Y
Y
*Half-fares (Sr/Dis) not allowed 11:00AM to 5:00PM.
Island Transit Coupeville $0.00 $0.00 $0.00 $0.00 Island Transit is funded by local retail sales tax.
Columbia County Public Transportation
Dayton $1.50 $7.50 $1.00-$7.50 (33%-0%)
*
Y
Y
* Age groups are 59 yrs and under and 60+ yrs.
Community Transit Everett $2.00 $5.25 $1.00-$2.50 (50%-52%)
$1.50-$4.00 (25%-24%)
SC (0%) 36 5 Y Y Y Y College No cash transfers
Everett Transit (local & commuter routes)
Everett $1.00 $1.75 $.25-$.75
(75%-57%) $.75-$1.25 (25%-29%)
SC (0%) *TIX (0%) 36
Y
Y Y College
No cash transfers
* Ticketbooks for paratransit trips.
Grays Harbor Transit Hoquiam $1.00 $3.00 $0.50-$2.00 (50%-33%)
$0.50-$2.50 (50%-17%)
*(0%) 28 3 Y Y
*Punch passes $10 ($.50 punches) and $20 ($1.00 punches)
RiverCities Transit Longview $0.60 $0.60 $.30 (50%) $.60 (0%)
17
2
Intercity Transit Olympia $1.25 $3.00 $0.50-$1.25 (60%-58%)
$1.00-$3.00 (0%)
TIX (0%) 29 2 Y Y
Pacific Transit System Pacific $0.35 $0.50 *$.35-$.50
(0%) *$.35-$.50
(0%) 57
5 Y
*Cash fares for all persons are $.35-$.50, but Youth & Senior can buy a monthly pass for $10 (which is 1/2 cost of monthly adult fare).

King County Metro | Report on Transit Fares
A-20
Cash Fares Pre-Paid Fares
Transit Agencies City Adult
Minimum Fare
Adult Maximum
Fare
Senior/ Disabled
Fare (% discount)
Youth Fare (% discount)
Stored Value- SmartCard
(SC),Magnetic Ticket (MT) (%
discount)
Tickets (TIX),
Tokens (TOK) (% discount)
Adult Monthly Passes
Priced at # of Cash
Trips
Weekly Pass (# of cash trips)
Daily Pass (# of cash trips)
Zone/ Distance
Time of Day
Premium/ Express
Low Income
Program
Regional Pass/ Fare
Employer Programs
Other Low Income Fare
Notes
Discount for non-
cash fares Notes
Clallam Transit System Port Angeles
$1.00 $1.50 $0.50-$1.00 (50%-33%)
$0.50-$1.00 (50%-33%)
TIX (0%) 36 3 Y
Jefferson Transit Port Townsend
$0.50 $2.50 $0.25-$1.00
(50%) $0.25-$1.00
(50%) * 48
**3 Y
Y
Reduced fare also available for those in a vocational career program w/ Washington State Individual Education Program.
*Forks route has a punch pass. **Adult/Sr/Dis/Youth fare is an All Day Pass.
Pullman Transit Pullman $0.50 $0.50 $0.30 (40%) $0.30 (40%) TOK (0%) 28
Ben Franklin Transit Richland $1.50 $3.00 $0.00-$3.00 (100%-0%)
$1.00 (33%)
TIX (20%) 17
3
Y
Night Service (7PM-12:30AM), curb to curb, $3.00 - I put this under Premium)
King County Metro Seattle $2.25 $3.00 $0.75 (67%-
75%) $1.25
(44%-58%) SC (0%) TIX (0%) 36 4 Y Y Y Y Y College
Sound Transit Seattle $2.50 $3.50 $.75-$1.50 (70%-57%)
$1.25-$2.50 (50%-29%)
SC (0%)
36
Y
Y
College
No cash transfers
Mason County Transit Authority
Shelton $0.00 $1.50 $.00-$.50 (0%-33%)
$.00-$1.50 (0%)
19 Y
Spokane Transit Authority
Spokane $1.50 $1.50 $0.75 (50%) $1.50 (0%) SC (0%)
30
3
Y College
Pierce Transit Tacoma $2.00 $2.00 $0.75 (63%) $0.75 (63%) SC (0%) 36 2 Y Y College * All Day passes on
Sa & Su
C-Tran (Clark County) Vancouver $1.70 $3.60 $.85-$3.60
(50%) $.85-$3.60
(50%) TIX (0%) 35
3 Y
Y Y Y College
Low income fare is $0.85 (50%)
09/01/14 - proposed fare increase to $1.70
Valley Transit Walla Walla $0.50 $0.50 $0.25 (50%) $0.25 (50%) TIX (0%) 40 *Y
*People enrolled in Job Access program can purchase a monthly pass for $12(40% discount).
Link (Chelan-Douglas PTBA)
Wenatchee $1.00 $2.50 $.50-$1.25
(50%) $1.00-$2.50
(0%) TOK (0%) 30
2 Y
Y
Yakima Transit Yakima $1.00 **$4.00 $.50 (50%) $.75 (25%) 25 2 Y Y
*Pending fare increase. **Travel between Yakima & Ellensburg.

King County Metro | Report on Metro Fares
A-21
Cash Fares Pre-Paid Fares
Transit Agencies City Adult
Minimum Fare
Adult Maximum
Fare
Senior/ Disabled
Fare (% discount)
Youth Fare (% discount)
Stored Value- SmartCard
(SC),Magnetic Ticket (MT) (%
discount)
Tickets (TIX),
Tokens (TOK) (% discount)
Adult Monthly Passes
Priced at # of Cash
Trips
Weekly Pass (# of cash trips)
Daily Pass (# of cash trips)
Zone/ Distance
Time of Day
Premium/ Express
Low Income
Program
Transit Agencies
City Adult
Minimum Fare
Adult Maximum Fare
Senior/ Disabled
Fare (%
discount)
Youth Fare (% discount)
National
MARTA (Metropolitan Atlanta Rapid Transit Authority)
Atlanta $2.50 $2.50 $1.00 (60%) *$1.44 (42%) **SC (15%) ***TIX 38 10 4
Y Y Y College
Via an agency that helps working poor, up to 4 weekly MARTA Breeze cards given to a person who has recently found a job (before first paycheck).
Yes
**Breeze Card discounts: 20 rides = $42.50; MARTA employer cards discount 50+ cards (3%), up to 10%. *** Tickets only for groups/special events/students.
Capitol Metro Austin $1.00 $2.75 $.50-1.35
(50%-51%) $.50-1.35
(50%-51%) *SC (20%) **TIX 33 9 2 Y Y Y College
*SC only for reduced fare riders, can be reloaded. **TIX only for Access. Active & reserve military free.
MTA (Maryland Transit Administration)
Baltimore $1.60 $5.00 $.55-$3.20 (66%-36%)
$1.10 (31%) SC (0%) *TIX 40 11 **3 Y
Y
Y Y College
* Commuter Bus tickets vary by zone. ** No all-day fares listed for commuter bus service.
Massachusetts Bay Transportation Authority
Boston $1.60 $5.25 $.80-$2.75
(50%) $.80-$2.75
(50%) SC (24%) TIX (24%) 32 12 8 Y Y Y
07/01/14 fare increase. Cash ride starts at $2.10, Charlie Card ride $1.60.
(CTA) Chicago Transit Authority
Chicago $2.25 $2.25 $1.10 (51%) $.75 (67%) *SC (11%)
45 13 5
Y Y Y College
Y
*Cash ride starts at $2.25 (no transfers), Chicago Card/ Chicago Card Plus ride for $2 (transfer +$0.25). Active & reserve military free.
RTA (Greater Cleveland Regional Transit Authority)
Cleveland $2.25 $3.50 $1.00 (56%) *$2.25 (0%) 38 10 3 Y Y College
* Some K-12 children can get a student pass from their school, which determines who gets a pass and the cost.
DART (Dallas Area Rapid Transit Authority)
Dallas *$1.75 $5.00 $1.25 (50%) **$1.25 (50%)
Regional TIX (40%)
46 15 3
*Y Y Y Y Y College
Lone Star cardholders w/ TANF benefits are eligible to purchase monthly p[asses at a 50% discount from listed fares.
*12/03/12 introduced a mid-day fare from 9:30AM-2:30PM, local $1.75 ($2.50 Peak), regional $3.50 ($5.00 Peak). *Student M-F only
Regional Transportation District
Denver $2.25 $5.00 $1.10-$2.50 (51%-50%)
$1.10-$2.50 (51%-50%)
SC TIX (11%) 36
3 Y Y Y College Yes Ticketbooks discounted: $20/10 rides.

King County Metro | Report on Transit Fares
A-22
Cash Fares Pre-Paid Fares
Transit Agencies City Adult
Minimum Fare
Adult Maximum
Fare
Senior/ Disabled
Fare (% discount)
Youth Fare (% discount)
Stored Value- SmartCard
(SC),Magnetic Ticket (MT) (%
discount)
Tickets (TIX),
Tokens (TOK) (% discount)
Adult Monthly Passes
Priced at # of Cash
Trips
Weekly Pass (# of cash trips)
Daily Pass (# of cash trips)
Zone/ Distance
Time of Day
Premium/ Express
Low Income
Program
Transit Agencies
Transit Agencies
City Adult Minimum
Fare
Adult Maximum
Fare
Senior/ Disabled Fare
(% discount)
City of Detroit Dept. of Transportation
Detroit $1.50 $1.50 $.50 (67%) $.75 (50%)
32 10
Y
Y
Transfers $,10-$0.25
The Bus (City & County of Honolulu Dept of Transportation Services)
Honolulu $2.50 $2.50 $1.00 (60%) $1.25 (50%) 24 *10 **Y Y Y College
* $25.00 pass is for 4 days. ** There are Express Routes, but the cost is the same.
METRO (Metropolitan Transit Authority of Harris County)
Houston $1.25 $4.50 $.60-$2.25 (52%-50%)
$.60-$2.25 (52%-50%)
*SC
3 Y
Y
Y College
Y *Metro Q fare card gives 5 free rides for every 50 paid.
Regional Transportation Commission of Southern Nevada
Las Vegas $2.00 $6.00 $1.00-$1.50 (50%-25%)
$1.00-$1.50 (50%-25%)
33 *17 3 Y Y College *$34 pass is for 15 days.
Metro (Los Angeles County Metropolitan Transportation Authority)
Los Angeles $1.50 $2.90 $.55 (63%) $1.00 (33%) SC TOK (0%) 50 14 4 Y
Y Y Y Y
Two programs: Road Relief, subsidy coupon used at a pass sales outlet to lower cost of a pass; Immediate Needs, social service agencies provide coupon, voucher, token or scrip for a trip.
Miami-Dade Transit Agency
Miami $2.25 $2.65 $.00-1.10
(100%-58%) $1.10 (51%) SC 50 13 3 Y Y Y Y College
Transportation Disadvantaged (TD) Program - free pass to low income. Patriot Passport for veterans w/ income <$22,000
Monthly pass is regional. Dade County employees have discounted passes.
Milwaukee County Transit System
Milwaukee $2.25 $4.10 $1.10 (51%) * ** TIX (22%) 29 8
Y
Y
Y College
**SC pilot starting.
Metro Transit Minneapolis $1.75 $3.00 $.75-$3.00 (57%-0%)
$.75-$3.00 (57%-0%)
*SC 34 13 Y Y Y Y Y College
Discount for groups serving homeless and job seekers (50%)
Y
Disabled riders pay $0.75 for all service. Disabled veterans free. *Stored value card; 10% bonus for all $$ added.
MTA New York City Bus New York $2.50 $6.00 $1.25-$3.00
(50%) *$0-$1.25
(100%-50%) SC
45 12
Y ***
Y Y
Y
*Half price passes for qualified students. **MetroCard - 5% bonus for putting $5+ on card. *** Express bus offers Senior/dis off-peak fare discount. Single ride ticket is higher, $2.75. 12/19/12, fare increase in 2013 of $.25 to base, senior, etc.

King County Metro | Report on Metro Fares
A-23
Cash Fares Pre-Paid Fares
Transit Agencies City Adult
Minimum Fare
Adult Maximum
Fare
Senior/ Disabled
Fare (% discount)
Youth Fare (% discount)
Stored Value- SmartCard
(SC),Magnetic Ticket (MT) (%
discount)
Tickets (TIX),
Tokens (TOK) (% discount)
Adult Monthly Passes
Priced at # of Cash
Trips
Weekly Pass (# of cash trips)
Daily Pass (# of cash trips)
Zone/ Distance
Time of Day
Premium/ Express
Low Income
Program
Transit Agencies
Transit Agencies
City Adult Minimum
Fare
Adult Maximum
Fare
Senior/ Disabled Fare
(% discount)
MTA Bus New York $2.50 $7.50 $1.25-$3.75
(50%) *$1.25-$7.50
(50%-0%) SC 45 12 Y *** Y Y Y
MTA Bus (regional) serves Bronx, Brooklyn, Queens, Manhattan. *Age 2 & up pay full fare; free & 1/2 price student passes. **MetroCard - 7% bonus for putting $10+ on card. *** Express bus offers Senior/dis off-peak discount. Single ride ticket higher, $2.50. Fare increase in 2013 of $.25 to base, senior, etc.
New Jersey Transit Corporation
Newark $1.50 $44.50 $.70-$20.00 (53%-55%)
$.70-$20.00 (53%-55%)
MT TIX (0%-?%) 36
Y
Y Y College
Y
Ticketbooks are discounted. Contactless card (Tap & Go). Military & dependents ride at senior rate.
Alameda-Contra Costa Transit District
Oakland $2.10 $4.20 $1.05-$2.10
(50%) $1.05-$2.10
(50%) *SC 36
**3 Y Y Y College Y
On 07/01/14, * Clipper card discounts ride cost; and Day Pass will be best value for transfers, as paper transfer goes away.
Orange County Transportation Authority
Orange $2.00 $6.00 $.75-$5.00 (63%-17%)
TIX (10%) 35 13 3
Y
Y Y College
*Youth (6-18 yrs) have a 30-day pass for $40.
SEPTA (Southeastern Pennsylvania Transportation Authority)
Philadelphia $2.25 $3.75 *$0-$1.50 (100%-33)
**$1.71-$3.62 (24%-3%)
TOK (20%) 41 11 4 Y Y Y College
*Seniors ride free, disabled $1-$1.50. **Student fares depend on school dist ($1.71-$1.81/ride; $3.62/day; $6/day). There are regional/ zones to $10.
Valley Metro Phoenix $2.00 $3.25 $.85 (58%) $.85 (58%)
32 10 *2
Y Y Y Y College
HS, schools, gov't can purchase passes at 50% discount.
Regular future fare increases. *Day pass $6 on bus. $4 at vending machine.
Port Authority of Allegheny County
Pittsburgh $2.50 $3.75 *$1.25-$1.85 (50%-51%)
**$1.25-$1.85 (50%-51%)
SC TIX (0%) 39 10 Y Y Y College
* Seniors ride free. ** Children's is 6-11yrs. Annual passes are priced at 11 month times monthly full fare. Transfers cost $1

King County Metro | Report on Transit Fares
A-24
Cash Fares Pre-Paid Fares
Transit Agencies City Adult
Minimum Fare
Adult Maximum
Fare
Senior/ Disabled
Fare (% discount)
Youth Fare (% discount)
Stored Value- SmartCard
(SC),Magnetic Ticket (MT) (%
discount)
Tickets (TIX),
Tokens (TOK) (% discount)
Adult Monthly Passes
Priced at # of Cash
Trips
Weekly Pass (# of cash trips)
Daily Pass (# of cash trips)
Zone/ Distance
Time of Day
Premium/ Express
Low Income
Program
Transit Agencies
Transit Agencies
City Adult Minimum
Fare
Adult Maximum
Fare
Senior/ Disabled Fare
(% discount)
Tri-County Metropolitan Transportation District of Oregon
Portland $2.50 $2.50 $1.00 (60%) $1.65 (34%)
TIX (0%) 40 11 2
Y Y Y College
HS agencies distribute to low income at low-cost or no-cost.
VIA Metropolitan Transit San Antonio $1.20 $2.50 *$.60-$1.25
(50%) $.60-$1.25
(50%) 30
4 Y Y College
* 9 AM-3 PM seniors and limited mobility persons can ride bus for $.25 (vs $.60).
MTS (San Diego Transit Corporation)
San Diego $2.25 $5.00 $1.10-$2.50 (51%-50%)
* SC TOK (0%) 32
3
Y
Y Y College
*Youth monthly pass is $36.
SFMTA (San Francisco Municipal Railway)
San Francisco
$2.00 $2.00 $.75 (63%) $.75 (63%) SC 33
Y Y Y
Pilot program to give low income youth free fare cards (Lifeline Pass) for 16 months.
09/01/14 - Fare increase to $2.25. daily & weekly passes are MuniPass.
King County Dept. of Transportation (Metro Transit)
Seattle $2.25 $3.00 $0.75 (67%-
75%) $1.25 (44%-
58%) SC (0%) TIX (0%) 36
4 Y Y
Y Y Y College
TransLink Vancouver BC
$2.75 $5.50 $1.75-$3.75 (36%-32%)
$1.75-$3.75 (36%-32%)
*SC (0%) **TIX (24%) 34
4 Y ***Y Y College
*Compass Card (a SmartCard) coming in "waves". **Discounts end in 2014. *** 3 zones until 6:30PM; after 6:30PM only 1 zone.
Washington Metropolitan Area Transit Authority
Washington $1.75 $7.00 $.85-$3.00
(50%) * SC (11%)
10
Y Y
06/29/14 fare increase makes add adult fares the same (no longer discount SC fares). *Students have a couple of pass programs depending on their school ($0 during school hours; $30/month - unlimited rides; $7.50/10 ride pass; $7.50/10 bus tokens.

King County Metro | Report on Transit Fares
A-25
Appendix F: Impact of Service Hour Changes on Ridership and
Revenue
The fare options analyses presented in this paper are all based on the assumptions made in
Metro’s financial plan regarding changes in annual service hours. Specifically, the analyses
assume an increase of just over 40,000 annual service hours in 2014, and significant service
hour reductions in 2015 and 2016—about 360,000 and over 180,000 annual service hours,
respectively. The service hour changes would have substantial effects on ridership and
revenue, as shown in the table below:
2014 2015
No Fare Structure Changes Option,
With Service Hour Changes
Ridership 121,800,000 117,000,000
Revenue $150,200,000 $147,400,000
No Fare Structure Changes Option,
Without Service Hour Changes
Ridership 120,800,000 121,900,000
Revenue $149,000,000 $153,600,000
Service hour changes account for an additional 1 million boardings and $1.2 million
in additional revenue in 2014.
In 2015, the service reductions drive 4.9 million decrease in boardings and $6.2
million decrease in revenue.
Although the potential changes in service hours would have significant effects on overall
boardings and revenue, the impacts of the fare options are almost identical regardless of
which service hour scenario they are based on, as shown in the following table.
Impacts from the Fare Change
2014 2015
No Fare Structure Changes Option,
With Service Hour Changes
Ridership -1,100,000 0
Revenue $8,100,000 $2,900,000
No Fare Structure Changes Option,
Without Service Hour Changes
Ridership -1,100,000 0
Revenue $8,100,000 $2,800,000

King County Metro | Report on Transit Fares
A-26
Appendix G: Glossary of Fare Terms and Concepts as Used by Metro
Fare structure
Peak trip: Any scheduled weekday trip that reaches its destination between 6 a.m. and 9 a.m. or
leaves its origin between 3 p.m. and 6 p.m., excluding weekdays on which the following holidays
are observed: New Year's Day; Martin Luther King, Jr., Day; Presidents Day; Memorial Day;
Independence Day; Labor Day; Veterans Day; Thanksgiving Day; and Christmas Day. (K.C.C.
chapter 28.92)
Off-peak trip: Any scheduled trip that is not a peak period trip. (K.C.C. chapter 28.92)
Peak surcharge: Additional fare charged for travel on peak trips. (K.C.C. chapter 28.92)
Zones: The City of Seattle is one zone, and all other areas that are outside the city boundary but
within King County are a second zone. (Note: There is a buffer zone on either side of the Seattle
City Boundary in the Duwamish industrial area.) Adult fares include a surcharge on any trips that
cross the boundary during peak hours. (K.C.C. chapter 28.94)
Current Metro fares:
(K.C.C. chapter 4A.700)
Adult fare: Available to persons 19 through 64 years old who do not qualify for other fare types.
Child fare: Available to children up to 6 years old when accompanied by a responsible person
paying the proper fare. (K.C.C. chapter 4A.700)
Youth fare: Available to persons from 6 through 18 years old and persons over 18 years old who
receive student passes. (K.C.C. chapter 4A.700)
Regional Reduced Fare Permit (RRFP): A program that entitles senior riders (65 and older),
riders with a disability, and Medicare card holders to reduced fares throughout the Puget Sound
region. Permit holders are entitled to a $0.75 fare ($27 regional ORCA pass) for Metro’s regular
transit services.
Persons with disabilities: Persons who, by reason of illness, injury, congenital malfunction, or
other permanent or temporary incapacity or disability, including those who are non-ambulatory and
those with semi-ambulatory capabilities, are unable without special facilities or special planning or
design to utilize mass transportation facilities and services as effectively as persons who are not so
affected. (K.C.C. chapter 28.92)
Off-Peak One-zone
peak
Two-zone
peak
Regular fare $2.25 $2.50 $3.00
Child fare No charge No charge No charge
Youth fare $1.25 $1.25 $1.25
Seniors and persons with disabilities fare $0.75 $0.75 $0.75

King County Metro | Report on Transit Fares
A-27
Fare payment
Cash fare: The fare paid by cash or paper tickets.
ORCA card: A contactless smart card used for payment of public transport fares in the Puget
Sound region. ORCA users can either load regional and agency-specific passes onto the card or
load funds onto an E-purse, which acts like cash, to pay a fare.
Pass partnerships: Metro’s partnerships with the UW, employers, colleges and state human
service agencies in King County through which the partners provide passes for students,
employees or clients. U-Pass is the University of Washington pass program. Passport is an
annual pass program that offers participants a package of commute services with pass prices
based on estimated use by employer or area. The Choice pass program allows employers to
purchase a variety of retail passes and/or E-purse products for employees as needed.
Transfers: For those customers paying cash, Metro provides paper transfers that are valid only
on Metro service (including the South Lake Union Streetcar). For customers using more than one
transit system, a fare must be paid each time a different bus is boarded. For customers using an
ORCA card, there is a two-hour transfer window on all transit buses, Link light rail, Sounder
trains, the King County Water Taxi and the South Lake Union Streetcar. (K.C.C. chapter
4A.700)
Other Human Services Ticket Program: A program for the sale and distribution of tickets to human
services agencies at 20 percent of their cash value for the purpose of meeting the transportation
needs of people who have low incomes or are homeless. Tickets are priced at an 80 percent
discount; the total value is limited to $1.875 million per year by King County Code, with
temporary increases in 2012, 2013 and 2014. The program is administered by the City of Seattle
Human Services Department and the King County Department of Community and Human
Services. (K.C.C. chapter 4A.700)
Top Related