


Languages
Pages
Legal


Report no. 19-04811-12
ITRF Local tie survey at the geodetic
observatory at Brandal, Ny-Ålesund Svalbard

Document information:
Title: ITRF Local tie survey at the geodetic observatory at Brandal, Ny-Ålesund
Svalbard
Date: 18 June 2021
Report no.: 19-04811-12
Authors: Oddvar B. Tangen, Ove C. D. Omang and Damien Pesce
Classification: Free
Summary: Determination of local ties at the geodetic observatory of Brandal, Ny-Ålesund. Description of survey methods, computations and results.
Keywords: VLBI, GNSS, Doris, Total station, Reference points
Reviewer: Per Chr. Bratheim

1
ABSTRACT
The ITRF2014 realization (the most recent frame of the International Terrestrial
Reference System) computed by the ITRF Product Centre (IGN Geodesy research team from IPGP) is the result of the reference frames combinations from four space
geodetic techniques (GNSS, DORIS, SLR and VLBI). The next ITRF update is intended to be ITRF2020, planned to be realised in 2021.
Local ties of reference points at sites with multiple techniques are crucial for the
realise of ITRF. The geodetic observatory of Brandal, Ny-Ålesund at Svalbard is equipped with two VLBI telescopes, DORIS station and three permanent GNSS
stations. One of the GNSS-stations is proposed to become part of the IGS network. The other two GNSS stations have stability problems. The observatory is also equipped with a gravimetric lab, and a SLR site is under construction. This report
describes the local tie survey carried out in August/September 2019 and 2020.

2
Table of contents
1 Introduction ............................................................................................ 3
1.1 Context ............................................................................................. 3
1.2 Glossary ............................................................................................ 3
2 Co-location site description ........................................................................ 4
2.1 Site information .................................................................................. 4
2.2 Co-located points ................................................................................ 5
3 Local tie survey description ........................................................................ 8
3.1 Organization ...................................................................................... 8
3.2 Equipment ......................................................................................... 8
3.3 Survey method ................................................................................... 9
3.3.1 VLBI reference points ................................................................... 10
3.3.2 GNSS reference point ................................................................... 11
3.3.3 DORIS reference point .................................................................. 12
4 Computation and data analysis ................................................................. 12
4.1 GNSS network .................................................................................. 12
4.2 Final adjustment ............................................................................... 13
4.2.1 Description of HREF_BRANDAL ....................................................... 13
4.2.2 VLBI reference points determination ............................................... 14
5 Results ................................................................................................. 14
5.1 Adjusted coordinates and confidence intervals ....................................... 14
5.2 Results comparisons .......................................................................... 16
5.3 Vectors ........................................................................................... 17
6 APPENDIX A SINEX files .......................................................................... 18

3
1 Introduction
1.1 Context The International Terrestrial Reference Frame (ITRF) is the result of a combination of different terrestrial reference frames provided by the four space geodetic
techniques (GNSS, DORIS, SLR and VLBI). To combine the technique specific reference frames to ITRF, local tie surveys between co-located space geodetic instruments are necessary. The ties are expressed in three dimensions with a
precision reflecting the accuracy of the reference frame. To improve the ITRF realization, local tie vectors from new co-located sites need to be added to the ITRF
combination. At the new observatory at Brandal, Ny Ålesund three space geodetic techniques are now present: VLBI, GNSS and DORIS.
The goals were the following:
• Assign coordinates to the reference points of the two VLBI-telescopes, DORIS antenna and GNSS sites.
• Provide tie vectors between instrument reference points (i.e. DORIS, GNSS and VLBI intersection point)
• Produce a survey result file in SINEX format.
1.2 Glossary
ARP: Antenna Reference Point
CNES: Centre National d’Études Spatiales (France) DOMES: Directory of MERIT Sites
DORIS: Doppler Orbitography and Radiopositioning Integrated by Satellite GGOS: Global Geodetic Observing System GNSS: Global Navigation Satellite System
IDS: International DORIS Service IERS: International Earth Rotation and Reference Systems Service
IGN: Institut National de l'Information Géographique et Forestière (France) IGS: International GNSS Service Kartverket: Norwegian Mapping Authority
SINEX: Solution INdependent Exchange SLR: Satellite Laser Ranging
VLBI: Very Long Baseline Interferometry Wasoft: GNSS software from University of Dresden by prof. L. Wanninger

4
2 Co-location site description
2.1 Site information
The new geodetic observatory at is located close to Ny Ålesund at Svalbard about
1.5 km north of the old observatory at Rabben. The observatory at Rabben include the VLBI antenna NYALES20 and the GNSS stations NYAL and NYA1. The new observatory, except the DORIS equipment, is owned by Kartverket (Norwegian
Mapping Authority).
Figure 1 Map of Spitsbergen, Svalbard

5
2.2 Co-located points
The observatory at Brandal, Ny-Ålesund is equipped with VLBI 2010 twin telescopes, three GNSS-stations, DORIS station, gravimetric lab, and SLR site
under construction. For local tie purposes, there are nine control points and one automatic total station for stability monitoring. One of the GNSS-stations, NABG is proposed as IGS and EPN-stations. The other two stations, NABD and NABE are not
stable and show annual variations in GNSS position.
Figure 2 Map of Brandal Geodetic Observatory

6
Table 1 Co-located points
Technique
Name
Domes no. Description Acronym
GNSS 10338M008 ARP, BAM. Top steel grid mast NABG
VLBI 10338S001 VLBI1, south, intersection point 7392
VLBI 10338S002 VLBI2, north, intersection point 7393
DORIS 10338S003 DORIS antenna reference point SVAC
The co-located points are listed in table 1. All the control points are listed in table 2.
Figures 3 - 5 show some of the co-located points and control points.
Figure 5 Permanent GNSS station NABG and CP6 with continuosly operating Trimble total station
Figure 3 Control points. From left: CP2 with GNSS antenna, CP7 with prism, CP7 with total station
Figure 4 DORIS

7
Table 2 Markers used in the local tie survey
Technique
name
Description Name or
number
GNSS GNSS station. Slightly unstable ~ 2 -3 mm NABD
GNSS GNSS station. Slightly unstable ~ 3 -4 mm NABE
TS, prism Prism holder under NABD antenna mount NABD_U
TS, prism Prism holder under NABE antenna mount NABE_U
Total
station/GNSS
Control points, short steel grid masts. All more
or less unstable. Equipped with GNSS for
monitoring stability.
CP1 – CP10
Total
station/GNSS
Control point on 5 m steel grid mast. Unstable CCP
TS, prism Prism holder on steel grid mast, previous GNSS NABA_R
TS, prism Prism holder on steel grid mast, previous GNSS NABF_R
GNSS Bolt in concrete monument, far away point S01T0001
GNSS Bolt, screw in concrete monument, far away
point
S01T0015
GNSS Bolt, screw in concrete monument, far away
point
S01T0016
TS, prism,
GNSS
Bolt, screw in bedrock, far away point S01T0017
TS, prism,
GNSS
Bolt, screw in bedrock, far away point S01T0018
TS, prism,
GNSS
Bolt, screw in bedrock, far away point S01T0020
TS, prism,
GNSS
Bolt, screw in concrete monument, far away
point
S01T0021
Continuously
operating TS
Trimble Total Station installed and operated by
company Cautus Geo. Stability measurement,
VLBI, SLR, and GNSS monuments
CP6

8
3 Local tie survey description
3.1 Organization The local tie survey observations were done from 23 August to 1 September 2019 and from 24 August to 5 September 2020 by Oddvar Tangen and Torbjørn Nørbech.
Working outdoor at the observatory calls for a polar bear guard.
3.2 Equipment All instruments are owned by Kartverket. The total Station is calibrated and
maintained annually.
Table 3 Equipment used in the survey
Equipment Trade mark, Serial number Specifications
Total Station Leica TS 15 , 1622095 EDM st.. dev. 1.0 mm +
1 ppm Angular st. dev.
0.6 mgon
Total Station Leica TS 15, 1612188 EDM st.. dev. 1.0 mm +
1 ppm Angular st. dev.
0.6 mgon
Reflector/Prism Leica GPH1P Centring accuracy 0.3
mm
Reflector/Prism,
Magnetic
Leica Red Ring Reflector (RRR) Centring accuracy
0.0254 mm
GNSS antenna
(GNSS campaign
network)
ASH700936E, CR15811 ASH700936E_M, CR520023605
ASH700936C_M, 11783 ASH700936C_M, 11978
GNSS antenna
(GNSS campaign
network)
TRM29659.00, 0220098649 TRM29659.00, 0220098660 TRM29659.00, 0220098656 TRM29659.00, 0220098661
GNSS receiver
(GNSS campaign
network)
TRIMBLE NETRS 4345228744
TRIMBLE NETRS 4439239161
TRIMBLE NETRS 4422234356
TRIMBLE NETRS 4422234369
TRIMBLE NETRS 4541260288
TRIMBLE NETRS 4422234360
TRIMBLE NETRS 4412232899
TRIMBLE NETRS 4345228724

9
Metrological data are taken from the AWIPEV research station and confirmed with an older Thommen barometer and Kern psycrometer for temperature.
3.3 Survey method
The total station has observed to all control points with visible lines of sight.
Horizontal directions, zenith angles and distances are observed in data sets, first defining the set by aiming the targets, and then the total station runs through the
sets automatically. Five readings in both theodolite positions and four full sets are measured. The relatively high number of readings is chosen in order to compensate for the slightly lower accuracy of the Leica TS 15 compared to the best
total stations available. The short steel grid mast design of the control points provides a very stable instrument setup for the duration of one campaign, but due
to unstable ground conditions, they are not stable over longer time periods.
The GNSS network is a combination of observations in 2016 and in 2019-2020. The 2016 campaign was carried out with seven days of observations on the points
named S01T00**. The GNSS observations from 2019 and 2020 include the permanent stations NYA1 and NABG, and the unstable stations NABD and NABE
The control points CCP, CP1, CP2, CP3, CP4 CP7 and CP8 at Brandal are normally equipped with GNSS. The GNSS antennas were replaced with the total station and reflectors during the local tie campaign. On CP9 and CP10 we made GNSS
observations during the local tie campaign in 2020.

10
Figure 6 GNSS observation points
3.3.1 VLBI reference points
The VLBI reference points are in this survey determined by combined observations to targets inside the azimuth
cabins and the control points outside. The azimuth cabins are each equipped with eight magnetic prism
holders for RRR-prisms. The positions of the prism holders are determined in an internal coordinate system by the manufacturer Asturfeito. The total station is
placed on a tripod in a position that provides lines of sight to at least three
control points outside and the eight RRR-prisms inside the cabins. The VLBI telescopes has to be set in a certain
azimuth position to get access to the outside control points through a small
hatch and the two doors on each side of the cabins.
Figure 7 RRR-prism Figure 8 VLBI1, door and hatch

11
3.3.2 GNSS reference point
The reference point, ARP/BAM, of the GNSS-station NABG was observed with total
station directly on the reference point before the antenna was mounted in September 2019. The IGS14 coordinates of NABG are determined by GPS L1
baselines from the IGS station NYA1.
Figure 9 Total station inside azimuth cabin
Figure 10 From left: NABG with total station, NABG with prism and NABG_U, NABG GNSS and NABG_U
12
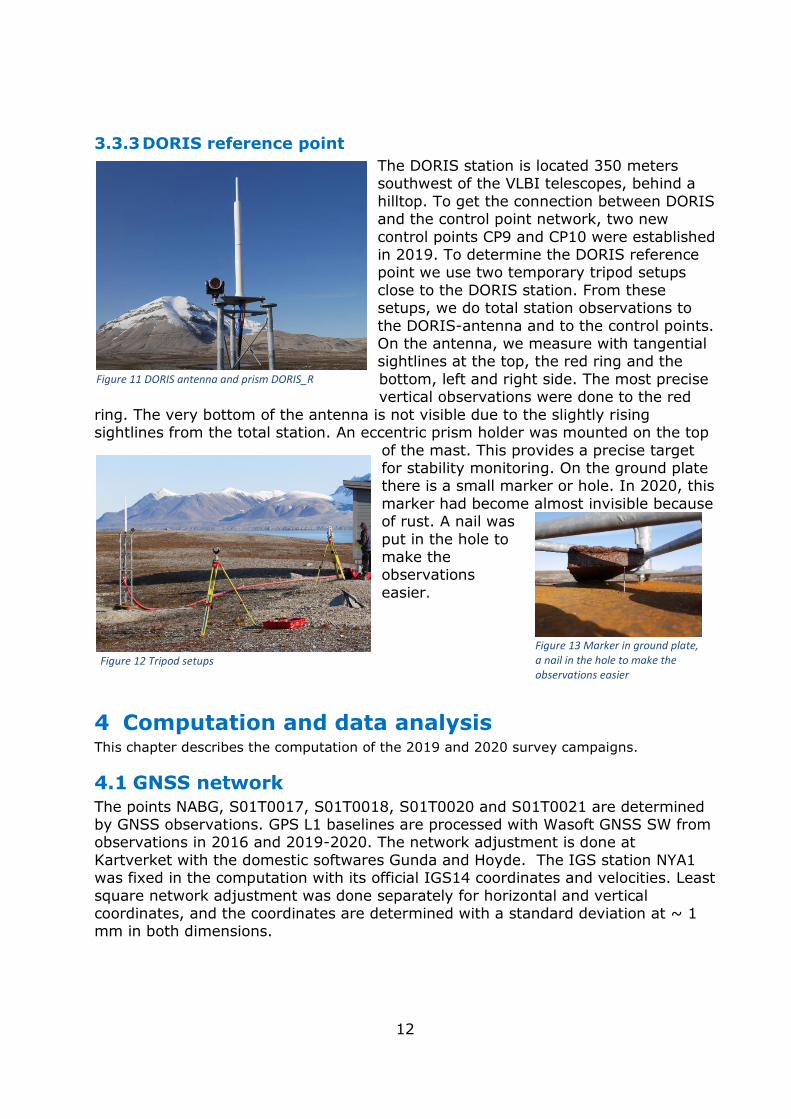
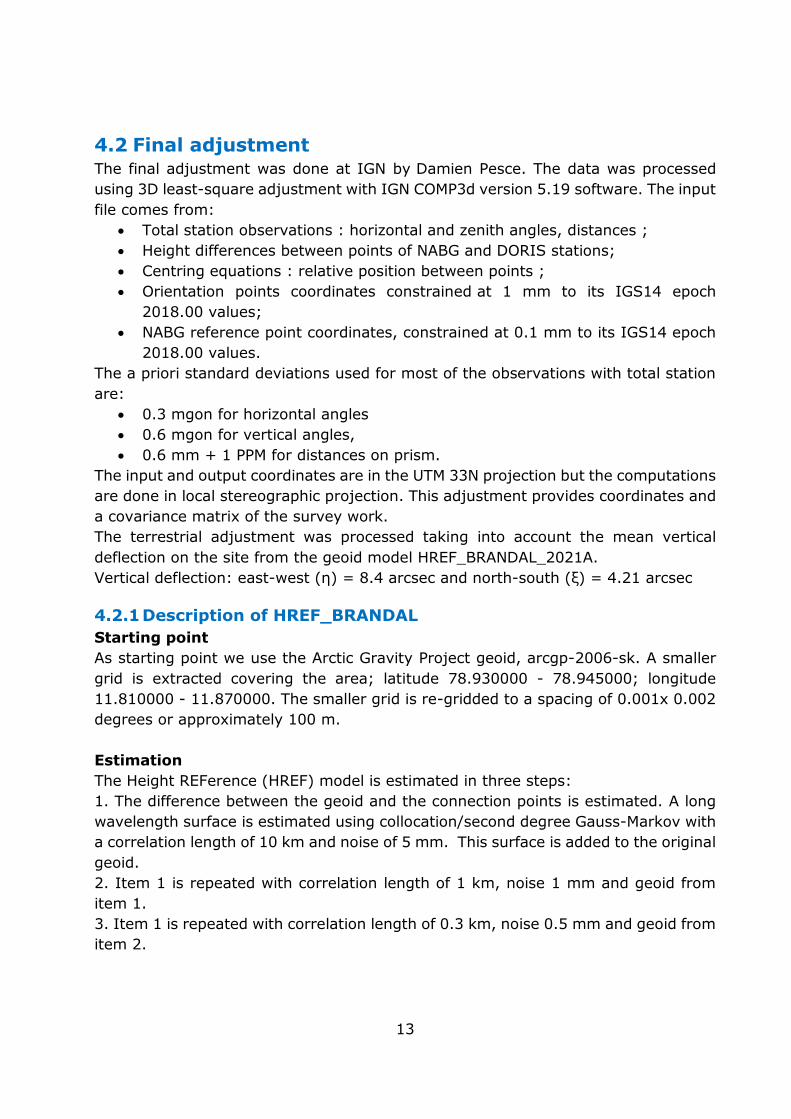
3.3.3 DORIS reference point
The DORIS station is located 350 meters southwest of the VLBI telescopes, behind a
hilltop. To get the connection between DORIS and the control point network, two new
control points CP9 and CP10 were established in 2019. To determine the DORIS reference point we use two temporary tripod setups
close to the DORIS station. From these setups, we do total station observations to
the DORIS-antenna and to the control points. On the antenna, we measure with tangential sightlines at the top, the red ring and the
bottom, left and right side. The most precise vertical observations were done to the red
ring. The very bottom of the antenna is not visible due to the slightly rising sightlines from the total station. An eccentric prism holder was mounted on the top
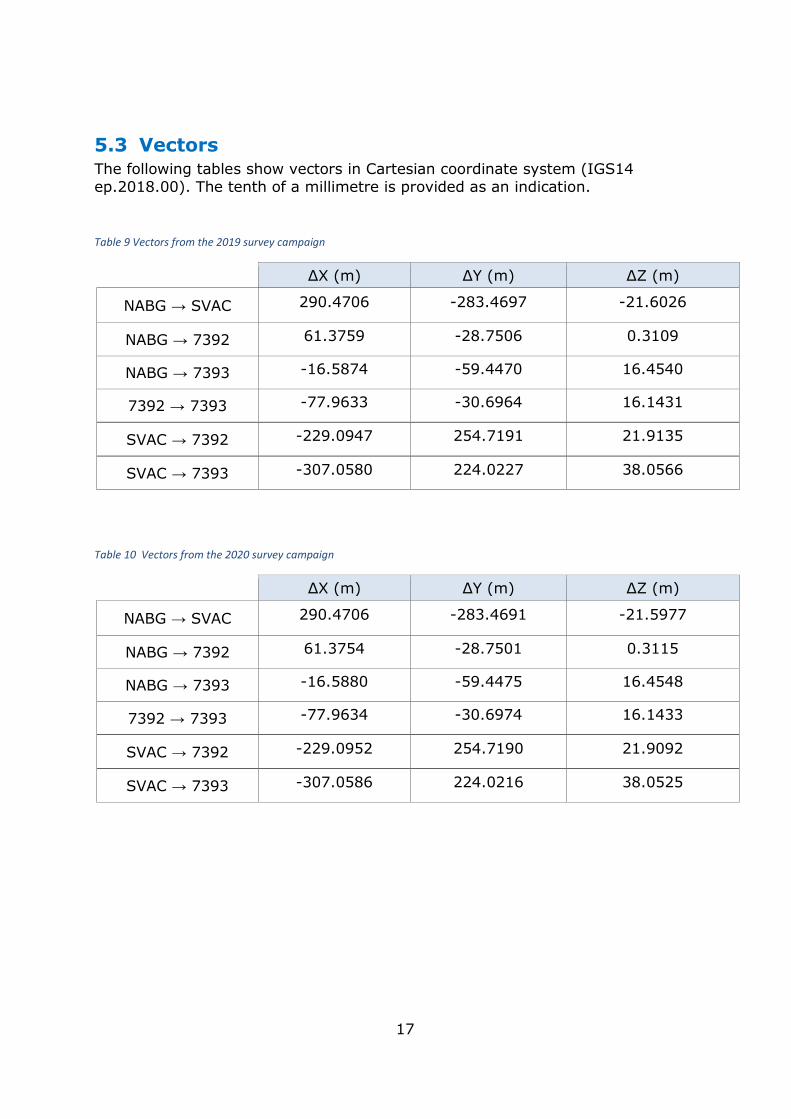
of the mast. This provides a precise target for stability monitoring. On the ground plate there is a small marker or hole. In 2020, this
marker had become almost invisible because of rust. A nail was
put in the hole to make the observations
easier.
4 Computation and data analysis This chapter describes the computation of the 2019 and 2020 survey campaigns.
4.1 GNSS network The points NABG, S01T0017, S01T0018, S01T0020 and S01T0021 are determined by GNSS observations. GPS L1 baselines are processed with Wasoft GNSS SW from observations in 2016 and 2019-2020. The network adjustment is done at
Kartverket with the domestic softwares Gunda and Hoyde. The IGS station NYA1 was fixed in the computation with its official IGS14 coordinates and velocities. Least
square network adjustment was done separately for horizontal and vertical coordinates, and the coordinates are determined with a standard deviation at ~ 1 mm in both dimensions.
Figure 13 Marker in ground plate, a nail in the hole to make the observations easier
Figure 12 Tripod setups
Figure 11 DORIS antenna and prism DORIS_R
13
4.2 Final adjustment The final adjustment was done at IGN by Damien Pesce. The data was processed
using 3D least-square adjustment with IGN COMP3d version 5.19 software. The input
file comes from:
Total station observations : horizontal and zenith angles, distances ;
Height differences between points of NABG and DORIS stations;
Centring equations : relative position between points ;
Orientation points coordinates constrained at 1 mm to its IGS14 epoch
2018.00 values;
NABG reference point coordinates, constrained at 0.1 mm to its IGS14 epoch
2018.00 values.
The a priori standard deviations used for most of the observations with total station
are:
0.3 mgon for horizontal angles
0.6 mgon for vertical angles,
0.6 mm + 1 PPM for distances on prism.
The input and output coordinates are in the UTM 33N projection but the computations
are done in local stereographic projection. This adjustment provides coordinates and
a covariance matrix of the survey work.
The terrestrial adjustment was processed taking into account the mean vertical
deflection on the site from the geoid model HREF_BRANDAL_2021A.
Vertical deflection: east-west (η) = 8.4 arcsec and north-south (ξ) = 4.21 arcsec
4.2.1 Description of HREF_BRANDAL
Starting point
As starting point we use the Arctic Gravity Project geoid, arcgp-2006-sk. A smaller
grid is extracted covering the area; latitude 78.930000 - 78.945000; longitude
11.810000 - 11.870000. The smaller grid is re-gridded to a spacing of 0.001x 0.002
degrees or approximately 100 m.
Estimation
The Height REFerence (HREF) model is estimated in three steps:
1. The difference between the geoid and the connection points is estimated. A long
wavelength surface is estimated using collocation/second degree Gauss-Markov with
a correlation length of 10 km and noise of 5 mm. This surface is added to the original
geoid.
2. Item 1 is repeated with correlation length of 1 km, noise 1 mm and geoid from
item 1.
3. Item 1 is repeated with correlation length of 0.3 km, noise 0.5 mm and geoid from
item 2.

14
Brandal HREF
The resulting HREF model is named HREF_BRANDAL_2021A.bin
4.2.2 VLBI reference points determination
The telescope manufacturer provides the coordinates of the 8 prisms inside the azimuth cabin for the two telescopes. Those coordinates are given in a local Cartesian frame with the VLBI reference point as origin. The accuracy of the local
coordinates is 0.01mm.
A 6-parameter transformation was adjusted between the local coordinates in the
azimuth cabin-fixed frame and the coordinates in the frame of the data adjustment using all available observations.
This transformation is working well for the north telescope. For the south telescope, we need to invert the sign of the x components of the manufacturer azimuth cabin-frame to make it fit to the survey observations. With this change, the adjustment
works well.
5 Results
5.1 Adjusted coordinates and confidence intervals The results of the adjustment are the coordinates of all points and their confidence ellipsoids in IGS14 at epoch 2018.00.
The tables below provide the 3D coordinates. The tenth of a millimetre is given as an indication.
Table 4 Cartesian Coordinates in IGS14 epoch 2018.00 from the 2019 survey campaign
Point – process name
X (m) Y (m) Z (m)
SVAC - DORIS 1201299.7299 251874.6071 6238000.5855
NABG - NABG 1201009.2593 252158.0768 6238022.1881
7392 - VLBI1A19 1201070.6352 252129.3262 6238022.4990
7393 - VLBI2A19 1200992.6719 252098.6298 6238038.6421

15
Table 5 Cartesian Coordinates in IGS14 epoch 2018.00 from the 2020 survey campaign
Point – process name
X (m) Y (m) Z (m)
SVAC – DORIS2 1201299.7299 251874.6077 6238000.5904
NABG - NABG 1201009.2593 252158.0768 6238022.1881
7392 - VLBI1A20 1201070.6347 252129.3267 6238022.4996
7393 - VLBI2A20 1200992.6713 252098.6293 6238038.6429
The tables below provide confidence ellipsoid (3D) at 2.5σ. (That means the results
have 90% of probability to be inside the ellipsoid)
Table 6 3D confidence regions 2.5 σ (90 percent) from the 2019 survey campaign in the local reference frame
Point – process nb ½ axis (mm) Azimuth (gr) Tilt (gr)
SVAC - DORIS
1.3 32.40 100
1.0 152.14 0
1.0 52.14 0
NABG - NABG
0.3 27.31 100
0.3 111.00 0
0.3 11.00 0
7392 - VLBI1A19
0.8 107.02 200
0.8 7.23 17
0.8 4.20 83
7393 - VLBI2A19
0.8 87.36 150
0.5 85.33 50
0.3 186.34 200

16
Table 7 3D confidence regions 2.5 σ (90 percent) from the 2020 survey campaign in the local reference frame
Point – process nb ½ axis (mm) Azimuth (gr) Tilt (gr)
SVAC – DORIS2
1.8 22.09 105
1.8 298.89 5
1.5 99.02 2
NABG - NABG
0.3 44.05 100
0.3 113.11 0
0.3 13.11 0
7392 - VLBI1A20
1.5 83.12 4
1.3 183.17 1
0.8 95.18 96
7393 - VLBI2A20
1.5 83.06 4
1.3 183.11 1
0.8 95.09 96
A complete covariance matrix was computed. Covariance submatrix for the main
points of interest was extracted for the following ITRF solution computation. Finally, the covariance submatrixes were converted into SINEX format using the « geotosnx » tool provided by Z. Altamimi (LAREG, IGN). The resulting SINEX files
are provided in Appendix A.
5.2 Results comparisons The table below provides the differences in results between the two computations.
Table 8 Coordinate differences from the 2019 and 2020 computations
Point ΔX (mm) ΔY (mm) ΔZ (mm)
SVAC 0.0 0.5 4.9
NABG 0.0 0.0 0.0
7392 -0.5 0.5 0.6
7393 -0.6 -0.6 0.8
The differences in coordinates of the VLBI reference points 7392 and 7393 are as expected based on the instrument specifications. The 4.9 mm difference of the z-coordinate of the Doris antenna SVAC is most likely due to imprecise observations
to the bottom of the antenna. This will be re-measured during the 2021 survey campaign.
17
5.3 Vectors The following tables show vectors in Cartesian coordinate system (IGS14
ep.2018.00). The tenth of a millimetre is provided as an indication.
Table 9 Vectors from the 2019 survey campaign
ΔX (m) ΔY (m) ΔZ (m)
NABG → SVAC 290.4706 -283.4697 -21.6026
NABG → 7392 61.3759 -28.7506 0.3109
NABG → 7393 -16.5874 -59.4470 16.4540
7392 → 7393 -77.9633 -30.6964 16.1431
SVAC → 7392 -229.0947 254.7191 21.9135
SVAC → 7393 -307.0580 224.0227 38.0566
Table 10 Vectors from the 2020 survey campaign
ΔX (m) ΔY (m) ΔZ (m)
NABG → SVAC 290.4706 -283.4691 -21.5977
NABG → 7392 61.3754 -28.7501 0.3115
NABG → 7393 -16.5880 -59.4475 16.4548
7392 → 7393 -77.9634 -30.6974 16.1433
SVAC → 7392 -229.0952 254.7190 21.9092
SVAC → 7393 -307.0586 224.0216 38.0525

18
6 APPENDIX A SINEX files
10338_Kartverket_2019-244.SNX
%=SNX 1.00 IGN 21:075:00000 IGN 19:244:00000 19:244:00000 C 00012 *------------------------------------------------------------------------------- +FILE/COMMENT * File created by geotosnx software (Z.Altamimi) * Original input file: .\calcul19-4.comp.cov * Matrix Scalling Factor used: 1.0000000000 -FILE/COMMENT *------------------------------------------------------------------------------- +SITE/ID *CODE PT __DOMES__ T _STATION DESCRIPTION__ APPROX_LON_ APPROX_LAT_ _APP_H_ SVAC A 10338S003 10338S003 11 50 29.6 78 56 27.8 65.1 NABG A 10338M008 10338M008 11 51 26.3 78 56 35.1 43.0 7392 A 10338S001 10338S001 11 51 19.4 78 56 33.4 53.6 7393 A 10338S002 10338S002 11 51 17.1 78 56 36.1 53.6 -SITE/ID *------------------------------------------------------------------------------- +SOLUTION/EPOCHS *Code PT SOLN T Data_start__ Data_end____ Mean_epoch__ -SOLUTION/EPOCHS *------------------------------------------------------------------------------- +SOLUTION/ESTIMATE *INDEX TYPE__ CODE PT SOLN _REF_EPOCH__ UNIT S __ESTIMATED VALUE____ _STD_DEV___ 1 STAX SVAC A 1 19:244:00000 m 2 0.120129972991000E+07 0.34744E-03 2 STAY SVAC A 1 19:244:00000 m 2 0.251874607140000E+06 0.35195E-03 3 STAZ SVAC A 1 19:244:00000 m 2 0.623800058548000E+07 0.54027E-03 4 STAX NABG A 1 19:244:00000 m 2 0.120100925927000E+07 0.99939E-04 5 STAY NABG A 1 19:244:00000 m 2 0.252158076793000E+06 0.99994E-04 6 STAZ NABG A 1 19:244:00000 m 2 0.623802218807000E+07 0.99998E-04 7 STAX 7392 A 1 19:244:00000 m 2 0.120107063519000E+07 0.26692E-03 8 STAY 7392 A 1 19:244:00000 m 2 0.252129326235000E+06 0.34292E-03 9 STAZ 7392 A 1 19:244:00000 m 2 0.623802249901000E+07 0.25808E-03 10 STAX 7393 A 1 19:244:00000 m 2 0.120099267187000E+07 0.17397E-03
11 STAY 7393 A 1 19:244:00000 m 2 0.252098629841000E+06 0.21743E-03 12 STAZ 7393 A 1 19:244:00000 m 2 0.623803864206000E+07 0.22634E-03 -SOLUTION/ESTIMATE *------------------------------------------------------------------------------- +SOLUTION/MATRIX_ESTIMATE L COVA *PARA1 PARA2 ____PARA2+0__________ ____PARA2+1__________ ____PARA2+2__________ 1 1 0.120716130343000E-06 2 1 0.122359497562000E-07 0.123866488230000E-06 3 1 0.298569784550000E-07 0.585270045179000E-08 0.291887921475000E-06 4 1 0.100456623920000E-07 0.109477610380000E-09 -.898552435478000E-11 4 4 0.998781551958000E-08 5 1 -.207819022696000E-08 0.783952137712000E-08 0.484215892419000E-09 5 4 -.332129633696000E-12 0.999874901460000E-08 6 1 0.742048162128000E-10 0.661997868165000E-10 0.998235653314000E-08 6 4 0.234403796311000E-11 0.113746178075000E-12 0.999954705525000E-08 7 1 0.182315469811000E-07 0.331535048491000E-08 -.105064243985000E-09 7 4 0.998981190049000E-08 -.212848728149000E-09 0.103969582647000E-10 7 7 0.712443694678000E-07 8 1 0.489985657914000E-08 0.162536363131000E-07 -.161991407612000E-08 8 4 0.147111916044000E-10 0.954627946801000E-08 0.154435679524000E-10 8 7 -.451970545942000E-08 0.117594894545000E-06 9 1 -.263287746436000E-09 -.715236114546000E-09 0.174917612119000E-07 9 4 0.110415078364000E-11 0.589324044749000E-10 0.999743987872000E-08 9 7 0.363987800959000E-09 -.436738357178000E-09 0.666059152785000E-07

19
10 1 0.200295853300000E-07 0.624102946310000E-08 -.112816283667000E-08 10 4 0.999973162591000E-08 -.443810384058000E-09 0.178943121310000E-10 10 7 0.142110987401000E-07 0.190535200397000E-08 0.186097623896000E-09 10 10 0.302668023041000E-07 11 1 -.584626016479000E-08 0.857955805679000E-08 0.930137769494000E-09 11 4 -.620791162703000E-11 0.101434997906000E-07 -.447626453652000E-11 11 7 -.207698851254000E-08 0.135722503627000E-07 -.246902569189000E-09 11 10 -.131287489591000E-07 0.472754356966000E-07 12 1 -.327482626020000E-09 -.102344850855000E-08 0.147937729561000E-07 12 4 0.575874753107000E-12 0.792614847872000E-10 0.999669937342000E-08 12 7 0.684667717707000E-09 -.102990442893000E-08 0.144424059964000E-07 12 10 0.997754112327000E-08 -.988188452422000E-08 0.512278498266000E-07 -SOLUTION/MATRIX_ESTIMATE L COVA %ENDSNX
10338_Kartverket_2020-244.SNX
%=SNX 1.00 IGN 21:075:00000 IGN 20:244:00000 20:244:00000 C 00012 *------------------------------------------------------------------------------- +FILE/COMMENT * File created by geotosnx software (Z.Altamimi) * Original input file: .\2020-3.comp.cov * Matrix Scalling Factor used: 1.0000000000 -FILE/COMMENT *------------------------------------------------------------------------------- +SITE/ID *CODE PT __DOMES__ T _STATION DESCRIPTION__ APPROX_LON_ APPROX_LAT_ _APP_H_ SVAC A 10338S003 10338S003 11 50 29.6 78 56 27.8 65.1 NABG A 10338M008 10338M008 11 51 26.3 78 56 35.1 43.0 7392 A 10338S001 10338S001 11 51 19.4 78 56 33.4 53.6 7393 A 10338S002 10338S002 11 51 17.1 78 56 36.1 53.6 -SITE/ID *------------------------------------------------------------------------------- +SOLUTION/EPOCHS *Code PT SOLN T Data_start__ Data_end____ Mean_epoch__ -SOLUTION/EPOCHS *------------------------------------------------------------------------------- +SOLUTION/ESTIMATE *INDEX TYPE__ CODE PT SOLN _REF_EPOCH__ UNIT S __ESTIMATED VALUE____ _STD_DEV___ 1 STAX SVAC A 1 20:244:00000 m 2 0.120129972987000E+07 0.66066E-03 2 STAY SVAC A 1 20:244:00000 m 2 0.251874607672000E+06 0.57438E-03 3 STAZ SVAC A 1 20:244:00000 m 2 0.623800059036000E+07 0.71720E-03 4 STAX NABG A 1 20:244:00000 m 2 0.120100925927000E+07 0.99965E-04 5 STAY NABG A 1 20:244:00000 m 2 0.252158076793000E+06 0.99997E-04 6 STAZ NABG A 1 20:244:00000 m 2 0.623802218808000E+07 0.99999E-04 7 STAX 7392 A 1 20:244:00000 m 2 0.120107063471000E+07 0.53621E-03 8 STAY 7392 A 1 20:244:00000 m 2 0.252129326713000E+06 0.54878E-03 9 STAZ 7392 A 1 20:244:00000 m 2 0.623802249957000E+07 0.30663E-03 10 STAX 7393 A 1 20:244:00000 m 2 0.120099267127000E+07 0.53438E-03 11 STAY 7393 A 1 20:244:00000 m 2 0.252098629266000E+06 0.56735E-03 12 STAZ 7393 A 1 20:244:00000 m 2 0.623803864288000E+07 0.28873E-03 -SOLUTION/ESTIMATE *------------------------------------------------------------------------------- +SOLUTION/MATRIX_ESTIMATE L COVA *PARA1 PARA2 ____PARA2+0__________ ____PARA2+1__________ ____PARA2+2__________
1 1 0.436475407233000E-06 2 1 0.262911997249000E-07 0.329915876011000E-06 3 1 0.748588479561000E-08 0.651246516504000E-08 0.514371584243000E-06 4 1 0.984691082085000E-08 0.473142206364000E-10 0.297204739771000E-10 4 4 0.999305733575000E-08 5 1 -.205416125885000E-08 0.784391500549000E-08 0.479243915807000E-09 5 4 0.226036268597000E-13 0.999931393297000E-08 6 1 0.111254055847000E-09 0.779123165310000E-10 0.997515348897000E-08 6 4 0.132709440477000E-11 0.232096669899000E-13 0.999974522021000E-08
20
7 1 0.268571120366000E-06 0.246556050321000E-08 -.448088172241000E-07 7 4 0.982124832011000E-08 -.208751804346000E-09 0.424752740832000E-10 7 7 0.287521486211000E-06 8 1 -.375700481988000E-07 0.211894656993000E-06 -.717976489088000E-09 8 4 0.230577168809000E-10 0.953543345514000E-08 0.142822506835000E-10 8 7 -.114421862149000E-07 0.301158055490000E-06 9 1 -.430708411136000E-07 -.794490074404000E-08 0.440348965288000E-07 9 4 0.332505199293000E-10 0.586363602924000E-10 0.999130273070000E-08 9 7 -.378226487970000E-07 -.698561920233000E-08 0.940191540350000E-07 10 1 0.275800142304000E-06 0.417789423503000E-08 -.464173337107000E-07 10 4 0.983274915376000E-08 -.436299498605000E-09 0.495321399895000E-10 10 7 0.261183209164000E-06 -.530619484106000E-08 -.435122760959000E-07 10 10 0.285562490533000E-06 11 1 -.623823757424000E-07 0.210190582315000E-06 0.399006418017000E-08 11 4 -.662947357945000E-11 0.101245231329000E-07 -.363297889030000E-11 11 7 -.857213450947000E-08 0.263655621291000E-06 -.885143818313000E-08 11 10 -.267162388029000E-07 0.321891213713000E-06 12 1 -.429865286293000E-07 -.807880635084000E-08 0.428865055704000E-07 12 4 0.315037292428000E-10 0.784840895177000E-10 0.999081449995000E-08 12 7 -.428804883636000E-07 -.102548166811000E-07 0.413947227123000E-07 12 10 -.335158874555000E-07 -.209706532587000E-07 0.833630820979000E-07 -SOLUTION/MATRIX_ESTIMATE L COVA %ENDSNX

www.kartverket.no
Postal and billing address:
P.O. Box 600 Sentrum, 3507 Hønefoss, Norway
Telephone: (+47) 32 11 80 00
Email: [email protected]
VAT number: 971 040 238
Top Related