


Languages
Pages
Legal


Renewable energyrisk and rewardKey trends and territories
A Lloyd’s emerging risk report

02
Renewable energy - key trends and territories

03
Renewable energy - key trends and territories
−
−
−
−
−
−
−
−
−
−
−
−
−
−
−
−
−
−
−
−
−
−
−

Contents 04
Renewable energy - key trends and territories

1.Key trends 05
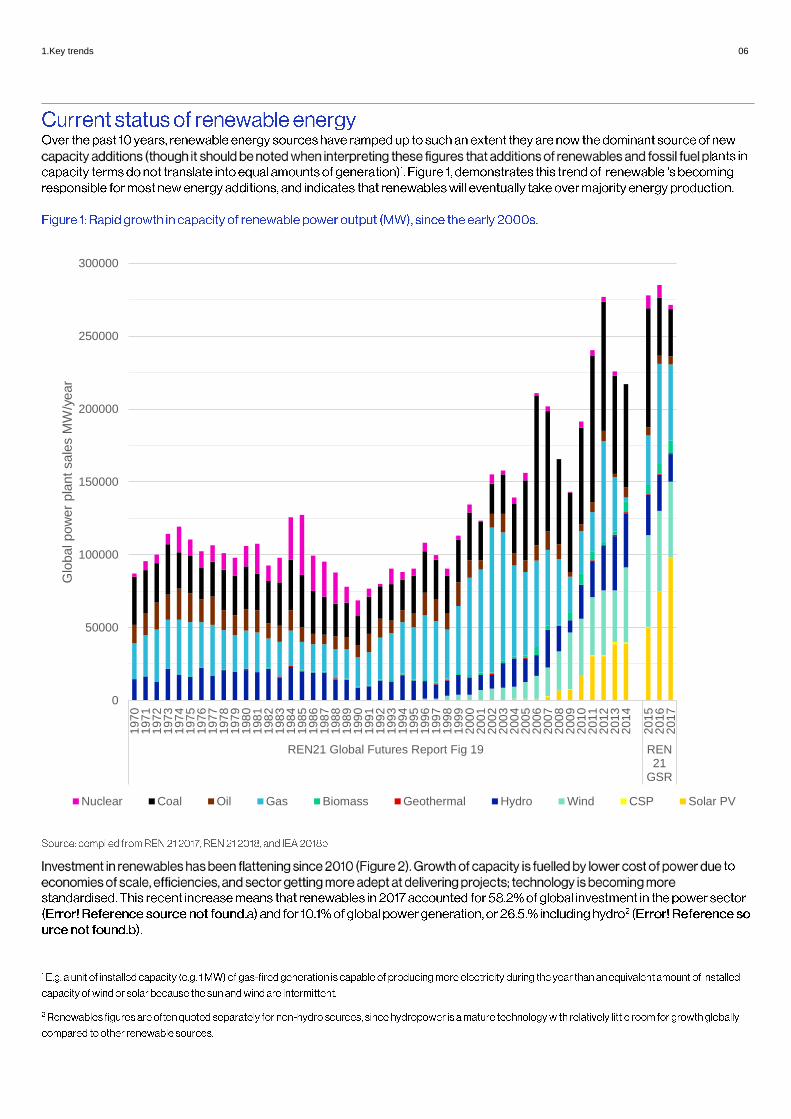
1.Key trends 06
0
50000
100000
150000
200000
250000
300000
197
01
97
11
97
21
97
31
97
41
97
51
97
61
97
71
97
81
97
91
98
01
98
11
98
21
98
31
98
41
98
51
98
61
98
71
98
81
98
91
99
01
99
11
99
21
99
31
99
41
99
51
99
61
99
71
99
81
99
92
00
02
00
12
00
22
00
32
00
42
00
52
00
62
00
72
00
82
00
92
01
02
01
12
01
22
01
32
01
4
201
52
01
62
01
7
REN21 Global Futures Report Fig 19 REN21
GSR
Glo
bal pow
er
pla
nt
sale
s M
W/y
ear
Nuclear Coal Oil Gas Biomass Geothermal Hydro Wind CSP Solar PV

1.Key trends 07
16 2239
62 64
103
158140
120145
179
137161
2840
61
75 80
102
87
84
86
111
125
122
107
12
13
18
1926
29
30
31
30
33
33
4649
20
41
50
3625
27
31
23
19
18
13
97
12
14
14
14 12
15
18
13
13
15
11
1210
2 0 0 5 2 0 0 6 2 0 0 7 2 0 0 8 2 0 0 9 2 0 1 0 2 0 1 1 2 0 1 2 2 0 1 3 2 0 1 4 2 0 1 5 2 0 1 6 2 0 1 7
Solar Wind Energy smart technologies Bioenergy Other

1.Key trends 08
−
−

1.Key trends 09
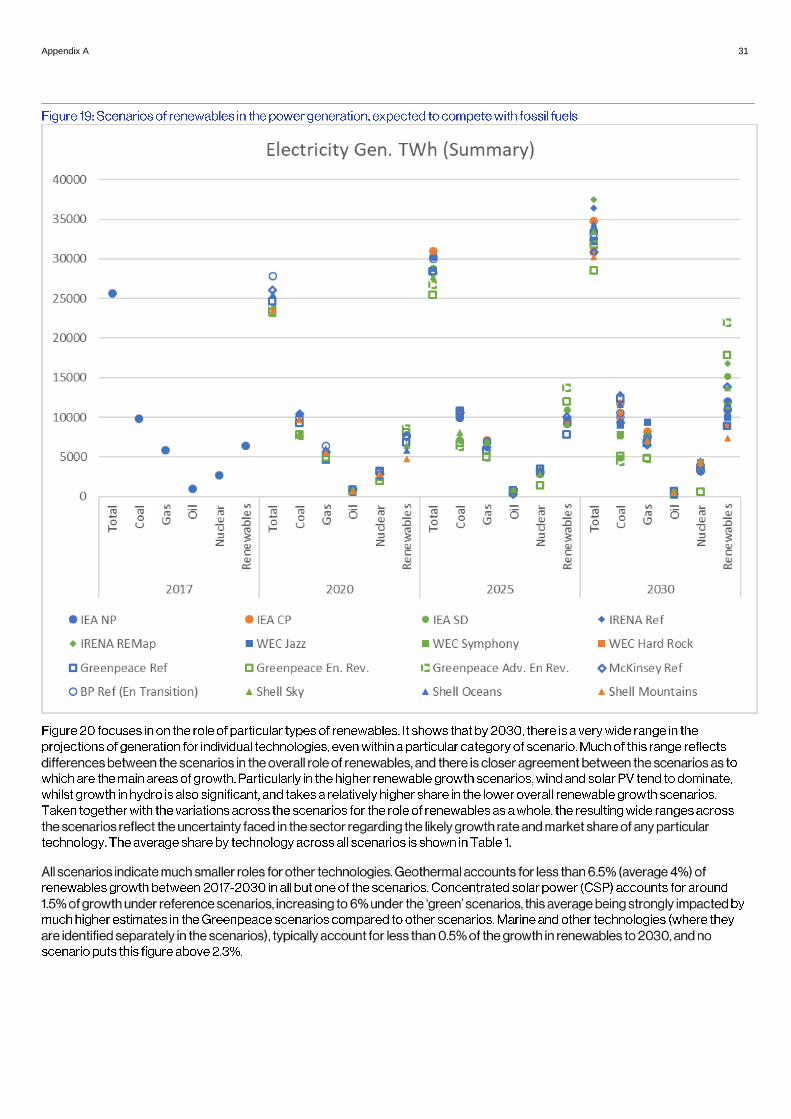
Key messages
- There is considerable variation in total power generation required globally. Overall, there is expected to be a drift upwards over time, reflecting global economic growth and the greater demand for energy services. Around this general trend however, there are two additional key drivers which act in opposite directions. On the one hand, improved end-use energy efficiency will tend to suppress demand increases, whilst on the other hand shifting to electrification of new sectors such as heat and transport will tend to accelerate demand increases. Each scenario reflects a different weighting of these drivers.
- Differences in policy remains the most important variant affecting the outcome for most of these scenarios, although many of the scenarios contain a rich variety of socio-economic drivers.
- The scenarios differ significantly over the rate at which coal is displaced from the system, with ‘green’ scenarios clearly showing a much faster decline in coal, whilst some of the reference and ‘pessimistic’ scenarios show an increase in generation from coal out to 2030.
- These factors combine to give a broad set of potential outcomes, with a standard deviation for the level of electricity generation from renewables of 30% across all the scenarios.

1.Key trends 10
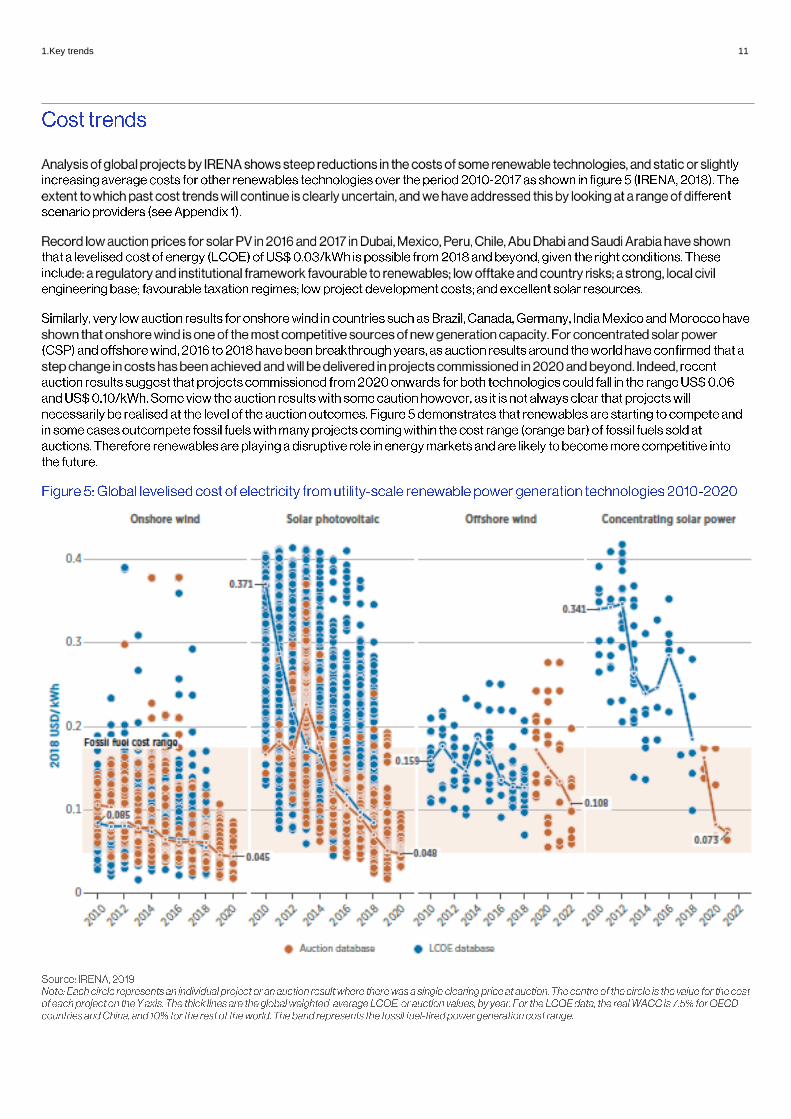
1.Key trends 11

1.Key trends 12

1.Key trends 13

1.Key trends 14

1.Key trends 15
Sources of finance for renewable energy The cost of capital for renewable energy projects has been exceptionally low in recent years, which has helped to
push down levelised costs of electricity for these technologies. Examples of the two main types of finance include:
1. On-balance-sheet finance: this tends to be done by utilities, which in turn rely on bond markets to provide
their central funds. Italy-based Enel was one of the largest single investors in renewable energy projects in
2016 and 2017. In January 2017, its Enel Finance International entity issued EUR 1.25 billion of 10-year
bonds at a coupon of 1.375%. In October 2012, it issued EUR 1 billion of 10-year bonds at a coupon of
4.875%.
2. Non-recourse debt finance for projects: most often, this takes the form of bank loans. Bloomberg New
Energy Finance estimates are that the initial all-in cost of debt for an onshore wind project in France, after
agreeing an interest rate swap to fix the cost of borrowing, was around 5% in 2012 but had fallen to between
2% and 2.5% in cheaper interest rate swaps all contributed to this shift.
These helpful effects do not necessarily last. Often, after that original funding and after they progress to a somewhat
lower-risk phase, projects are refinanced. This is often post-construction, but sometimes immediately pre-
construction or during construction. This refinancing stage has become the commonest method for institutional
investor cash to be deployed into the equity of renewables projects.
Institutional investor commitments to European renewable energy projects hit a record in 2017, of $9.9 billion, up
42% on 2016. Two of the biggest transactions of 2017 were Copenhagen Infrastructure Partners’ raising of $2.1
billion for its third private equity fund oriented towards renewables; and the purchase for $2.7 billion of a 50% stake
in Orsted’s 659MW Walney Extension offshore wind project in the U.K. North Sea, backed by a bond issue.
Development Banks and ECAs
Multilateral development banks have been important providers of finance for renewable energy for more than a
decade, often backing projects in countries where commercial banks are concerned about risk, or in technologies
where commercial banks are only just starting to get comfortable. Eight of the largest development banks, led by
KfW of Germany, the European Investment Bank and the World Bank Group, lent $55 billion between them to clean
power in 2016, a figure comparable to that in other recent yeas. This total includes funding for energy efficiency and
transmission, as well as for renewables projects. KfW was by far the largest contributor, with $34.1 billion of
commitments, up from $30.7 billion in 2015.
Export credit agencies, or ECAs, have also become vital elements in financing packages, particularly for large-ticket
projects. Their presence has the effect of covering at least in part the exposure of bank lenders to the project,
protecting them from problems such as equipment failure or breach of contract by the electricity off-taker. Because it
takes away some of the risk from lenders, it has the effect of reducing the interest rate payable on debt. In some
cases, this may be the difference between a project being economically viable, and it not being so. One of the
biggest ECA interventions in 2017 was the cover by German ECA Euler Hermes for just under half of the EUR 500
million of debt provided for the 650MW Markbygden Ett onshore wind project in northern Sweden.
Source: Global Trends in Renewable Energy Investment 2018 (Frankfurt School-UNEP Centre/BNE, 2018)

1.Key trends 16

1.Key trends 17

2. Regional focus 18
2. Regional focus 19
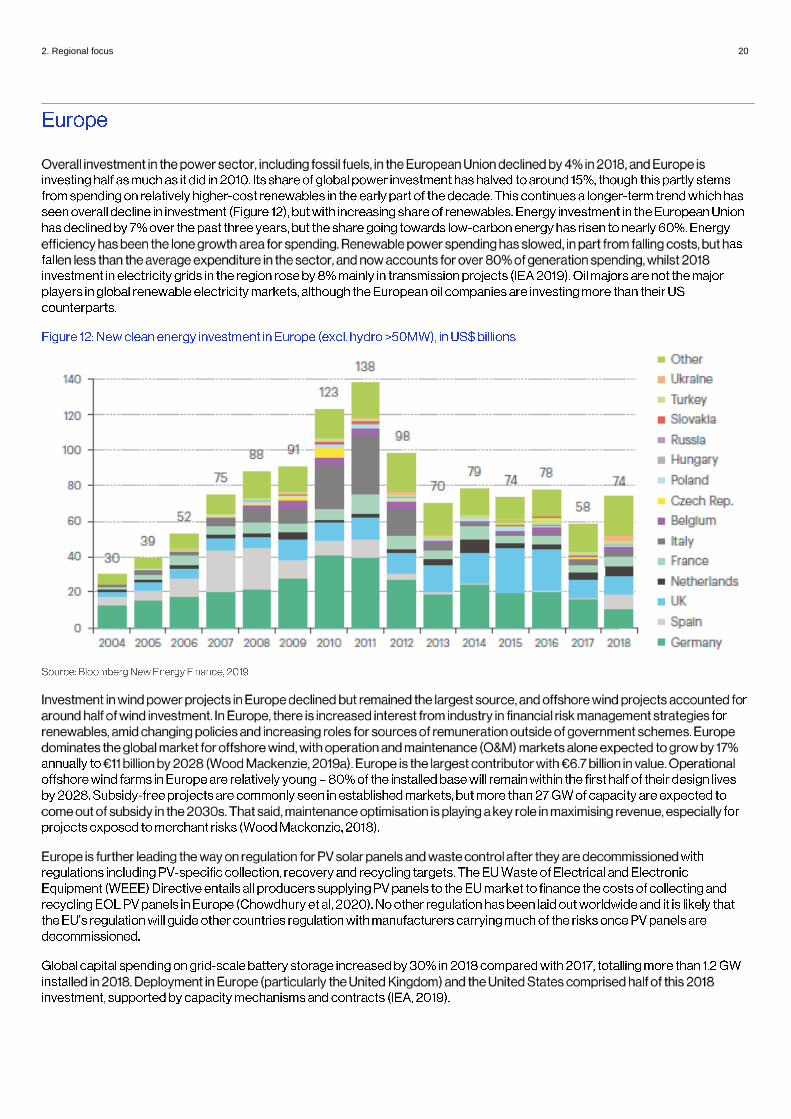
2. Regional focus 20

2. Regional focus 21
0
100
200
300
400
500
600
700
800
2009 2010 2011 2012 2013 2014 2015 2016 2017 2018
Thousand m
egaw
atthours
Other
Hydro
Solar
Wind

2. Regional focus 22

2. Regional focus 23
2. Regional focus 24
−
−
−
−
−
−
−
−
−
−
2. Regional focus 25
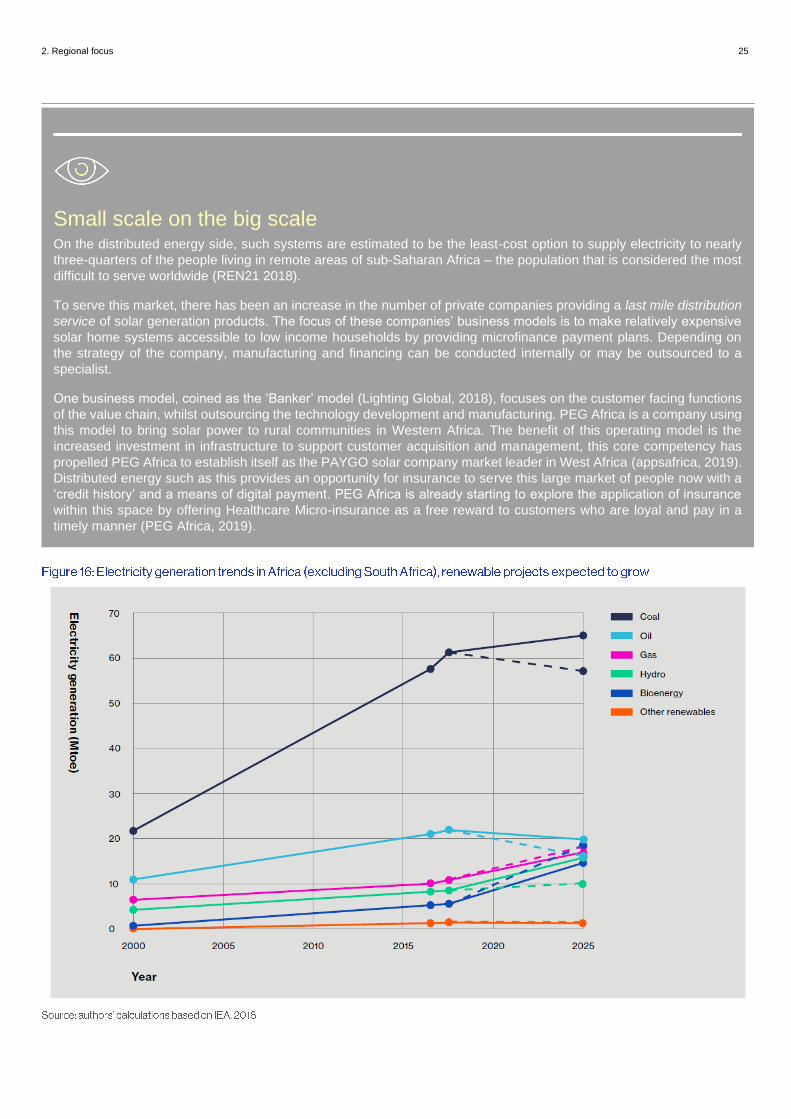
Small scale on the big scale On the distributed energy side, such systems are estimated to be the least-cost option to supply electricity to nearly
three-quarters of the people living in remote areas of sub-Saharan Africa – the population that is considered the most
difficult to serve worldwide (REN21 2018).
To serve this market, there has been an increase in the number of private companies providing a last mile distribution
service of solar generation products. The focus of these companies’ business models is to make relatively expensive
solar home systems accessible to low income households by providing microfinance payment plans. Depending on
the strategy of the company, manufacturing and financing can be conducted internally or may be outsourced to a
specialist.
One business model, coined as the ‘Banker’ model (Lighting Global, 2018), focuses on the customer facing functions
of the value chain, whilst outsourcing the technology development and manufacturing. PEG Africa is a company using
this model to bring solar power to rural communities in Western Africa. The benefit of this operating model is the
increased investment in infrastructure to support customer acquisition and management, this core competency has
propelled PEG Africa to establish itself as the PAYGO solar company market leader in West Africa (appsafrica, 2019).
Distributed energy such as this provides an opportunity for insurance to serve this large market of people now with a
‘credit history’ and a means of digital payment. PEG Africa is already starting to explore the application of insurance
within this space by offering Healthcare Micro-insurance as a free reward to customers who are loyal and pay in a
timely manner (PEG Africa, 2019).
2. Regional focus 26

2. Regional focus 27
−
−
−
−

Appendix A 28
o
o
o
o
o
o
o
o
o
o
o
o
o
o
Appendix A 29

Appendix A 30
0
5000
10000
15000
20000
25000
TPES O
ilG
asCo
alN
ucle
arB
iom
ass/
Was
teH
ydro
Oth
er R
enew
able
sTP
ES Oil
Gas
Coal
Nuc
lea
rB
iom
ass/
Was
teH
yd
roO
ther
Ren
ewab
les
TPES O
ilG
asCo
alN
ucle
ar
Bio
mas
s/W
aste
Hyd
roO
ther
Ren
ewab
les
TPES O
ilG
asCo
alN
ucle
arB
iom
ass/
Was
teH
ydro
Oth
er R
enew
able
sTP
ES Oil
Gas
Coal
Nuc
lea
rB
iom
ass/
Was
teH
yd
roO
ther
Ren
ewab
les
2017 2020 2025 2030 2040
Total Primary Energy Supply (Mtoe)
IEA NP IEA CP IEA SD WEC Jazz
WEC Symphony WEC Hard Rock Greenpeace Ref Greenpeace En. Rev.
Greenpeace Adv. En Rev. Exxon BP Ref (En Transition) BP ICE Ban
BP Less gas BP Re push BP FT BP EFT
Shell Sky Shell Oceans Shell Moutains
Appendix A 31

Appendix A 32

Appendix A 33

References 34
References 35
References 36
Top Related