


Languages
Pages
Legal


Journal of Heat Island Institute International Vol. 9-2 (2014)
Academic Article
- 1 -
Relationship between wind direction and air temperature in the Osaka center city determined using fixed point observation
Kosuke Kittaka*1 Hiroshi Miyazaki*2
*1 Dept. of Science and Engineering, Kansai University
*2 Dept. of Architecture, Faculty of Environmental and Urban Engineering, Kansai University
Corresponding author : Kosuke KITTAKA, [email protected]
ABSTRACT
In 2009, we have carried out traverse observation in the central area of Osaka. These results suggested that the
wind direction was the dominant factor in controlling air temperature in this built-up area. Thus, we now investigate
the thermal and meteorological environment using several fixed-point observation systems in the same area. The
aim of this research is to clearly show the relationship between air temperature and wind direction. The subject area
was the same area in the central part of Osaka, where we conducted our previous observations in 2009. We installed
observation devices at 34 locations in this area over 23 days in 2011 summer. We found that the air temperature
differences on the river side area were lower when the wind blew from the west and the air temperature differences
were higher when the wind blew from the north to the east. The air temperature differences in the business districts
were higher than the air temperature difference in other areas and the influence of wind direction was not clear in
these areas. The traverse observation in the park showed that the temperatures were lower than the temperatures in
other areas with any wind direction. However, the fixed-point observations showed that even in the park, wind
directions influenced the temperature, similar to the river area.
Key Words : Urban heat island, Wind direction, Fixed-point observation, Traverse observation
1. Introduction
The urban air temperature is rising, which results from the urban
heat island effect (UHI). Today, several events such as an
increasing number of hot nights, danger of heat stroke and air
pollution are serious social problems. UHI is a local climatic
effect, which depends on local conditions. Even though UHI is a
local effect, it is important to measure and understand this
phenomenon to determine an effective countermeasure.
Before this investigation, we performed a traverse observation,
where we used a bicycle as an observation platform in the
central area of Osaka in 2009. The results of this investigation
illustrated that wind direction was the dominant factor that
controlled the air temperature in this area. Although the traverse
observation by bike has the advantage of allowing detailed
observation, this method can only take a snapshot. This means
that the traverse method needs further research and other
methods to confirm its repeatability.
A commonly-used method is fixed-point observation. When
fixed-point observation is performed, air temperature data from
meteorological agencies and the local government are often
used.
However, detailed observation in a small area is not often
performed, because observation methods are not standardized at
every management organization and there are few observation
points.
In this study, we performed fixed-point observation in the central
area of Osaka, the same area that we used for our previous
observations in 2009. We installed observation devices at 34
locations in this area over 23 days in the summer of 2011.
2. Traverse observation
In our former investigation in 2009, we performed traverse
observations 6 times using 10 bicycles over 2 days (3 and 7
August). Table 1 shows the time schedule of this research. It was
a clear day on 3 August 2009, and on 7 August 2009, it was
cloudy until noon and then became clear in the afternoon. Table
2 shows the average, maximum, and minimum air temperatures
that we found in the traverse research. The days were hot and
had no precipitation.
Of the six observations, RUN2 and RUN5 are shown.
- 2 -
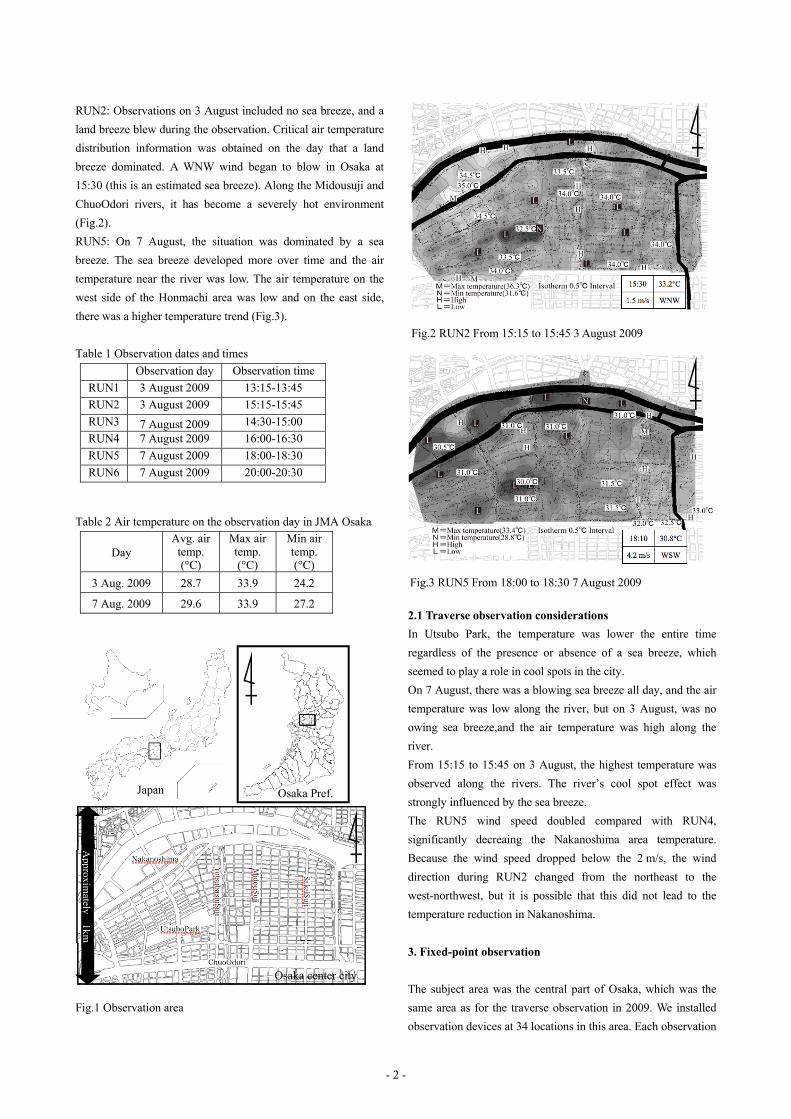
RUN2: Observations on 3 August included no sea breeze, and a
land breeze blew during the observation. Critical air temperature
distribution information was obtained on the day that a land
breeze dominated. A WNW wind began to blow in Osaka at
15:30 (this is an estimated sea breeze). Along the Midousuji and
ChuoOdori rivers, it has become a severely hot environment
(Fig.2).
RUN5: On 7 August, the situation was dominated by a sea
breeze. The sea breeze developed more over time and the air
temperature near the river was low. The air temperature on the
west side of the Honmachi area was low and on the east side,
there was a higher temperature trend (Fig.3).
Table 1 Observation dates and times
Table 2 Air temperature on the observation day in JMA Osaka
Fig.1 Observation area
2.1 Traverse observation considerations
In Utsubo Park, the temperature was lower the entire time
regardless of the presence or absence of a sea breeze, which
seemed to play a role in cool spots in the city.
On 7 August, there was a blowing sea breeze all day, and the air
temperature was low along the river, but on 3 August, was no
owing sea breeze,and the air temperature was high along the
river.
From 15:15 to 15:45 on 3 August, the highest temperature was
observed along the rivers. The river’s cool spot effect was
strongly influenced by the sea breeze.
The RUN5 wind speed doubled compared with RUN4,
significantly decreaing the Nakanoshima area temperature.
Because the wind speed dropped below the 2 m/s, the wind
direction during RUN2 changed from the northeast to the
west-northwest, but it is possible that this did not lead to the
temperature reduction in Nakanoshima.
3. Fixed-point observation
The subject area was the central part of Osaka, which was the
same area as for the traverse observation in 2009. We installed
observation devices at 34 locations in this area. Each observation
Observation day Observation time
RUN1 3 August 2009 13:15-13:45
RUN2 3 August 2009 15:15-15:45
RUN3 7 August 2009 14:30-15:00
RUN4 7 August 2009 16:00-16:30
RUN5 7 August 2009 18:00-18:30
RUN6 7 August 2009 20:00-20:30
Day Avg. air
temp. (°C)
Max air temp. (°C)
Min air temp. (°C)
3 Aug. 2009 28.7 33.9 24.2
7 Aug. 2009 29.6 33.9 27.2
Fig.3 RUN5 From 18:00 to 18:30 7 August 2009
Fig.2 RUN2 From 15:15 to 15:45 3 August 2009
Approxim
ately 1km
Japan Osaka Pref.
Osaka center city
- 3 -
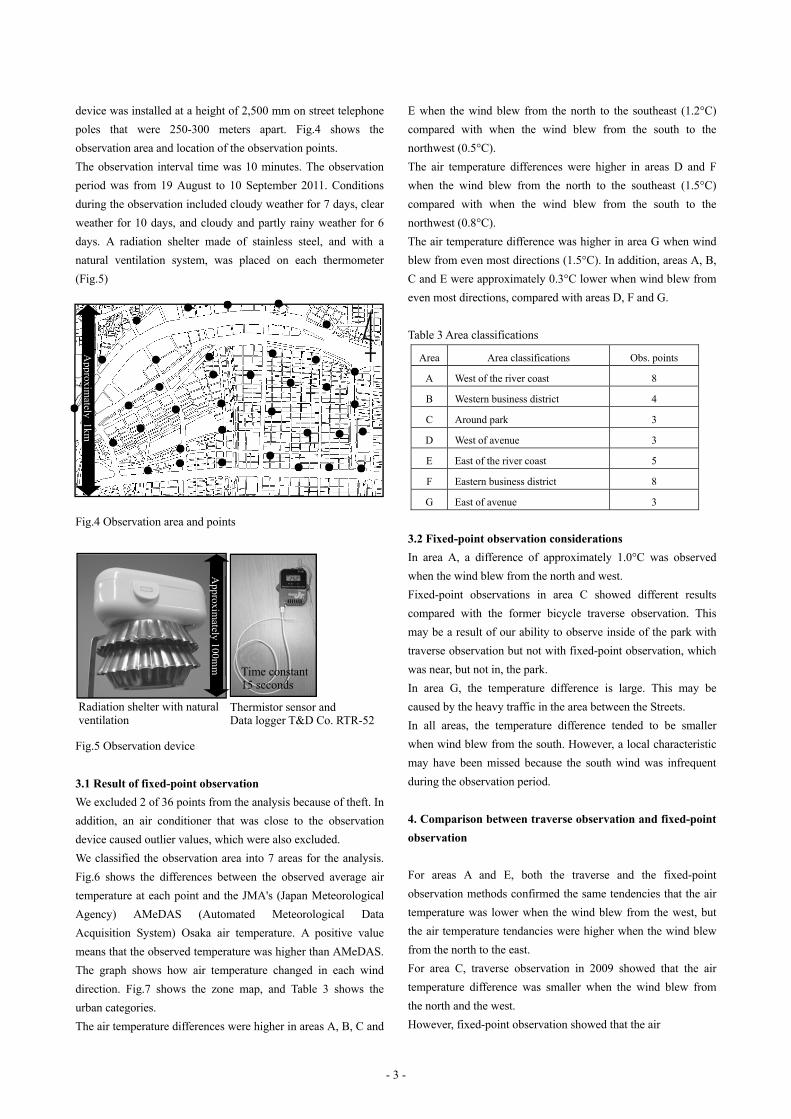
device was installed at a height of 2,500 mm on street telephone
poles that were 250-300 meters apart. Fig.4 shows the
observation area and location of the observation points.
The observation interval time was 10 minutes. The observation
period was from 19 August to 10 September 2011. Conditions
during the observation included cloudy weather for 7 days, clear
weather for 10 days, and cloudy and partly rainy weather for 6
days. A radiation shelter made of stainless steel, and with a
natural ventilation system, was placed on each thermometer
(Fig.5)
Fig.4 Observation area and points
Fig.5 Observation device
3.1 Result of fixed-point observation
We excluded 2 of 36 points from the analysis because of theft. In
addition, an air conditioner that was close to the observation
device caused outlier values, which were also excluded.
We classified the observation area into 7 areas for the analysis.
Fig.6 shows the differences between the observed average air
temperature at each point and the JMA's (Japan Meteorological
Agency) AMeDAS (Automated Meteorological Data
Acquisition System) Osaka air temperature. A positive value
means that the observed temperature was higher than AMeDAS.
The graph shows how air temperature changed in each wind
direction. Fig.7 shows the zone map, and Table 3 shows the
urban categories.
The air temperature differences were higher in areas A, B, C and
E when the wind blew from the north to the southeast (1.2°C)
compared with when the wind blew from the south to the
northwest (0.5°C).
The air temperature differences were higher in areas D and F
when the wind blew from the north to the southeast (1.5°C)
compared with when the wind blew from the south to the
northwest (0.8°C).
The air temperature difference was higher in area G when wind
blew from even most directions (1.5°C). In addition, areas A, B,
C and E were approximately 0.3°C lower when wind blew from
even most directions, compared with areas D, F and G.
Table 3 Area classifications
3.2 Fixed-point observation considerations
In area A, a difference of approximately 1.0°C was observed
when the wind blew from the north and west.
Fixed-point observations in area C showed different results
compared with the former bicycle traverse observation. This
may be a result of our ability to observe inside of the park with
traverse observation but not with fixed-point observation, which
was near, but not in, the park.
In area G, the temperature difference is large. This may be
caused by the heavy traffic in the area between the Streets.
In all areas, the temperature difference tended to be smaller
when wind blew from the south. However, a local characteristic
may have been missed because the south wind was infrequent
during the observation period.
4. Comparison between traverse observation and fixed-point
observation
For areas A and E, both the traverse and the fixed-point
observation methods confirmed the same tendencies that the air
temperature was lower when the wind blew from the west, but
the air temperature tendancies were higher when the wind blew
from the north to the east.
For area C, traverse observation in 2009 showed that the air
temperature difference was smaller when the wind blew from
the north and the west.
However, fixed-point observation showed that the air
Area Area classifications Obs. points
A West of the river coast 8
B Western business district 4
C Around park 3
D West of avenue 3
E East of the river coast 5
F Eastern business district 8
G East of avenue 3
Approxim
ately 1km
Approxim
ately 100mm
Radiation shelter with natural ventilation
Thermistor sensor andData logger T&D Co. RTR-52
Time constant 15 seconds

- 4 -
temperature difference was smaller when the wind blew from
the west, but it was larger when wind blew from the north and
the east. In addition, we could not confirm differences in areas A
and D because the air temperature difference was larger by
approximately 1.2°C when wind blew from the north.
There was no clear influence of the wind direction in area D, as
assessed using either traverse or fixed-point observation.
5. Conclusion
In this study, we performed fixed-point observation to follow up
our former traverse observations that were performed using a
bicycle in the central area of Osaka. Both the traverse and the
fixed-point observations have advantages and disadvantages that
should be determined.
In the test area, the air temperature decreased when the wind
blew from the west. This wind direction corresponds to the
direction of a large local river. The air temperature increased
when wind blew from the north to the east.
Compared with other areas, the air temperature differences in the
business districts were higher and the influence of wind
direction was not clear in these areas.
Our traverse observation in the park showed that temperatures
were lower with any wind direction. However, the fixed-point
observation showed that, even in the park, wind directions had
an influence on temperature, similar to that along the river area.
Fig.6 Relationship wind direction and air temperature difference area A-G Fig.7 Zone map
Area D Area E
Area G
°C
°C °C
°C °C °C
Area A Area B
Area F
°C
Area C

- 5 -
References
(1) K. Masumoto, I. Taniguchi, T. Nomura, Characteristics of
Air Temperature Distribution in 2005 and Situation of Heat
Island in Osaka City, 10 July 2006, Journal of Heat Island
Institute International Vol.1, 30-35 (2006)
(2) Y. Kimura, H. Miyazaki, Urban Heat Island in Summer in
the Northern Part of Osaka, summaries of technical papers
of annual meeting architectural institute of Japan D-1,
895-896 (2009)
(Received Nov. 13, 2014, Accepted Dec. 27, 2014)
Top Related