


Languages
Pages
Legal


Red Line Customer Capacity Update
September 19, 2016
Fiscal & Management Control Board

2
System Capacity
System Reliability
Delivering Service
Delivering Service

3
System Capacity
System Capacity
Operations & Dwell Time
Vehicle Performance
& Signal System
Infrastructure Constraints

4
• Extensive Independent system capacity simulation on Orange and Red Lines conducted, utilizing:
• Actual Service Data and Visual Observations
• Actual Signals and Station Designs
• Vehicle Performance Modeling
• Specific Improvement Initiatives
Capacity Analysis

5
• Current Maximum Design Capacity • 13 Trains per hour Red Line or • 20,280 Customers Per Hour
Analysis Results
• Fixed Constraints: • Distance Between Stations• Civil Design (curves, etc.)
• Manageable Constraints: • Vehicle Performance• Dwell Times

6
• Additional simulations measured impact of capacity improvement initiatives, including:
• Benefits of the new Red Line vehicles with modest signal system changes – assuming replacement of No. 3 cars
• Reduction in Dwell Time
• Communication Based Train Control (CBTC)
Possible Capacity Improvement Initiatives
7
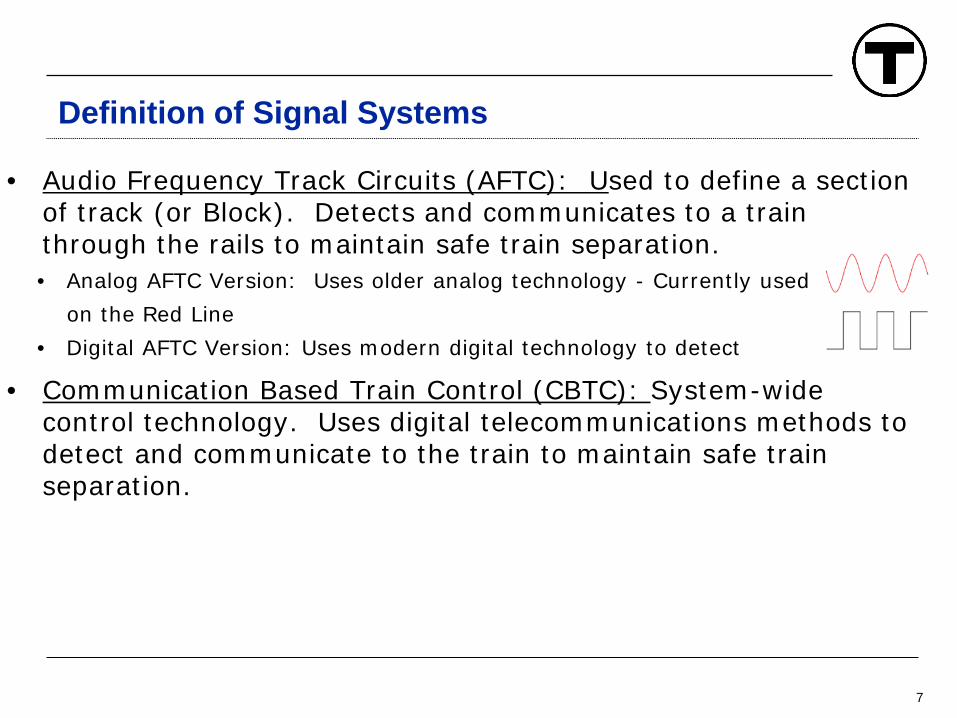
• Audio Frequency Track Circuits (AFTC): Used to define a section of track (or Block). Detects and communicates to a train through the rails to maintain safe train separation. • Analog AFTC Version: Uses older analog technology - Currently used
on the Red Line• Digital AFTC Version: Uses modern digital technology to detect
• Communication Based Train Control (CBTC): System-wide control technology. Uses digital telecommunications methods to detect and communicate to the train to maintain safe train separation.
Definition of Signal Systems
8
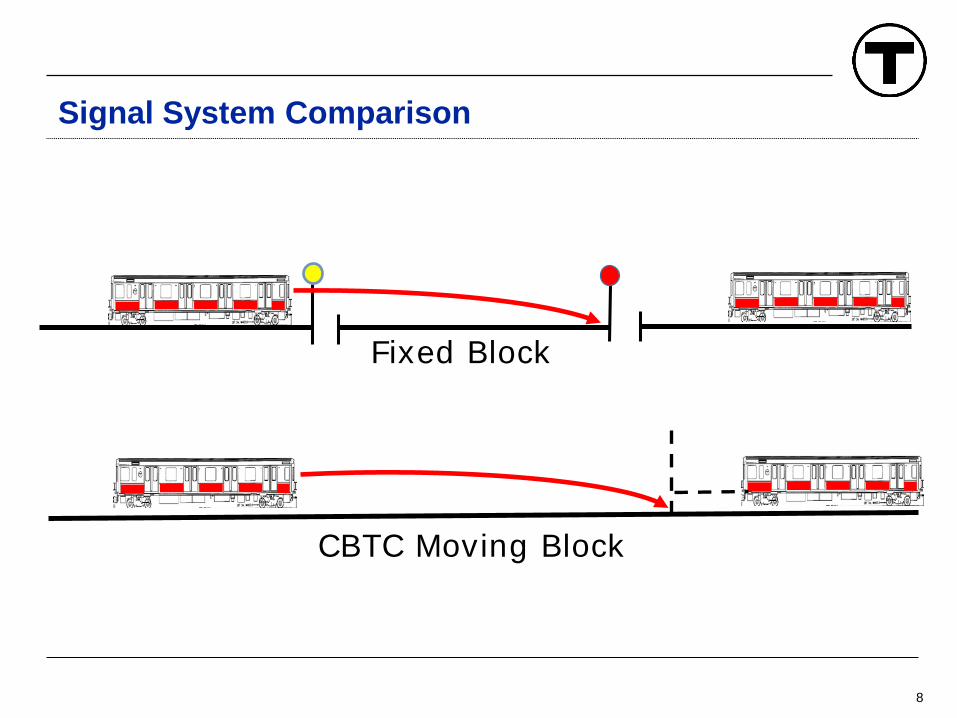
Signal System Comparison
CBTC Moving Block
Fixed Block

9
• Braking distance calculations yield the maximum distance needed to stop at a given speed
• This distance defines the distance that must be maintained at all times between trains
Key Role of Braking Distance

10
• Current Red Line signals are based on the braking calculations of the older No. 3 car
• New Red Line No. 4 Car • Advanced Propulsion System • Improved Trigger for Vehicle Signal Controller • Improved Braking Control Technology
New Red Line Car Improvements

11
• New No. 4 Cars reduce braking calculation distance by 30 percent compared to current cars
0
5
10
15
20
25
30
0 100 200 300 400 500 600 700 800 900 1000
Spee
d (M
PH)
Distance (ft.)
Red Line No. 3
Red Line No. 4
311 ft.
New Red Line Car Improvements

12
New Red Line Car Improvements
0
5
10
15
20
25
30
0 100 200 300 400 500 600 700 800 900 1000
Spee
d (M
PH)
Distance (ft.)
Red Line No. 3
Red Line No. 4
• New No. 4 cars will run faster for longer
311 ft.

13
• With the new vehicles’ performance, minor speed code changes and replacement of the No. 3 cars, Red Line theoretical maximum capacity increases from 13 to 20 trains per hour
• 50% increase in customers carried per hour
New Vehicles Could Increase Capacity by 50 Percent

14
Red Line Simulation Results Existing vs. Expected New Car

15
• A detailed analysis assuming a moving block CBTC system on the Red Line was completed
• Analysis found that a CBTC system would produce an improvement of just one train per hour beyond the improvement from the new cars and minor system changes
• Major Red Line capacity improvements can be achieved without implementing very costly CBTC
• Long dwell times in the downtown area and close spacing of stations limit CBTC as much as they limit fixed block systems
Analysis of CBTC Analysis

16
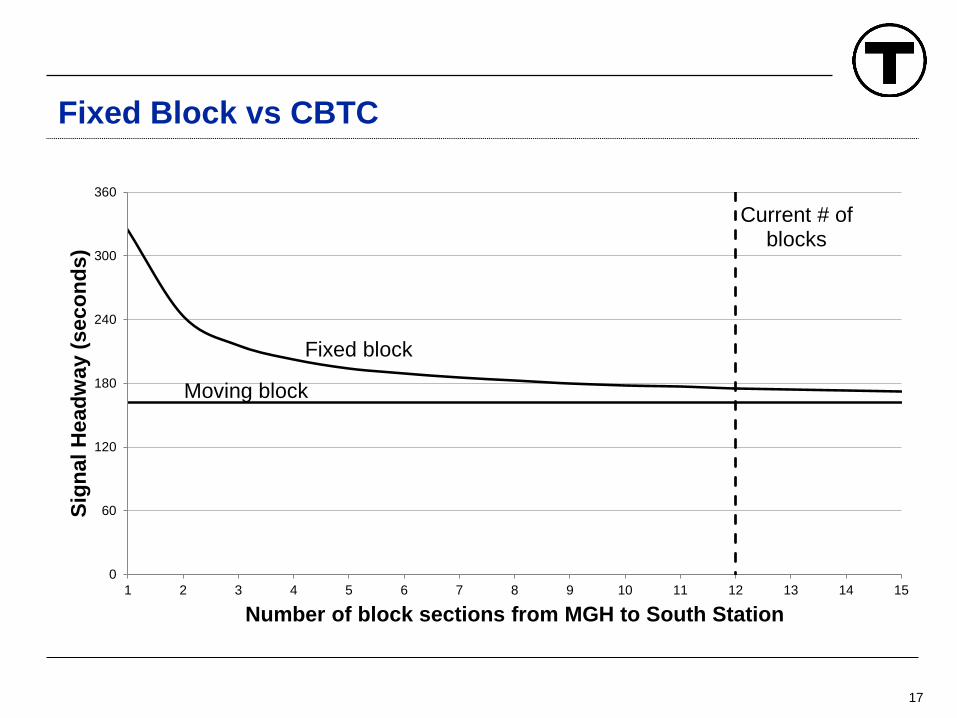
• The shorter the block length, the closer the system is to the ideal CBTC (moving block) braking distance
• MBTA block lengths in the central subway already average less than 500 feet (6 car trains are 416 feet long)
Minimal CBTC Impact Explained
17
Fixed block
Moving block
Current # of blocks
0
60
120
180
240
300
360
1 2 3 4 5 6 7 8 9 10 11 12 13 14 15
Sign
al H
eadw
ay (s
econ
ds)
Number of block sections from MGH to South Station
Fixed Block vs CBTC

18
• Station dwell times limit capacity
• Dwell times most limiting to capacity occur at:• Downtown Crossing• Park Street• State Street
• Improving dwell time could enable capacity increase of 15-20%
Dwell Time
Red Line
Orange Line

19
• Future of the Red Line No. 3 Car• Red Line Fleet Size• Signal and Power Infrastructure Investments • Future Presentation
• Dwell Time Customer Campaign
Key Future Decisions

20
Thank you

21
• Trains per Hour (TPH): A unit we use in our simulations to represent the number of six car trains that travel a given section of our line.
• Max or Maximum Capacity: The theoretical number of TPH that can travel a given section of our system based on defined constraints.
• Crush Capacity: Measured in TPH and it represents the max capacity achievable while simultaneously not causing exponentially increasing delays behind each train. Assumes some trains are stopped for short periods between stations and it more closely resembles actual operation.
• Defined Constraints: The variables used to calculate capacity.• Stopping Distance: The calculated distance a train needs to come to a complete stop
• Dwell Time: The time a train is stopped at a given location
• Signal Block Length: The physical length of a given section of signal system with a red light entry control.
• Speed Code: Speed Limit issued by the wayside Train Control System
• Fixed Constraints: Those variables that require significant effort to change (station spacing, signal system, actual vehicle performance)
• Manageable constraints: Those variables that are more easily changed (dwell time, speed codes, signal block length)
Terms and Definitions

22
• Customer Capacity: A calculation that estimates the maximum number of passengers a car or train can carry.
• 6 car Red Line Train = 1,560 customers (6x260)
• 13 TPH= 20,280 customer per hour • 20 TPH = 31,200 customer per hour (53.85% difference)
• 6 car Orange Line Train = 1,230 customers (6x205) • 10 TPH = 12,300• 13 TPH = 15,990
Terms and Definitions