


Languages
Pages
Legal


7AD-R48 659 FT- JR/P STUDY OF QUINOLINE ADSORBED ON CALCINED
AND i/ISULFIDED MO/GAPIMA-AL..(U) UTAH UNIV SALT LAKE CITY DEPTOF CHEMISTRY 5 BANDYOPADHYAV ET AL. 28 NOV 84 TR-35
UNCLASSIFIED N@@@14-83-K-8478 F/G 7/3 N
EUhhAhEE h

13
1.25 11.
MICROCOPY RESOLUTION TEST CHARTNATIONAL BUREAU OF STANDARDS-1963-A
-... , .. ., .. ,.-. ... .-. , .. ,. . .. . . . . ,.. .. . . . . . .

L, - " . :.'
OFFICE OF NAVAL RESEARCH
Contract N00014-83-K-0470
0) Task No. NR 359-718
TECHNICAL REPORT NO. 35
FT-IR/PA Study of Quinoline Adsorbed on Calcined*II and Sulfided Mo/y-Al203
By
Saibal BandyopadhyayF. E. MassothStanley Pons
Edward M. Eyring
Prepared for Publication in
J. Phys. Chem.
University of Utah~~~~Department of Chemistry "-
Salt Lake City, Utah 84112 L- C 2 19)
November 28, 1984
* Reproduction in whole or.in part is permitted forany purpose of the United States Government
This document has been approved for public release* and sale; its distribution is unlimited.
84 12 12 044

%.ECUNIIV CLAS.ItICA110O OF TNIS PAGE (Wh~en .t .at ofep7#) __________________
REPORT DOCUMENTATION PAGE IIC ADINSTrUCPLTING FORM3. k~POR NUMtN 2. COVT ACCESSION 140. 3. S4LCIPII.,4 rsi CATALOG FiUMtHk.R
4. 1gL~ (~d S.bt~tpJS. TYPE OF REPORT A PERIOD COVEREDO
FT-IR/PA Study of Quinoline Adsorbed on Calcined Technical Reportg1 35and Sulfided Mo/Y-Al 203. RORNGOG
7AUTDON(s) 11. CONTRACT 0OR GRANT NUM3ER(s)
Saibal Bandyopadhyay; F. E. Massoth; Stanley Ponsand Edward M. Eyring 110001 4-83-K-0470
9. PERFORMING ORGANIZATION NAME AND ADDRESS SO. PROGRAM ELEMENT. PAOJECT, TASKARE^A & WORKI UNIT NUMLIERS
University of UtahDepartment of Chemistry Task No..,NR 359-718Salt Lake Ciy,UT_ .84112_______________
IS- CONTROLLING OFFICE NAME AND ADDRESS 12. REPORT DATE
Office of Naval Research November 28, 1984Chemistry Program - Chemistry Code 472 -B"OPAEArlington, Virginia 22217 23-
4.MCNITORe~oG AGENCY NAME & ADORESSfil differnt 1,01" Controlling Ollc) IS. SECURITY CLASS, (of this t.perlj___________________________________fUncl as s if ied15. ECL ASSIFICATIOI4DOWNQGRAOINGSCHEDULE
16. LIST RIaUTlON STATEMENT (of thix Report)
This document has been approved for public release and sale; its distributionunlimited.
17. DISTRIBUTION STATEMENT (of the abstract entored in Block 20. It different front Report)
10. SUPPLEMENTARY NOTES
It. KEY WORDS (Continue on lrseie 1. Inoc...ery and identify by block num ber)
uinolime, Photoacoustic spectroscopy
Z0. A 97T RAC T (Contin~ue ont ws.,.el i Itectisso? and Identify by block number)
Photoacoustic infrared spectra of quinoline adsorbed on y-alumina and dn oxide andsulfided forms of Mo/y-Al 0 are reported. In agreement with prior studies withpyridine, both Lewis and Wrnsted acidic sites are detected on the oxide catalyst,but only Lewis sites are observed on the sulfided catalyst. Certain surface hydrox 1groups and some Lewis site A13+ anionic vacancies appear to participate cooperative'y
* in the binding of quinoline to the sulfided Mo/y-Al,0 3 surface. A precursor tocarbonlum ions that does not involved a Br~nsted acid site is postulated.
DD j 1j3473 EoITION oft N OV b. IS ORISOLCYC Unrl assi fied____S/14 0102. 1.1-014- 111101 SECUIIITY CLAV.IPICATION 0; TmtI.I-Z G(%bb.. II.t. tVnIrr.40

FT-IR/PA STUDY OF QUINOLINE ADSORBED ON CALCINED AND SULFIDED Mo/y-A1 203
Accension For S
*JTIS CRA&tDTIC TA3 '--_ .'Salbal Bandyopadhyay, F. E. Massot, + DTIC -A'
Stanley Pons and Edward M. Eyring Justific.-_,ion -
Department of Chemistry ByUniversity of Utah ni. ti/ "
Salt Lake City, UT 84112 Ava ii Coes .
Oaks I
W Dist Special
+Department Cf Fuels Engineering, University of Utah, Salt Lake City, UT 84112 p
*To whom correspondence should be addressed
/ I ABSTRACT- -
Photoacoustic infrared spectra of quinoline adsorbed on alumina and on
oxide and sulfided forms of M are reported. In agreement with prior 9..
studies with pyridine, both Lewis and Bronsted acidic sites are detected on
the oxide catalyst, but only Lewis sites are observed on the sulfided
catalyst. Certain surface hydroxyl groups and some Lewis site Al3 anionic
vacancies appear to participate cooperatively in the binding of quinolilne to
the sulfided M/y-- 20 3 surface. A precursor to carbonium ions that does not
involve a Brtnsted acid site is postulated.Potuatdj:.:-::3 :
.- 9 ';
* *. . . . . . . . . . . . . . . . . . . . ,

Introduction
The study of catalytic hydrodenitrogenation (HDN) of nitrogen containing
polyaromatic heterocycles found in fuels derived from oil shale, coal or low
grade petroleum is of continuing interest. 4action network studies of HDN
have been carried out over sulfided molybdena catalysts by a number of
investigators1 "6 using quinoline as the model compound. The presence of both
a heterocyclic ring and a benzene ring in quinoline makes its reaction pattern
representative of the benzenoid derivatives of pyridine. These studies have
shown that hydrodenitrogenation proceeds via hydrogenation of either or both
rings in the qulnoline followed by hydrogenolysis of C-N bonds first to open
the hetero-ring and subsequently to convert the resulting aliphatic amine
intermediates to hydrocarbon and ammonia.
The simultaneous presence of organosulfur compounds and organonitrogen
compounds under industrial conditions results In the formation of H2S by
hydrodesulfurization of the former during HON. Studies of the effect of H2 S on
HDN by Satterfield and Gultekin' have shown that the presence of H2S has a
slight inhibiting effect on the intermediate hydrogenation steps involved in
the overall HDN of quinoline but a marked accelerating effect on the
hydrogenolysis step. The latter effect has led Yang and Satterfield8 to
propose that the active site for C-N bond cleavage involves a Brinsted acid
site. Massoth and Muralidhar9 have reviewed other evidence for the possible
presence of Brdnsted sites on sulfided hydrotreating catalysts. It should be
pointed out that these studies can only imply the presence of Bronsted acid .
sites by comparisons with well known carbonium ion reaction mechanisms, but do
not prove their existence. Results of studles 10 -16 on the surface acidity
ot Y-alumina and Mo/y-A1 203 both in the oxide and sulfided state may be
summarized as follows: 1) v-Alumina has only Lewis acid sites both in the
2
" " ","",'i' ." - , %* '" "" """""" .' % *.""''"." . . , ... " .,**** ** .." . *. . .. . ..' . .. -. . . . . . .'..- ......-.-..-... .. ..- -.. '
- ' ' " " -" ' ' ' '"-" " -" ' ' "" ' "--.'-" - ,=" ",".- ,- " :-',--,-:.-:: ",:L ,.":-'" - ".-' .' _''; .,'.,''C .. '..'-,'-.' .'-_' T'-'.- -.

oxide and sulfided state; 2) Both Lewis and Br~nsted acid sites are present
on calcined Mo/A1203; and 3) Sulflded Mo/Al 203 has only Lewis acid sites that
can be detected spectrally.
Several infrared studiesl0'11'16 of pyridine adsorbed on sulfided Mo
catalysts have failed to detect the presence of Br~nsted acidity. If present,
its acid strength must be very weak, or it may develop under hydroprocessing
conditions. Since quinoline adsorbs more strongly than pyridine on these
catalysts, 17 It was thought that perhaps the Br~nsted acidity could be
* detected by use of quinoline as a probe. No infrared studies have been
* reported for quinoline adsorbed on calcined (oxide) or sulfided molybdenum
catalysts.
* The FT-IR/PA technique is well suited for the spectroscopic examination
* of probe molecules chemisorbed on optically opaque, supported metal catalyst
samples and has been described elsewhere.18 The FT-IR/PA spectra of qulnoline
adsorbed on both calcined and sulfided forms of Y-AI203 and Mo/A1203 were
studied and the infrared transmisison spectra of quinoline hydrochloride and
the quinoline-AlC13 adduct were obtained for the assignment of the bands due
to Lewis and Brdnsted sites on the catalyst surface.
EXPERIMENTAL
The catalyst samples used in this work contained 8% by weight Mo
supported on y-alumina (Ketjen 000 - 1.5 E) having a surface area of 209
M2/g. An incipient wetness technique was used for preparing the catalyst.
The catalysts were precalcined at 50OOC for 12 hours. All sample
pretreatments were carried out in a conventional vacuum line. The oxide
Catalyst was prepared by flowing air (Matheson/breathing quality) over the
catalyst at 4000C for two hours followed by four hours evacuation. The
. . -• - -~ .%% "pV X..M.....i. :.~ x'.. - .- .. ,.-.. -...-.. " -.

sulfided samples were prepared by flowing a 9.71 H2S/H2 gas (Matheson) mixture
over the sample at 400C for two hours followed by four hours evacuation.
The catalysts were exposed to qulnoline (Alfa, 99%) at 1509C for five
hours at - 4 torr after the quinoline was subjected to several freeze-pump- -
thawing cycles to remove any traces of gaseous impurities, and then distilled
through a P205 drying column. After exposure, the catalyst was purged in
flowing helium for 1 hour and then evacuated for 12 hours at 150C to remove
as much physically adsorbed quinoline as possible. The sample was cooled to
room temperature and stored under a positive pressure of helium before it was
transferred to the photoacoustic cell in an inert atmosphere glove box.
The infrared transmission spectra of quinolinium hydrochloride and
f. quinoline-AlCA3 adduct were obtained using a Qualimatic Digilab FT-IR
spectrophotometer. In the former case HC1 gas (Matheson) was bubbled through
a CHCt 3 (Fisher) solution of quinoline. The quinoline-AlCi 3 adduct was
prepared by adding a stoichiometric amount of triply sublimed AlCz3 (Fisher)
to a CHCI 3 solution of quinoline.
-" RESULTS
Quinoline and its Complexes
Infrared spectra in the 1800 cm"I to 1250 cm"1 region of quinoline,
quinoline-AlCl3 adduct and quinolinium hydrochloride are given in Figs la, lb
and 1c respectively. Figures la and lb are practically identical and
therefore one cannot assign Lewis adducts ambiguously. The spectrum of
quinolinlum hydrochloride is sufficiently different (appearance of new bands
at 1637 cm"1 , 1558 cm" 1, 1410 cm"1 and enhancement of the band at 1392 cm"1 )
to make assignment of the Br6nsted bands quite certain. The spectrum of
quinolinium-A1C13 adduct over the entire infrared region (4000 cm"1 to 1800
4..
.... .. . . .. ....... ...... .... .. .

.'P 'F Tc..,w ;P_
--~
cm"1 and 1250 cm"1 to 400 cm"1 regions are not shown here) agrees well with
the data of Luther et al.19
Oxided Catalysts
Figure 2 displays the FT-IR/PA spectrum of calcined y-alumina before
and after exposure to qulnoline. In Fig. 2a, infrared absorptions in the
1620-1350 cm-1 region can be ascribed to the ring stretching modes of
quinollne. 20 The out of plane and in plane deformational C-H modes in the
1350 to 800 cm-1 region are partially (1200 cm"1 to 800 cm-1 ) buried under the
broad Al-0 framework vibration of the A1203 support which is centered around
875 cm 1 and extends from 1050 cm 1 to 600 cm'1. 21
* The well established conclusion that the surface acidity of calcined
--alumina is only attributable to Lewis sites compels one to compare the
spectrum (Fig. 2a) with that of the qulnoltne-AlC13 complex (Fig. 1b) in
assigning the vibrational bands. On comparing these two spectra it is seenp...
that most of the vibrational bands of the quinoline-AlCl3 complex appear in
the spectrum of qulnoline adsorbed on y-alumina with changes in relative
intensity and the expected small frequency shifts arising from the
perturbation by the surface field. 22 However, the difference in infrared
absorption bands in the region 1800 cm"I to 1250 cm-" between quinoline and
quinoline-AlCl3 adduct being slight, the possibility of physical adsorption or
adsorption through some other kind of chemical interaction (hydrogen bonding)
cannot be ruled out.
The bands to be assigned to adsorbed quinoline in the 1650 cm-1 to 1250
cm"1 region are at 1623 cm"1, 1600 cm"1, 1517 cm 1, 1377 cm"1 and 1309 cm 1.
The bands at 1473 cm"1 , 1444 cm"1 and 1406 cm"1 cannot be assigned
unambiguously because several bands in that region, attributable to the O-H
• I°." p 5-
5 p.~i
bending mode of surface hydroxyl groups, are also present in the spectrum of
calcined y-alumina.
In Fig. 2b the series of bands In the region 3070 cm"1 to 2952 cm- 1 are
attributable to the C-H stretching mode of quinoline. The bands in the high -.
frequency end are due to the *-hydrogens and the lower frequency bands are V
attributable to $-hydrogens of quinollne. 23 The bands at 3733 cm- 1, 3674
cm"1 , 3656 cm"1 and 3567 cm-1 in Fig 2c are due to the O-H stretching mode of
the surface hydroxyl groups of the alumina support.24
Figure 2d is the spectrum of blank calcined y-alumina. Sharp bands at
3768 cmu, 3735 cm-l, and 3678 cm-1 and weak shoulders at 3700 cm- 1 and 3657
cm" 1 plus a very broad band centered around 2900 cm- 1 due to hydrogen bonded
surface hydroxyl groups are observed. The positions of the bands are in
general agreement with previous findings.25-27 The remarkable difference in
the hydroxyl stretching region of spectra 2c and 2d is noted, an Indication
that a strong perturbation27 of the surface hydroxyl groups of the support
occurs on adsorption of quinoline. This observation will have important
consequences as will be discussed below.
Figure 3a displays the FT-IR/PA spectrum of quinoline adsorbed on
calcined M/Al 2 93. In addition to the bands attributed to adsorbed quinoline
on alumina (Fig. 2a), new bands are observed at 1696 cm"1, 1642 cm- 1, 1561
cm, 1411 cm- 1 and 1394 cm-1 . The bands at 1517 cm-1 and 1623 on- 1 seem to
be markedly attenuated in intensity.
As mentioned previously, it is well established that Brinsted sites are
present on the Mo/y-A1 203 surface; thus, one of the ways to assign the bands
attributable to Brlnsted acid sites on this surface would be to compare this
spectrum with the spectrum of quinolinium ion (Fig. 1c) and Identify
similarities in the ring vibrations of quinoline in the 1700 cm" - 1350
"-"-"-'"'"'"" " " .... "' "' " "" "'" '" .. * -.. * -"" .... " .'':°" "'." ."L. ,- .", "''" "''

cm"1 region as was done by Parry28 in a pyridine adsorption study. By
comparing the two spectra, Fig. Ic and Fig. 3a, we assign the bands at 1642
cm 1 1561 cm"1, 1411 cm"1 and a distinct shoulder at 1394 cm"1 to quinoline
adsorbed on Brdnsted acid (BQ) sites on the oxide Mo/y-A1203 catalyst. The
appearance of the strong band at 1696 cm"1 is noted. Since a similar band was
not found in the complex quinolinium hydrochloride spectrum (Fig. 1c), we
cannot attribute this band to Lewis or Bronsted sites on the catalyst
surface. Assignment of this band is deferred until later. The change in the
relative intensities of the bands at 1623 cm-1 and 1518 cm-1 compared to that
of Fig. 2a is noted; a possible implication of this will also be discussed.
On incorporation of Mo the hydroxyl region of the spectrum of
Y-alumina snows, (Fig. 3b) the expected changes 29"31, namely the bands at 3733
cm- and 3674 cm"1 are attenuated and replaced by a broad peak. However, the
3567 cm"1 band Is unaffected by incorporation of Mo in the y-alumina support.
The 3070 cm"1 band and the bands around 2950 cm-1 are also relatively
unaffected by addition of Mo.
Sulfided Catalyst
Figure 4.dlsplays the FT-IR/PA spectrum of quinoline adsorbed on
sulfided Mo/Y-A12 03 catalyst. The bands at 1641 cm"1 , 1560 cm-1, 1411 cm" -
and 1394 cm"1 attributed to Bronsted sites on the oxide catalyst (Fig. 3a) are
absent In this case as in previous pyridine adsorption studies. 16 ,32 Other
bands due to adsorbed qulnoline in this region (Fig. 4a) although unshifted in
frequency (with 4 cm"1 resolution) have been altered remarkably in relative
intensities, compared to the oxide state (Fig. 3a). The intensities are
comparable to those found in the y-alumina spectrum (Fig. 2a). The
intensities of the bands at 1623 cm"1 and 1516 cm"1 for the sulfided Mo/A1203
7 o - ,- .

catalyst (Fig. 4a) are mrkedly enhanced compared to the calcined catalyst
(Fig. 3a). This observation is important In Interpreting the results. 0
The broadening of the 1598 cm-1 band and the appearance of a distinct
shoulder at 1365 cm"1 on the 1375 cm 1 band, could be associated with the 1570
on"1 and 1341 cm"1 bands found in infrared studies21,33 of H2S adsorbed on 0
alumina, which we have also observed (spectrum not shown) in the present
study. The 3567 cm-1 band remained unshifted on sulfiding; however, there is
a noticeable broadening of the H-bonded band superimposed on the sharp 3567 S
cm"1 band, indicative of an increase in hydrogen bonding on sulfiding, in line
with previous observations.29
Finally, the strong band at 1696 cm"1 found in the oxide Mo/A1203
catalyst persists (within 4 cm"1 resolution) on the sulfided catalyst. This
observation will have an important bearing on the proposed model of qutnoline
adsorption on the Mo/A1203 catalyst. --
Discussion
Assignment of the 3567 cm 1 band.
As mentioned previously, on comparing Figs. 2c and 2d a remarkable
difference in the O-H stretching region of y-alumina is noticed. The highest
frequency band at 3768 cm"1 is sharply attenuated. The bands at 3674 cm"1
3656 c'-1 and 3733 cm"1 remain relatively unaffected and a strong band peaking
at 3567 cm"1 has appeared in the former.
The appearance of this 3567 cm"1 band may indicate a selective type of
interaction of the quinoline molecule with the 0-H groups largely responsible
for the high frequency 3788 cm"1 band. Kiselev and Uvarov, 27 In their
infrared study of adsorbed benzene on y-alumina have observed a similar
selective shift (110 cm"1) of the high frequency O-H band towards the longer
8 8 ... ... ....,%,,: '%',,.'.'.- '., ..- ,-'.:,.'..'....'...'.".., .- ,-,.:......;.....,...........-.. .... ....... . . . . .. . . . . . ..... .... ... ,. ,

wavelength region. They have attributed this to a specific and selective
Interaction of the benzene molecule with the surface hydroxyl groups
responsible for the high frequency band. Studies of methyl benzenes adsorbed
on a silica surface 34 have shown a shift of - 20% of the high frequency bands
towards longer wavelengths indicating a strong and selective interaction.
This together with the observation that pyridine adsorption on alumina does
not perturb the OH frequencies35,36 leads us to Infer that adsorbed quinoline
on a y-alumina surface, in addition to the possible formation of a Lewis type
adduct through the nitrogen lone pair, interacts (hydrogen bonds) strongly and
selectively with the surface hydroxyl grnups. This occurs through
the f-electron system of the non-nitrogen containing aromatic ring 37-39 (as
observed by an approximately 8$ shift of the high frequency O-H stretching
bands towards the long wavelength region, giving rise to the strong band at
3567 cm"1 on adsorption of quinoline). This type of interaction may be partly
responsible for the observation that quinoline adsorbs more strongly than *' -"
pyridine,17 although the pKa values (pyridine - 5.16 and qulnoline = 4.87)40
indicate that the reverse should be the case if purely acid-base type
interactions are considered on acidic surfaces.
• Assignment of the 1696 cm" ' band.
The strong band at 1696 cm" 1 found in the oxide Mo/A1203 catalyst (Fig.
3a) persists in the sulfided catalyst (Fig. 4a) and is also present as a weak,
somewhat shifted but distinct shoulder (1689 cm"1 ) in the spectrum of
quinoline adsorbed on --alumina (Fig 2a). Because of the absence of any band
In this region in the spectra of both QHCl and the Q-AIC1 3 adduct, this band
cannot be attributed to a simple Br~nsted or a Lewis type adduct of
quinoline. We assign the 1696 cm"1 band from the following considerations.
, -4'. * -".. . . . ..

V-. '
From the correlation chart4 1 of infrared spectroscopy, absorptions In
IIthis region could be due to a -C a N- stretching mode. Fabian et a..4 , in
their review of the -C - N- stretching mode have noted the difficulty in
identifying bands in this region due to considerable change in intensity and
frequency of these absorptions with changing environment. The -C - N-
absorptions in non-conjugated ring systems occur within the 1690-1640 cm1
region. The absorptions in the high frequency end of this region are mainly
due to compounds like oxazines, and oximes (1674 - 1665 cm-1), in which one or
more NH groups are attached to the carbon atom of the C = N link; in guanidine
and related compounds, a variation between 1718 and 1530 cm-1 is found. 4 3
Because of the lack of resemblance between these compounds and quinoline, it
is not logical to assign the 1696 cm- 1 band to a specific structure yet.
However, "...when the nitrogen atom of the C = N bond is so substituted that
it is able to take on a more polar character, the characteristic frequency
alters considerably ...... The direction of frequency shift in such cases
depends in part on the nature of the charge on the nitrogen atom.
In N - C compounds, for example, the frequencies are raised a little above the
normal,....".43 Leonard et al. 44 found that a shift of 10-50 cm- 1 toward
a a a s a ,- .higher frequency is observed in going from -C = C - N- to -CH - C = N .Foy
example, in going from 1-n-butyl-2-methyl- A2-tetrahydro pyridine to its .
perchlorate salt, a shift of 34 cm- 1 is observed giving rise to a band at 1684
cm- . In the case of the perchlorate salt of 1,2-dimethyl- A2-pyroline, a band
at 1699 cm "I is observed. Leonard et al. 44 have assigned these high frequency S
I +bands to -C - NKstretching modes. The closer resemblance of quinoline to
these compounds makes it possible to speculate on slightly better grounds that+
the 1696 cm"1 band is due to the formation of a bond that resembles a -C = N'
species. However, for adsorbed quinoline to give rise to a band at 1696 cm 1,
10
. .. _. . . . .. . .

because of formation of a -C * N, type of bond as assigned above, a mechanism
that causes the loss of conjugation of the ring system must exist. We propose
that the O-H... K-cloud interaction that gives rise to the 3567 cm-1 band
causes the loss of conjugation of quinoline.
As mentioned previously, the bands probably attributable to the N - H
bending modes of quinolinium ion are absent in the spectrum of the sulfided
catalyst. The 1696 cm- band persists with similar intensity as in the oxide
Mo/A1203 catalyst, which rules out the possibility that nitrogen lone pairs
coordinAte with protons giving rise to the 1696 a,"1 band through anI -*-
unconjugated -C a N - H type of species. The most probable situation would be
the coordination of the nitrogen lone pairs to A13+ anionic vacancies, where
the Lewis acidity is enhanced on incorporation of Mo. However, the direct
coordination to Mo anionic vacancies on the surface cannot be ruled out. The
question of lone pair coordination is discussed in greater detail below.
Proposed Models
The evidence presented points strongly to a cooperative phenomenon
operative on the catalyst surface. We propose an interaction involving the
high frequency O-H groups and the Lewis acid sites in the catalyst surface.
It should be mentioned that Knozinger et al. 45 have invoked the concept of
cooperative effects in their IR-study of adsorbed organic molecules on alumina
surfaces.
A crude model that emerges from the results of this study would be as
follows: Quinoline adsorbed on calcined y-alumina interacts with the surface
mainly through a strong 0-H...n-cloud interaction. The IT-electron cloud of
the quinoline ring system interacts (hydrogen bonds) specifically with the
high frequency (3780 cm"1) O-H groups on the alumina surface. This causes a
;" loss of conjugation of the aromatic quinoline. A weak Lewis type adduct is
* .- -. .* *. . . . . . . . . . . .
* - .. . . . . " --- '-*

formed by coordination of the nitrogen lone pairs to A13* anionic vacancies,+ -
resulting in a shoulder at 1696 cm"1 attributable to an unconjugated -C - N---
-Al type of species as assigned above. Chemisorbed quinoline on the
oxide Mo/Y-Al 2 03 surface exists mainly in two forms: Brr,1s~ed type adducts and
a Lewis type adduct which is different from that found on a pure y-alumina S
surface. The Brdnsted adduct is evidenced by the appearance of the bands due
to N-H bending modes present in the spectrum of quinolinium ion. The
appearance of the intense band at 1696 cm- 1 and the sharp attenuation of the I.
bands at 1622 cm"1 and 1518 cm" 1 Is attributed to quinoline adsorbed on a
Lewis site of the y-alumina modified by the presence of Mo in the A12 03
lattice. p
On incorporation of Mo, the Lewis acidity of the A13+ anionic vacancy is
increased, resulting in a strong coordination of the nitrogen lone pairs to
these sites. This almost complete charge transfer from nitrogen together with
the deconjugative effect of the 0-H... f-system interaction forms the+. ."unconjugated -C - N- type of species. The enhancement of the Lewis acidity of
the A13+ ion may be attributable to a combination of electronic and steric
effects.46
The electronic part may be an electron withdrawing inductive effect of Mo
species on an adjacent A13+ ion. This inductive effect could be similar to _-
the one that gives rise to Br~nsted acidity on the *-alumina surface with
incorporation of Mo, an effect that makes the hydroxyl protons more labile.
The steric eftect could be attributed to the presence of Mo, inducing a
certain degree of disorder in the alumina surface. The ions of a disordered
surface may undergo at least a local reorganization under dynamic conditions
(viz. high temperature). Thus, the access and consequent coordination to a
A13+ Ion may be facilitated by a displacement towards the surface. Similar
* .. 1"
reasoning has been presented before to explain the bonding of sterically
hindered 2,6-dimethyl pyridine to Al3 + sites on an alumina surface. 4 6
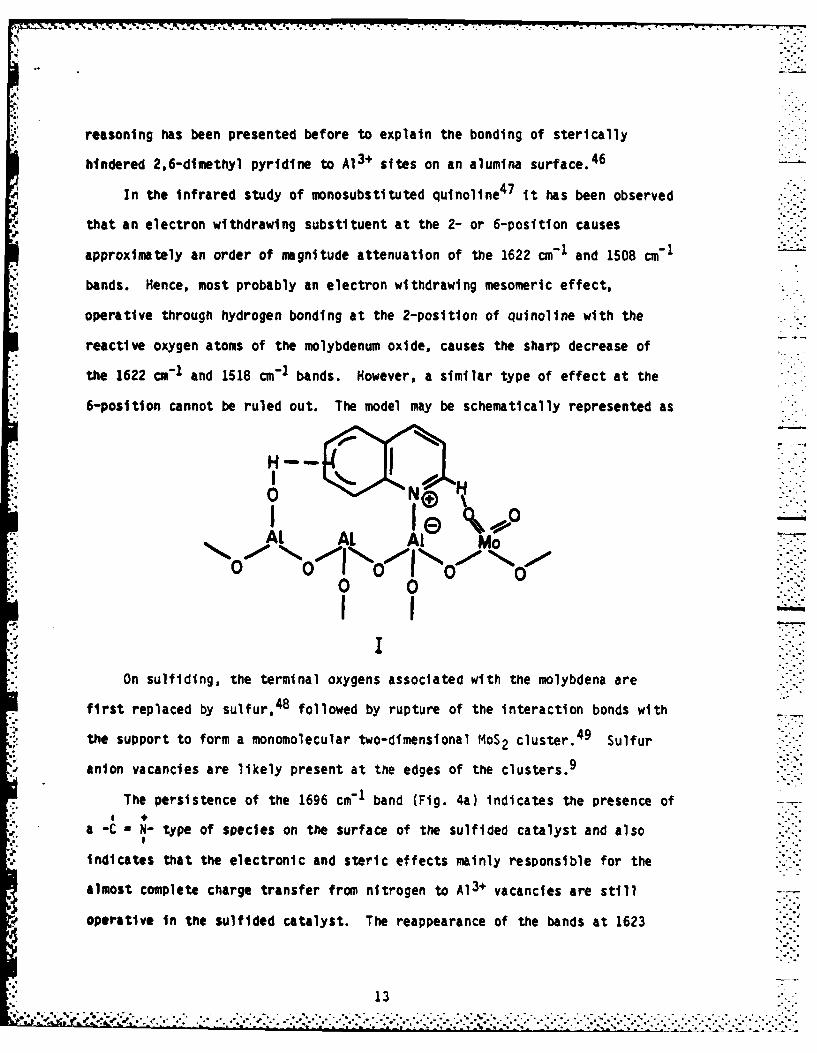
In the infrared study of monosubstituted quinollne4 7 It has been observed
that an electron withdrawing substituent at the 2- or 6-position causes
approximately an order of magnitude attenuation of the 1622 cin" and 1508 cm' 1
bands. Hence, most probably an electron withdrawing mesomeric effect,
operative through hydrogen bonding at the 2-position of quinoline with the
reactive oxygen atoms of the molybdenum oxide, causes the sharp decrease of
the 1622 cn"1 and 1518 cm-1 bands. However, a similar type of effect at the
6-position cannot be ruled out. The model may be schematically represented as
H--
0 N :
IeSAL AL At Mo
o 0"I I ::-01 0
On sulfiding, the terminal oxygens associated with the molybdena are
first replaced by sulfur,48 followed by rupture of the interaction bonds with
the support to form a monomolecular two-dimensional MoS2 cluster.4 Sulfur
anion vacancies are likely present at the edges of the clusters.9
The persistence of the 1696 cm"1 band (Fig. 4a) indicates the presence of
a -C - N- type of species on the surface of the sulfided catalyst and also
indicates that the electronic and steric effects mainly responsible for the
almost complete charge transfer from nitrogen to A13+ vacancies are still
operative in the sulfided catalyst. The reappearance of the bands at 1623
"' 13• ,,o ,% . * , .- . .-. . . .. . . .. °. -.. .S. , ,. ..... -. ..-.. . . . .. . . .. . .. . .- .

cm"1 and 1516 cm" 1 indicates the absence of a strong electron withdrawing
effect at the 2-position of adsorbed quinoline. This may be a consequence of
replacement of the terminal oxygen atoms, associated with molybdena by sulfur
or anionic vacancies. The enhanced intensity of the bands in the 1700 cm- 1 to
1300 cm"1 region (Fig. 4a) compared to the oxide catalyst spectrum (Fig. 3a)
is probably due to the increased acidity5 0 and hence greater adsorption on the
sulfided catalyst. The slight broadening of the 1696 cm- 1 band with the
appearance of a shoulder at 1684 cm"1 may indicate that the environment of the
A13+ ion is altered (i.e. the C = N stretching vibrations are very sensitive
to the environment). However, direct coordination of the nitrogen lone pairs
with No anionic vacancies (generated on sulfiding) cannot be ruled out. .6
A schematic representation of the model for adsorbed quinoline on the
sulfided catalyst is shown below.
NOVlN NO 9-
At AL AP Mo Mo
o o
The symbol 01 denotes an anionic vacancy and the 0/S signifies a partial
attachment of the MoS2 phase to the A1203 surface through an 0 or S atom.
The proposed cooperative effect on the catalyst surface is consistent
with the concept of dual sites involved in the HON of quinoline on sulfided
molybdenum catalysts postulated by Yang and Satterfield. 8 Their postulated
3--

dual sites are sulfur anionic vacancies associated with the molybdenum and
Brlnsted acid sites. The present study suggests a somewhat different picture
of the role and nature of these sites. The absence of infrared spectral
evidence for the Brinsted sites on the sulfided catalyst suggests that
structure 1I above is the precursor to the carbonium ion and the subsequent
cleavage (hydrogenolysis) of the C-N bond. On the sulfided catalyst, the
formation of a carbonium ion at the 2-position of quinoline is facilitated by
the elimination of the reactive oxygens associated with the molybdenum. As
noted above, an electron withdrawing effect is operative through hydrogen
bonding at the 2-position on the oxide catalyst. This is consistent with the
observation that increased sulfiding enhances HDN of quinoline.
1-..
Acknowledgement ..
Financial support of this work by the Department of Energy (Office of
Basic Energy Sciences) is gratefully acknowledged.
I
S -%-,
• ""S
.is::::

. ... .. . . . . . . . . . . . . . ..
References
(1) Shlh, S. S.; Katzer, J. R.; Kwart, H.; Stiles, A. B. Amer. Chem. Soc.,Petrol. Div. Prepr. 1977, 22(3), 919.
(2) Satterfield, C. N.; Modell, M.; Hites, R. A.; Declerk, C. 3. Ind. Eng.Chem. Process Des. Dev. 1978, 17, 141.
(3) Binde, M. V.; Shlh, S.; Zawadski, R.; Katzer, J. R.; Kwart, H. Climax SThird Intern. Conf. on the Chemistry and Uses of Molybenum (H. F. Barryand P. C. H. Mitchell, eds.), Climax Molybdenum Co., Ann Arbor,Michigan, 1979, p. 170.
(4) Cocchetto, 3. F.; Satterfield, C. N. Ind. Eng. Chem. Process Des. Dev. ---A81, 20, 49.
(5) Satterfield, C. N.; Cocchetto, J. F. Ind. Eng. Chem. Process Des. Dev. 2-.1981, 20, 53.
(6) Miller, J. T.; Hineman, M. F. J. Catal. 1984, 85, 117.
(7) Satterfield, C. N.; Gultekin, S.; Ind. Eng. Chem. Process Des. Dev..-1981, 20, 62.
(8) Yang, S. H.; Satterfield, C. N. J. Catal. 1983, 81, 168.
(9) Massoth, F. E.; Muralidhar, G. Proc. Fourth Intern. Conf. Chemistry andUses of Molybdenum, H. F. Harry, P. C. H. Mitchell, Eds., ClimaxMolybdenum Company, Ann Arbor, Michigan, 1982, p. 381.
(10) Mone R. "Preparation of Catalysts", B. Delmon, P. A. Jacobs, and G.
Poncelet, Eds., Elsevier, Amsterdam, The Netherlands, 1982, p. 381.
(11) Ratnasamy, P.; Knozinger, H. J. Catal. 1978, 54, 155.
(12) Knozinger, H.; Ratnasamy, P. Catal. Rev.-Sci. Engn. 1978, 17, 31.
(13) Segawa, K.-I.; Hall, W. K. J. Catal. 1982, 77, 221.
(14) Cheng, C. Ph.D. Dissertation, University of Delaware, 1981.
(15) Segawa, K.-I.; Hall, W. K. J. Catal. 1982, 76, 133.
(16) Rtseman, S. M.; Bandyopadhyay, S.; Massoth, F. E.; Eyring, E. M. AppliedCatalysis, submitted for publication.
(17) Micikiewicz, J.; Zmierczak, W.; Massoth, F. E. paper presented at 8thInt. Cong. Catal., Berlin, 1984.
(18) Riseman, S. M.; Massoth, F. E.; Muralidhar, G.; Eyring, E. M. J. Phys.Chem. 1982, 86, 1760; Riseman, S. M. Ph.D. Dissertation, University otUtah, T1B7.
16-ozo .

(19) Luther, H.; Mootz, D.; Radwltz, F. Journal fur praktische Chemle. 1958,5, 242.
S
(20) Katritzky, A. R. "Physical Methods in Heterocyclic Chemistry", Vol. II,Academic Press, New York, N. Y., 1963, p. 296.
(21) Slager, T. L.; Aznberg, C. H. Can. J. Chem. 1972, 50, 3416.
(22) Kteslev, A. V.; Lygin, V. I. "Infrared Spectra of Surface Compounds", 0John Wiley and Sons, New York, N.Y., 1975.
(23) Wait, S. C. Jr.; McNerney, J. C. J. Mol. Spectrosc., 1970 34, 56.
(24) The bands In the O-H stretching region were not observed In Ref. 18. -This my have been due to a faulty setting of the low pas filter in theFT-IR spectrometer.
(25) Per, 3. B. 3. Phys. Chem. 1965, 69, 211.
(26) Hall, W. K. Acc. Chem. Res. 1975, 8, 257.
(27) Kiselev, A. V.; Uvarov, A. V. Surf. Set. 1967, 6, 399.
(28) Parry, E. P. J. Catal. 1963, 2, 371.
(29) Topsoe, N. 3. Catal. 1980, 64, 235. iL--(30) Fransen, T.; Van der Meer, 0.; Mars, P. 3. Catal. 1976, 42, 79.
(31) Ratnasamy, P.; Knozinger, H. J. Catal. 1978, 54, 155.
(32) Valyon, 3.; Schneider, R. L.; Hall, W. K. 3. Catal. 1984, 85, 277.
(33) Deo, A. V.; Dalla Lana, I. G.; Habgood, H. W. J. Catal. 1971, 21, 270.
(34) Basila, M. R. 3. Chem. Phys. 1961, 35, 1151.
(35) Parry, E. P. 3. Catal., 1963, 2, 371; Basila, M. R.; Kantner, T. R.;Rhee, K. H. 3. Phys. Chem.-- 96l, 68, 3197; Basila, M. R.; Kantner, T. R.3. Phys. Chem. 1967, 71, 467,-
(36) Jezlorowki, H.; Knozinger, H.; Meye, W.; Muller, H. D. J. Chem. Soc.,Faraday Trans. I 1973, 69, 1744.
(37) Little, L. H. "Infrared Spectra of Absorbed Species," Academic Press,London, 1966.
(38) Kiselev, A. V.; Lygin, V. I. Usp. Khim, 1962, 31, 351.
(39) Kiselev, A. V. Discussions Faraday Soc. 1965, 40, 205.
(40) Alber, A. "Physical Methods in Heterocyclic Chemistry", Vol. 1, A. R.Katrttzky, ed., Academic Press, New York, N. Y., 1963, p. 65.
17

(41) Bellamy, L. J. "Infrared Spectra of Complex Molecules", John Wiley andSons, Inc., New York, N. Y., 1958.
(42) Fabian, 3.; Legrand, N.; Poirier, P. Bull Soc. Chim. France., 1956,1499.
(43) Pgs. 268-270 of Ref. 41.
(44) Leonard, N. J.; Gash, V. W. J. Am. Chem. Soc. 1954, 76, 2781; Leonard,SN. J.; Thomas, P. D.; Gash, V. W. ibid 1955, 777T5sy7
(45) Knozinger, H.; Kriestenbring, H.; Muller, H. D.; Schulz, W. "Proceedingsof the Sixth International Congress on Catalysis, G. C. Bond, P. B.Wells, and F. C. Tompkins, Eds., The Chemical Society, London, 1976, 1, -
183.
(46) Knozinger, HI.; Krietenbrink, H.; Ratnasamy, P. J. Catal. 1977, 48, 436.
(47) Katritzky, A. R.; Jones, R. A. J. Chem. Soc. 1960, 2942.
(48) Massoth, F. E. J. Catal. 1975, 36, 164.
(49) Clausen, B.S.; Topsie, H.; Candla, R.; Villadsen, J.; Lengeler, B.; Als-Nielsen, J.; Christensen, F. J. Phys. Chem,. 1981, 85, 3868.
(50) Ratnasamy, P.; Ramaswamy, A. V.; Sivasanker, S. .J. Catal. 1980, 61, 519.
a
18

Figure Captions
1. FT-JR transmission spectra of the following solutions (a)
I quinoline/CHCl 3 (b) quinoline/AlCl 3/CHC1 3 and (c) quinoline/HCI/CHC13
2. (a), (b) and (c) are different regions of the FT-IR/PA spectrum of
quinoline adsorbed on calcined -f-alumina. (d) FT-JR/PA spectrum of blank
S calcined Y-alumlna. The ordinate represents normalized photoacoustic
7: response. Each region of the spectra (a), (b), (c) and (d) is
Individually autoscaled.
3. (a) and (b) are different regions of the FT-JR/PA spectrum of quinoline
adsorbed on calcined Holy-alumina. The ordinate represents normalized
photoacoustic response and (a) and (b) are individually autoscaled.
4. (a) and (b) are different regions of the FT-JR/PA spectrum of quinoline
adsorbed on sulfided Mo/y-alumina. The ordinate represents normalized
photoacoustic response. (a) and (b) are individually autoscaled.

100-
50-
IVY
0-1
oonp.
0'4600 I 00 55
500-
(b)o0a100 5
zuwn

6021
90-191
0091 __ _ _ _
£891
0
aC)
L96E L86Z
0<
Ln
L992 -
02
L99
tQ~r, L92 w9992

9020
0 c
16tp1 I0t'
991-00910
Zt,90
0
066Z ___OLOQ 0NW
0 zCD W
-oD-~ 0

9021
0
9191 C,,
891
OL02 0
N
a~LaJH>L99
IiOD

14 )
FILMED
1-85
DTIC
Top Related