


Languages
Pages
Legal


Queens College Online Course Evaluation PilotReport of Results: April 2, 2009
Teaching Excellence and Evaluation Committee-Susan Croll, Chair -Chantal Bruno, student-Claudia Perry -Jill Frohmann, student-Kimberley Alkins -Alison Ratner, student-Kate Pechenkina
Ex Officio: Steve Schwarz, Meg McAuliffeGuests/Contributors: Dean Savage, Eva Fernandez

Reasons for move to online evaluations• Financial: online evaluations would be substantially
less expensive – an important consideration during this economic crisis
• Environmental: online evaluations are more in-line with Queens College’s “Green” initiatives than paper and pencil surveys
• Access: 30% of all courses never distribute their evaluation forms – therefore, not all students get equal access to evaluation opportunities

Issues of concern
•Response rates are generally lower with online evaluations – we hoped for 30-35% rate
•No assurance that the distribution and spread of scores would be similar for online evaluations
•No assurance that the mean scores would be similar for online evaluations
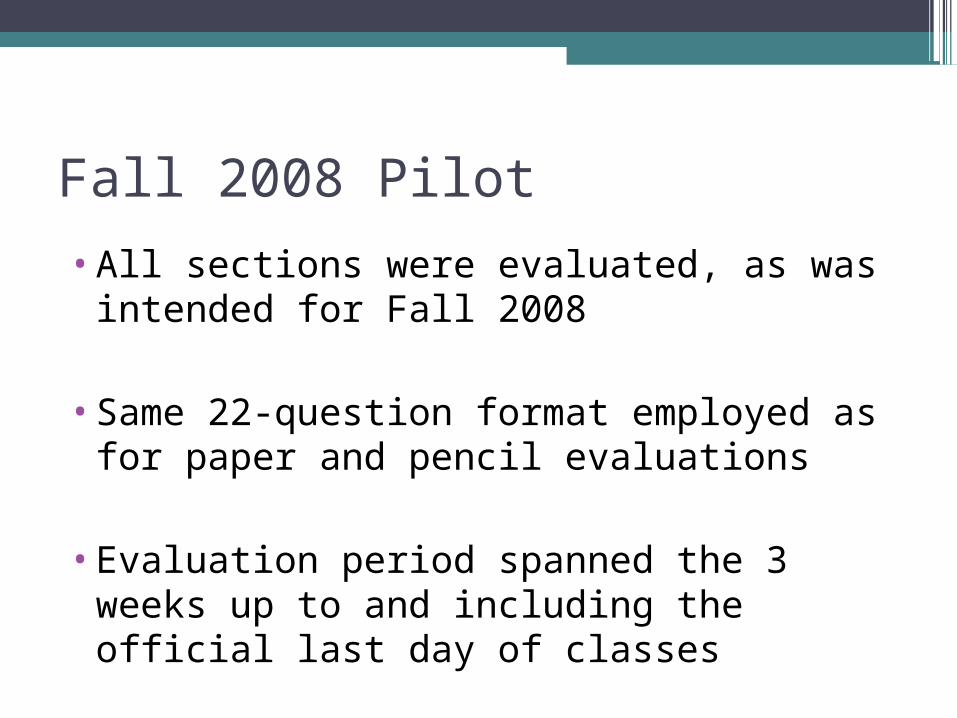
Fall 2008 Pilot
•All sections were evaluated, as was intended for Fall 2008
•Same 22-question format employed as for paper and pencil evaluations
•Evaluation period spanned the 3 weeks up to and including the official last day of classes

Solicitation of Student Responses• Initial e-mail sent to all students with link to their
evaluation page via LotusNotes and alternate e-mail address provided by students – reminder sent
• Posters placed around campus – refreshed twice
• Announcements appeared on the QC home page and on the plasma boards
• E-mails were sent to Chairs and faculty asking faculty to urge students to participate

Incentives• 83 prizes were available via lottery for all students who
submitted evaluations (i-pods, parking passes, bookstore & food gift certificates)
• Student Association publicity encouraged a “culture of responsibility”
• RULED OUT: receipt of grades contingent on submission of evaluation (results in close to 100% response rate, eg. UCLA Medical School; Murphy, 2004)
• RULED OUT: course-related incentives (eg. UC-Irvine; Murphy, 2004)
Online Evaluation Pilot ResultsQueens College, Fall 2008
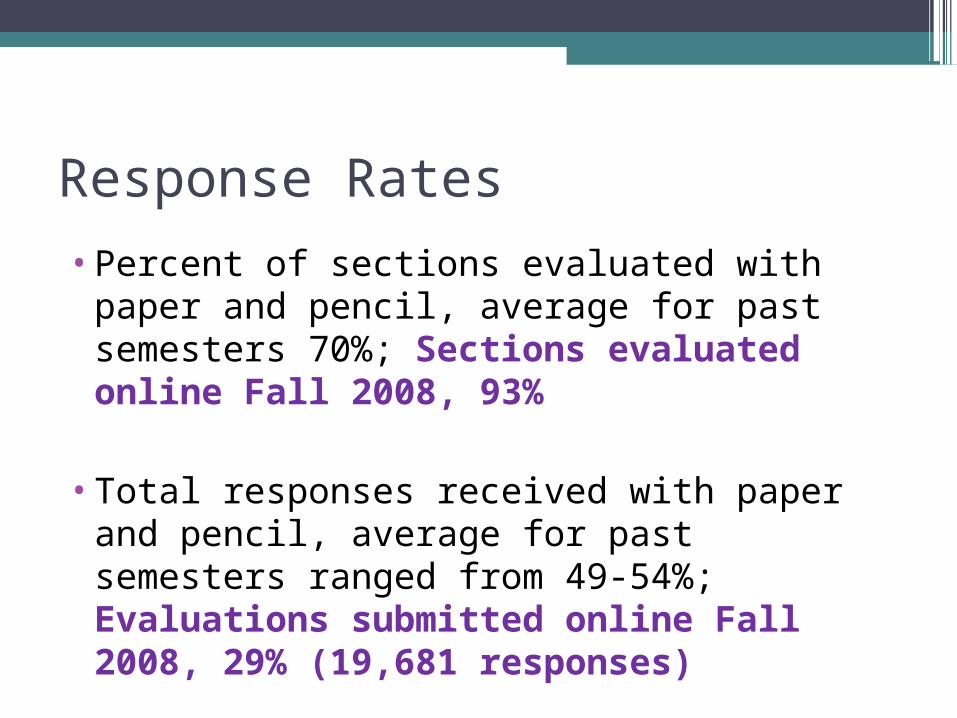
Response Rates
•Percent of sections evaluated with paper and pencil, average for past semesters 70%; Sections evaluated online Fall 2008, 93%
•Total responses received with paper and pencil, average for past semesters ranged from 49-54%; Evaluations submitted online Fall 2008, 29% (19,681 responses)

Response rates varied by department, some met paper response ratesDepartment/Program
# responses #enrolled % responses
Honors
96
125 77
Environmental Science
358
497 72
Physics
318
447 71
Biology
926
1474 63
Library & Information Science
524
977 54
Biochem
1
2 50
ECP-Counselor Education
151
305 50
Chemistry
519
1051 49
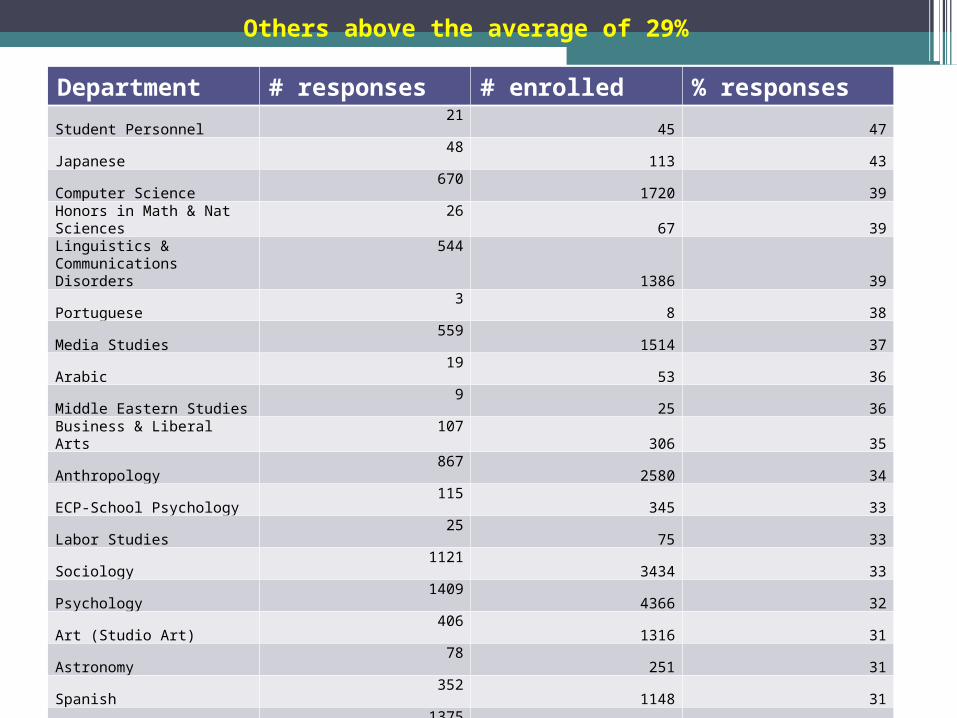
Department # responses # enrolled % responses
Student Personnel21
45 47
Japanese48
113 43
Computer Science670
1720 39Honors in Math & Nat Sciences
2667 39
Linguistics & Communications Disorders
5441386 39
Portuguese3
8 38
Media Studies559
1514 37
Arabic19
53 36
Middle Eastern Studies9
25 36
Business & Liberal Arts107
306 35
Anthropology867
2580 34
ECP-School Psychology115
345 33
Labor Studies25
75 33
Sociology1121
3434 33
Psychology1409
4366 32
Art (Studio Art)406
1316 31
Astronomy78
251 31
Spanish352
1148 31
English1375
4567 30
Others above the average of 29%

Anecdotal Questioning of High-Response Departments
•Faculty strongly encouraged by Chair or other “Champion” to advertise the evaluations in class
•Students told WHY it was important to participate in the evaluations (why it helps them, why it helps faculty)
•UCSF increased response rates via student education (Murphy, 2004)
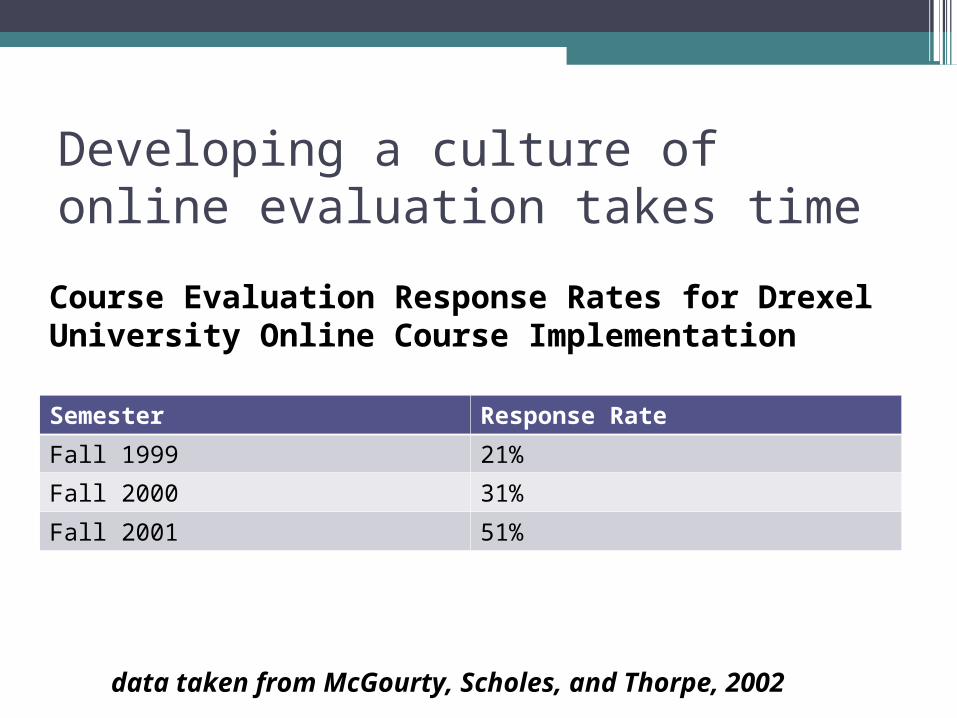
Developing a culture of online evaluation takes time
Semester Response Rate
Fall 1999 21%
Fall 2000 31%
Fall 2001 51%
Course Evaluation Response Rates for Drexel University Online Course Implementation
data taken from McGourty, Scholes, and Thorpe, 2002

Mean Scores – Fall 2008 Pilot

Question S 01 F 02 S 04 F 05 S 07 F 08Q1 Requirements clear 4.30 4.42 4.46 4.39 4.43Q2 Presentations clear 4.33 4.31 4.37 4.29 4.33Q3 Good English 4.58 4.59 4.6 4.57 4.57Q4 Enthusiastic 4.54 4.53 4.56 4.49 4.53Q5 Exams clear 4.33 4.30 4.37 4.31 4.19Q6 Comments useful 4.27 4.26 4.29 4.24 4.21Q7 Work returned in reasonable time
4.41 4.41 4.41 4.42 4.32
Q8 Reading valuable 4.23 4.26 4.28 4.24 4.17Q9 Other assignments valuable
4.23 4.24 4.26 4.22 4.21
Q10 Respectful of students 4.52 4.53 4.53 4.54 4.56Q11 Concerned about progress
4.36 4.35 4.34 4.33 4.36
Q12 Available outside class 4.25 4.23 4.27 4.26 4.30Q13 Encourages questions 4.43 4.46 4.47 4.44 4.46Q14 Learned a great deal 4.28 4.29 4.29 4.23 4.27Q15 Enjoyed course 4.17 4.16 4.17 4.11 4.14Q16 Difficulty of course 2.58 2.61 2.57 2.58 2.67
MEAN SCORES

Question S 01 F 02 S 04 F 05 S 07 F 08Q1 Requirements clear 4.30 4.42 4.46 4.39 4.43 4.22Q2 Presentations clear 4.33 4.31 4.37 4.29 4.33 4.05Q3 Good English 4.58 4.59 4.6 4.57 4.57 4.40Q4 Enthusiastic 4.54 4.53 4.56 4.49 4.53 4.36Q5 Exams clear 4.33 4.30 4.37 4.31 4.19 3.88Q6 Comments useful 4.27 4.26 4.29 4.24 4.21 3.92Q7 Work returned in reasonable time
4.41 4.41 4.41 4.42 4.32 4.05
Q8 Reading valuable 4.23 4.26 4.28 4.24 4.17 3.92Q9 Other assignments valuable
4.23 4.24 4.26 4.22 4.21 3.95
Q10 Respectful of students 4.52 4.53 4.53 4.54 4.56 4.36Q11 Concerned about progress
4.36 4.35 4.34 4.33 4.36 4.13
Q12 Available outside class 4.25 4.23 4.27 4.26 4.30 4.06Q13 Encourages questions 4.43 4.46 4.47 4.44 4.46 4.28Q14 Learned a great deal 4.28 4.29 4.29 4.23 4.27 4.03Q15 Enjoyed course 4.17 4.16 4.17 4.11 4.14 3.89Q16 Difficulty of course 2.58 2.61 2.57 2.58 2.67 2.77
MEAN SCORES

Means & Standard Deviations
Question Number
21 43 5 14 157 8 9 10 11 12 136

Narrowing down reasons…
•Could the decrease in scores be due to the inclusion of the 30% of courses never evaluated before (i.e. could those be the courses students dislike most?)
•To investigate: Conduct an analysis of all courses taught by the same instructor in last two full evaluation periods:▫SPRING 2007 versus FALL 2008

Spring 2007 vs. Fall 2008 Repeat Course/Instructor Combinations

Spring 2007 vs. Fall 2008 Repeat Course/Instructor Combinations
CONTROL FOR NON-SELECTIVERESPONSE BIAS
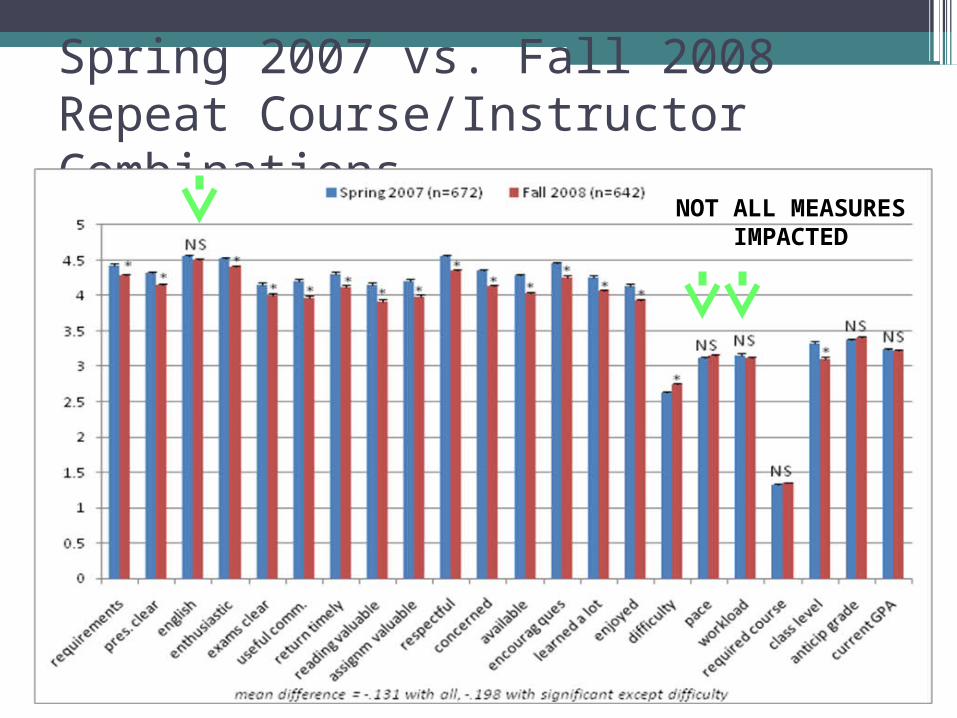
Spring 2007 vs. Fall 2008 Repeat Course/Instructor Combinations
NOT ALL MEASURESIMPACTED

Spring 2007 vs. Fall 2008 Repeat Course/Instructor Combinations
STUDENT GRADESSIMILAR

Spring 2007 vs. Fall 2008 Repeat Course/Instructor Combinations
MORELOWER
CLASSMEN

Narrowing down reasons…
•Could the significant difference in scores be due to the difference in class level of student responders? We had fewer upperclassmen with online evaluations.
•To investigate: ANCOVA run to covary out grade level

Results of ANCOVA
•Class level significantly impacted all measures of course/instructor evaluation except for timely return of work, reading valuable, and other assignments valuable (work-related measures)
•However, covarying out class level did not eliminate significant effects – it only reduced the size of the effects slightly

Summary of Mean Score Changes• For most course-instructor evaluation measures,
mean scores decreased with online evaluations
• While significant, this effect was small (effect size=.063). The average decrease was .19, and this decrease was very consistent across sections and measures.
• Notification of this adjustment for Fall 2008 will be provided to Department Chairs, P&B Committees, and Administration
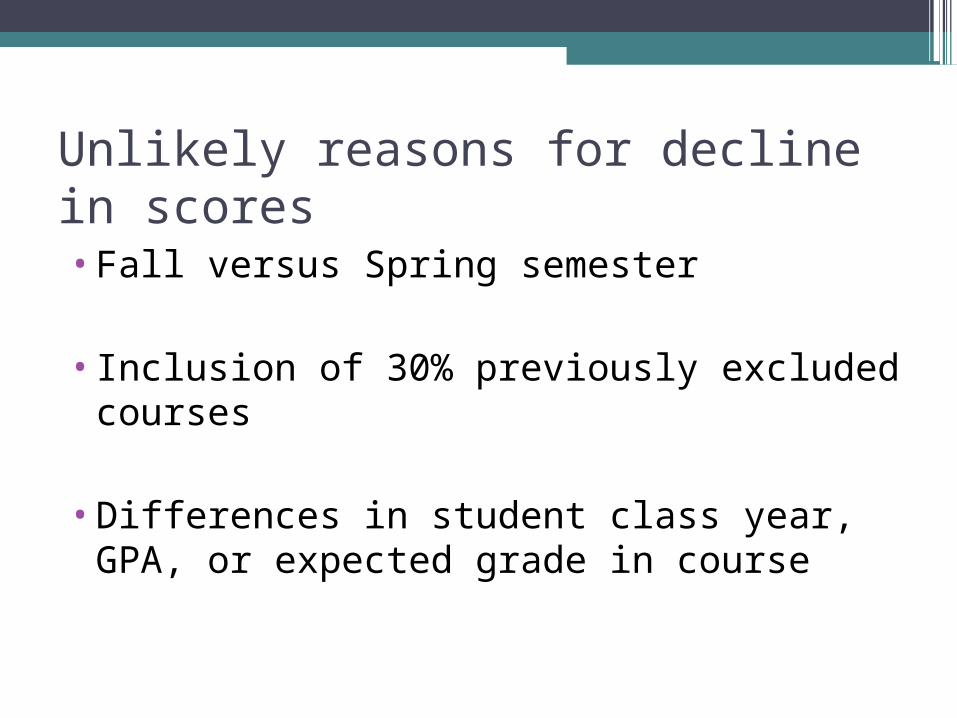
Unlikely reasons for decline in scores•Fall versus Spring semester
• Inclusion of 30% previously excluded courses
•Differences in student class year, GPA, or expected grade in course

Some potential remaining reasons for decline in scores
•Students were more motivated to participate when they disliked course – student responders skewed toward these students
•Fall 2008 was an unusual semester
•Online course evaluation represents a more honest evaluation of courses and instructors, and the lower values are more accurate
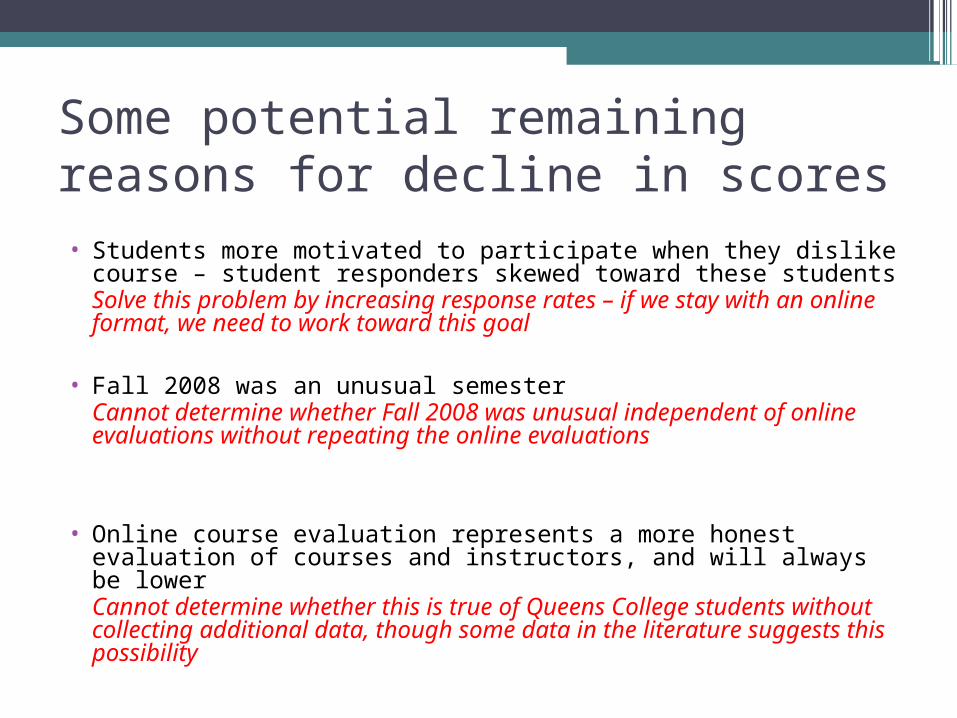
Some potential remaining reasons for decline in scores• Students more motivated to participate when they dislike course –
student responders skewed toward these studentsSolve this problem by increasing response rates – if we stay with an online format, we need to work toward this goal
• Fall 2008 was an unusual semesterCannot determine whether Fall 2008 was unusual independent of online evaluations without repeating the online evaluations
• Online course evaluation represents a more honest evaluation of courses and instructors, and will always be lowerCannot determine whether this is true of Queens College students without collecting additional data, though some data in the literature suggests this possibility

Brooklyn College Study
HONESTY OF RESPONSES-58% of students reported believing that students are more honest on online evaluations (specifically, RMP)-38% believed online and paper equally honest-8% believed paper more honest
VALIDITY OF RATINGS-47% of students reported believing that online evaluation results are more representative-34% believed online and paper equally representative-17% believed paper more representative
Brown, Baillie, and Fraser, 2009

Could scores be truly lower online, independent of response rate?
•Few studies have addressed this
•One study out of Idaho State (Heath, Lawyer, Rasmussen, 2007) randomly assigned students to online vs. paper from same classes, and then totaled subscales to compare overall scores for online versus paper▫No confounds from course, semester,
season, etc.

Total Evaluation Scores for Idaho State (response rates 72.2% online) vs. Queens College (response rate 29% online)
(p=.098, n=130) (p=.001, n=642)
Bottom line…
•Our mean course ratings are lower, albeit only 0.2 lower on average. Without additional data, we cannot say for sure why.
•Our response rates were 29% on our first time out – we’d like to work to improve that.
Improving response rates• Continue incentive lottery• Continue advertising on web, plasma boards, and posters• The library has offered two computer labs for faculty to reserve
in order to allow students to conduct evaluations during class time – Department Chairs will be asked to forward this information, especially to untenured, tenure-track faculty
• *Implement more frequent reminders – success reported with e-mail reminders every 3 days
• *More aggressively urge faculty to advertise evaluations in their courses, and to explain why it’s important for students to complete them
*reported successful across multiple campuses, eg. Columbia University, Hmieleski (2000)

TEEC voted to continue online evaluations for one year (resolution to follow). Rationale:
• Administration greatly supports moving to an electronic format due to cost, Green initiatives, and a movement nationwide toward technology-based evaluation
• We want to foster a culture of continuity and expectation for the online evaluation system in order to help drive up response rates
• We need more data in order to determine if lower scores were 1) a fluke, 2) caused by low response rate, or 3) a permanent fixture for online evaluations
Aren’t we worried about the lower scores?
•Of course. However:▫The errors were tight for the decreases,
showing a global, across-the-board drop of about 0.2 points per measure – this makes the “hit” uniform and predictable
▫We will provide reports and data to all Chairs, P&B’s, and to administration so that expectations can be adjusted for Fall 2008 and any subsequently impacted semester

Resolutions:
1) We, the Queens College Academic Senate, resolve to extend online course evaluations to include the Spring and Fall semesters of 2009. 2) We, the Queens College Academic Senate, resolve to conduct evaluations of all courses each semester that online evaluations are in effect.
Top Related