


Languages
Pages
Legal


Quantitative and Qualitative Research
1. Why do we need qualitative research?
2. Methods of qualitative research.
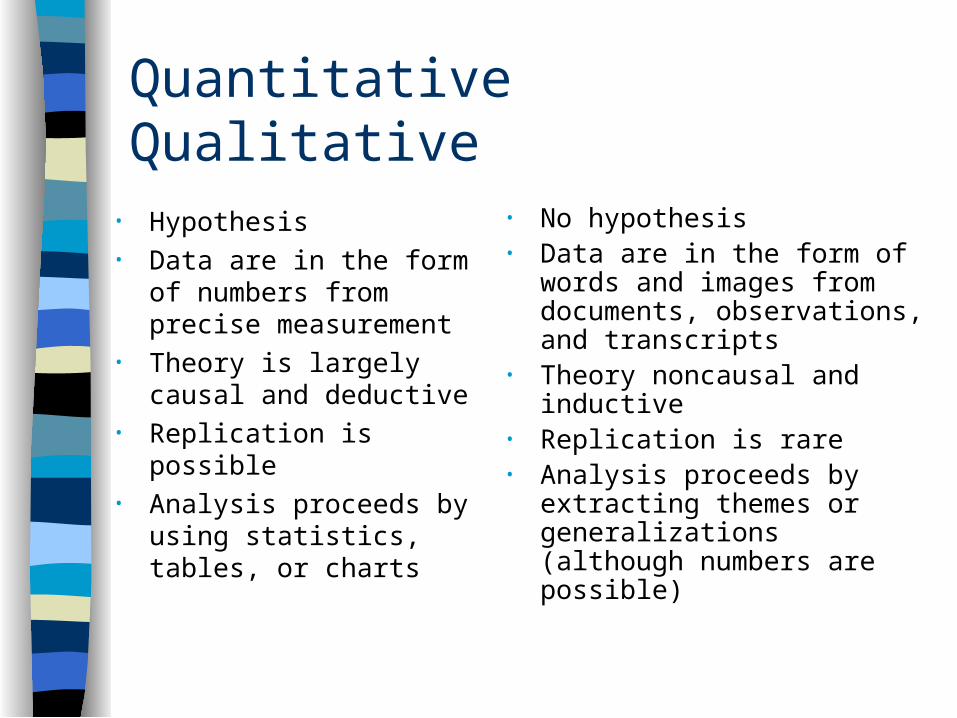
Quantitative Qualitative
• Hypothesis • Data are in the form of
numbers from precise measurement
• Theory is largely causal and deductive
• Replication is possible• Analysis proceeds by using
statistics, tables, or charts
• No hypothesis• Data are in the form of words
and images from documents, observations, and transcripts
• Theory noncausal and inductive• Replication is rare• Analysis proceeds by extracting
themes or generalizations (although numbers are possible)

A model of the Research Process
THEORY
HYPOTHESISFINDINGS
DATA GATHERING
RESEARCH DESIGN
Deduction
Operationalization
Measurement
Induction
Analysis

Homicide Trend over Time The homicide rate nearly doubled from the mid 1960's to the late 1970's
In 1980, it peaked at 10.2 per 100,000 population and subsequently fell off to 8.0 per 100,000 in 1984
It rose again in the late 1980's and early 1990's to another peak in 1991 of 9.8 per 100,000
From 1992 to 2000, the rate declined sharply. Since then, the rate has been stable

Changes in homicide rates (explanations)
• “Legitimation of violence” hypothesis (Archer, Gartner, 1984) argues that during wartime pro-violent values are reinforced and these values are carried over to postwar periods
• Increase in homicide rates after World War II, the Korean War, and the Vietnam War are consistent with this idea

Changes in homicide rates (explanations)
• Homicide rate has been associated with business cycles (LaFree, 1998, Short, 1997)
• Higher homicide rates occur in periods of growing economic prosperity
• Deprivation for some groups
Changes in homicide rates (explanations)
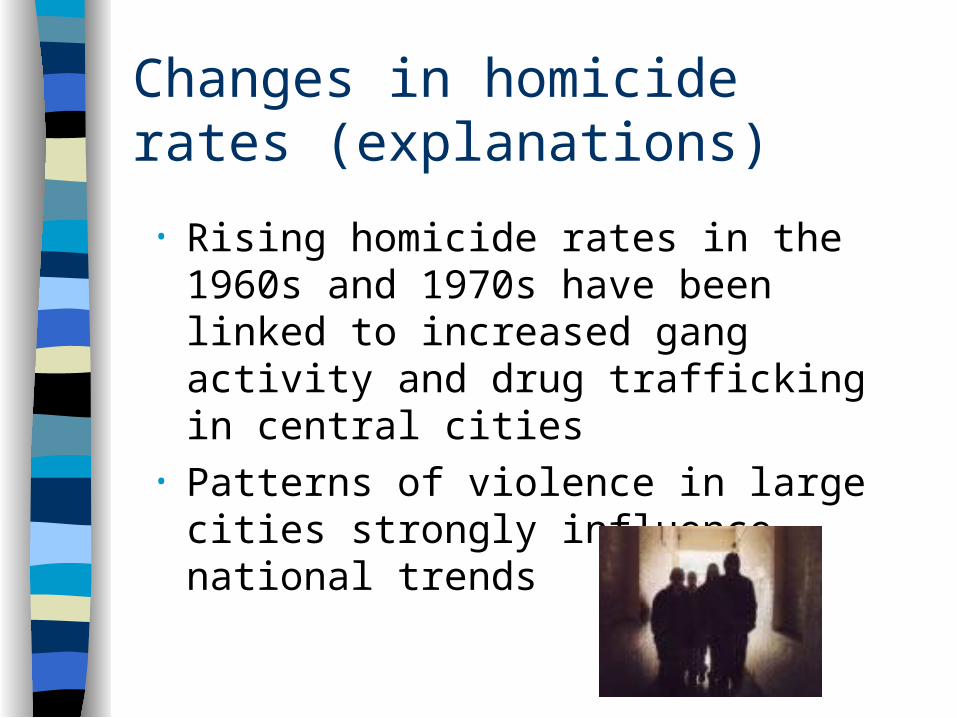
• Rising homicide rates in the 1960s and 1970s have been linked to increased gang activity and drug trafficking in central cities
• Patterns of violence in large cities strongly influence national trends

Explanation for USA
• Wider availability of handguns• Greater social acceptance of violence as
method of conflict resolution• Violence is deeply woven into the fabric of
American culture (street talk, prime-time television programming, “gangster rap” music lyrics)
• High poverty rates • High ethnic diversity
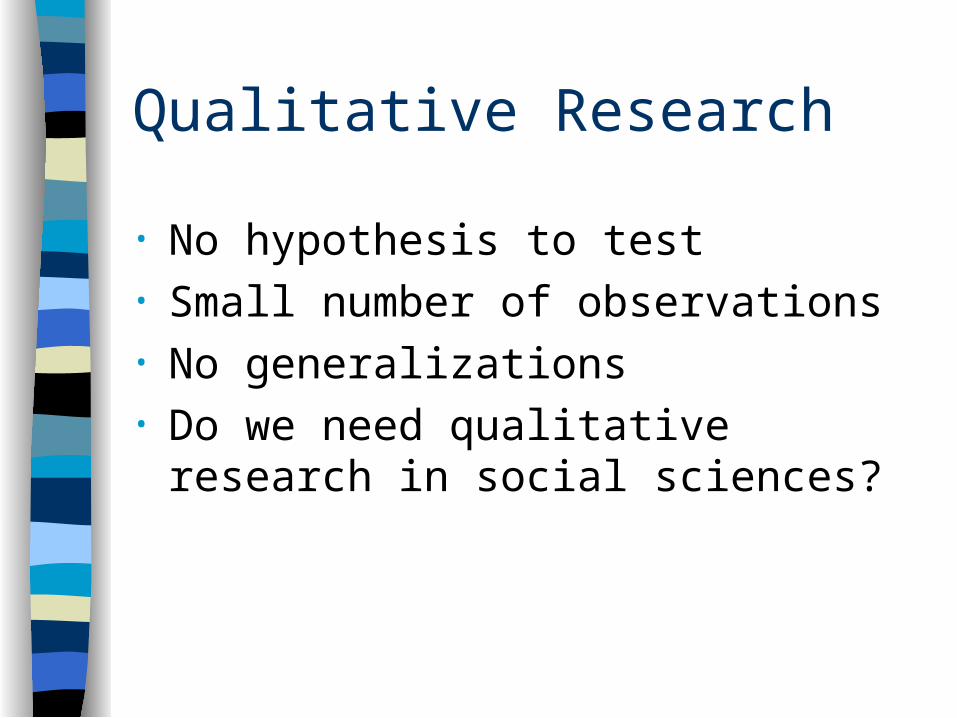
Qualitative Research
• No hypothesis to test • Small number of observations• No generalizations• Do we need qualitative research in
social sciences?

Qualitative or Quantitative
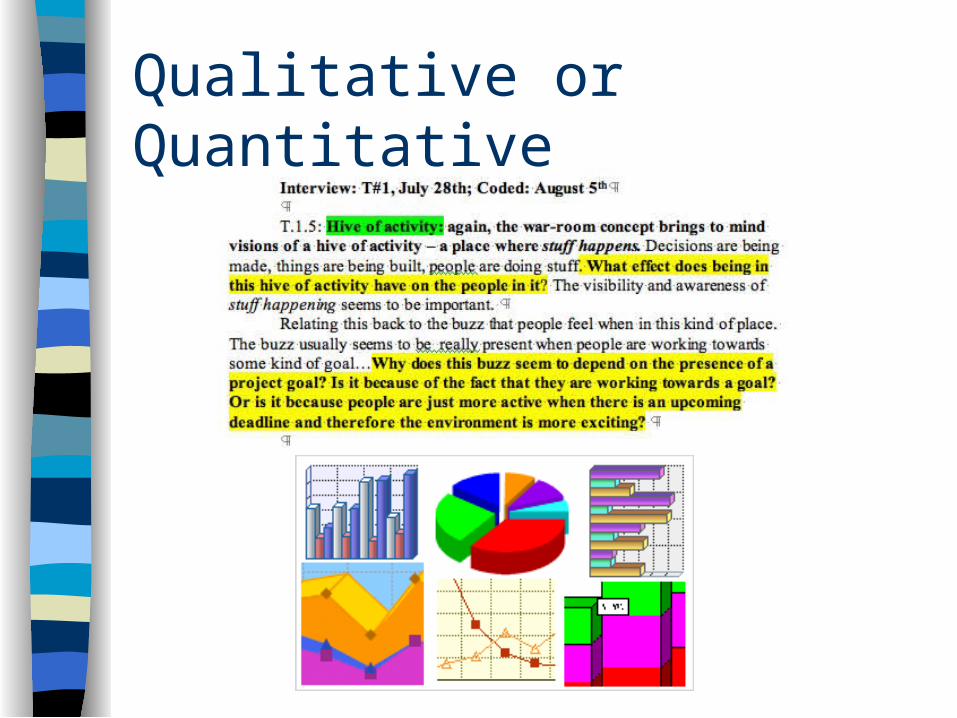
Qualitative or Quantitative
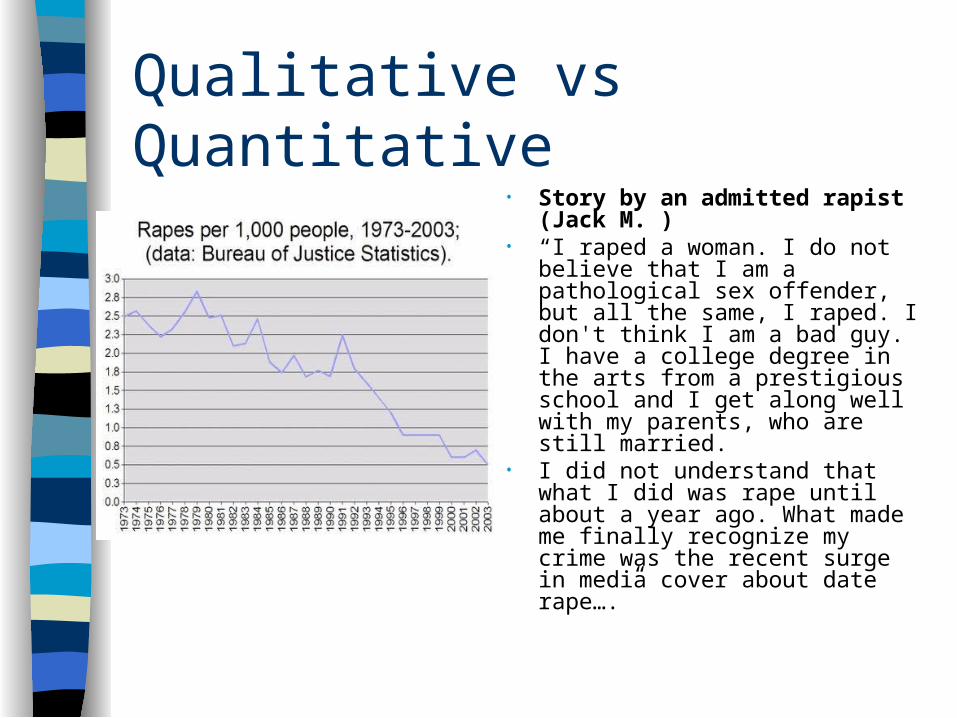
Qualitative vs Quantitative• Story by an admitted rapist (Jack
M. )• “I raped a woman. I do not believe
that I am a pathological sex offender, but all the same, I raped. I don't think I am a bad guy. I have a college degree in the arts from a prestigious school and I get along well with my parents, who are still married.
• I did not understand that what I did was rape until about a year ago. What made me finally recognize my crime was the recent surge in media cover about date rape….”

Case studies can be…
1) Snapshot case studies: Detailed, objective study of one research entity at one point in time
2) Longitudinal case studies. A study of one research entity at multiple time points
Case Study
• Sutherland’s “The Professional Thief” (1937)
• Shaw's “The Jack-Roller: A Delinquent Boy's Own Story ” (1930)

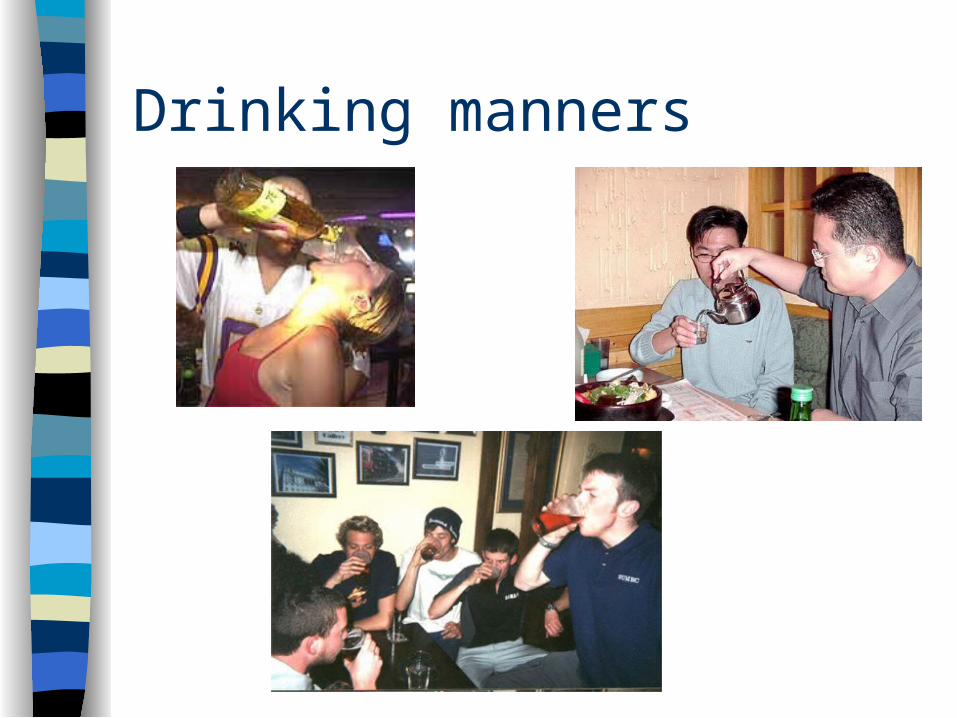
“Culture and drinking”
• Generally, by culture we mean the values, traditions, norms, customs, arts, history, folklore, and other institutions shared by a group of people
• Culture shapes how people see their world and structure their community and family life
David G. Mandelbaum “Alcohol and Culture” (1965)

Mandelbaum (1965) ”Alcohol and Culture” Current Anthropology, 6 (3): 281-293
• “When a man lifts a cup, it is not only the kind of drink that is in it, the amount he is likely to take and the circumstances under which he will do the drinking that are specified in advance for him, but also whether the contents of the cup will cheer or stupefy; whether they will induce affection or aggression, quiet or unalloyed pleasure. These and many other cultural definitions attach to the drink even before it reaches his lips”

Culture and consequences of drinking
• Pharmacology of alcohol• Different cultures provide different
models of appropriate and inappropriate drinking habits, they also create sets of expectancies regarding the behavioral effects of alcohol
• Violent behavior vs peaceful and harmonious

Culture and drinking
• Do cultural attitudes of international students toward drinking or college social environment shape their drinking behavior?
• In other words, what is more important culture or immediate social environment?
Methods
• Qualitative or quantitative?• Why?

Methods
• A random sample of 3,000 WSU undergraduate students from Pullman campus was selected for participation in a web survey
• 1,181 respondents participated in the study • International students from China N=47 (3.97%) • 621 (3.26%) international students at WSU (all
campuses)• Detailed information about the crime, the
victimization, alcohol and drug use was collected • In addition,30 face-to face interviews were conducted
with students from China
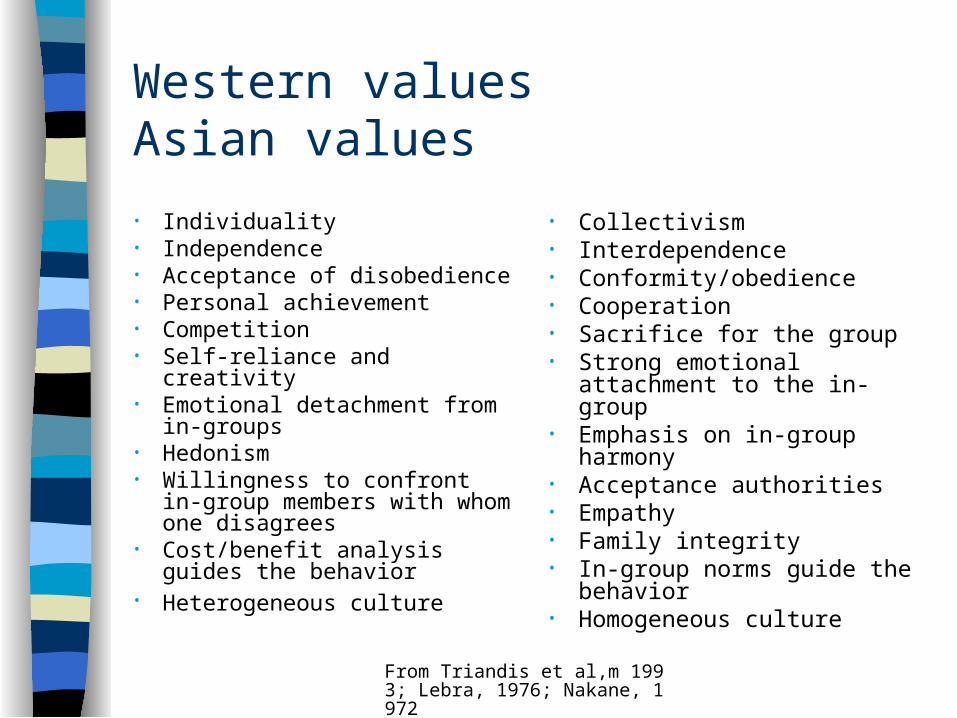
From Triandis et al,m 1993; Lebra, 1976; Nakane, 1972
Western values Asian values
• Individuality• Independence• Acceptance of disobedience• Personal achievement• Competition• Self-reliance and creativity• Emotional detachment from
in-groups• Hedonism• Willingness to confront in-
group members with whom one disagrees
• Cost/benefit analysis guides the behavior
• Heterogeneous culture
• Collectivism• Interdependence• Conformity/obedience• Cooperation• Sacrifice for the group• Strong emotional attachment
to the in-group• Emphasis on in-group
harmony• Acceptance authorities• Empathy• Family integrity• In-group norms guide the
behavior• Homogeneous culture

Drinking Behavior is influenced…
• Consumption becomes an end in itself (Triandis, 1988)
• Immoderate behavior is a trademark of college-age students
• They think college will be a time to party, experiment, and abandon the restrictive rules they may have lived with at home
• Lack of embarrassment because it is a norm to drink in college
• Big size the glasses or drinking cups
• Americans rarely eat when drinking
• Drinking occasions are often • Economic conditions do not
restrict the use of alcohol much
• moderation (Sue, et al., 1985). • The avoidance of embarrassment and the
concept of "face" are powerful forces against drunkenness
• The small size of the glasses or drinking cups
• Chinese traditionally drink alcohol only when eating. Drinking with food decreases the rate of alcohol absorption
• It is believed that alcohol should be consumed slowly to enhance its pleasure (Wang, 1992).
• Playing games while drinking heightens sensitivity to the state of intoxication (Cicero, 1980)
• Physiological flushing response-the reddening of the upper body, especially the face-restricts alcohol use (Schwitters, et al., 1982; Park,1984).
Asian Students American Students
Drinking manners

Since the beginning of the school year,how often have you been drinking alcoholic beverages?
18%
25% 25%
1%
43%
26%
2%6%
0%
16%14%
21%
0%
10%
20%
30%
40%
50%
60%
Never Once or twice Once a month Once a week 2-3 times perweek
Every day
American Students Total
Asian students Total
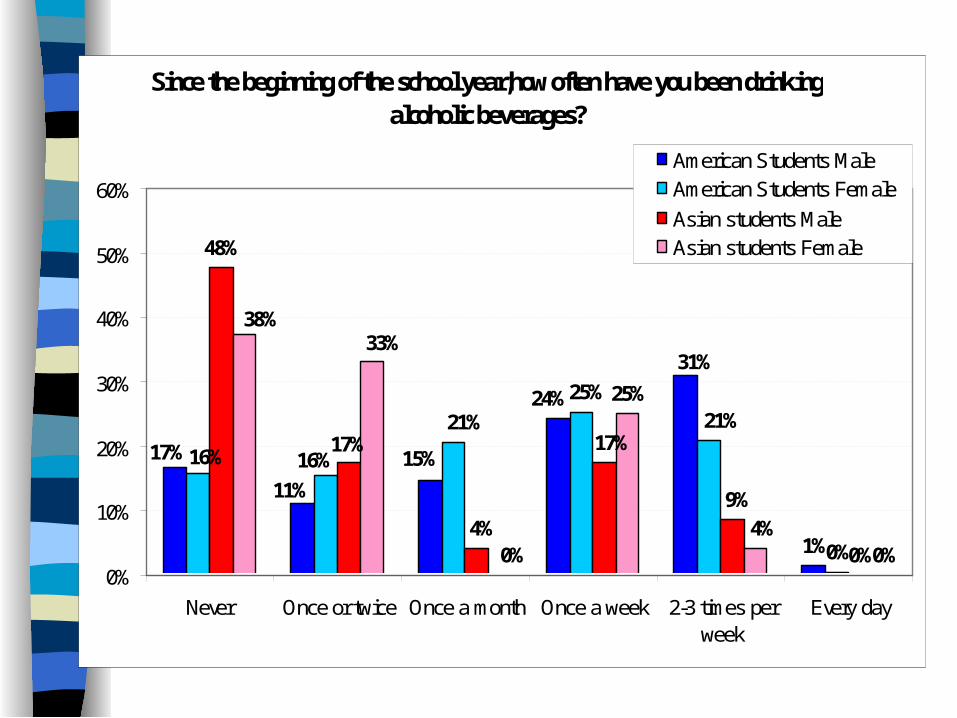
Since the beginning of the school year,how often have you been drinking alcoholic beverages?
1%0%
48%
0%
25%
0%
17% 15%
31%
11%
24%
16%
21%
16%
21%25%
17%
9%4%
17%
0%
33%38%
4%
0%
10%
20%
30%
40%
50%
60%
Never Once or twice Once a month Once a week 2-3 times perweek
Every day
American Students MaleAmerican Students Female
Asian students MaleAsian students Female

How would you best describe yourself in terms of your current use of alcohol?
20%
48%
28%
3%0%
45%49%
4%0% 0%
0%
10%
20%
30%
40%
50%
60%
Abstainer Light drinker Moderate drinker Heavy drinker Problem drinker
American Students: Total
Asian students: Total

How wouldbest describe yourself in terms ofyourcurrent use of alcohol?
41%
4%0%
2%0%
48%
4%
0% 0%0% 0%
34%
20%
53%
24%
20%
44%42%
54%
4%
0%
10%
20%
30%
40%
50%
60%
Abstainer Light drinker Moderate drinker Heavy drinker Problem drinker
American Students: MaleAmerican Students: Female
Asian students: MaleAsian students: Female

Reported reasons for not drinking
I am going to driveMale (63.7%) Female (73.1 %)
It interferes with my studyingMale (27.6%) Female (33.6%)
It is bad for my health*Male (14.8%) Female (21%) People in my family have had
alcohol problems*
Male (13.3%) Female (16.2%)
I am going to driveMale (56.5%) Female (75 %)
Drinking is against my religion*Male (34.8%) Female (54.5 %)
Drinking is against my values*Male (32.4%) Female (54.2 %)
I do not want to disappoint someone I care about
Male (30.4%) Female (45.2 %)
American students Asian students

Reported reasons for not drinking
I am not old enough*Male (12.3%) Female (10.7%) It costs too much money*Male (12.1%) Female (16.7%)
Drinking is against my religion*Male (5.1%) Female (6.9 %)
Drinking is against my values*
Male (4.37%) Female (5.2 %)
My friends don't drinkMale (27.4%) Female (30.4 %)
I do not like the taste*Male (21.7%) Female (30.1%)
It costs too much money*Male (20.5%) Female (15.2 %)
I am not old enough Male (12.5%) Female (11.2 %)
American students Asian students
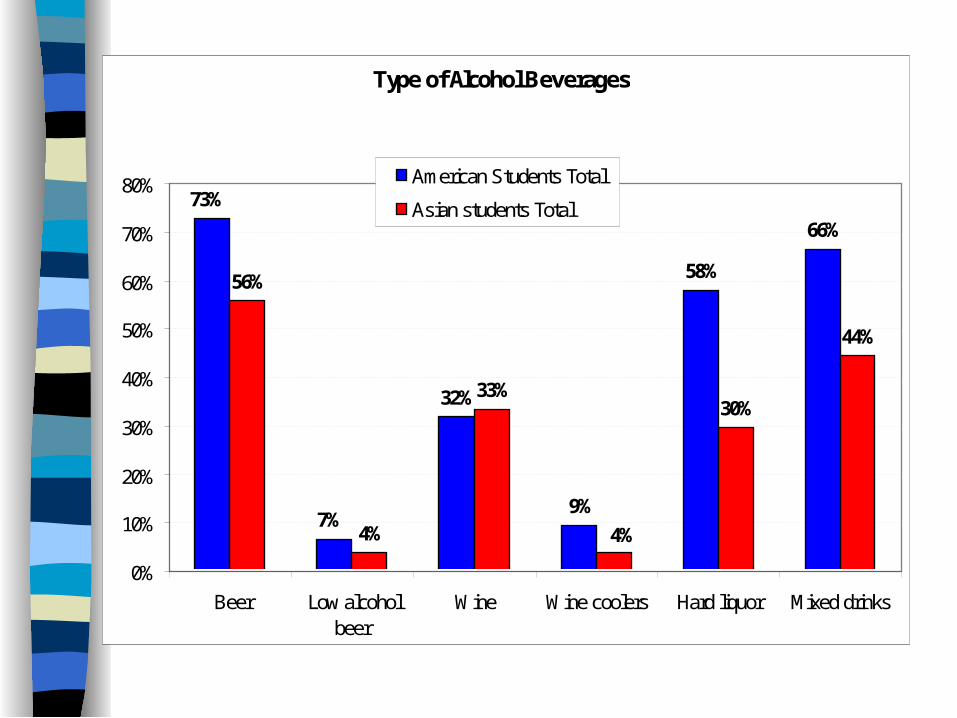
Type of Alcohol Beverages
32%
9%
58%
66%
56%
4%
33%30%
44%
73%
7%4%
0%
10%
20%
30%
40%
50%
60%
70%
80%
Beer Low alcoholbeer
Wine Wine coolers Hard liquor Mixed drinks
American Students Total
Asian students Total
Type of Alcohol Beverages
55%
74%
67%
0%
60%
89%
24%
64%
4% 3%
61%
38%
9%
54%
14%8%
42%
17%
8%
25%
47%
0%
47%
20%
0%
10%
20%
30%
40%
50%
60%
70%
80%
90%
100%
Beer Low alcoholbeer
Wine Wine coolers Hard liquor Mixed drinks
American Students MaleAmerican Students Female
Asian students MaleAsian students Female
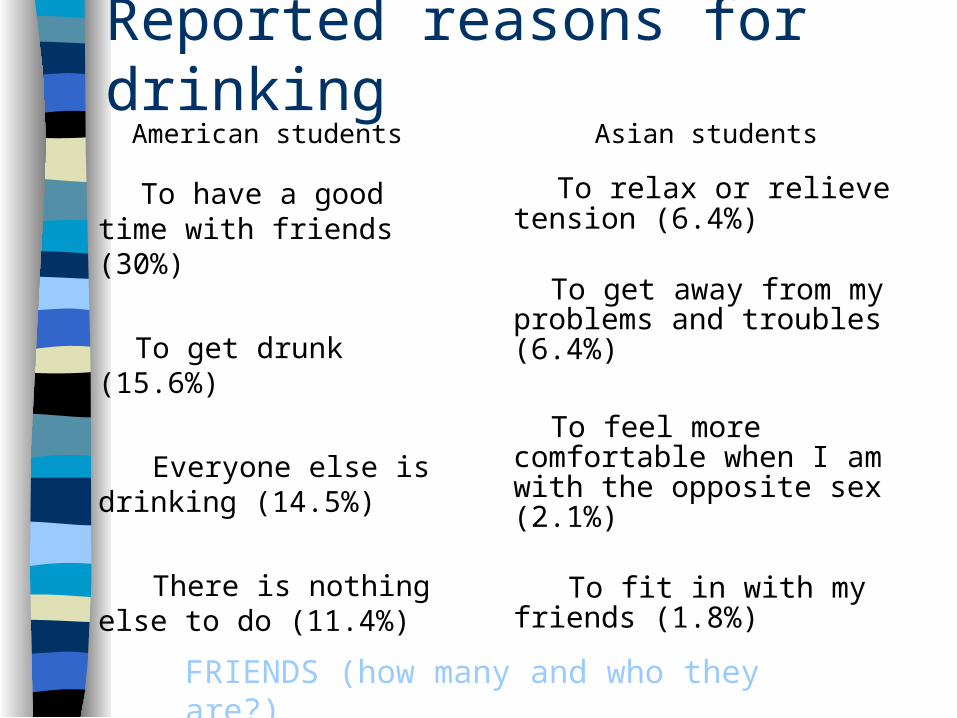
Reported reasons for drinking
To have a good time with friends (30%)
To get drunk (15.6%)
Everyone else is drinking (14.5%)
There is nothing else to do (11.4%)
To relax or relieve tension (6.4%)
To get away from my problems and troubles (6.4%)
To feel more comfortable when I am with the opposite sex (2.1%)
To fit in with my friends (1.8%)
American students Asian students
FRIENDS (how many and who they are?)

With how many students at WSU did you develop a close personal relationship?
3%
16%
25%
56%
6%
34%
23%
36%
0%
10%
20%
30%
40%
50%
60%
None 1-2 3-4 5 and more
American Students Total
Asian students Total
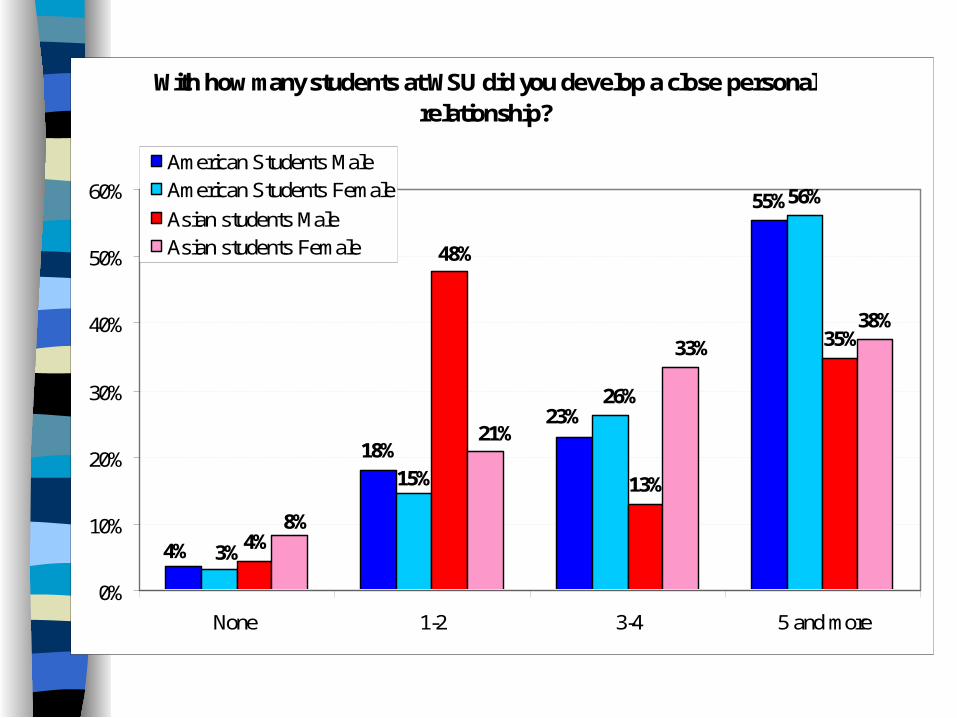
With how many students at WSU did you develop a close personal relationship?
18%
55%56%
4%
13%
35%38%
4%
23%
3%
26%
15%
48%
33%
21%
8%
0%
10%
20%
30%
40%
50%
60%
None 1-2 3-4 5 and more
American Students MaleAmerican Students Female
Asian students MaleAsian students Female

Friends and drinking • Number of American friends is significantly related to
the reported use of alcohol• For some, number of semesters spent at WSU is
related to a number of American friends• Those international students who speak English more
fluently are more likely to have more American friends and more likely to report higher levels of alcohol consumption
• Those international students whose English is not good tend to associate with people of the same origin and more likely to report lower levels of alcohol consumption

How many drinks does it take you to feel drunk?
21% 21%
19%
12%
5% 6%
1%
5%
0%
17%
26%
4%
0%
13%
1%
10%
22%
9%
4% 4%
0%
5%
10%
15%
20%
25%
30%
1 drink 2 drinks 3 drinks 4 drinks 5 drinks 6 drinks 7 drinks 8 drinks 9 drinks 10 ormoredrinks
American Students Total
Asian students Total
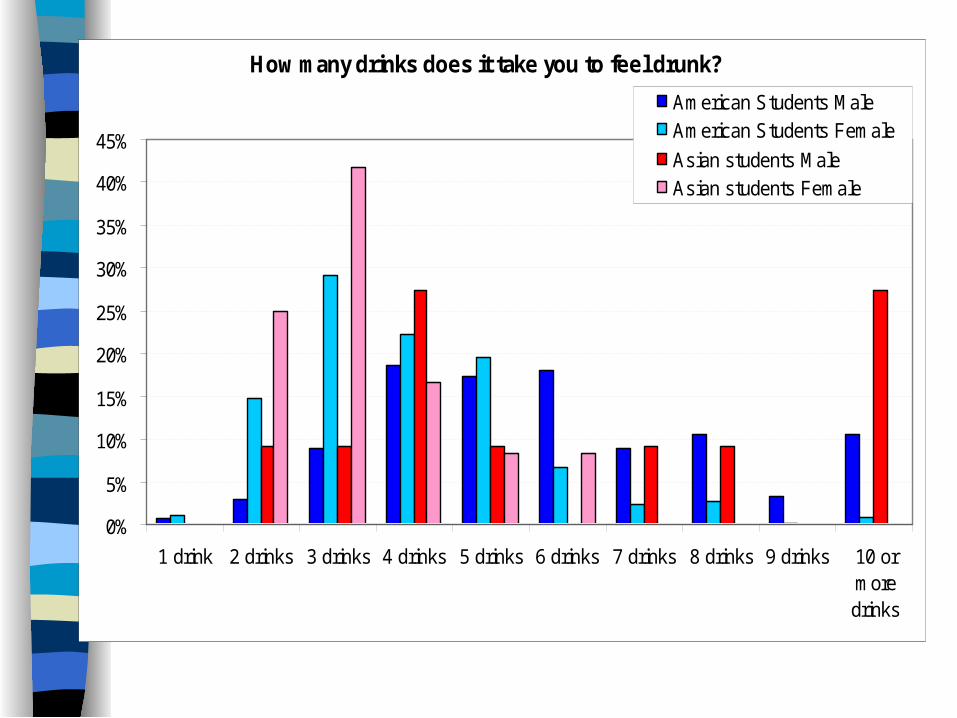
How many drinks does it take you to feel drunk?
0%
5%
10%
15%
20%
25%
30%
35%
40%
45%
1 drink 2 drinks 3 drinks 4 drinks 5 drinks 6 drinks 7 drinks 8 drinks 9 drinks 10 ormoredrinks
American Students MaleAmerican Students Female
Asian students MaleAsian students Female
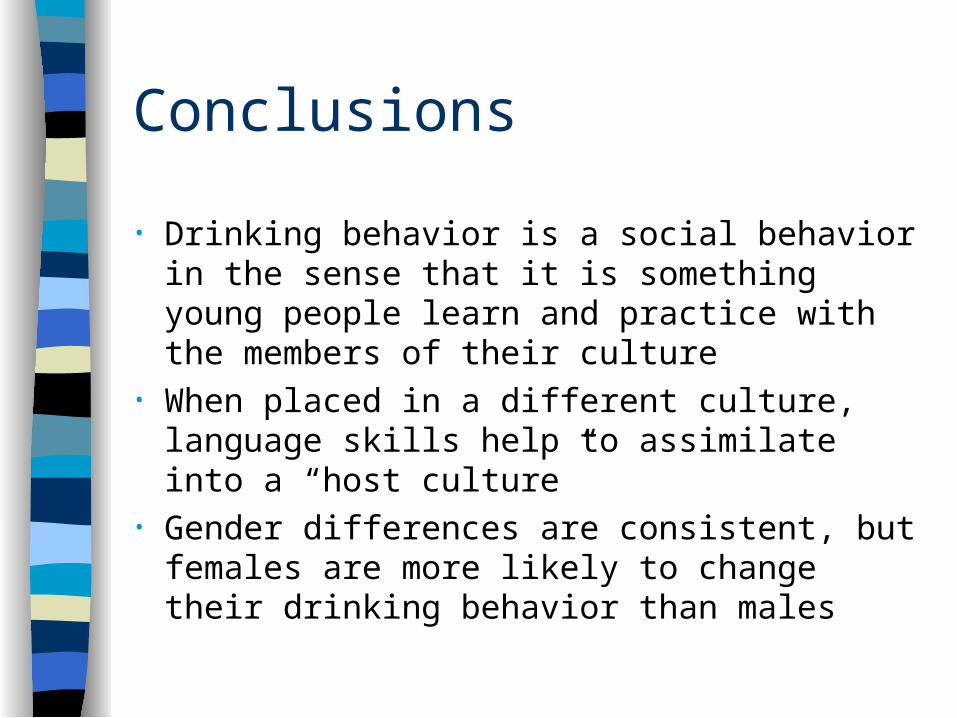
Conclusions
• Drinking behavior is a social behavior in the sense that it is something young people learn and practice with the members of their culture
• When placed in a different culture, language skills help to assimilate into a “host culture”
• Gender differences are consistent, but females are more likely to change their drinking behavior than males
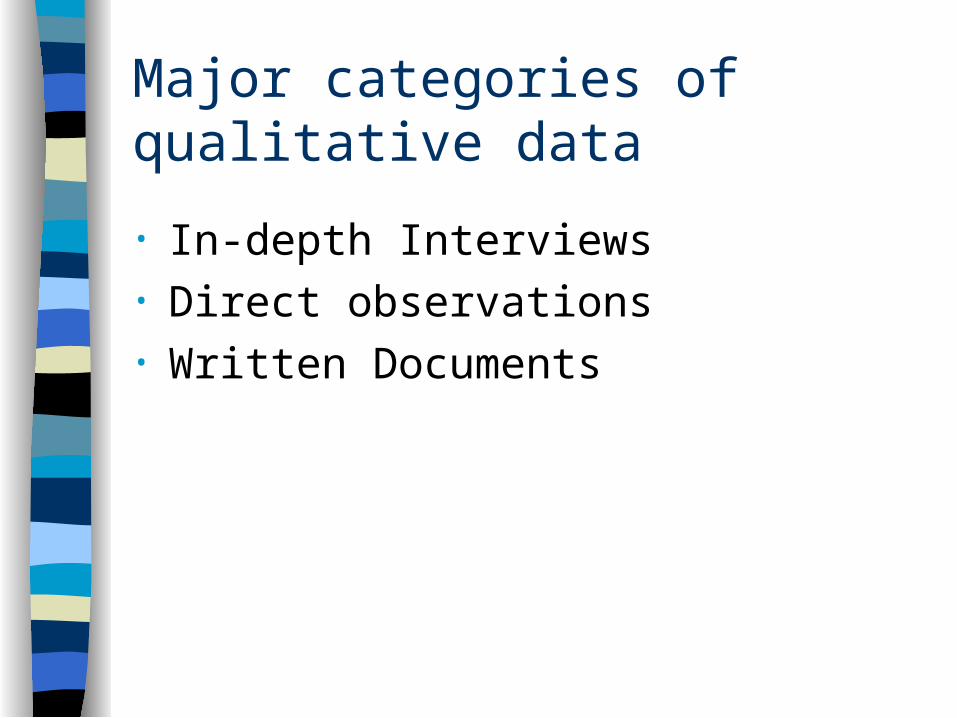
Major categories of qualitative data
• In-depth Interviews • Direct observations • Written Documents

In-depth interviews
• In-Depth Interviews include both individual interviews (e.g., one-on-one) as well as "group" interviews (including focus groups)
• The data can be recorded in a wide variety of ways including stenography, audio recording, video recording or written notes
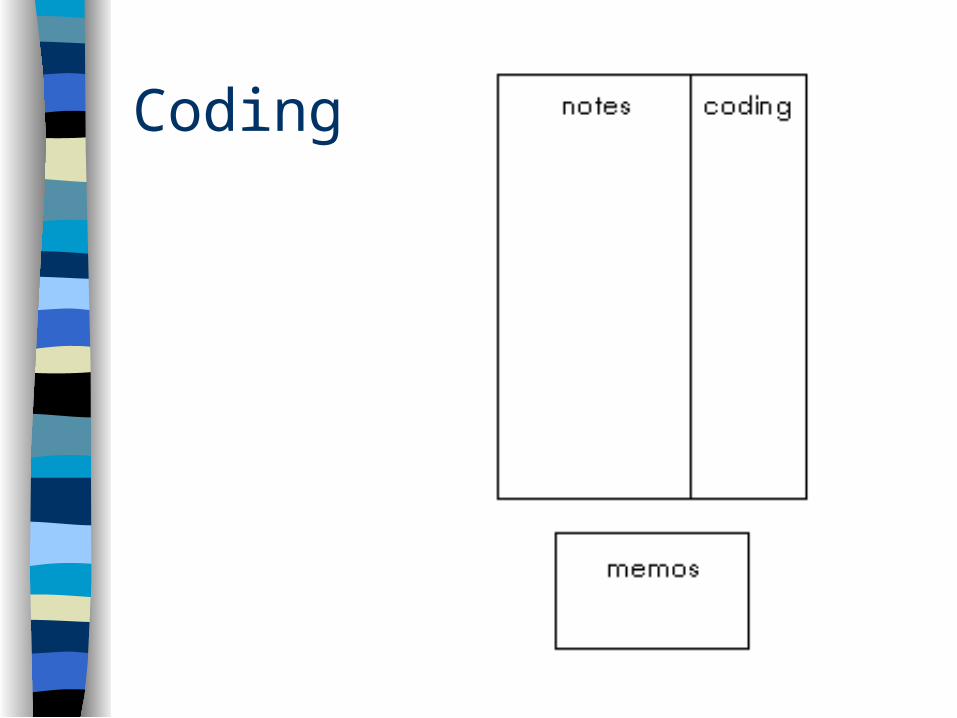
Coding
Coding your data
• For the first interview you are merely asking yourself: What is going on here? What is the situation? How is the person managing that situation?
• Code the second interview with the first interview in mind
• Code subsequent interviews (or data from other sources) with the emerging theory in mind.\
• That’s constant comparison: initially comparing data set to data set; later comparing data set to theory.
Categories and properties
• After a time one category (occasionally more) will be found to emerge with high frequency of mention, and to be connected to many of the other categories which are emerging
• This is your core category. It is hazardous to choose a core category too early in the data collection. However, when it is clear that one category is mentioned with high frequency and is well connected to other categories, it is safe to adopt this as the core category.

Direct Observations
• Direct observation is meant very broadly here• It differs from interviewing in that the observer does
not actively query the respondent• It can include everything from field research where
one lives in another context or culture for a period of time to photographs that illustrate some aspect of the phenomenon
• The data can be recorded in many of the same ways as interviews (stenography, audio, video) and through pictures, photos or drawings (e.g., those courtroom drawings of witnesses are a form of direct observation)
Different observational strategies
• Complete Participant –researcher goes “undercover” and does not tell people being observed that he/she is doing research

Different observational strategies
• Complete Observer –researcher views things from a distance or one-way mirror

Different observational strategies
• Participant Observer – people know that they are observed

Written documents
• Usually this refers to existing documents (as opposed transcripts of interviews conducted for the research)
• It can include newspapers, magazines, books, websites, memos, transcripts of conversations, annual reports, and so on
• Usually written documents are analyzed with some form of content analysis

Case Studies • Case study research is a time-honored,
traditional approach to the study of people• Because only a few instances are normally
studied, the case researcher will typically uncover more variables than he or she has data points, making statistical control

Representativeness
• Unlike random sample surveys, case studies are not representative of entire populations, nor do they claim to be
• The case study researcher should take care not to generalize beyond cases similar to the one(s) studied
• Provided the researcher refrains from over-generalization, case study research is not methodologically invalid simply because selected cases cannot be presumed to be representative of entire populations
•
Top Related