


Languages
Pages
Legal


Q2 2021 financial results
Luc Dionne, CEO Tekna Holding AS
August 19, 2021

Q2 2021 highlights
1 Includes tolling services 2
Financial results
Total Revenues
CAD 7.4 million 95% growth from Q2 2020
Adjusted EBITDA
CAD -1.1 million CAD 0.9m decrease from Q2 2020
Materials revenues1
CAD 5.0 million 103% growth from Q2 2020
Recurring Materials revenues
CAD 3.5 million84% growth from Q2 2020
Operations, business development and sales
Solid second quarter with $7.4M in revenue, driving YTD revenues 88% above H1 2020
• Strong order intake of $9.5m raising total backlog to $14.2m
• 88% of annual revenue target secured
• Delivered on IPO new contract promises: Airbus (3-year) and LG Chem (multi-year)
• Launched $16m investment program to scale-up capacity in all three powder business segments to deliver on accelerating growth
• Patent granted in Europe for Tekna Additive Manufacturing powder process
Subsequent events
• Additive Manufacturing: 10-year supply agreement with leading EU jet engine & Aerospace component OEM
• Printed Electronics: Positive feedback & re-ordering of samples. Annual demand from one customer exceeds 2022/2023 projected capacity - options are under review
• Energy Storage: LG Chem joint development agreement execution started

3
Tekna in brief
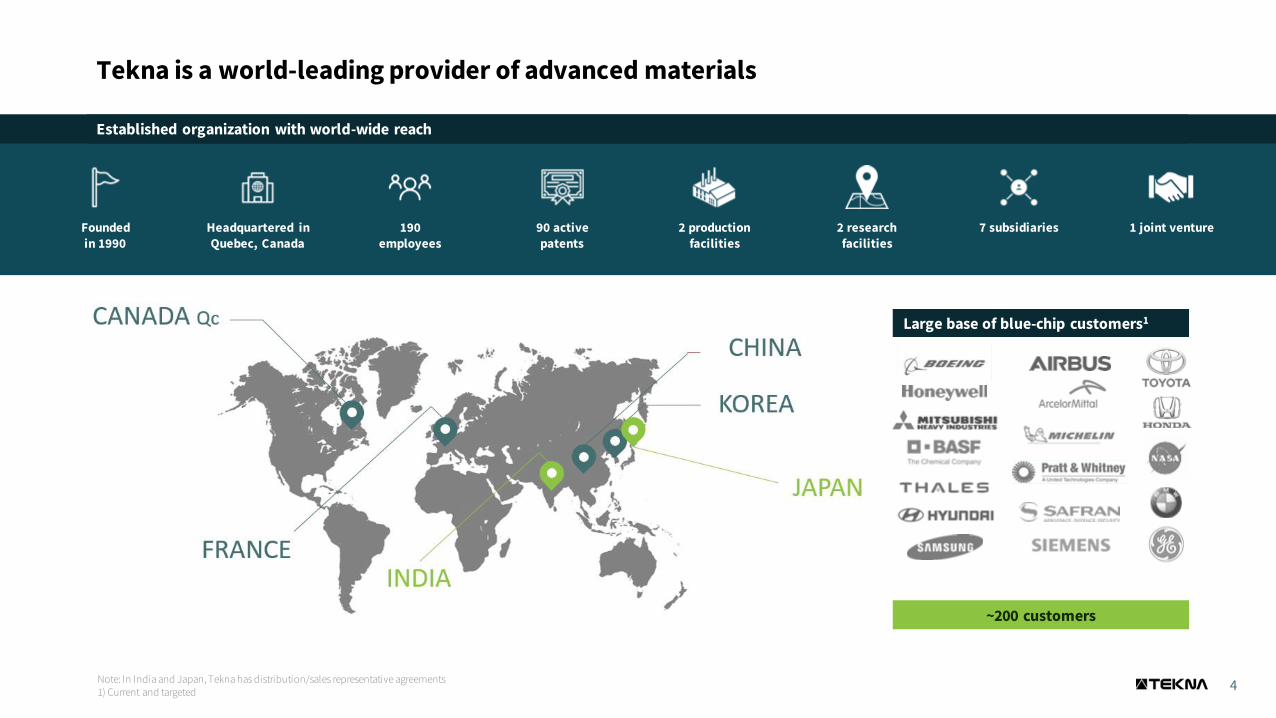
Tekna is a world-leading provider of advanced materials
Note: In India and Japan, Tekna has distribution/sales representative agreements1) Current and targeted
4
Founded in 1990
Headquartered in Quebec, Canada
190 employees
90 active patents
2 production facilities
2 research facilities
7 subsidiaries 1 joint venture
Established organization with world-wide reach
Large base of blue-chip customers1
~200 customers

Tekna is developing its position in three multi-billion-dollar market verticals
5
Tekna’s technology starts where others’ end
Additive manufacturing / 3D printing Printed electronics Energy storage
>2.5bn
2030
~0.8bn
20252021
0.2bn
2021
~0.4bn
0.2bn
2025 2030
~0.9bn
2025
~7.4bn
20302021
2.4bn
>34.0bn
✓ Fast-growing industrial 3D printing market
✓ Reducing waste & producing longer-lasting components
✓ IoT and digitalization of every-day devices
✓ Enabling technological advancements towards more efficient resource usage
✓ Electrification and grid reserve
✓ Increasing clean energy storage and performance
~16% ~35% ~1% ~3%
Addressable market (CAD)
Market sharexx% Market sharexx%
Addressable market (CAD) Addressable market (CAD)
~1%
Market share
~13% ~24%
xx%
~8% ~0%
Sources: SmarTech – 3D Printing and Additive Manufacturing reports, Wohlers Associates – 3D Printing and Additive Manufacturing Global State of the Industry, ARK Investment management – Big Ideas 2021, Cairn Energy Research Advisors – SI Marketscape and opportunities, company estimates

6
Key developments

Key developments: Additive manufacturing / 3D printing
7
Sustained growth quarter over quarter
• 13% sales growth over Q1 2021
• 86% of powder sales generated from recurring customers
• Signed long-term Airbus agreement for Titanium
• Signed 10-year agreement for various alloys with other Aerospace OEM (July 2021)
• Market developing as projected
• Patent granted in Europe for Tekna AM powder process
Securing market position through rigorous and systematic business development
• Automotive – over 200 prospects identified, 2 qualified and supplying
• Qualification in progress with 2 large OEMs in Consumer electronics
• Continuing to grow positions in aviation and medical sectors

Key developments: Printed electronics
8
Successful roll out of market-entry strategy
• Strong product matching with customer spec
• Industrialization progressing steadily
• Repeat sample order received to go to the next qualification stage
Completed On-going Closed
Business development progress score card (80 nm Nickel powders)
Systematically working through qualification stages with potential customers, paving the way for market entry
• Working with 10 companies (100% of the market) across the value chain
• Solid progress with all major customers
• Samples under evaluation

Key developments: Energy storage
9
• Differentiating and growth-enabling factors:
• Particle high-purity and size below 150 nm
• Feasibility proven through industrial scale samples
• 30-years of plasma technology maturity
• Identifying potential partners for Silane (feedstock)
• Plan to share material with leading battery manufacturers, downstream Si anode startups and carmakers
• Scaling-up research and manufacturing capacity
Partnership with LG Chem developing positivelyResearch milestone expected in Q4 2021
Tekna’s technology ranks among top 3 for LiB Silicon material producers

10
Financials

Financial highlights(CADm)
2021Q2
2020Q2
2021YTD
2020YTD
2020FY
Revenue 7.4 3.8 15.2 8.1 22
Gross Margin 46% 53% 48% 49% 49%
Adjusted EBITDA -1.1 -0.2 -0.8 -1.9 1.4
Adjusted EBITDA % -15% -5% -5% -23% 6%
EBITDA -1.2 -0.2 -1.5 -1.9 1.4
EBITDA % -16% -5% -10% -23% 6%
Cash balance at the end of the period 45.7 2.1 45.7 2.1 2.5
Recurring revenue (% of materialsrevenue)
86% 80% 82% na na
Financial highlights Q2 2021
• Revenues increased 95% in Q2 and 88% YTD over the same period last year
• YoY Q2 revenue growth in both business segments: systems (75%) and materials (>100%)
• Total orders on hand for Q2 2021 increased by 25% from Q1 2021 and 55% from Q2 2020
• Recurring material revenues steadily increasing, now 86%
• Materials revenue alone have more than doubled from Q2 2020
• Q2 gross margin in line with forecast for full year
• Q2 adjusted EBITDA at $ -1.1m, in line with forecast announced in Q1 2021 report
• Adj. EBITDA improved by $1.1m YTD over same period last year, due to volume increase and tightened operating costs
• YTD 2021 gross margin in line with same period last year
11
Commentary
Notes1 The figures have been prepared in accordance with IFRS2 EBITDA adjusted for non-recurring items3 2020 adjusted EBITDA includes CAD 2.7m in the form of grants for Covid mitigation, as well as CAD 3.6m
of commercial rights and OPEX recharge to the JV Imphytek powders in Q4
1
1
3
22

12
Strategy and growth ambitions

13Sources: SmarTech – 3D Printing and Additive Manufacturing reports, Wohlers Associates – 3D Printing and Additive Manufacturing Global State of the Industry, ARK Investment management – Big Ideas 2021, Cairn Energy Research Advisors – SI Marketscape and opportunities, company estimates
Countries and industries of relevance to Tekna are emerging from Covid-19
3D printing
Printed electronics
Energy storage
ON TARGET
ON SCHEDULE
FULL SPEED AHEAD
Tekna’s market position keeps improving every day, in every segment
✓ 8% market share forecast and $22m annual run rate revenue by YE2021
• Performance indicators are all green for AM powder revenues
✓ $2.5bn market size and 24% market share growth projection maintained
• Strong demand with increasing customer base and average order size
• Market position is improving with long-term supply agreements
✓ 2021 material validation and order intake targeted in H2 2022
• Demand for evaluation of Tekna ultra-fine nickel powder has increased in 2021
• $1bn market size and 35% market share target could be favorably revised in 2022
✓ Demand for EVs and 5G mobility is growing massively
• Selling price of ultra-fine nickel powder is expected to stay high
✓ Industrialization plan and powder development effort
• Electrification of transport & green power are fueling demand for energy storage
✓ $34bn market size and 3% market share targets are holding course
• LG Chem JDA secured, Silicon samples and system design are on-going
• Tekna’s ranks 1st and 2nd on impact on energy density and scale-up potential

Developing Strategic Partnerships
14
The ideal position in the value chain is one where Tekna brings the most value to the customers, while increasing market share and revenue
Raw material supply (ore, ingot)
Feedstock (2nd level
transformation)
Power manufacturers
Semi-finished product
Plant equipment suppliers
End user OEM integrator
Additive manufacturing
Printed electronics
Energy storage
✓ Tekna supply risk
✓ Helps market access
✓ Value add and control over procurement decision
✓ Leadership position
✓ Value add to decision maker
✓ Growth CAPEX
✓ Geographic challenges
✓ Control over OEM process
✓ Number of Tiers
✓ Revenue per Tier
✓ Value add and control over procurement decision
✓ OEM supply risk
✓ OEM IP
✓ Procurement model
✓ Number of OEMs
✓ Revenue per OEM
Strategic partnerships considered: JV, supply agreements, alliances and M&A
Aperam, Titanium, Aluminum

Leadership on ESG strategy implementation
1. eSAT is the employee satisfaction score and eNPS refers to the employee net promotor score. 15
Reducing environmental footprint
• Assessment of Climate Risks and Opportunities
• Establishing baseline GHG emissions
• Continuously improving resource efficiency in production
Nurturing a Great Place to Work
• Great Place to Work -Employee representation committee
• Employee survey, baseline, eSAT and eNPS1
• Compensation package benchmarked
Focus on ethical business conduct
• Preparing EU Taxonomy and TCFD reporting
• Updated Supplier Code of Conduct and Self-Assessment
• Updated Employee Code of Conduct
Furthering transparency on ESG
• ESG report 2021
E S G
All (production) facilities powered by clean energy in Canada (hydro)

16 16
Summary and outlook

On track to deliver on 2021 priorities and mid-to-long term ambitions
1) Operational EBITDA margin excludes R&D.Note: AM: Additive Manufacturing, PE: Printed Electronics, ES: Energy Storage, SY: Systems
R&D5% of revenues near-termTowards 3% mid- to long-term
Metric 2021 Mid-to-long term ambition
Revenue growth Reach CAD 22M run-rate materials sales during 2021
40-50% organic revenue growth per year
Business mix ~50% AM, ~35% SY, ~15% other Mid-term: ~30% AM, ~20% PE, ~25% ES, ~15% SY + other Long-term: ~50% ES, ~25% AM, ~15% PE, 10% SY + other
Operational EBITDA margin1 Below break-even Towards 25% mid- and long-term
Growth capex Expansion within existing facilities Targeting 30+ plasma units in operation by 2025, 250+ plasma units in operation by 2030
Other capex Maintenance capex >1% of revenues
17

Key takeaways
18
The Q2 performance is in line with our expectations
The market indicators we are monitoring are positive
We reiterate our near- and long-term targets

Summary: Solid position for profitable growth and expansion
19
Scalable, recurring and sticky business model with low CAPEX requirements
Proven and commercialized technology with >200 blue-chip customers
IP protected plasma technology driving disruptive manufacturing change
Megatrends accelerating demand for high-quality micro and nano materials1
2
3
4
Increasing market share and accelerating adoption drives strong revenue growth5

Annexes

TEKNA |
Industrial scale and optimized production enabling strong growth in Tekna’s profitability
Note: numbers in CAD. Further details and guidance for Tekna provided in appendix on slide 36 21
>$2,000m
2025 20302021
>$30m
~$300m
CAGR >70%
Medium-term growth initiatives
• Maturing additive manufacturing customers’ products to reach large scale manufacturing
• Commercialization of materials for printed electronics and energy storage
• Continued sale of R&D systems to achieve more product development for new industries
• Mass production of materials to additive manufacturing, printed electronics and energy storage
• Development and commercialization of additional materials
• M&A opportunities are not included in business plan, but will give further upside potential
Long-term growth initiatives
Additive Manufacturing
~35%
Printed Electronics
~20%
Energy Storage
~25%
Systems & other
~20%
Additive Manufacturing
~25%
Printed Electronics
~15%
Energy Storage
~50%
Systems & other
~10%

Financial statements INCOME STATEMENT
22
Notes1. Accounting of direct labor is presented in the COGS
2. 2020 other income include CAD 2.7m in the form of grants for Covid mitigation and a further CAD 1.6m of commercial rights charged in Q4 to the JV Imphytek Powders
3. 2020 OPEX costs include a CAD 2.0m recharge in Q4 to the JV
4. Decrease of CAD 1.0m in amortization of intangibles and CAD 1.5m in tax expense have been recorded following the formal evaluation of the Purchase price allocation of 2013.
CADm
2021 2020 2021 2020FY 2020
Q2 Q2 YTD YTD
Revenue 7.4 3.8 15.2 8.1 22,0
Cost of sales1 4.0 1.8 7.9 4.1 11.3
Gross margin 3.4 2.0 7.3 4.0 10.7
Gross margin % 46% 53% 48% 49% 49%
Other income -0.2 -1.7 -0.2 -1.7 -4.22
Indirect personnel expenses 3.4 2.7 6.1 5.3 10.6
Other OPEX 1.3 1.2 2.2 2.3 2.93
Total other income and OPEX 4.5 2.2 8.1 5.9 9.3
Adjusted EBITDA -1.1 -0.2 -0.8 -1.9 1.4
Adjusted EBITDA margin % -15% -5% -5% -23% 6%
Non-recurring expenses 0.1 0.7
EBITDA -1.2 -0.2 -1.5 -1.9 1.4
EBITDA margin % -16% -5% -10% -23% 6%
Depreciation and amortization 0.8 1.0 1.6 1.9 3.94
EBIT -2.0 -1.2 -3.1 -3.8 -2.5
EBIT margin % -27% -32% -20% -47% -11%
Equity company loss (income) 0.4 0.7 2.0
FX variation (Gain) Loss -1.0 -1.0
Finance cost 0.3 0.3 0.6 0.7 1.4
EBT -1.7 -1.5 -3.4 -4.5 -5.9
Provision for income tax -0.1 -0.4 -0.1 -0.9 -1.14
Net profit/loss -1.6 -1.1 -3.3 -3.6 -4.8
Financial statements
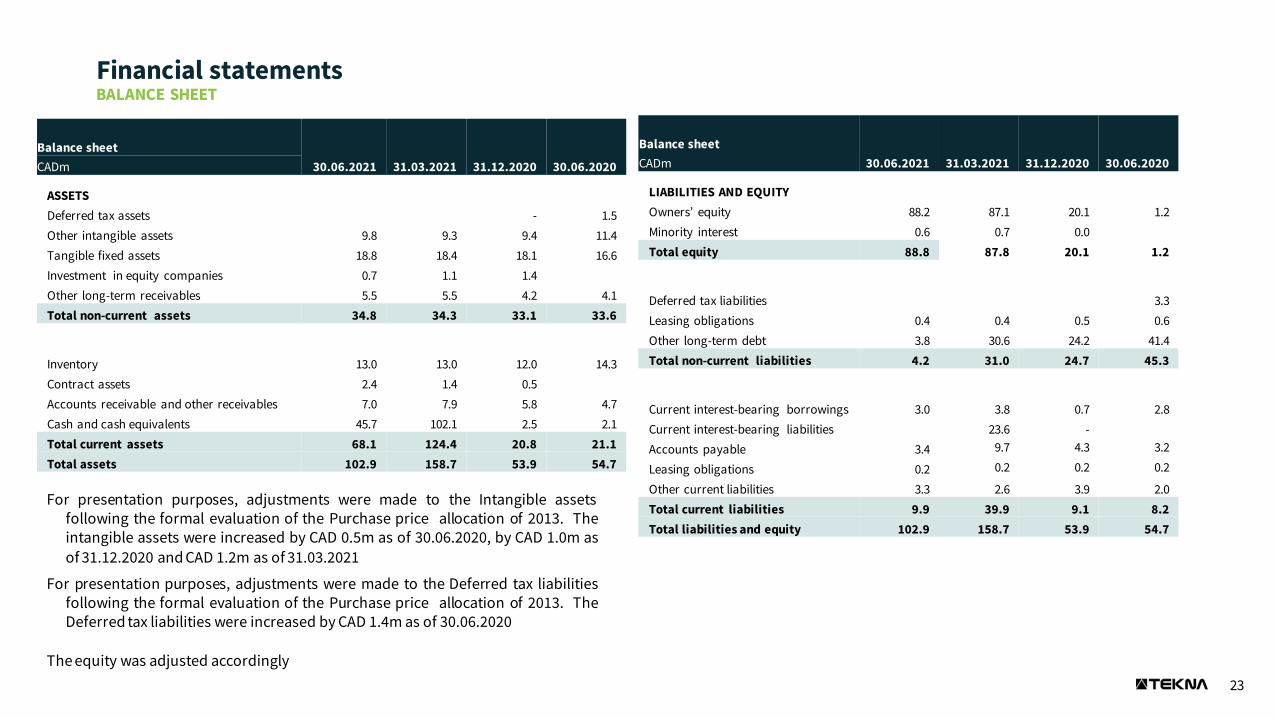
23
BALANCE SHEET
For presentation purposes, adjustments were made to the Intangible assetsfollowing the formal evaluation of the Purchase price allocation of 2013. Theintangible assets were increased by CAD 0.5m as of 30.06.2020, by CAD 1.0m asof 31.12.2020 and CAD 1.2m as of 31.03.2021
For presentation purposes, adjustments were made to the Deferred tax liabilitiesfollowing the formal evaluation of the Purchase price allocation of 2013. TheDeferred tax liabilities were increased by CAD 1.4m as of 30.06.2020
The equity was adjusted accordingly
Balance sheet
30.06.2021 31.03.2021 31.12.2020 30.06.2020CADm
ASSETS
Deferred tax assets - 1.5
Other intangible assets 9.8 9.3 9.4 11.4
Tangible fixed assets 18.8 18.4 18.1 16.6
Investment in equity companies 0.7 1.1 1.4
Other long-term receivables 5.5 5.5 4.2 4.1
Total non-current assets 34.8 34.3 33.1 33.6
Inventory 13.0 13.0 12.0 14.3
Contract assets 2.4 1.4 0.5
Accounts receivable and other receivables 7.0 7.9 5.8 4.7
Cash and cash equivalents 45.7 102.1 2.5 2.1
Total current assets 68.1 124.4 20.8 21.1
Total assets 102.9 158.7 53.9 54.7
Balance sheet
30.06.2021 31.03.2021 31.12.2020 30.06.2020CADm
LIABILITIES AND EQUITY
Owners’ equity 88.2 87.1 20.1 1.2
Minority interest 0.6 0.7 0.0
Total equity 88.8 87.8 20.1 1.2
Deferred tax liabilities 3.3
Leasing obligations 0.4 0.4 0.5 0.6
Other long-term debt 3.8 30.6 24.2 41.4
Total non-current liabilities 4.2 31.0 24.7 45.3
Current interest-bearing borrowings 3.0 3.8 0.7 2.8
Current interest-bearing liabilities 23.6 -
Accounts payable 3.4 9.7 4.3 3.2
Leasing obligations 0.2 0.2 0.2 0.2
Other current liabilities 3.3 2.6 3.9 2.0
Total current liabilities 9.9 39.9 9.1 8.2
Total liabilities and equity 102.9 158.7 53.9 54.7

Financial statements
24
CASH FLOW
Cash flow 2021 2021 2020
CADm Q2 Q1 Q2
Net profit -1.6 -1.7 -1.1
Depreciation and Amortization 0.8 0.8 1.0
Tax expense -0.4
Net financial items and Fx variation -0.6 0.3 0.3
Change in inventory, contract assets, receivables, payables and other liabilities -0.9 -4.6 -2.8
Share of profit from associates 0.4 0.3
Net cash from operations -1.9 -4.9 -3.0
Purchase of PPE and intangible assets -1.7 -1.0 -1.4
Other Investments activities -1.3 -0.1
Purchase of shares in subsidiaries 0.2 -23.7
Net cash from investing activities -1.5 -26.0 -1.5
Cashflow from issuance of stock -1.2 96.8
Proceeds from the issuance of shares in subsidiary 1.3
New long-term borrowings 0.1 0.1 0.1
Repayment of long-term borrowings -0.1 -0.1 -0.1
Internal loans and borrowings -50.4 30.1 3.6
Net change in current interest-bearing debt -0.8 3.1 -0.4
Interest paid -0.2 -0.2 -0.3
Net cash from financing activities -52.6 131.1 2.9
Cash flow -56.0 100.2 -1.6
FX adjustments -0.4 -0.6
Change in cash and cash equivalents -56.4 99.6 -1.6
Opening Balance for Cash assets 102.1 2.5 3.7
Closing Balance for Cash assets 45.7 102.1 2.1
Top Related