


Languages
Pages
Legal


© 2016 Nimble Storage | Confidential: Do Not Distribute
Q1 FY2017 Earnings Results
Suresh Vasudevan, Chief Executive Officer Anup Singh, Chief Financial Officer May 24, 2016

© 2016 Nimble Storage | Confidential: Do Not Distribute 2
Safe Harbor
This presentation and the accompanying oral presentation contain “forward-looking” statements that are based on our management’s beliefs and assumptions and on information currently available to management. We intend for such forward-looking statements to be covered by the safe harbor provisions for forward-looking statements contained in the U.S. Private Securities Litigation Reform Act of 1995. Forward-looking statements include all statements other than statements of historical fact contained in this presentation, including information concerning our financial outlook, business plans and objectives, potential growth opportunities, competitive position, industry environment and potential market opportunities.
Forward-looking statements are subject to known and unknown risks, uncertainties, assumptions and other factors including, but not limited to, those related to our future financial performance, market acceptance of our solutions, our ability to increase sales of our solutions, including to attract and retain customers and to selling additional solutions to our existing customers, our ability to develop new solutions and bring them to market in a timely manner, pricing pressure (as a result of competition or otherwise), our ability to maintain, protect and enhance our brand and intellectual property, global economic conditions and our ability to continue to expand our business and manage our growth. Moreover, we operate in very competitive and rapidly changing environments, and new risks may emerge from time to time. It is not possible for our management to predict all risks, nor can we assess the impact of all factors on our business or the extent to which any factor, or combination of factors, may cause actual results to differ materially from those contained in any forward-looking statements we may make. Further information on these and other factors that could affect our financial results are included in our filings we make with the Securities and Exchange Commission, and may cause our actual results, performance or achievements to differ materially and adversely from those anticipated or implied by our forward-looking statements.
You should not rely upon forward-looking statements as predictions of future events. Although our management believes that the expectations reflected in our forward-looking statements are reasonable, we cannot guarantee that the future results, levels of activity, performance or events and circumstances described in the forward-looking statements will be achieved or occur. Moreover, neither we, nor any other person, assume responsibility for the accuracy and completeness of the forward-looking statements. We undertake no obligation to publicly update any forward-looking statements for any reason after the date of this presentation to conform these statements to actual results or to changes in our expectations, except as required by law.
In addition to GAAP financial information, this presentation includes certain non-GAAP financial measures. The non-GAAP measures have limitations and you should not consider them in isolation or as a substitute for our GAAP financial information. There are limitations to the use of non-GAAP measures. For example, bookings and free cash flow are not substitutes for revenues or cash provided by operations. In addition, non-GAAP operating expenses exclude the impact of stock-based compensation expense, which is a recurring expense for us. See the Appendix for a reconciliation of these non-GAAP financial measures to their nearest GAAP equivalent.
© 2016 Nimble Storage | Confidential: Do Not Distribute 3
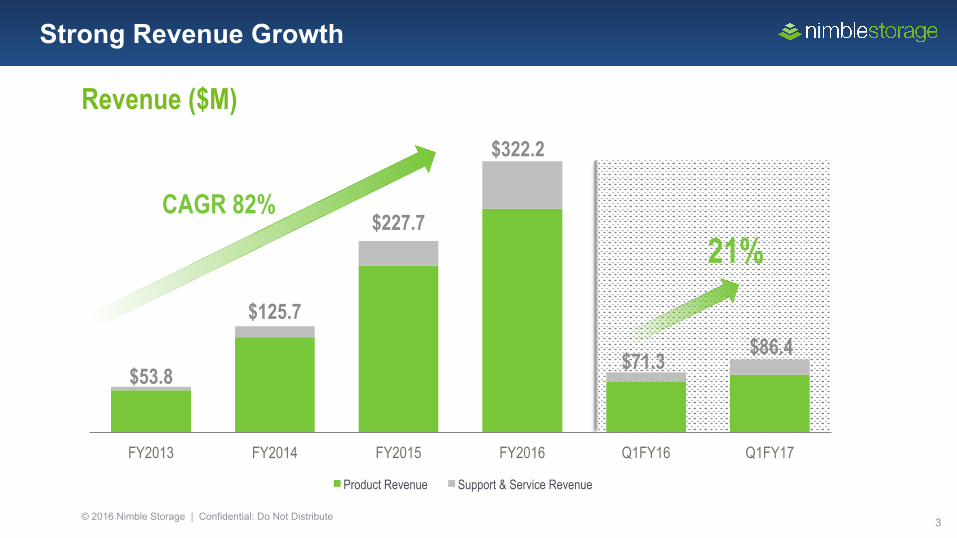
Revenue ($M)
$53.8
$125.7
$227.7
$322.2
$71.3 $86.4
FY2013 FY2014 FY2015 FY2016 Q1FY16 Q1FY17
Product Revenue Support & Service Revenue
CAGR 82%
21%
Strong Revenue Growth

© 2016 Nimble Storage | Confidential: Do Not Distribute 4
Strong Gross Margins While Investing to Drive Growth
Gross Margin*
*Reflects Non-GAAP Gross Margin, which excludes stock based compensation expense. See slide 19 for reconciliation. Long-term Gross Margin target range is 63%-65%. *Reflects Non-GAAP Gross Margin, which excludes stock based compensation expense. See slide 19 for reconciliation. Long-term Gross Margin target range is 63%-65%.
*Reflects Non-GAAP Gross Margin, which excludes stock based compensation expense. See slide 19 for reconciliation. Long-term Gross Margin target range is 63%-65%.
*Reflects Non-GAAP Gross Margin, which excludes stock based compensation expense. See slide 14 for reconciliation. Long-term Gross Margin target range is 63%-65%.
Operating* & EBITDA Margin
-36%
-22%
-11%
-23%
-34%
-17%
-6%
-17%
Q1FY14 Q1FY15 Q1FY16 Q1FY17
Operating Margin Adjusted EBITDA Margin
61.8%
66.2% 67.6%
65.7%
Q1FY14 Q1FY15 Q1FY16 Q1FY17
Long Term Gross Margin Target Range 63%-65%*

© 2016 Nimble Storage | Confidential: Do Not Distribute 5
Average Annual Bookings per Commercial Sales Team
Year 1 Year 2 Year 3
Average Bookings per Sales Team to Support Break Even Target
Average Bookings per Sales Team to Support Long-Term Profitability Target
Commercial sales teams operate above breakeven levels of productivity during their 2nd year and at target operating margin levels in their 3rd year.
Improving Sales Productivity Drives Business Model
© 2016 Nimble Storage | Confidential: Do Not Distribute 6
Cash Balance Remains Very Healthy
*Reflects Non-GAAP Operating Margin, which excludes stock based compensation expense. See slide 19 for reconciliation
Cash Flow from Operations ($M) Free Cash Flow ($M)
$204.3
$201.5
$203.0
Q1FY15 Q1FY16 Q1FY17
Ending Cash ($M) $0.5
-$8.3 -$8.3
Q1FY15 Q1FY16 Q1FY17
-$3.3
-$16.4 -$15.1
Q1FY15 Q1FY16 Q1FY17

© 2016 Nimble Storage | Confidential: Do Not Distribute 7
Strategy For Revenue Growth
Diversified Customer Base
Continued expansion into international, large enterprise and service
provider customers
New Customer Acquisition
Invest aggressively to deepen sales coverage within existing territories,
increase opportunities and drive channel leverage
Larger Transactions
Expansion into larger transactions with unique Scale-to-fit capabilities, AFA and FC
Land & Expand Drive repeat business with rapidly growing install base through InfoSight predictive analytics and
industry leading customer satisfaction Driving
Revenue Growth

© 2016 Nimble Storage | Confidential: Do Not Distribute 8
Rapid Pace of New Customer Acquisition
Cumulative Customer Base*
3,100
5,500
8,200
Q1FY15 Q1FY16 Q1FY17 *Rounded to the nearest hundred
+2400 customers
+2700 customers

© 2016 Nimble Storage | Confidential: Do Not Distribute 9
Land And Expand Drives Repeat Business
Cumulative Bookings
44% 49%
56% 51%
TTM Q1FY16 TTM Q1FY17
Existing Customers New Customers
% New vs. Existing Customer Bookings
1.4X
1.9X
2.5X
1.8X
2.7X
3.8X
2.0X
2.9X
4.2X
Year 1 Year 2 Year 3
Overall Repeat Bookings Enterprise Repeat Bookings Cloud SP Repeat Bookings
© 2016 Nimble Storage | Confidential: Do Not Distribute 10
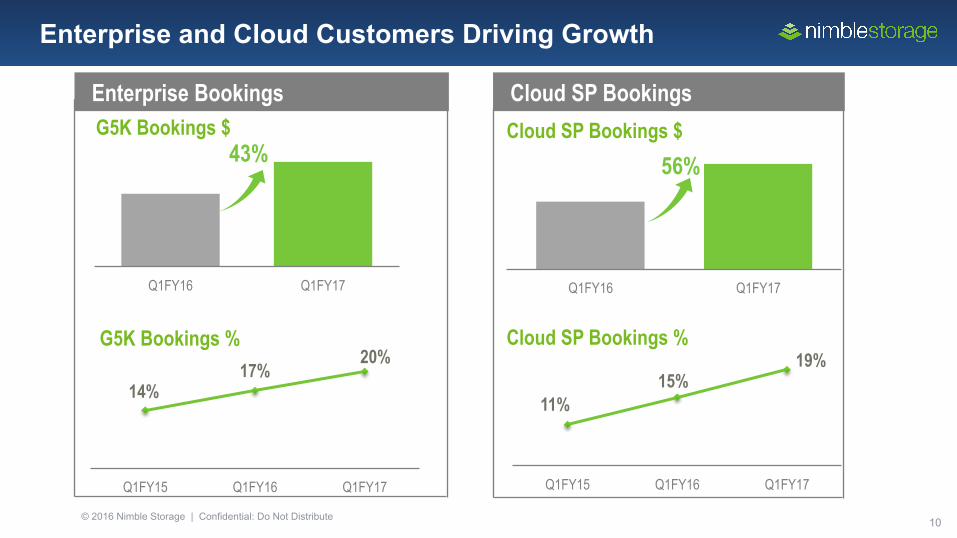
Enterprise and Cloud Customers Driving Growth
Enterprise Bookings G5K Bookings $
Cloud SP Bookings Cloud SP Bookings $
G5K Bookings %
43%
Q1FY16 Q1FY17
14% 17%
20%
Q1FY15 Q1FY16 Q1FY17
56%
Q1FY16 Q1FY17
Cloud SP Bookings %
11% 15%
19%
Q1FY15 Q1FY16 Q1FY17
© 2016 Nimble Storage | Confidential: Do Not Distribute 11
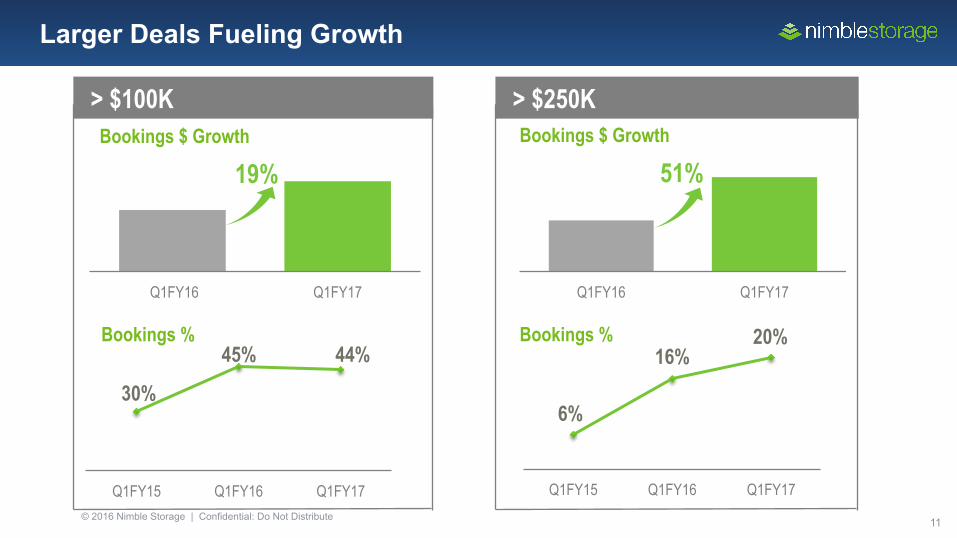
Larger Deals Fueling Growth
Bookings %
Bookings $ Growth
19%
Q1FY16 Q1FY17
> $100K Bookings $ Growth
> $250K
51%
Q1FY16 Q1FY17
30%
45% 44%
Q1FY15 Q1FY16 Q1FY17
Bookings %
6%
16% 20%
Q1FY15 Q1FY16 Q1FY17

© 2016 Nimble Storage | Confidential: Do Not Distribute 12
Q2 Fiscal Year 2017 Financial Guidance
Q2 FY17 Guidance
Revenue $93.0M ~ $96.0M
Non-GAAP Operating Loss* ($16.0M) ~ ($18.0M)
Non-GAAP EPS* ($0.19) ~ ($0.21)
Weighted Average Basic Shares Outstanding ~ 85.0M
*Reflects Non-GAAP operating loss and EPS which excludes stock based compensation expense. See slide 14 for reconciliation.
© 2016 Nimble Storage | Confidential: Do Not Distribute 13
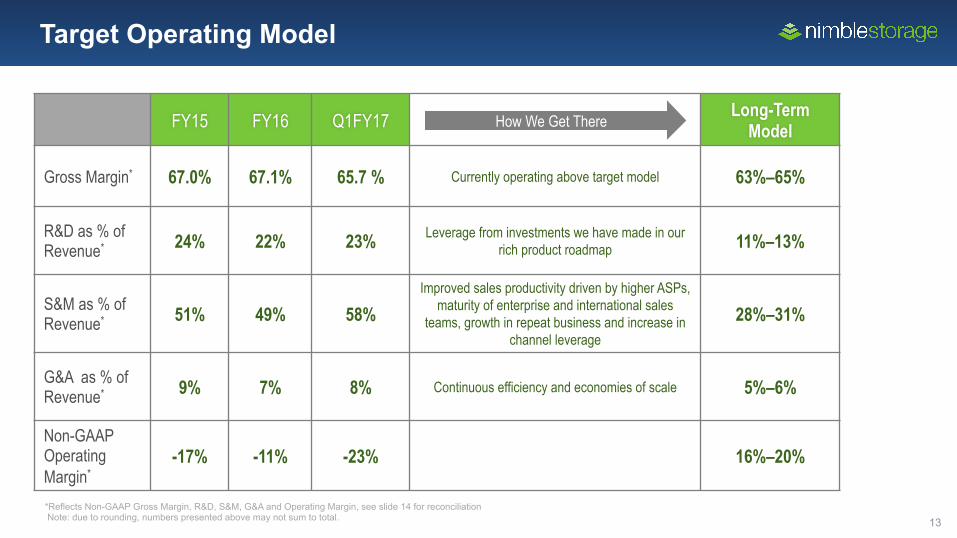
Target Operating Model
*Reflects Non-GAAP Gross Margin, R&D, S&M, G&A and Operating Margin, see slide 14 for reconciliation Note: due to rounding, numbers presented above may not sum to total.
FY15 FY16 Q1FY17 Long-Term Model
Gross Margin* 67.0% 67.1% 65.7 % Currently operating above target model 63%–65%
R&D as % of Revenue* 24% 22% 23% Leverage from investments we have made in our
rich product roadmap 11%–13%
S&M as % of Revenue* 51% 49% 58%
Improved sales productivity driven by higher ASPs, maturity of enterprise and international sales
teams, growth in repeat business and increase in channel leverage
28%–31%
G&A as % of Revenue* 9% 7% 8% Continuous efficiency and economies of scale 5%–6%
Non-GAAP Operating Margin*
-17% -11% -23% 16%–20%
How We Get There
© 2016 Nimble Storage | Confidential: Do Not Distribute 14
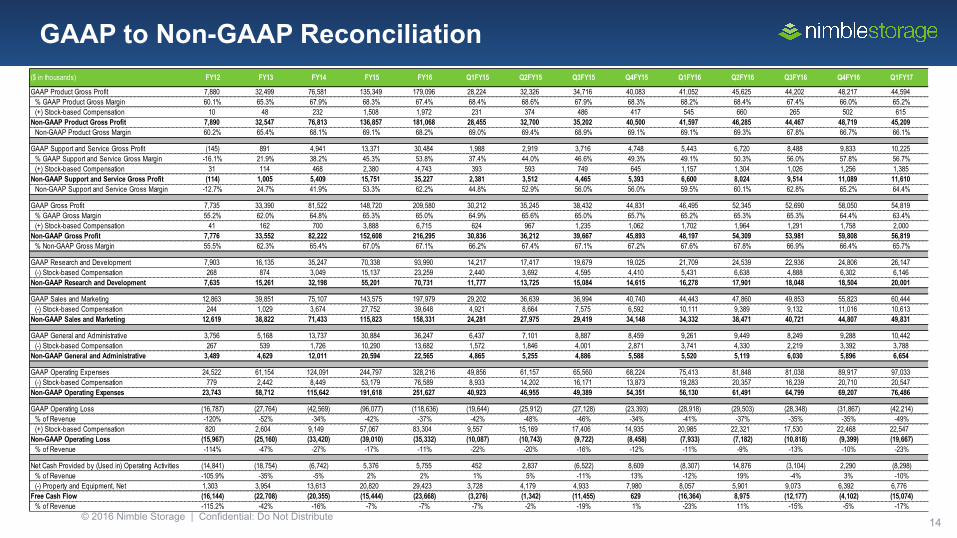
GAAP to Non-GAAP Reconciliation ($ in thousands) FY12 FY13 FY14 FY15 FY16 Q1FY15 Q2FY15 Q3FY15 Q4FY15 Q1FY16 Q2FY16 Q3FY16 Q4FY16 Q1FY17
GAAP Product Gross Profit 7,880 32,499 76,581 135,349 179,096 28,224 32,326 34,716 40,083 41,052 45,625 44,202 48,217 44,594% GAAP Product Gross Margin 60.1% 65.3% 67.9% 68.3% 67.4% 68.4% 68.6% 67.9% 68.3% 68.2% 68.4% 67.4% 66.0% 65.2%(+) Stock-based Compensation 10 48 232 1,508 1,972 231 374 486 417 545 660 265 502 615
Non-GAAP Product Gross Profit 7,890 32,547 76,813 136,857 181,068 28,455 32,700 35,202 40,500 41,597 46,285 44,467 48,719 45,209Non-GAAP Product Gross Margin 60.2% 65.4% 68.1% 69.1% 68.2% 69.0% 69.4% 68.9% 69.1% 69.1% 69.3% 67.8% 66.7% 66.1%
GAAP Support and Service Gross Profit (145) 891 4,941 13,371 30,484 1,988 2,919 3,716 4,748 5,443 6,720 8,488 9,833 10,225% GAAP Support and Service Gross Margin -16.1% 21.9% 38.2% 45.3% 53.8% 37.4% 44.0% 46.6% 49.3% 49.1% 50.3% 56.0% 57.8% 56.7%(+) Stock-based Compensation 31 114 468 2,380 4,743 393 593 749 645 1,157 1,304 1,026 1,256 1,385
Non-GAAP Support and Service Gross Profit (114) 1,005 5,409 15,751 35,227 2,381 3,512 4,465 5,393 6,600 8,024 9,514 11,089 11,610Non-GAAP Support and Service Gross Margin -12.7% 24.7% 41.9% 53.3% 62.2% 44.8% 52.9% 56.0% 56.0% 59.5% 60.1% 62.8% 65.2% 64.4%
GAAP Gross Profit 7,735 33,390 81,522 148,720 209,580 30,212 35,245 38,432 44,831 46,495 52,345 52,690 58,050 54,819% GAAP Gross Margin 55.2% 62.0% 64.8% 65.3% 65.0% 64.9% 65.6% 65.0% 65.7% 65.2% 65.3% 65.3% 64.4% 63.4%(+) Stock-based Compensation 41 162 700 3,888 6,715 624 967 1,235 1,062 1,702 1,964 1,291 1,758 2,000
Non-GAAP Gross Profit 7,776 33,552 82,222 152,608 216,295 30,836 36,212 39,667 45,893 48,197 54,309 53,981 59,808 56,819% Non-GAAP Gross Margin 55.5% 62.3% 65.4% 67.0% 67.1% 66.2% 67.4% 67.1% 67.2% 67.6% 67.8% 66.9% 66.4% 65.7%
GAAP Research and Development 7,903 16,135 35,247 70,338 93,990 14,217 17,417 19,679 19,025 21,709 24,539 22,936 24,806 26,147(-) Stock-based Compensation 268 874 3,049 15,137 23,259 2,440 3,692 4,595 4,410 5,431 6,638 4,888 6,302 6,146
Non-GAAP Research and Development 7,635 15,261 32,198 55,201 70,731 11,777 13,725 15,084 14,615 16,278 17,901 18,048 18,504 20,001
GAAP Sales and Marketing 12,863 39,851 75,107 143,575 197,979 29,202 36,639 36,994 40,740 44,443 47,860 49,853 55,823 60,444(-) Stock-based Compensation 244 1,029 3,674 27,752 39,648 4,921 8,664 7,575 6,592 10,111 9,389 9,132 11,016 10,613
Non-GAAP Sales and Marketing 12,619 38,822 71,433 115,823 158,331 24,281 27,975 29,419 34,148 34,332 38,471 40,721 44,807 49,831
GAAP General and Administrative 3,756 5,168 13,737 30,884 36,247 6,437 7,101 8,887 8,459 9,261 9,449 8,249 9,288 10,442(-) Stock-based Compensation 267 539 1,726 10,290 13,682 1,572 1,846 4,001 2,871 3,741 4,330 2,219 3,392 3,788
Non-GAAP General and Administrative 3,489 4,629 12,011 20,594 22,565 4,865 5,255 4,886 5,588 5,520 5,119 6,030 5,896 6,654
GAAP Operating Expenses 24,522 61,154 124,091 244,797 328,216 49,856 61,157 65,560 68,224 75,413 81,848 81,038 89,917 97,033(-) Stock-based Compensation 779 2,442 8,449 53,179 76,589 8,933 14,202 16,171 13,873 19,283 20,357 16,239 20,710 20,547
Non-GAAP Operating Expenses 23,743 58,712 115,642 191,618 251,627 40,923 46,955 49,389 54,351 56,130 61,491 64,799 69,207 76,486
GAAP Operating Loss (16,787) (27,764) (42,569) (96,077) (118,636) (19,644) (25,912) (27,128) (23,393) (28,918) (29,503) (28,348) (31,867) (42,214)% of Revenue -120% -52% -34% -42% -37% -42% -48% -46% -34% -41% -37% -35% -35% -49%(+) Stock-based Compensation 820 2,604 9,149 57,067 83,304 9,557 15,169 17,406 14,935 20,985 22,321 17,530 22,468 22,547
Non-GAAP Operating Loss (15,967) (25,160) (33,420) (39,010) (35,332) (10,087) (10,743) (9,722) (8,458) (7,933) (7,182) (10,818) (9,399) (19,667)% of Revenue -114% -47% -27% -17% -11% -22% -20% -16% -12% -11% -9% -13% -10% -23%
Net Cash Provided by (Used in) Operating Activities (14,841) (18,754) (6,742) 5,376 5,755 452 2,837 (6,522) 8,609 (8,307) 14,876 (3,104) 2,290 (8,298)% of Revenue -105.9% -35% -5% 2% 2% 1% 5% -11% 13% -12% 19% -4% 3% -10%(-) Property and Equipment, Net 1,303 3,954 13,613 20,820 29,423 3,728 4,179 4,933 7,980 8,057 5,901 9,073 6,392 6,776
Free Cash Flow (16,144) (22,708) (20,355) (15,444) (23,668) (3,276) (1,342) (11,455) 629 (16,364) 8,975 (12,177) (4,102) (15,074)% of Revenue -115.2% -42% -16% -7% -7% -7% -2% -19% 1% -23% 11% -15% -5% -17%
Top Related