


![Prsa philly 1.0[1]](https://static.fdocuments.us/doc/165x107/54c0420b4a795954368b458e/prsa-philly-101.jpg)
Languages
Pages
Legal

Measure What Matters: Monitoring and Measurement
in the New Media World
Katie Delahaye Paine, CEOPaine PublishingJan. 22, 2015
www.painepublishing.com
[email protected] | @queenofmetrics
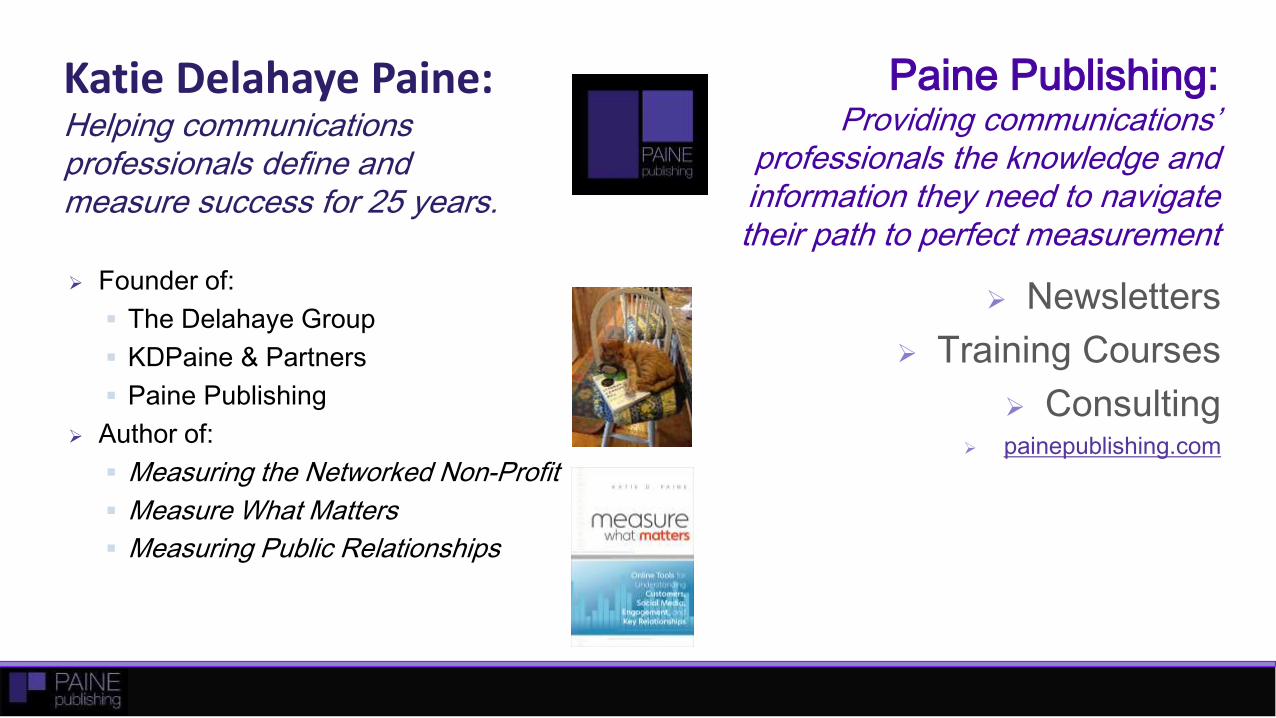
Paine Publishing:Providing communications’
professionals the knowledge and information they need to navigate their path to perfect measurement
Newsletters
Training Courses
Consulting painepublishing.com
Katie Delahaye Paine:Helping communications professionals define and measure success for 25 years.
Founder of:
The Delahaye Group
KDPaine & Partners
Paine Publishing
Author of:
Measuring the Networked Non-Profit
Measure What Matters
Measuring Public Relationships
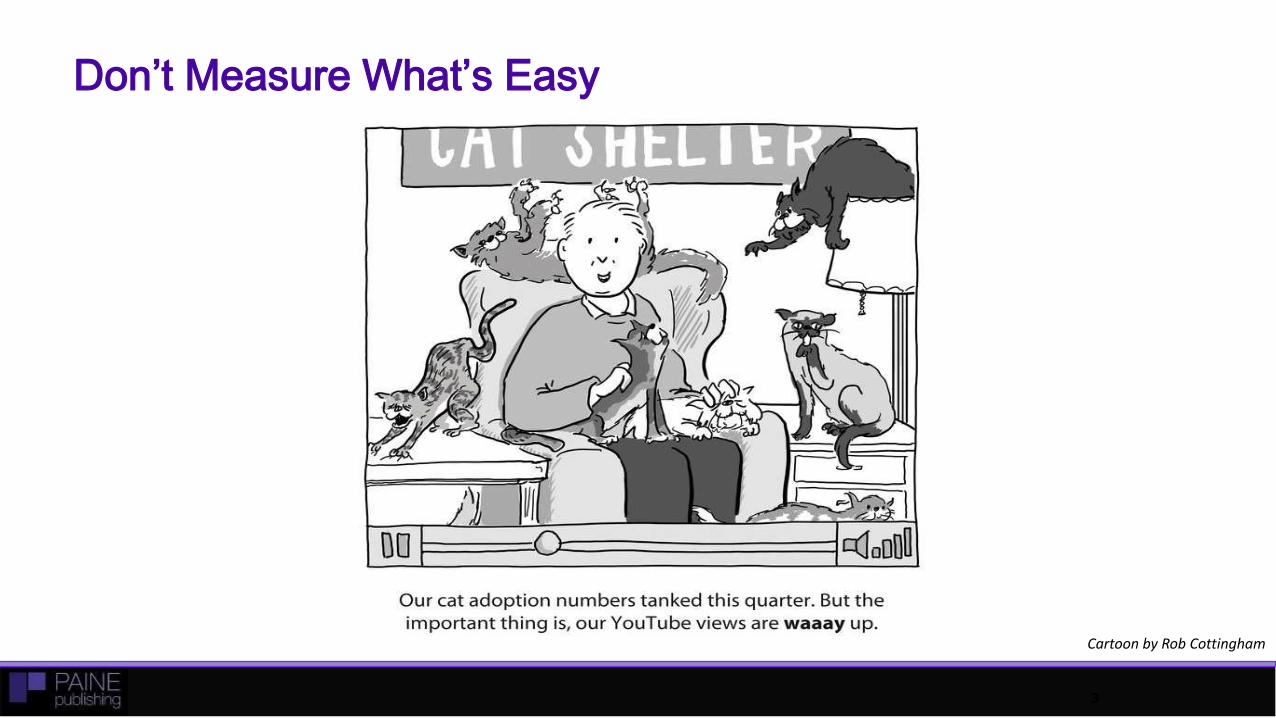
Don’t Measure What’s Easy
3
Cartoon by Rob Cottingham

Measure What Matters
25/02/2015News Group International 4
Cartoon by Rob Cottingham
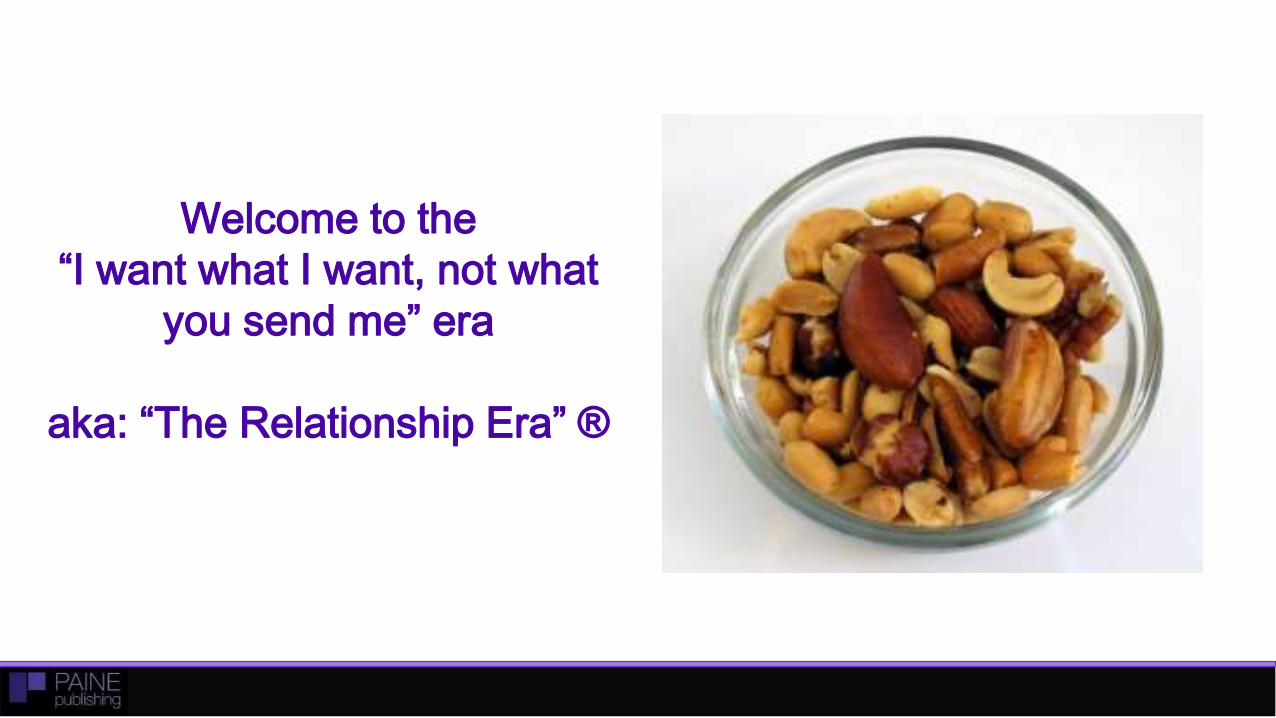
Welcome to the
“I want what I want, not what
you send me” era
aka: “The Relationship Era” ®
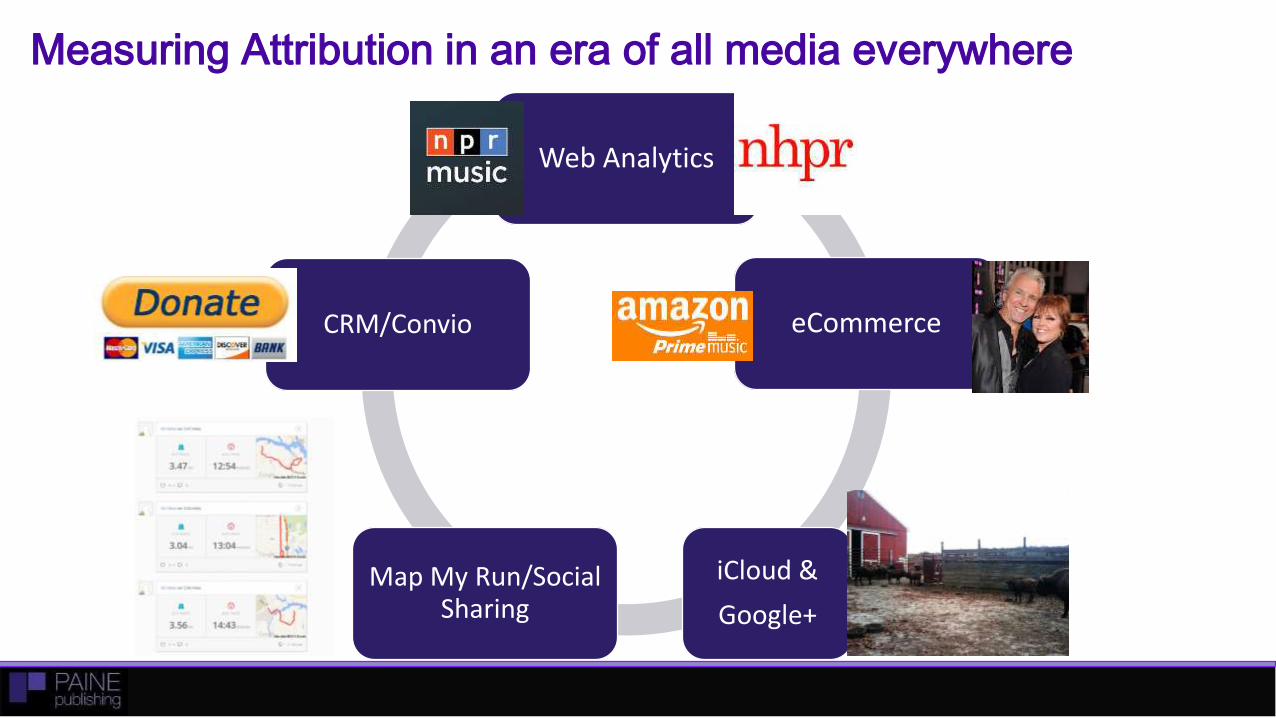
Measuring Attribution in an era of all media everywhere
Web Analytics
eCommerce
iCloud &
Google+
Map My Run/Social Sharing
CRM/Convio
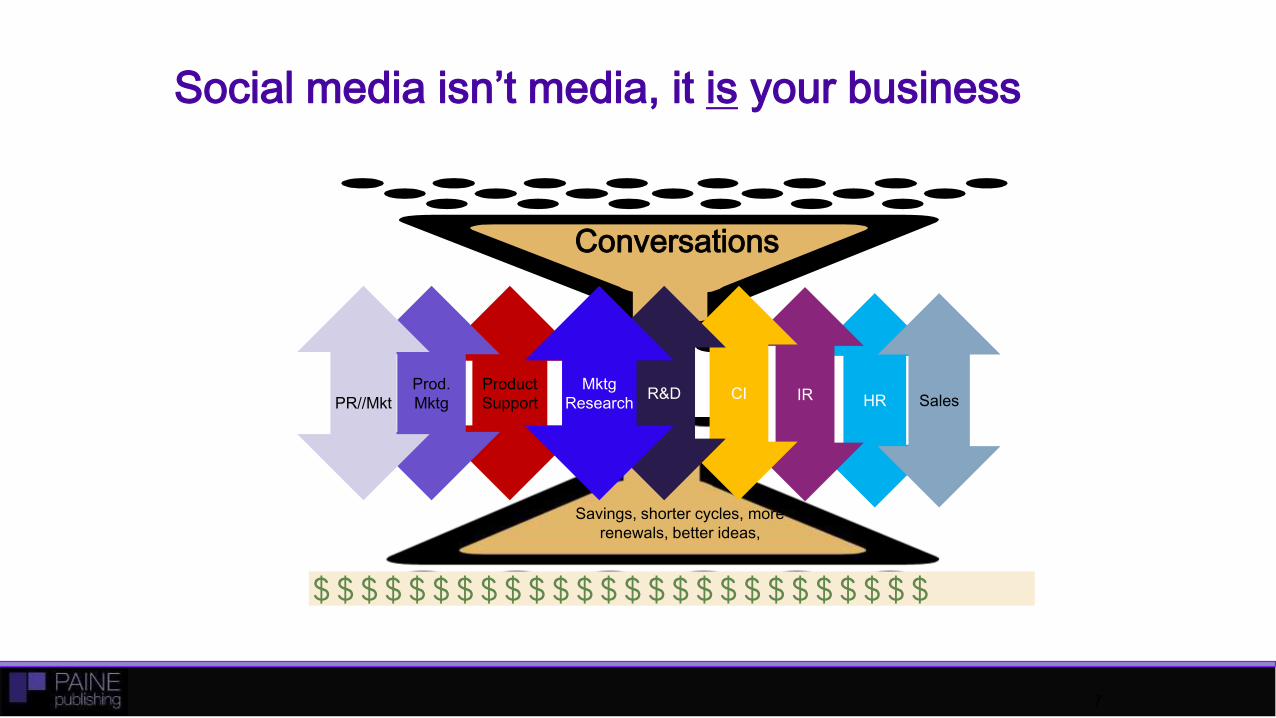
Conversations
$$$$$$$$$$$$$$$$$$$$$$$$$$
Savings, shorter cycles, more
renewals, better ideas,
Product
Support HRIR SalesCIR&DMktg
Research
Prod.
MktgPR//Mkt
7
Social media isn’t media, it is your business
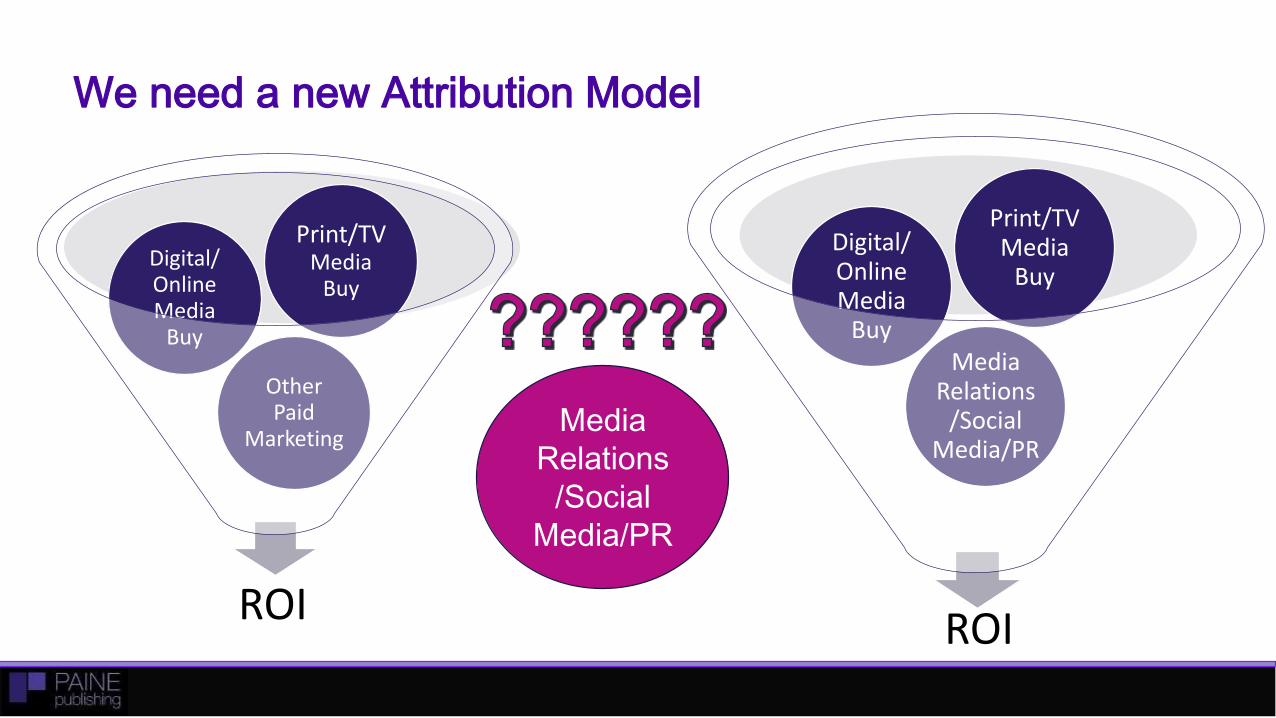
We need a new Attribution Model
ROI
Other Paid
Marketing
Digital/ Online Media
Buy
Print/TVMedia
Buy
ROI
Media Relations
/Social Media/PR
Digital/ Online Media
Buy
Print/TVMedia
Buy
Media
Relations
/Social
Media/PR
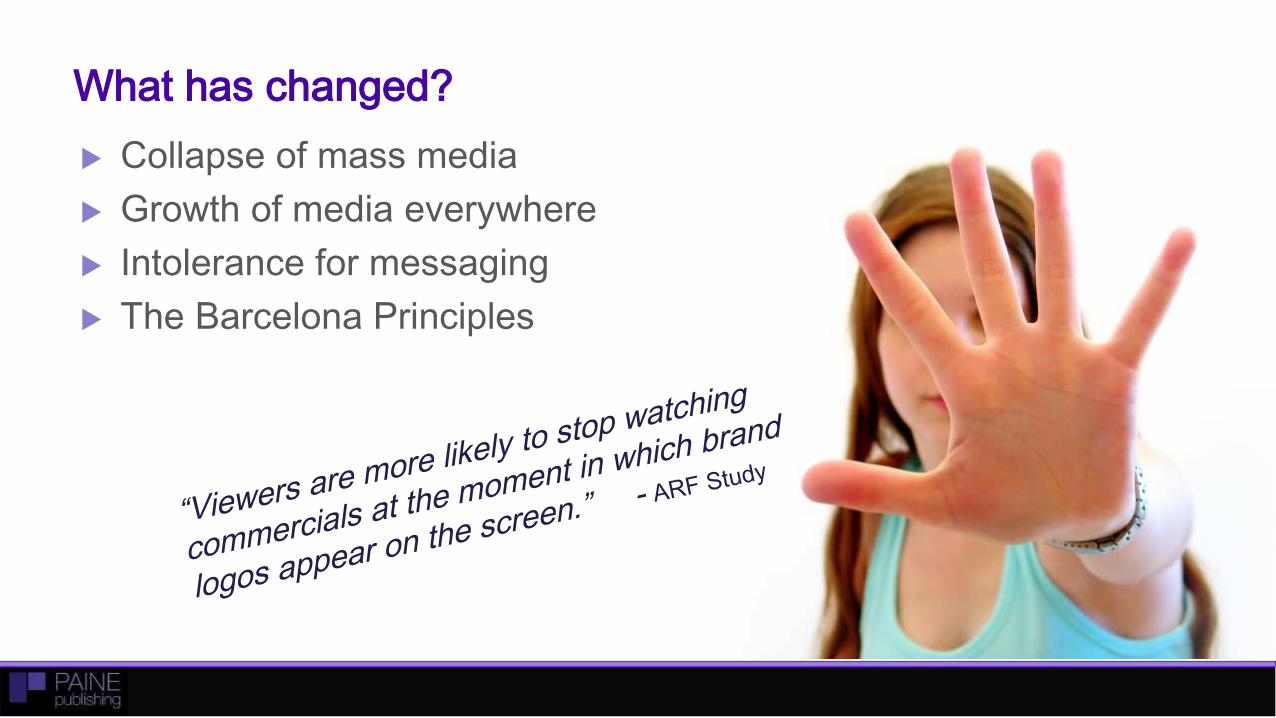
What has changed?
Collapse of mass media
Growth of media everywhere
Intolerance for messaging
The Barcelona Principles
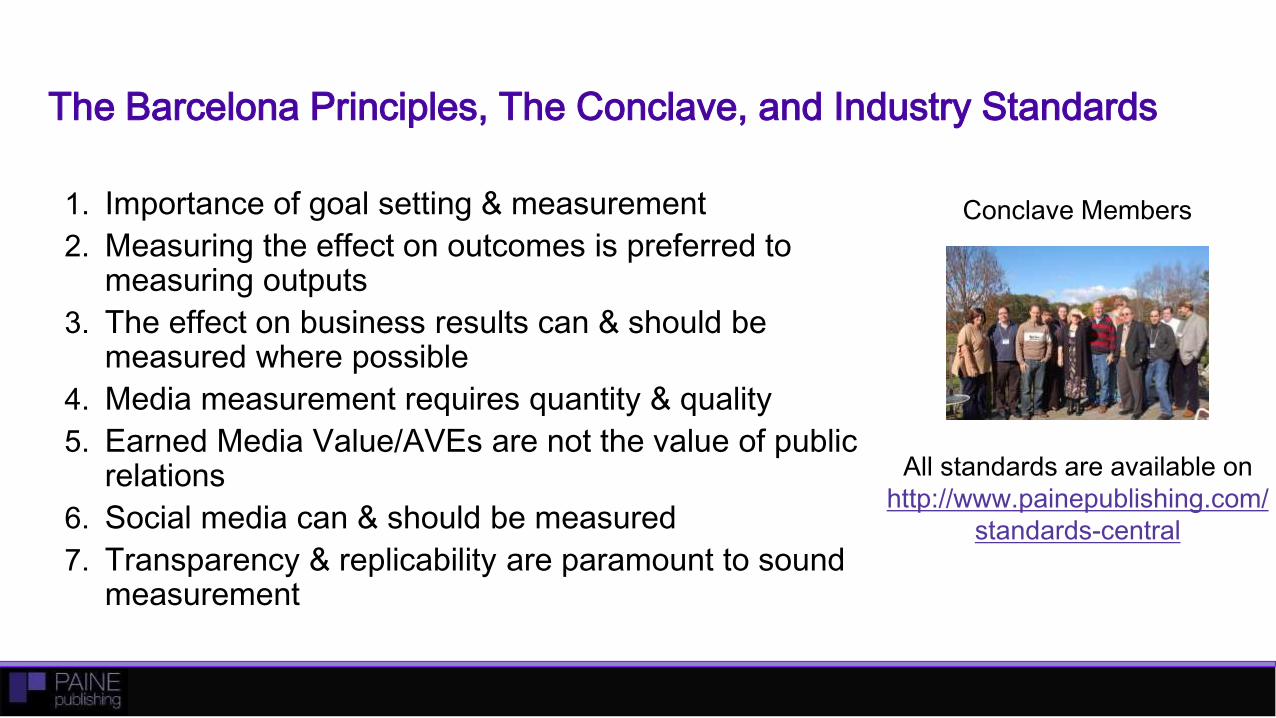
The Barcelona Principles, The Conclave, and Industry Standards
1. Importance of goal setting & measurement
2. Measuring the effect on outcomes is preferred to measuring outputs
3. The effect on business results can & should be measured where possible
4. Media measurement requires quantity & quality
5. Earned Media Value/AVEs are not the value of public relations
6. Social media can & should be measured
7. Transparency & replicability are paramount to sound measurement
All standards are available on
http://www.painepublishing.com/
standards-central
Conclave Members
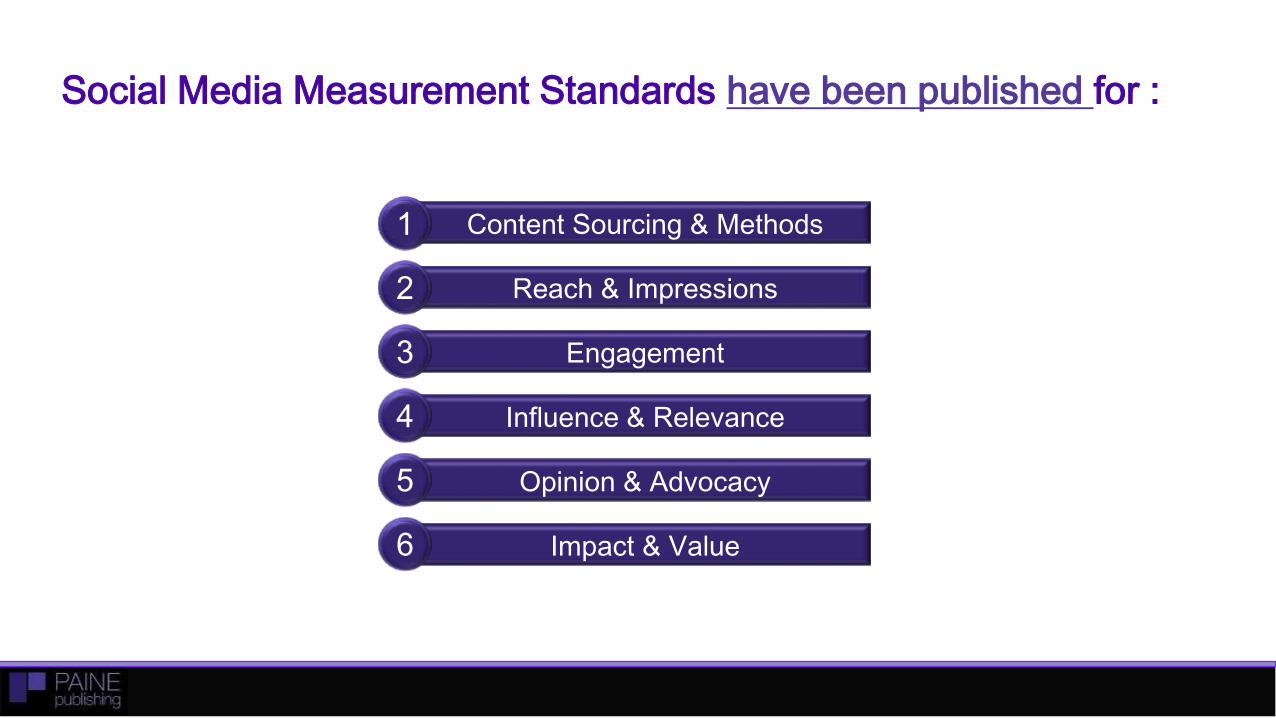
Social Media Measurement Standards have been published for :
Content Sourcing & Methods1
Reach & Impressions2
Engagement3
Influence & Relevance4
Opinion & Advocacy5
Impact & Value6
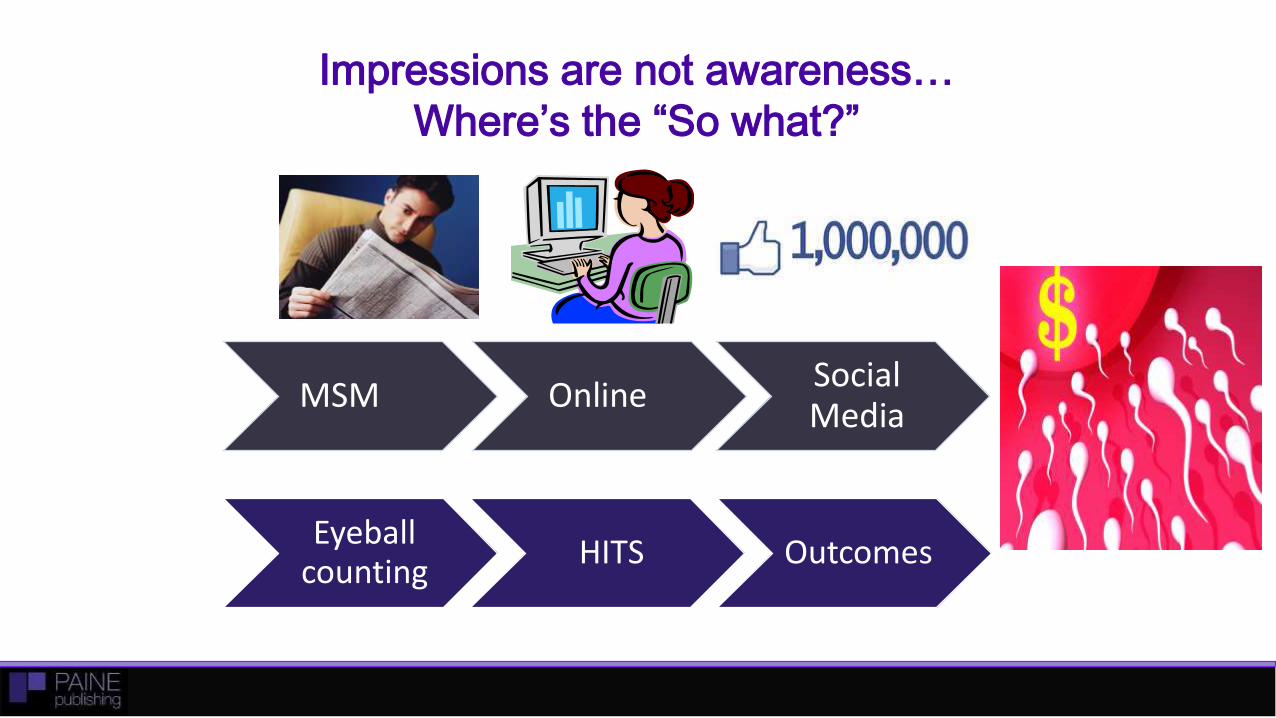
Eyeball counting
HITS Outcomes
MSM OnlineSocial Media
Impressions are not awareness…
Where’s the “So what?”
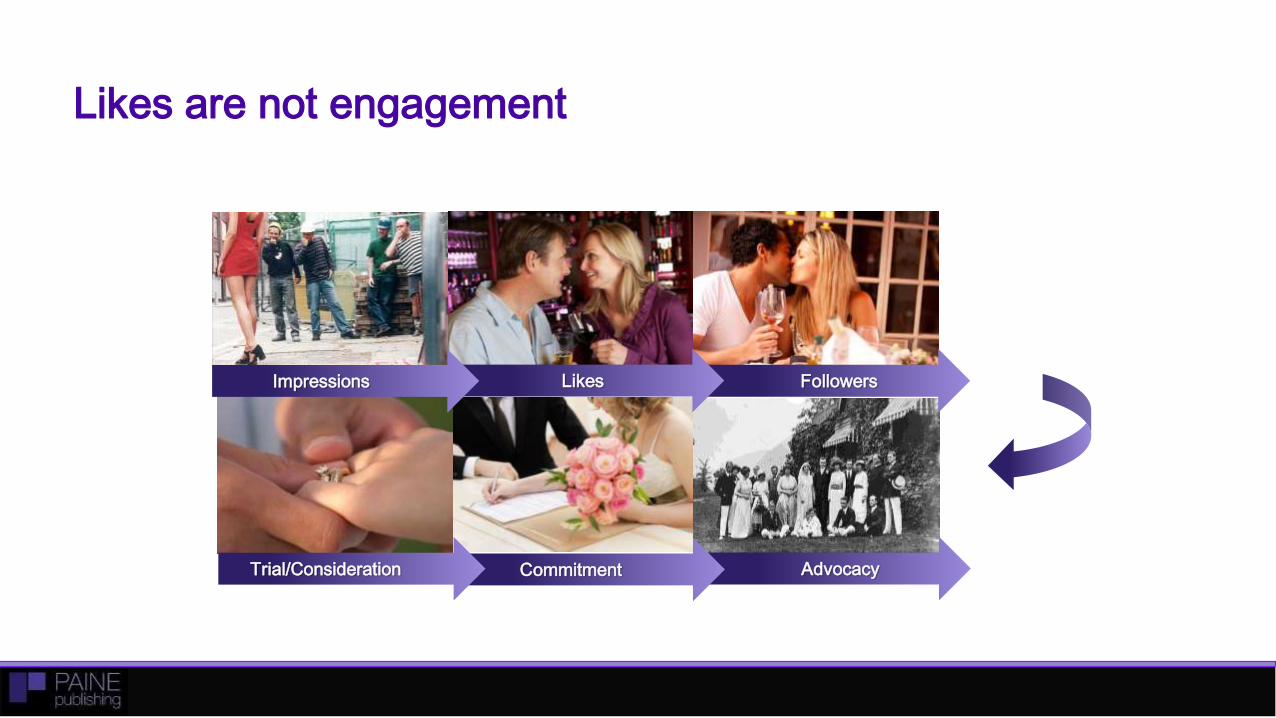
Likes are not engagement
AdvocacyCommitmentTrial/Consideration
FollowersLikesImpressions
• Influence happens when you are persuaded to change behavior or opinion that
would otherwise not have changed.
• Influence can be attributed to either an outlet or an individual.
• Influence happens online and off line and both should be considered
• Should include some combination of the following five elements:
• Reach
• Engagement around individual
• Relevance to topic
• Frequency of posts around the topic
• Audience impact as measured by the ability to get the target audience to
change behavior or opinion.
• If an individual scores a 0 on one element, they have no influence
• Influence cannot be expressed in a single score or algorithm
#4: Influence & Relevance
#5 Standards for Measuring Tone/Sentiment
Whatever process is defined and applied, it must be used
consistently throughout any analysis.
Sentiment reliability varies by vendor and approach – therefore
coding definitions, consistency and transparency are critical.
Opinions, recommendations and other qualitative measures are
typically more valuable than raw sentiment and increasingly
measurable:
Opinions (“It’s a good product”)
Recommendations (“try it” or “avoid it”)
Feeling/Emotions (“That product makes me feel happy”)
Intended action (“I’m going to buy that product tomorrow”)
• Impact and value will always be dependent on client objectives
• Need to define outcomes in advance – will likely span multiple business
goals, especially for social (crosses disciplines)
• “ROI” should be strictly limited to measurable financial impact; “total
value” can be used for financial and non-financial impact combination
• Value can be calculated in positive returns (sales, reputation, etc.) or
avoided negative returns (risk mitigated, costs avoided)
• Key performance indicators and balanced scorecards are helpful to
connect social media impact to business results/language
#6: Impact & Value
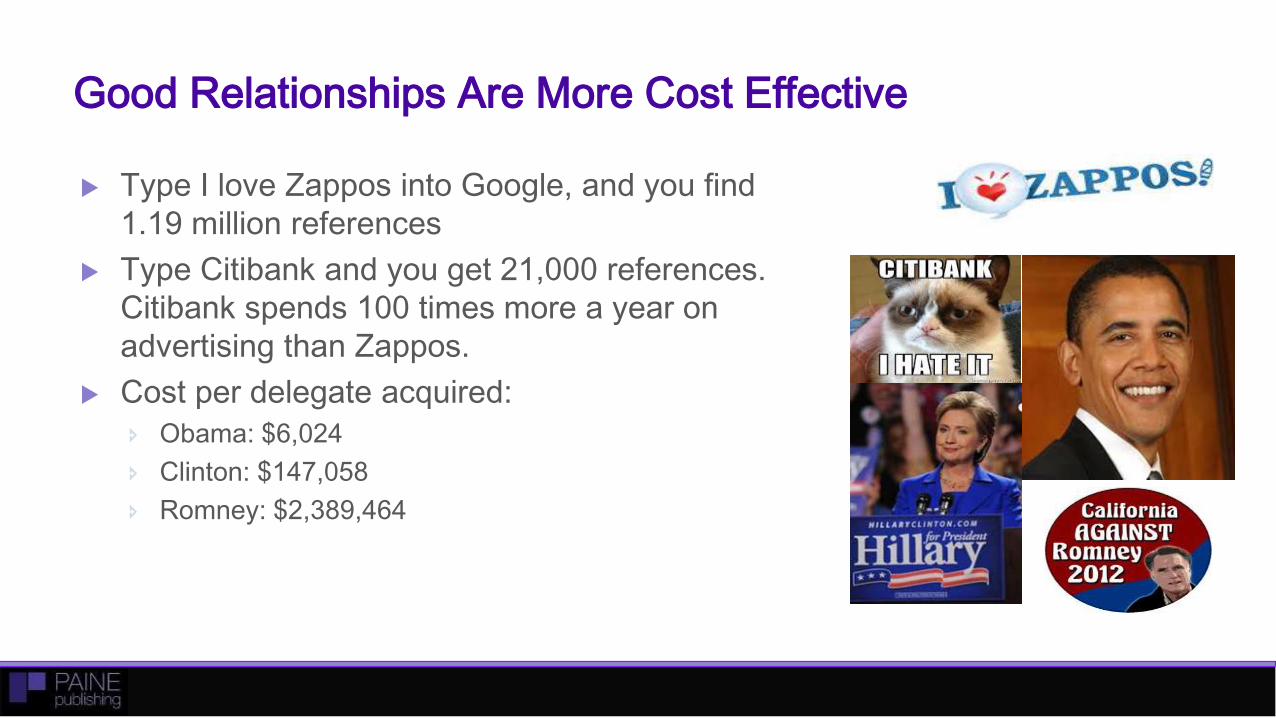
Good Relationships Are More Cost Effective
Type I love Zappos into Google, and you find
1.19 million references
Type Citibank and you get 21,000 references.
Citibank spends 100 times more a year on
advertising than Zappos.
Cost per delegate acquired:
Obama: $6,024
Clinton: $147,058
Romney: $2,389,464
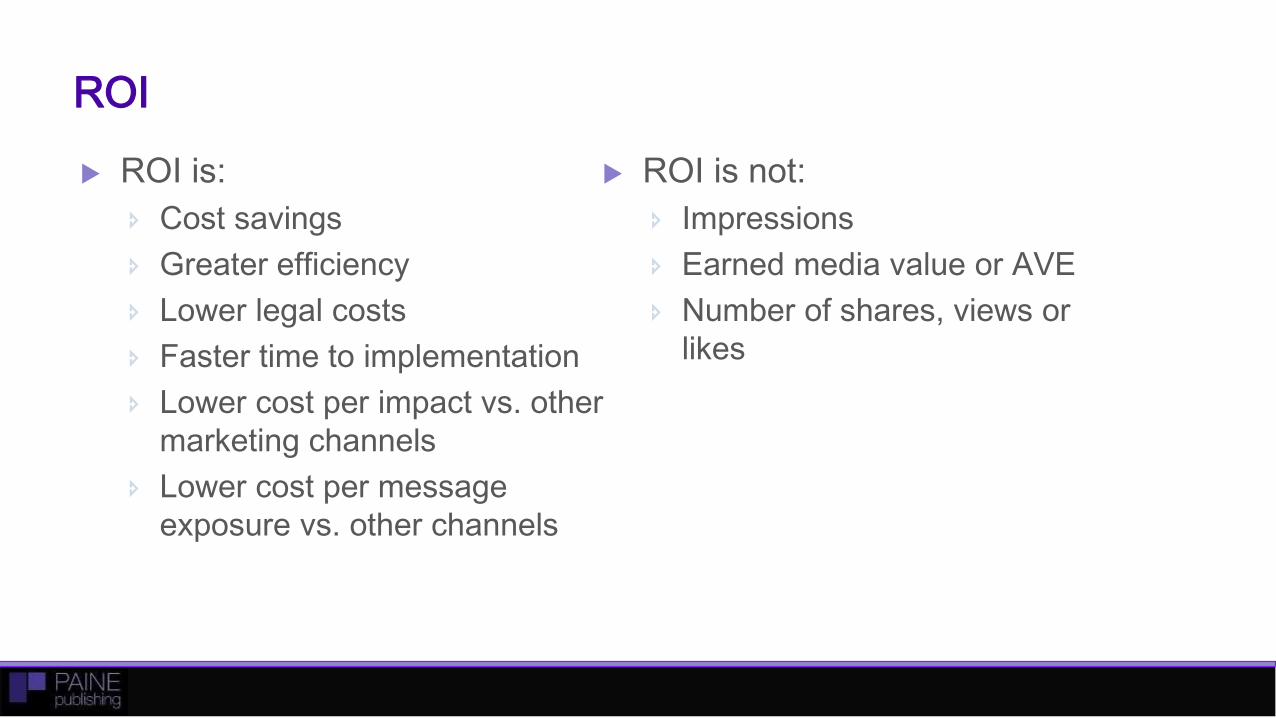
ROI
ROI is:
Cost savings
Greater efficiency
Lower legal costs
Faster time to implementation
Lower cost per impact vs. other
marketing channels
Lower cost per message
exposure vs. other channels
ROI is not:
Impressions
Earned media value or AVE
Number of shares, views or
likes
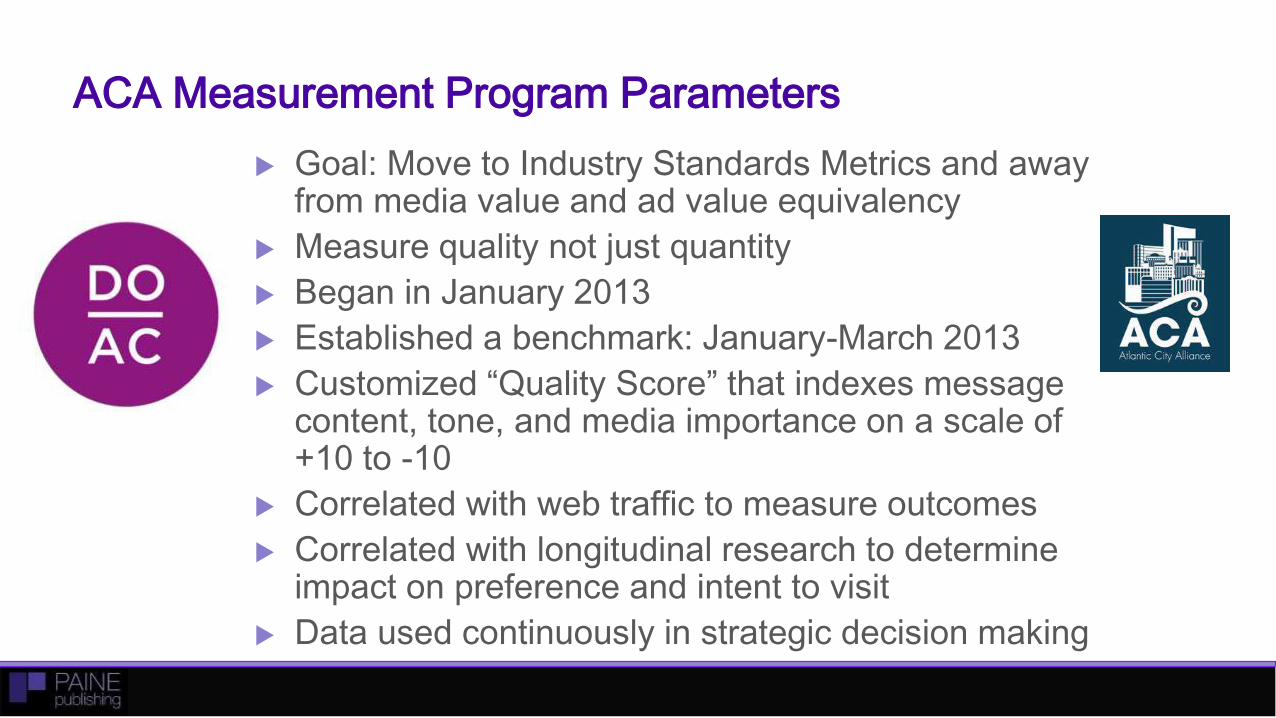
ACA Measurement Program Parameters
Goal: Move to Industry Standards Metrics and away from media value and ad value equivalency
Measure quality not just quantity
Began in January 2013
Established a benchmark: January-March 2013
Customized “Quality Score” that indexes message content, tone, and media importance on a scale of +10 to -10
Correlated with web traffic to measure outcomes
Correlated with longitudinal research to determine impact on preference and intent to visit
Data used continuously in strategic decision making
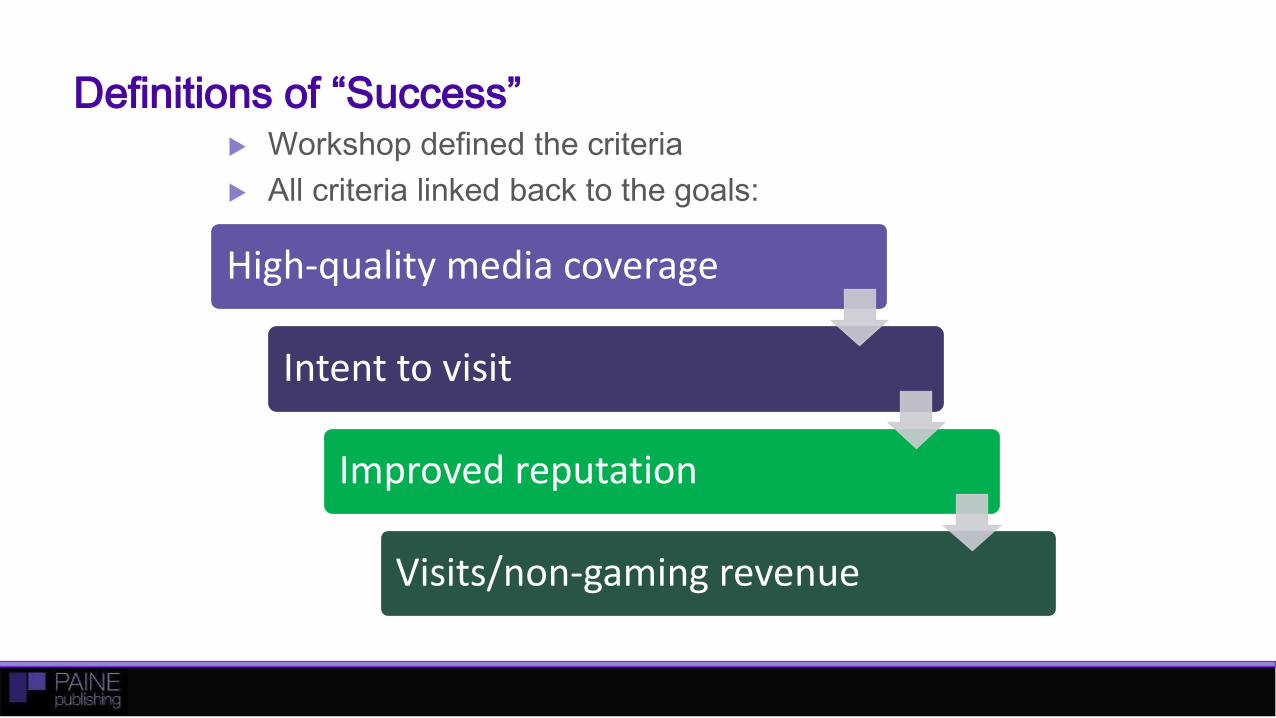
Definitions of “Success” Workshop defined the criteria
All criteria linked back to the goals:
High-quality media coverage
Intent to visit
Improved reputation
Visits/non-gaming revenue
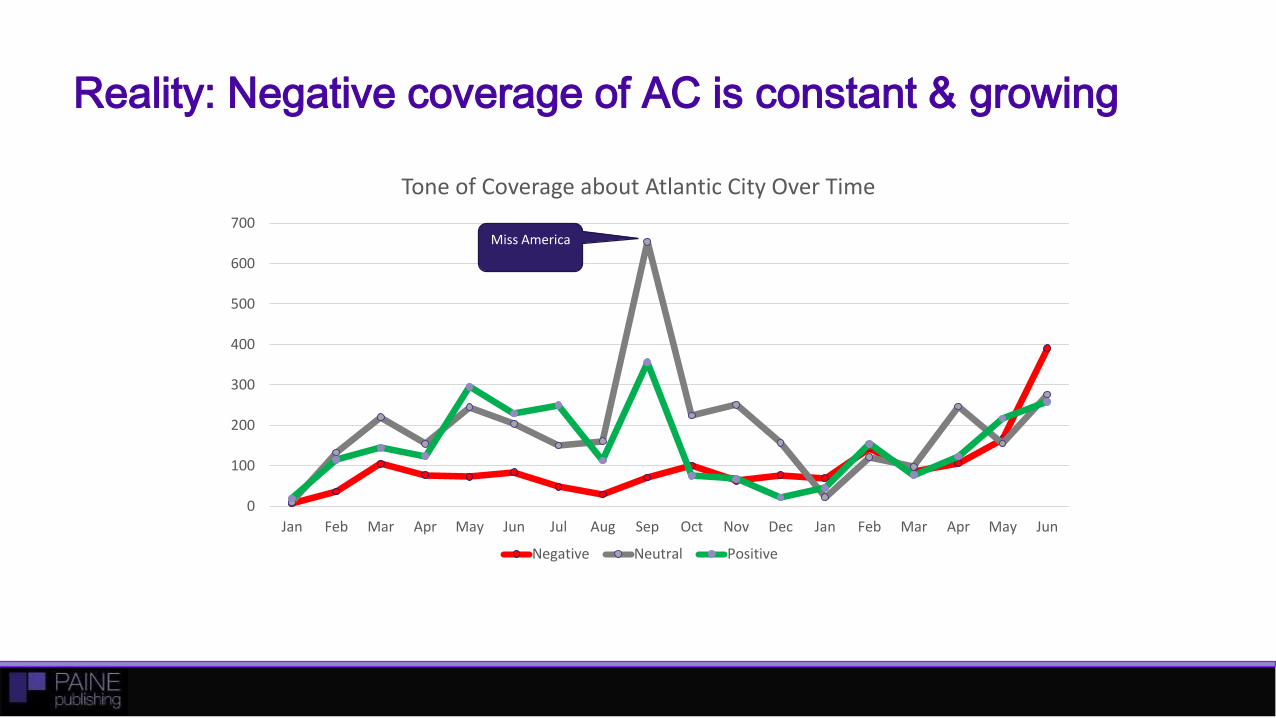
Reality: Negative coverage of AC is constant & growing
0
100
200
300
400
500
600
700
Jan Feb Mar Apr May Jun Jul Aug Sep Oct Nov Dec Jan Feb Mar Apr May Jun
Tone of Coverage about Atlantic City Over Time
Negative Neutral Positive
Miss America
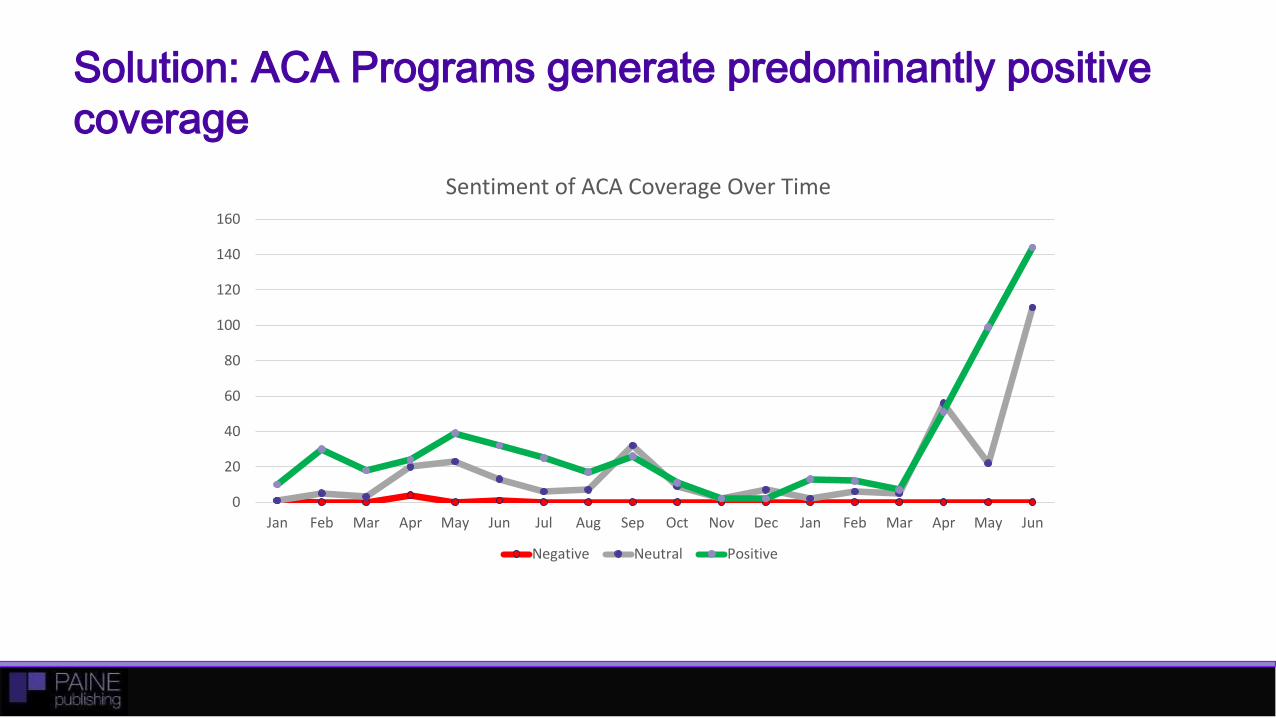
Solution: ACA Programs generate predominantly positive
coverage
0
20
40
60
80
100
120
140
160
Jan Feb Mar Apr May Jun Jul Aug Sep Oct Nov Dec Jan Feb Mar Apr May Jun
Sentiment of ACA Coverage Over Time
Negative Neutral Positive
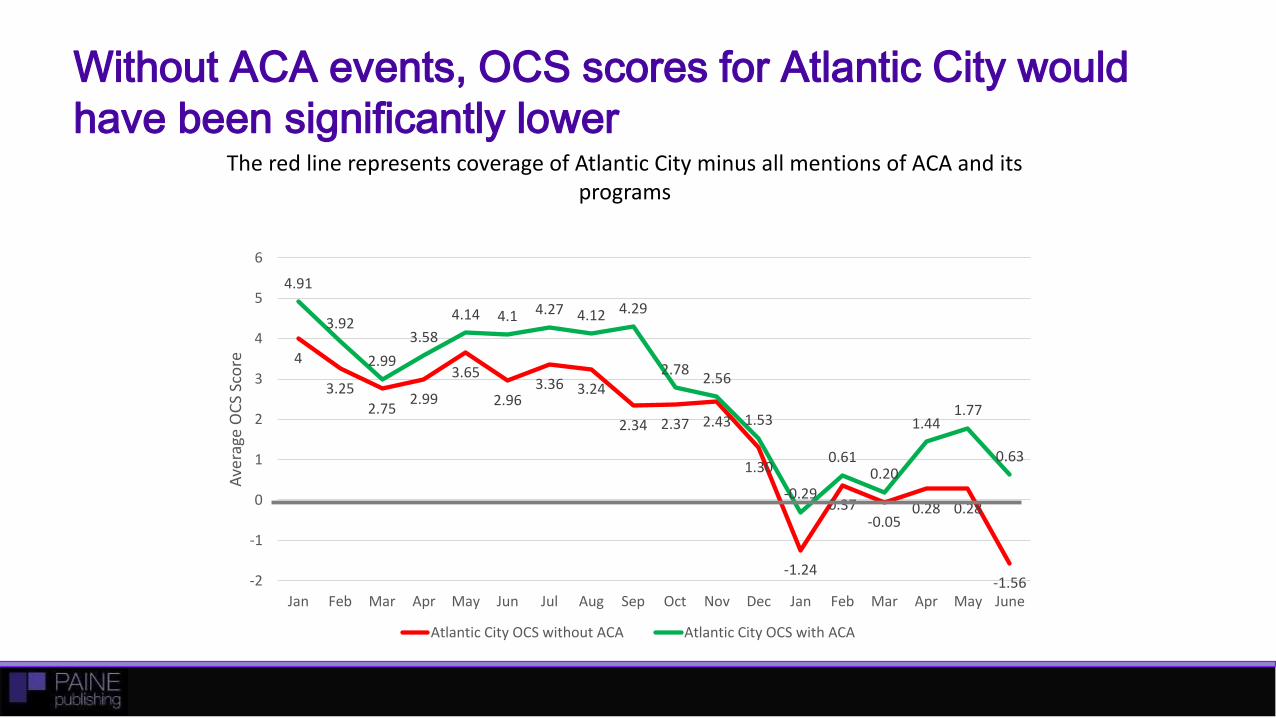
Without ACA events, OCS scores for Atlantic City would
have been significantly lower
4
3.25
2.752.99
3.65
2.963.36 3.24
2.34 2.37 2.43
1.30
-1.24
0.37-0.05
0.28 0.28
-1.56
4.91
3.92
2.99
3.58
4.14 4.1 4.27 4.12 4.29
2.782.56
1.53
-0.29
0.610.20
1.441.77
0.63
-2
-1
0
1
2
3
4
5
6
Jan Feb Mar Apr May Jun Jul Aug Sep Oct Nov Dec Jan Feb Mar Apr May June
Ave
rage
OC
S Sc
ore
Average OCS Score Over Time
Atlantic City OCS without ACA Atlantic City OCS with ACA
The red line represents coverage of Atlantic City minus all mentions of ACA and its programs
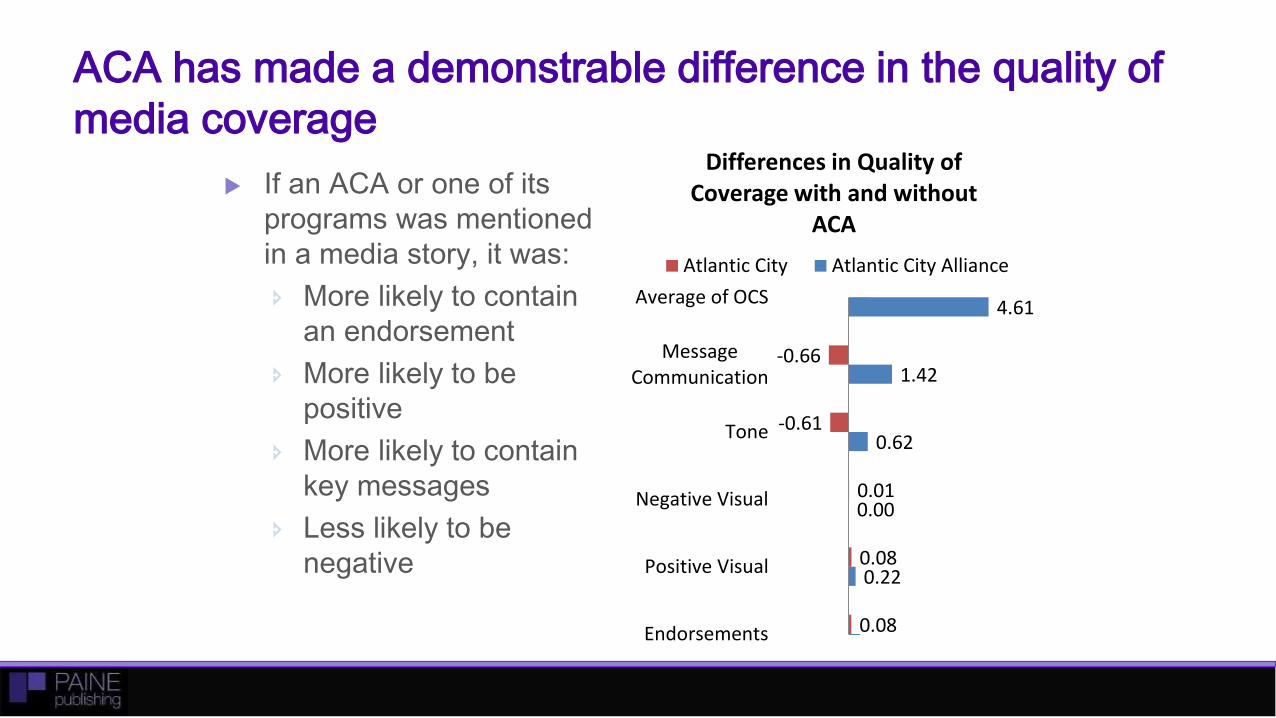
ACA has made a demonstrable difference in the quality of
media coverage
If an ACA or one of its
programs was mentioned
in a media story, it was:
More likely to contain
an endorsement
More likely to be
positive
More likely to contain
key messages
Less likely to be
negative 0.22
0.00
0.62
1.42
4.61
0.08
0.08
0.01
-0.61
-0.66
Endorsements
Positive Visual
Negative Visual
Tone
MessageCommunication
Average of OCS
Differences in Quality of Coverage with and without
ACA
Atlantic City Atlantic City Alliance
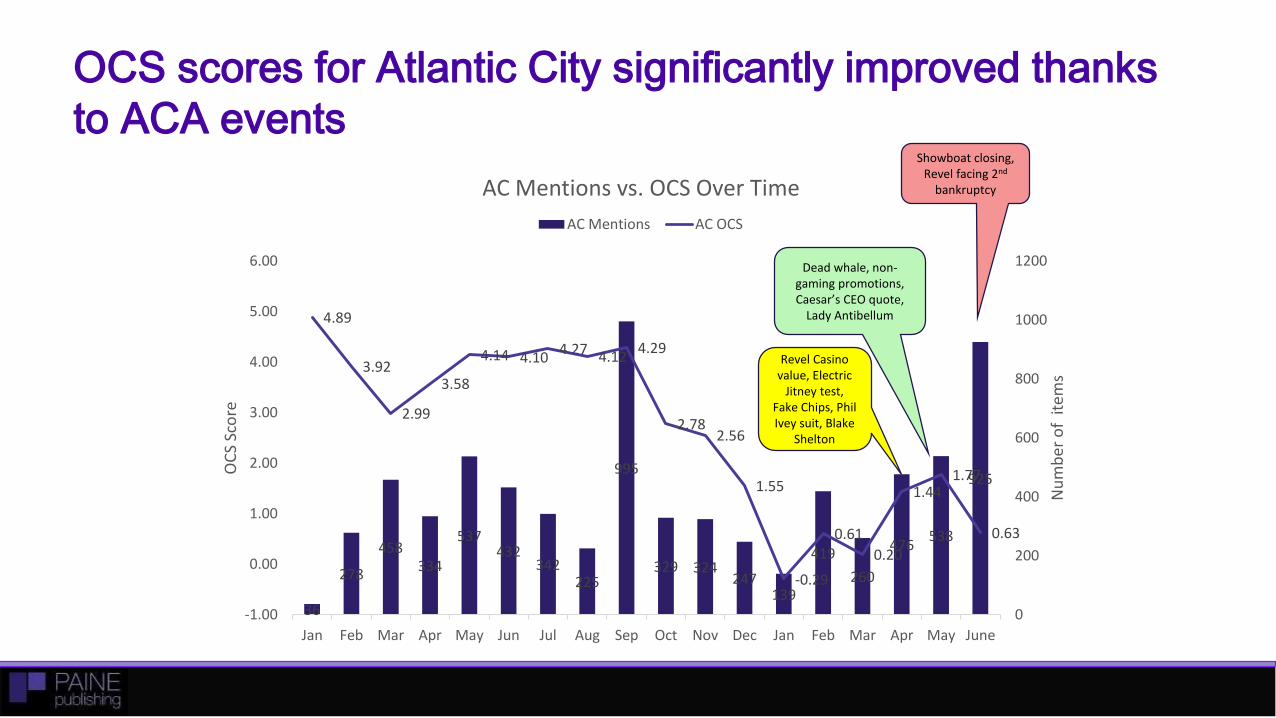
OCS scores for Atlantic City significantly improved thanks
to ACA events
36
278
458334
537432
342225
995
329 324247
139
419
260
476538
925
4.89
3.92
2.99
3.58
4.14 4.104.27 4.12
4.29
2.782.56
1.55
-0.29
0.61
0.20
1.441.77
0.63
-1.00
0.00
1.00
2.00
3.00
4.00
5.00
6.00
Jan Feb Mar Apr May Jun Jul Aug Sep Oct Nov Dec Jan Feb Mar Apr May June
0
200
400
600
800
1000
1200
OC
S Sc
ore
Nu
mb
er o
f it
ems
AC Mentions vs. OCS Over Time
AC Mentions AC OCS
Dead whale, non-gaming promotions, Caesar’s CEO quote,
Lady Antibellum
Revel Casino value, Electric
Jitney test, Fake Chips, Phil Ivey suit, Blake
Shelton
Showboat closing, Revel facing 2nd
bankruptcy
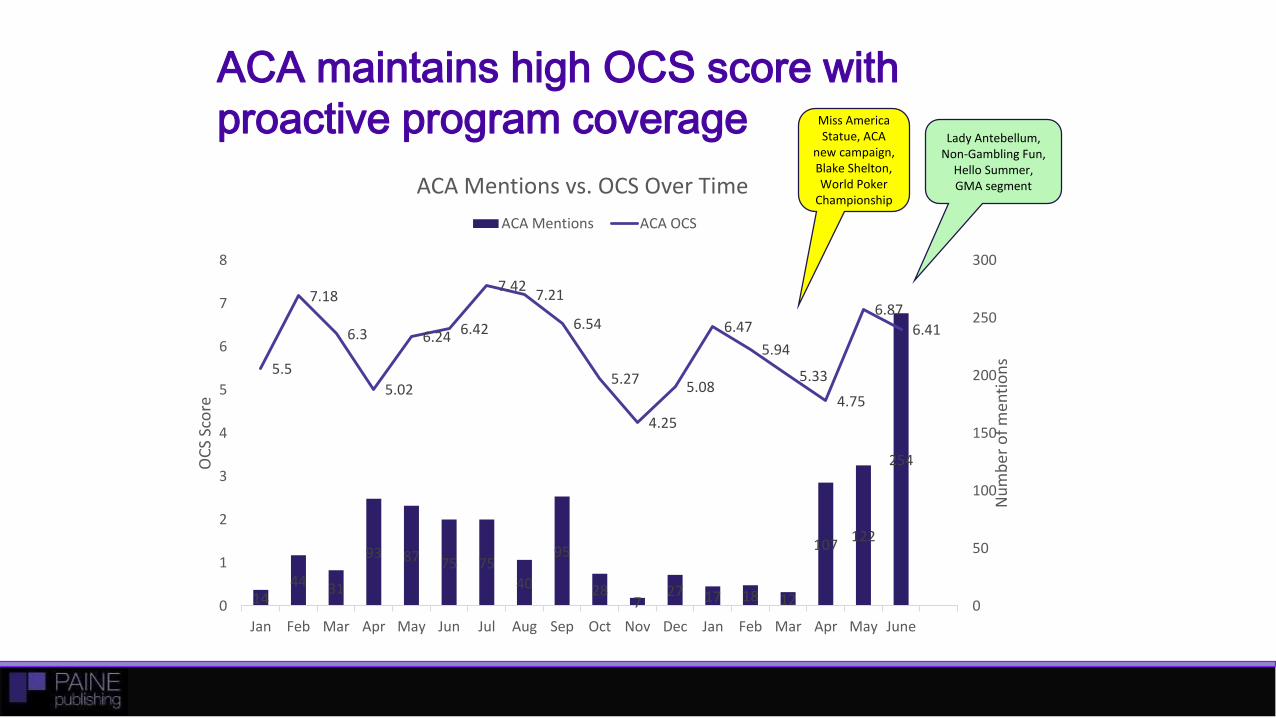
ACA maintains high OCS score with
proactive program coverage Lady Antebellum,
Non-Gambling Fun, Hello Summer, GMA segment
1444 31
93 87 75 75
40
95
287
27 17 18 12
107122
254
5.5
7.18
6.3
5.02
6.24 6.42
7.427.21
6.54
5.27
4.25
5.08
6.47
5.94
5.33
4.75
6.87
6.41
0
1
2
3
4
5
6
7
8
Jan Feb Mar Apr May Jun Jul Aug Sep Oct Nov Dec Jan Feb Mar Apr May June
0
50
100
150
200
250
300
OC
S Sc
ore
Nu
mb
er o
f m
enti
on
s
ACA Mentions vs. OCS Over Time
ACA Mentions ACA OCS
Miss America Statue, ACA
new campaign, Blake Shelton, World Poker
Championship
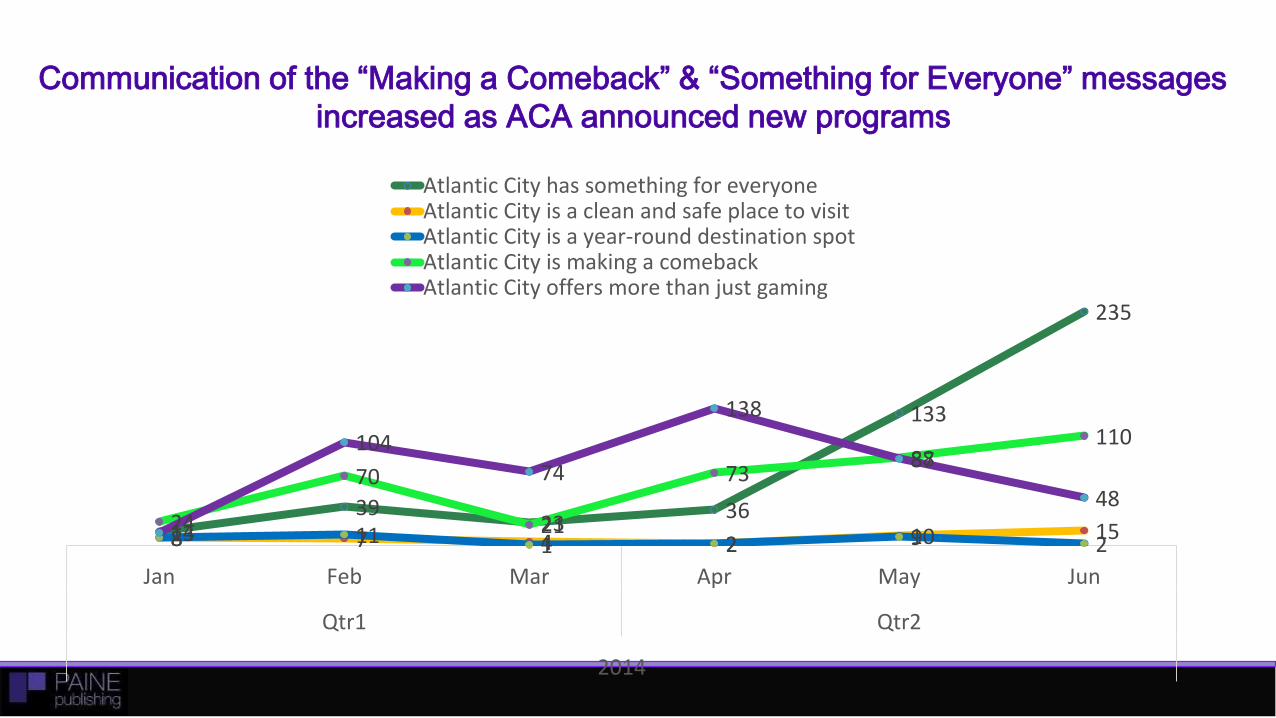
1439
2336
133
235
8 7 4 2 10 158 11 1 2 9 224
70
21
7388
110
13
10474
138
87
48
Jan Feb Mar Apr May Jun
Qtr1 Qtr2
2014
Atlantic City has something for everyoneAtlantic City is a clean and safe place to visitAtlantic City is a year-round destination spotAtlantic City is making a comebackAtlantic City offers more than just gaming
Communication of the “Making a Comeback” & “Something for Everyone” messages
increased as ACA announced new programs
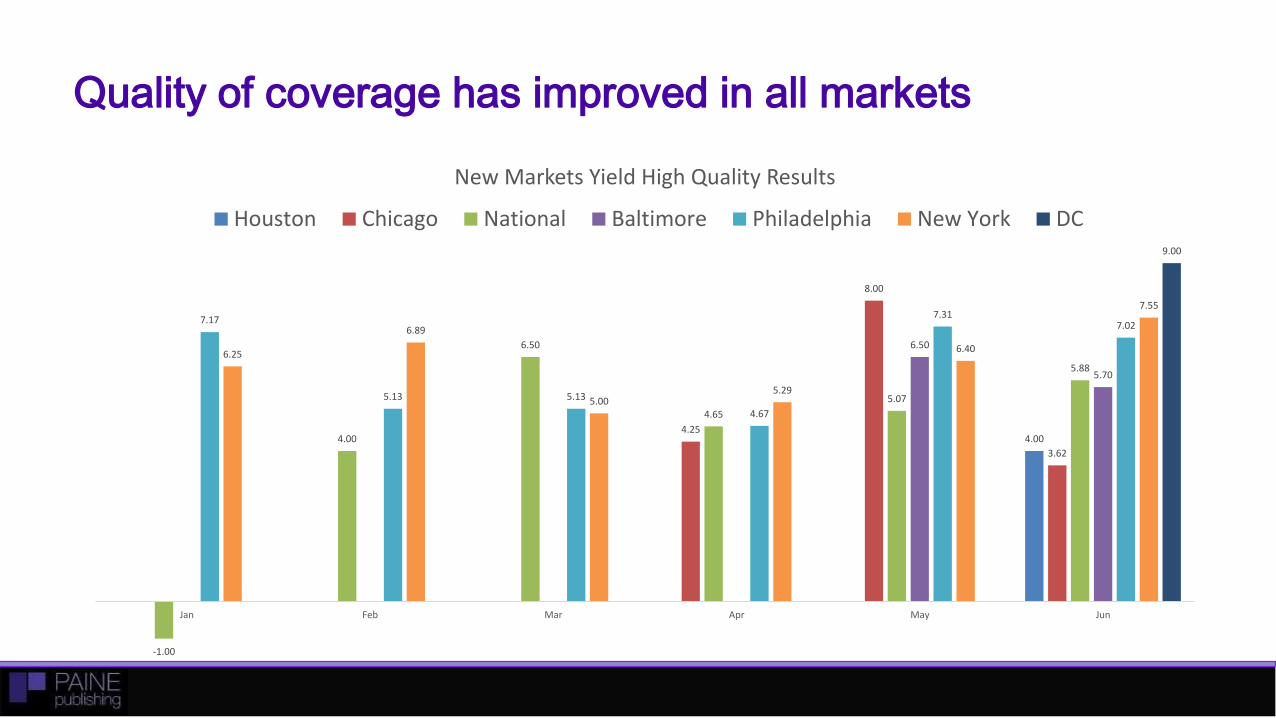
Quality of coverage has improved in all markets
4.004.25
8.00
3.62
-1.00
4.00
6.50
4.65
5.07
5.88
6.50
5.70
7.17
5.13 5.13
4.67
7.317.02
6.25
6.89
5.005.29
6.40
7.55
9.00
Jan Feb Mar Apr May Jun
New Markets Yield High Quality Results
Houston Chicago National Baltimore Philadelphia New York DC
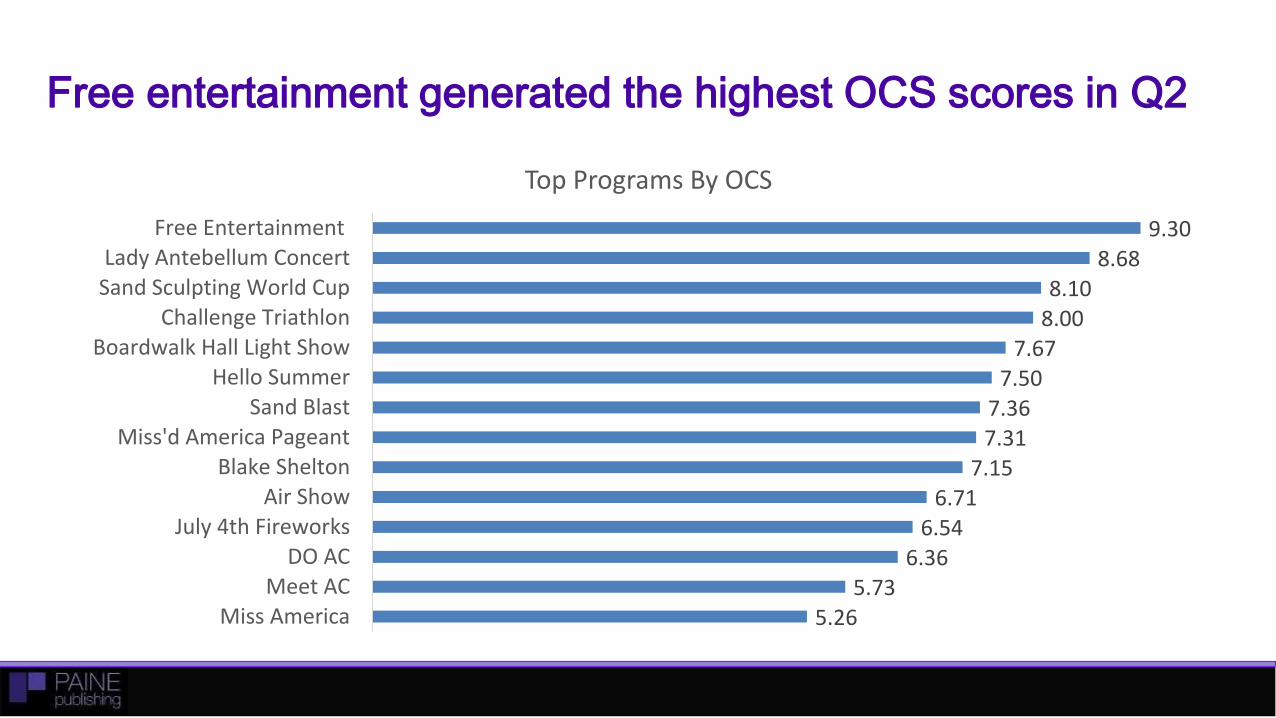
Free entertainment generated the highest OCS scores in Q2
5.265.73
6.366.54
6.717.15
7.317.36
7.507.67
8.008.10
8.689.30
Miss AmericaMeet AC
DO ACJuly 4th Fireworks
Air ShowBlake Shelton
Miss'd America PageantSand Blast
Hello SummerBoardwalk Hall Light Show
Challenge TriathlonSand Sculpting World CupLady Antebellum Concert
Free Entertainment
Top Programs By OCS
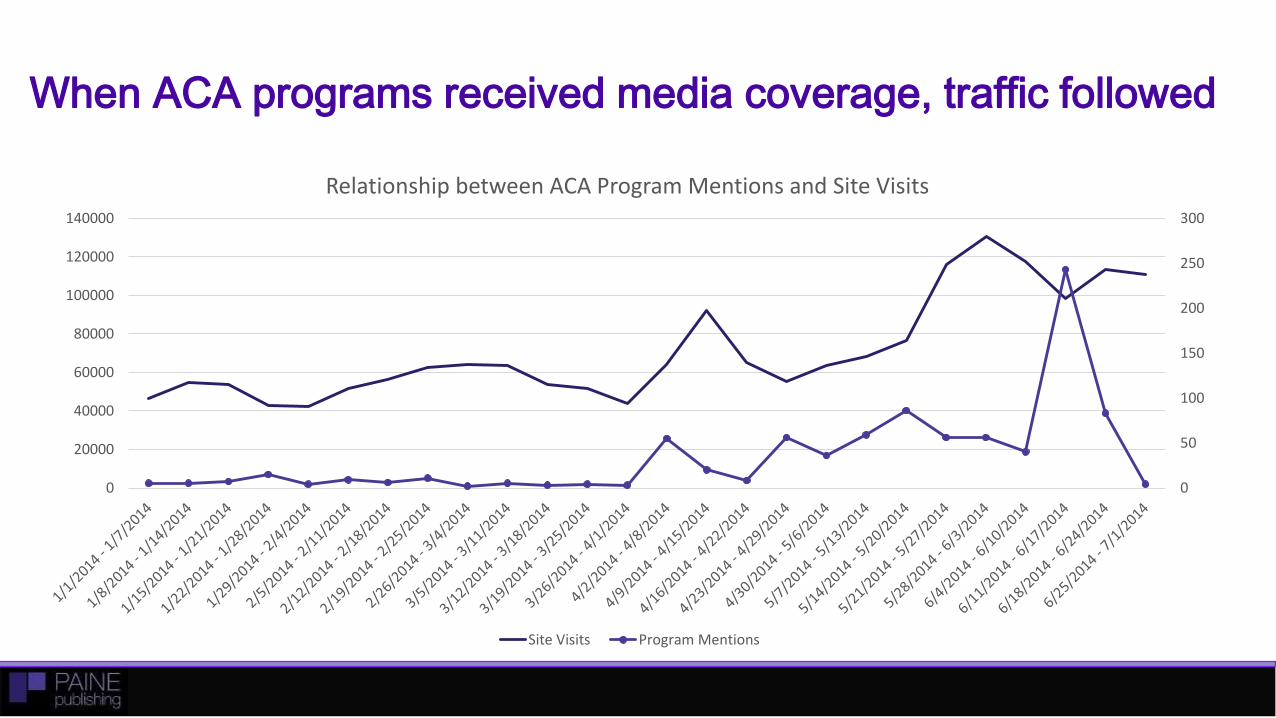
When ACA programs received media coverage, traffic followed
0
50
100
150
200
250
300
0
20000
40000
60000
80000
100000
120000
140000
Relationship between ACA Program Mentions and Site Visits
Site Visits Program Mentions
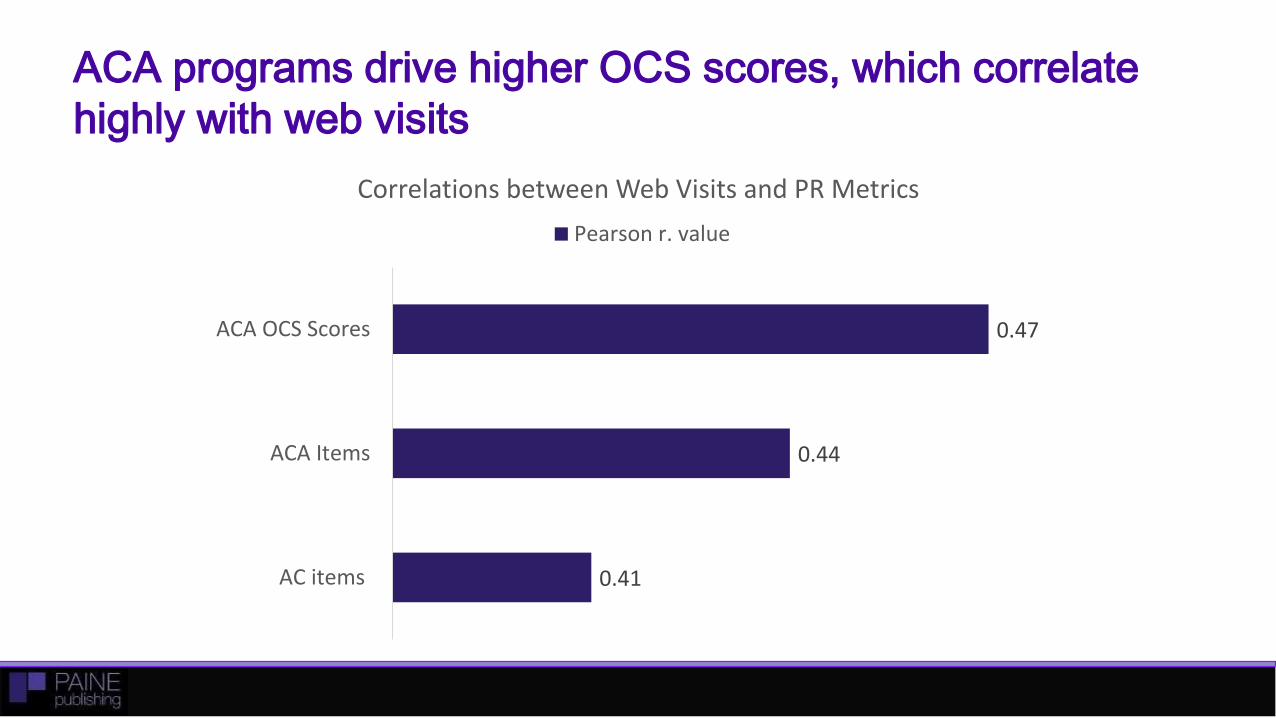
ACA programs drive higher OCS scores, which correlate
highly with web visits
0.41
0.44
0.47
AC items
ACA Items
ACA OCS Scores
Correlations between Web Visits and PR Metrics
Pearson r. value
PR is having a positive impact on preference & perceptions
People who say they have recently heard news about Atlantic
City are very likely to perceive AC as fun – a key driver of
preference
Respondents who remember seeing news reports about
Atlantic City are also very likely to associate key messages
and positioning statements such as “place I am excited to go
to” and “fun place to hang out with friends.”
The same respondents are also more likely to recommend
Atlantic City to friends.
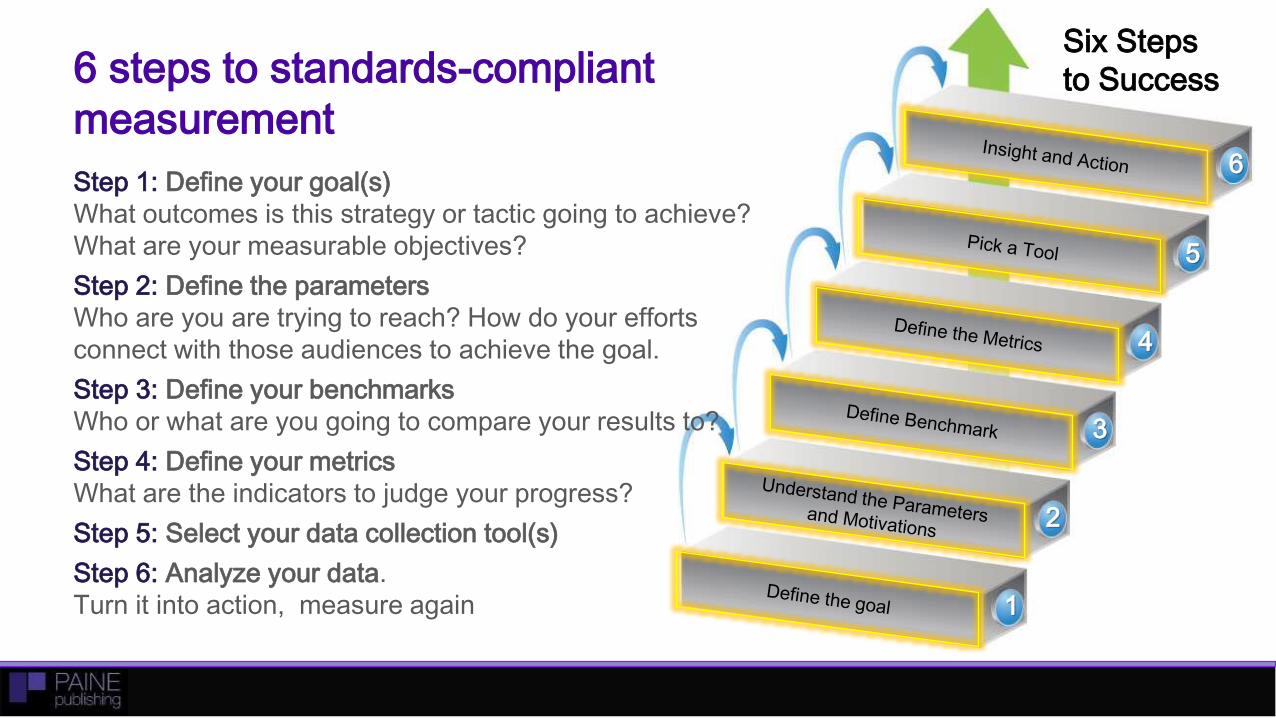
6 steps to standards-compliant
measurement
Step 1: Define your goal(s)
What outcomes is this strategy or tactic going to achieve?
What are your measurable objectives?
Step 2: Define the parameters
Who are you are trying to reach? How do your efforts
connect with those audiences to achieve the goal.
Step 3: Define your benchmarks
Who or what are you going to compare your results to?
Step 4: Define your metrics
What are the indicators to judge your progress?
Step 5: Select your data collection tool(s)
Step 6: Analyze your data.
Turn it into action, measure again
Six Steps
to Success
1
2
3
4
5
6
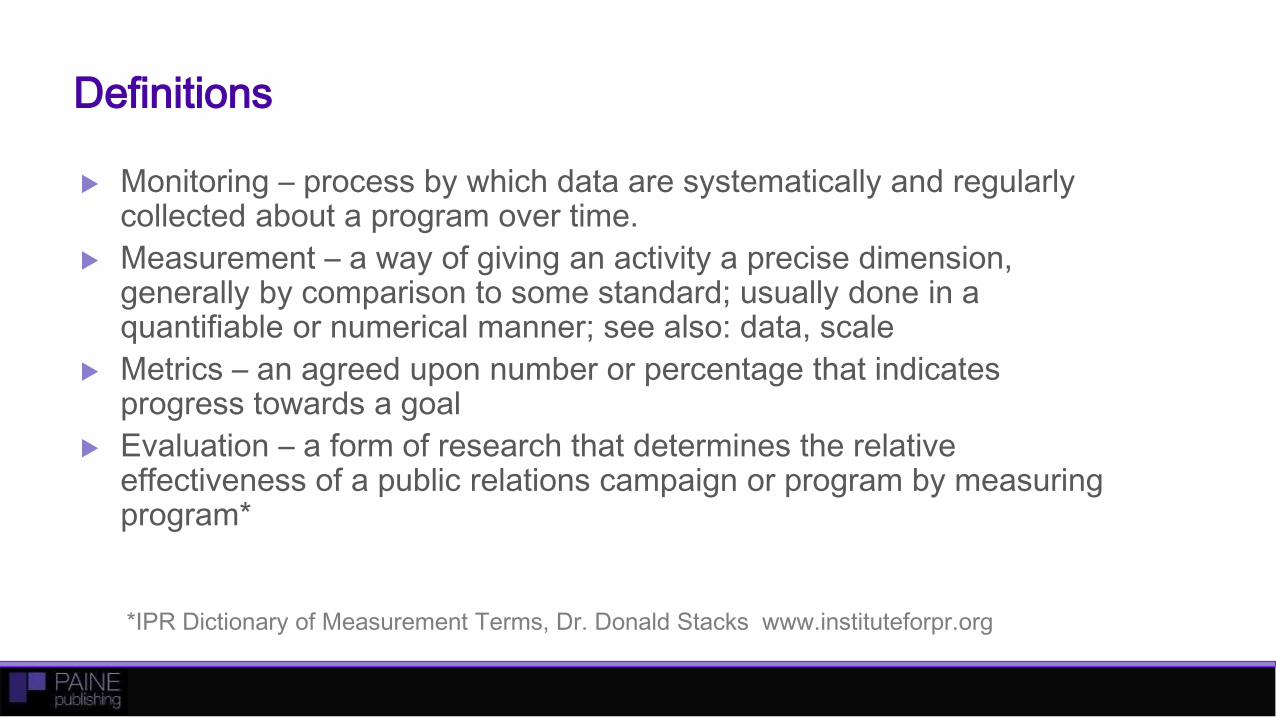
Definitions
Monitoring – process by which data are systematically and regularly collected about a program over time.
Measurement – a way of giving an activity a precise dimension, generally by comparison to some standard; usually done in a quantifiable or numerical manner; see also: data, scale
Metrics – an agreed upon number or percentage that indicates progress towards a goal
Evaluation – a form of research that determines the relative effectiveness of a public relations campaign or program by measuring program*
*IPR Dictionary of Measurement Terms, Dr. Donald Stacks www.instituteforpr.org
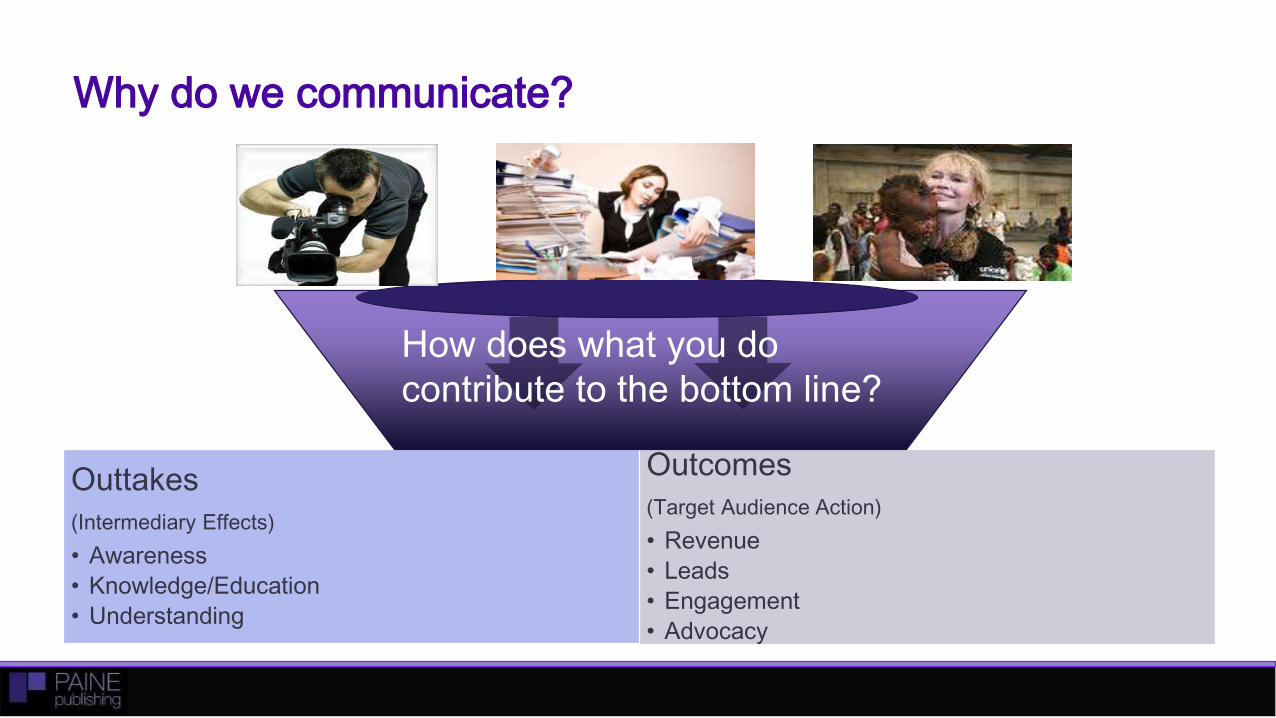
Why do we communicate?
Outtakes
(Intermediary Effects)
• Awareness
• Knowledge/Education
• Understanding
Outcomes
(Target Audience Action)
• Revenue
• Leads
• Engagement
• Advocacy
Activities How does what you do
contribute to the bottom line?
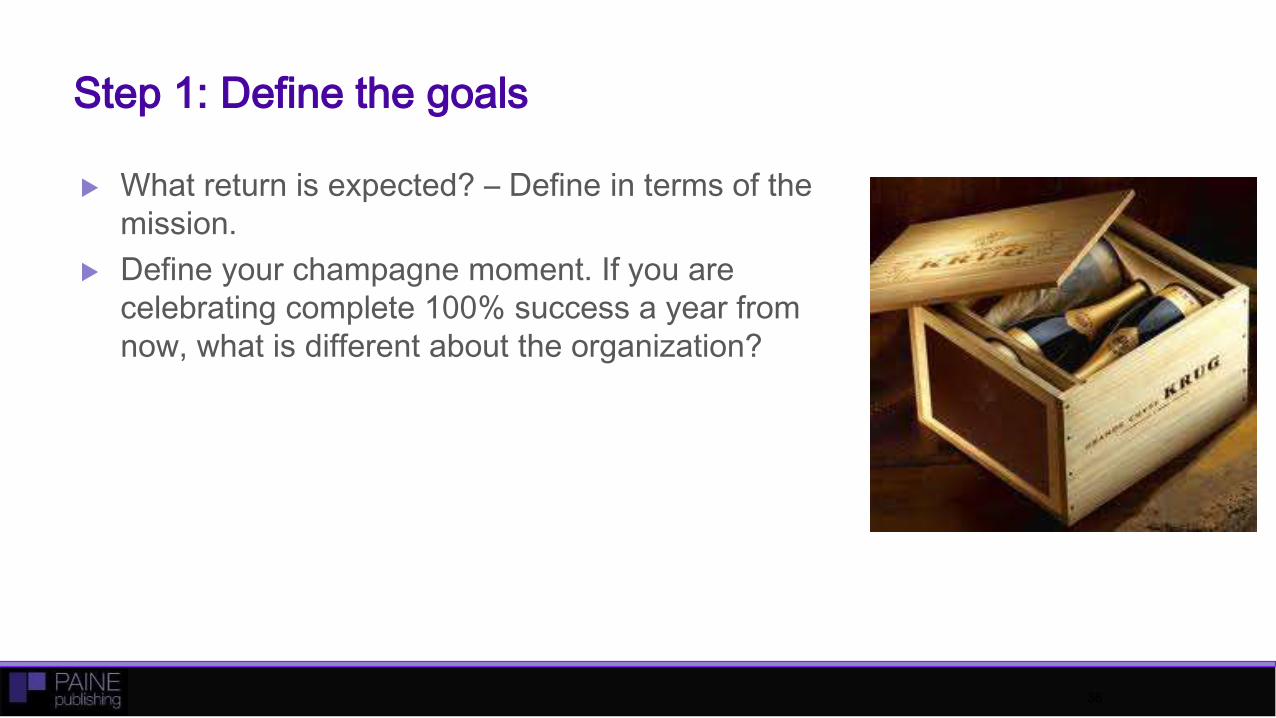
Step 1: Define the goals
What return is expected? – Define in terms of the
mission.
Define your champagne moment. If you are
celebrating complete 100% success a year from
now, what is different about the organization?
36
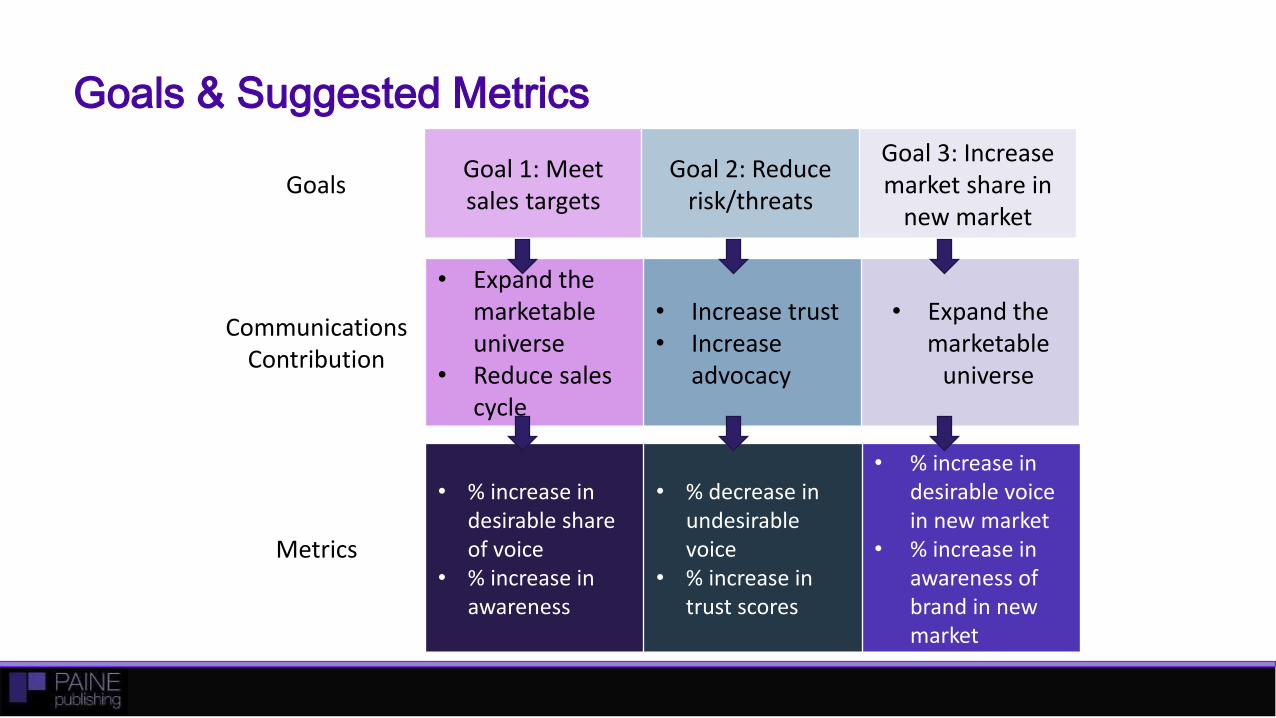
Goals & Suggested Metrics
GoalsGoal 1: Meetsales targets
Goal 2: Reducerisk/threats
Goal 3: Increase market share in
new market
CommunicationsContribution
• Expand the marketable universe
• Reduce salescycle
• Increase trust• Increase
advocacy
• Expand the marketable
universe
Metrics
• % increase in desirable share of voice
• % increase in awareness
• % decrease in undesirable voice
• % increase in trust scores
• % increase in desirable voice in new market
• % increase in awareness of brand in new market
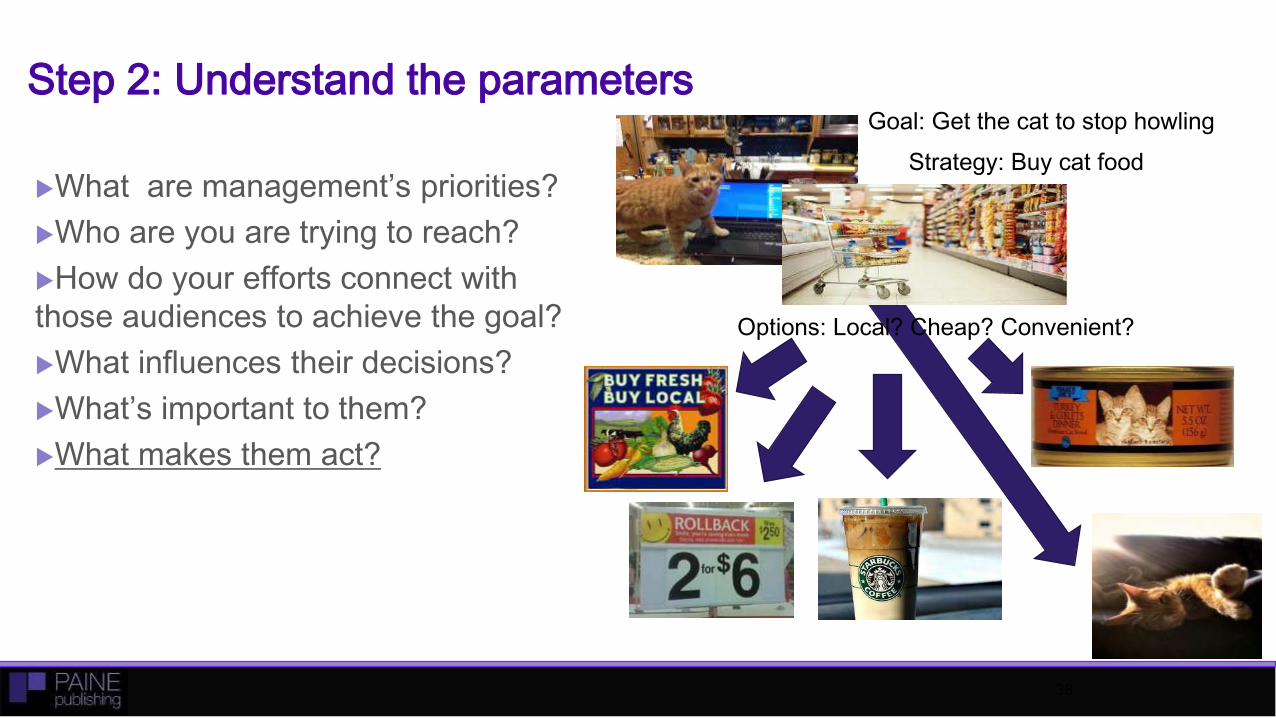
Step 2: Understand the parameters
What are management’s priorities?
Who are you are trying to reach?
How do your efforts connect with
those audiences to achieve the goal?
What influences their decisions?
What’s important to them?
What makes them act?
38
Goal: Get the cat to stop howling
Options: Local? Cheap? Convenient?
Strategy: Buy cat food
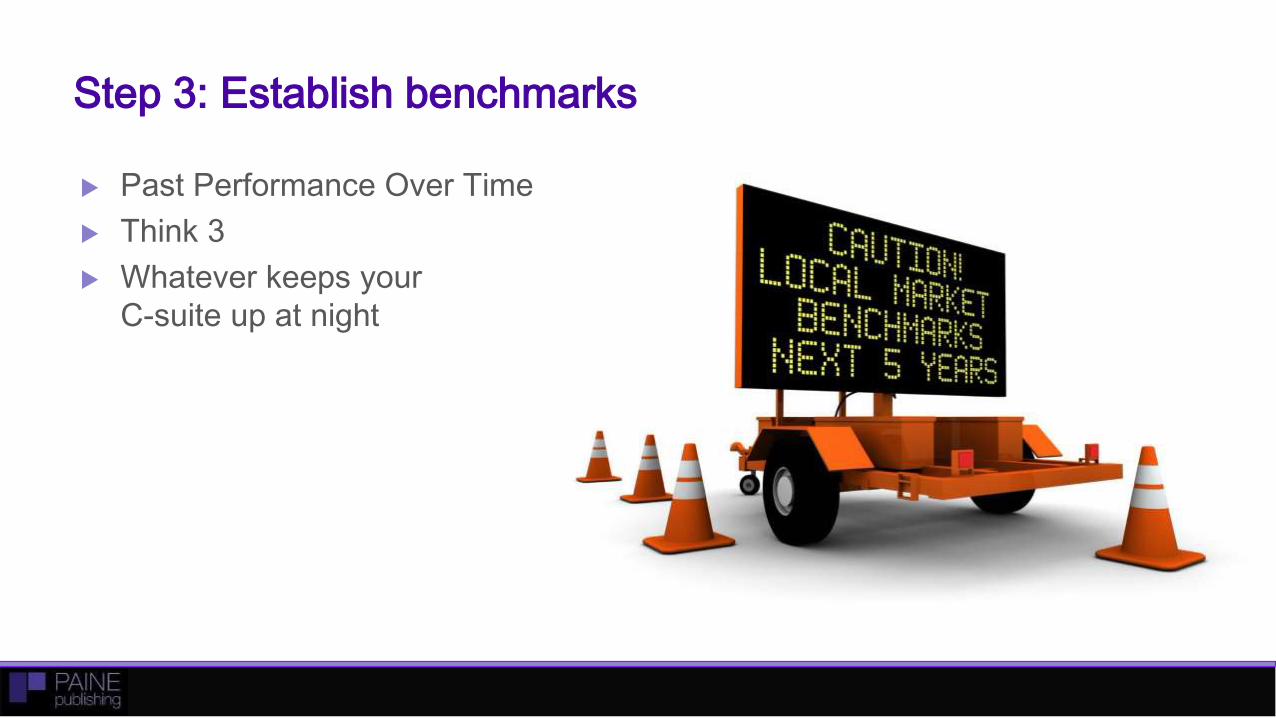
Step 3: Establish benchmarks
Past Performance Over Time
Think 3
Whatever keeps your
C-suite up at night
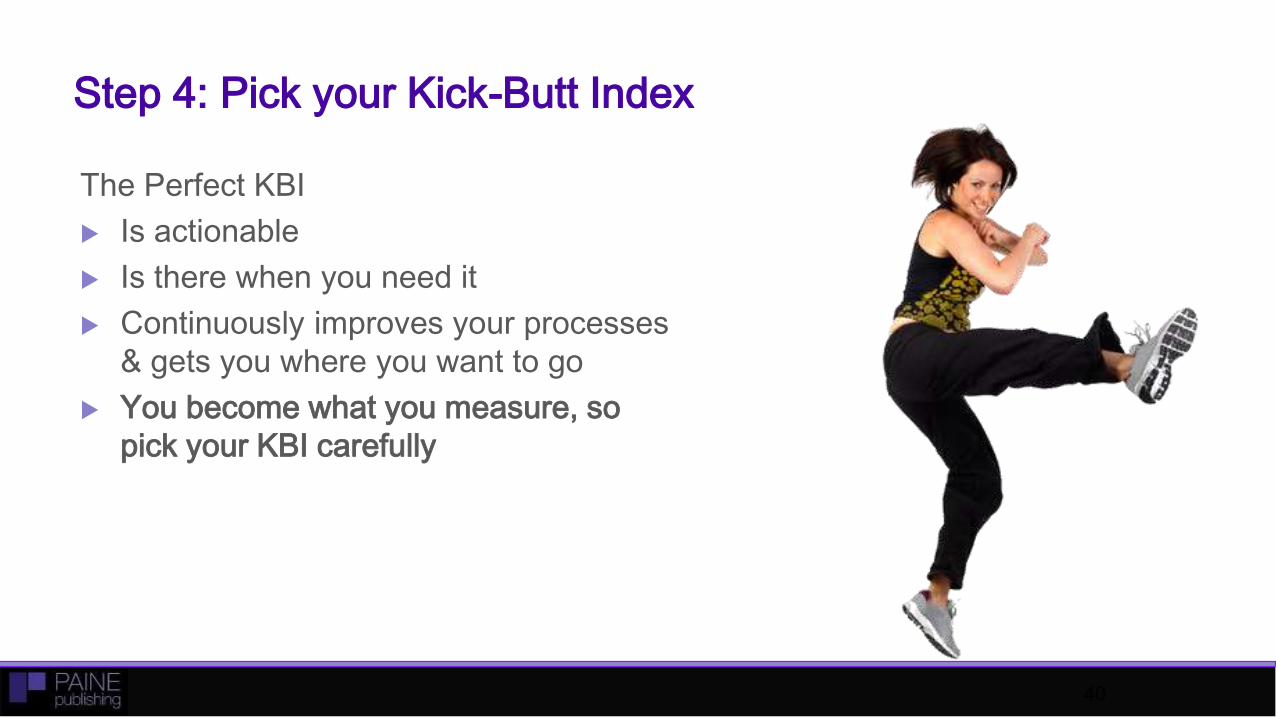
Step 4: Pick your Kick-Butt Index
The Perfect KBI
Is actionable
Is there when you need it
Continuously improves your processes
& gets you where you want to go
You become what you measure, so
pick your KBI carefully
40
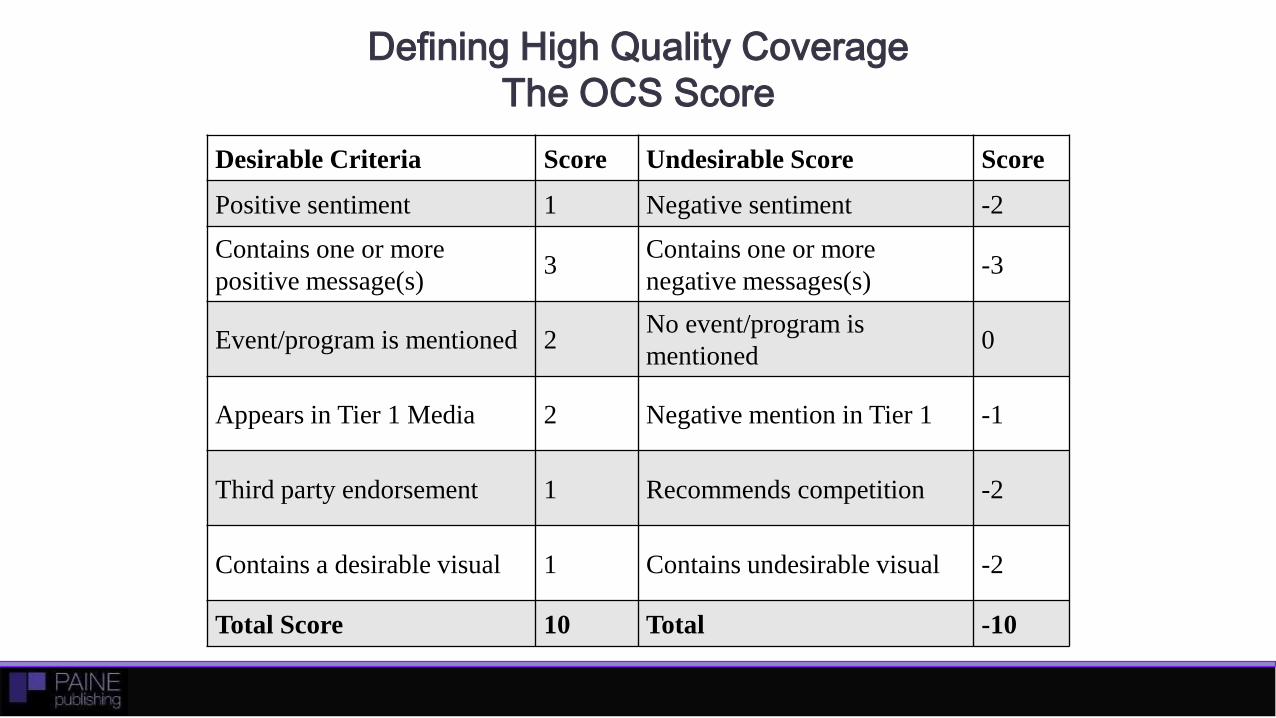
Defining High Quality Coverage
The OCS Score
Desirable Criteria Score Undesirable Score Score
Positive sentiment 1 Negative sentiment -2
Contains one or more
positive message(s)3
Contains one or more
negative messages(s)-3
Event/program is mentioned 2No event/program is
mentioned0
Appears in Tier 1 Media 2 Negative mention in Tier 1 -1
Third party endorsement 1 Recommends competition -2
Contains a desirable visual 1 Contains undesirable visual -2
Total Score 10 Total -10
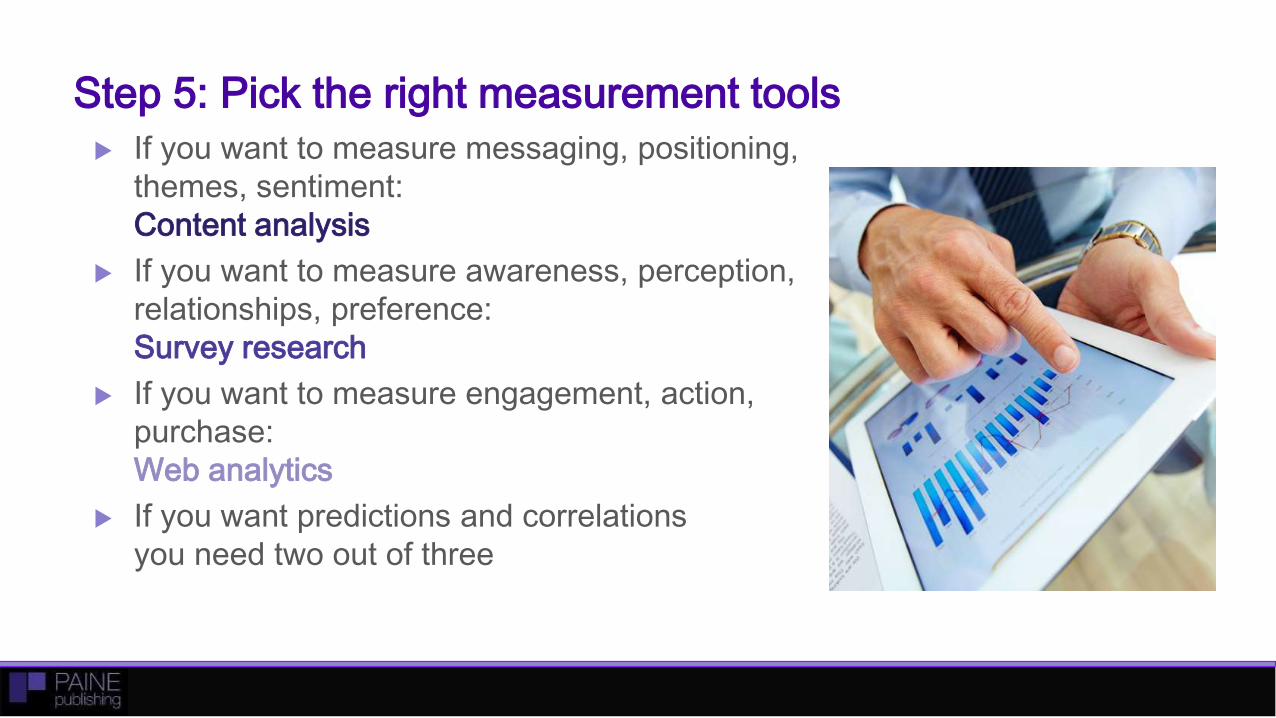
Step 5: Pick the right measurement tools
If you want to measure messaging, positioning,
themes, sentiment:
Content analysis
If you want to measure awareness, perception,
relationships, preference:
Survey research
If you want to measure engagement, action,
purchase:
Web analytics
If you want predictions and correlations
you need two out of three
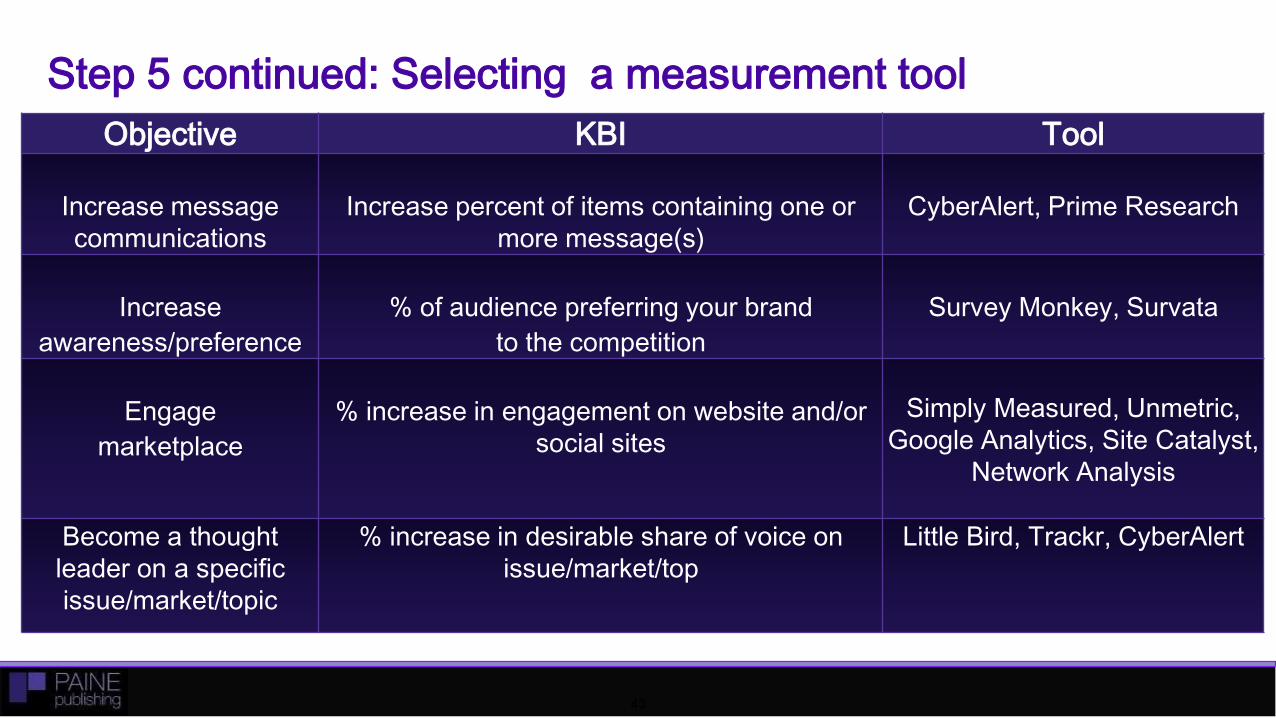
Step 5 continued: Selecting a measurement tool
43
Objective KBI Tool
Increase message
communications
Increase percent of items containing one or
more message(s)
CyberAlert, Prime Research
Increase
awareness/preference
% of audience preferring your brand
to the competition
Survey Monkey, Survata
Engage
marketplace
% increase in engagement on website and/or
social sites
Simply Measured, Unmetric,
Google Analytics, Site Catalyst,
Network Analysis
Become a thought
leader on a specific
issue/market/topic
% increase in desirable share of voice on
issue/market/top
Little Bird, Trackr, CyberAlert
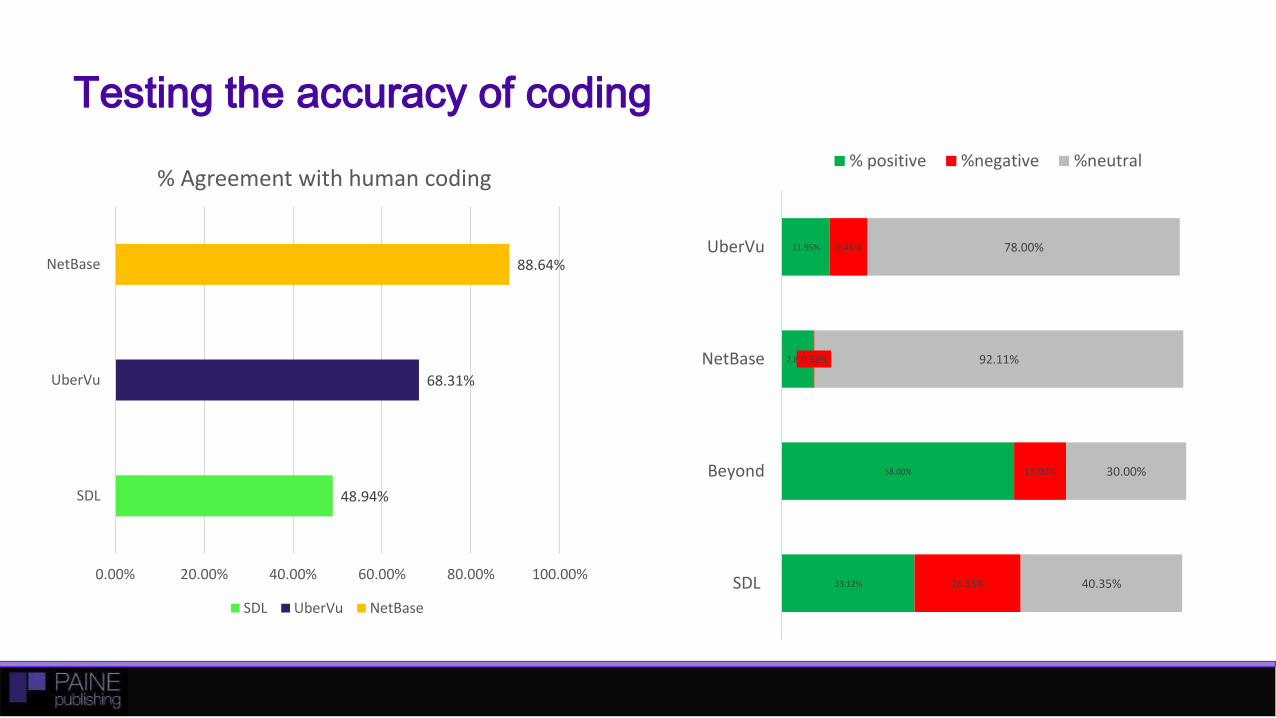
Testing the accuracy of coding
48.94%
68.31%
88.64%
0.00% 20.00% 40.00% 60.00% 80.00% 100.00%
SDL
UberVu
NetBase
% Agreement with human coding
SDL UberVu NetBase
33.12%
58.00%
7.84%
11.95%
26.53%
13.00%
0.32%
9.46%
40.35%
30.00%
92.11%
78.00%
SDL
Beyond
NetBase
UberVu
% positive %negative %neutral
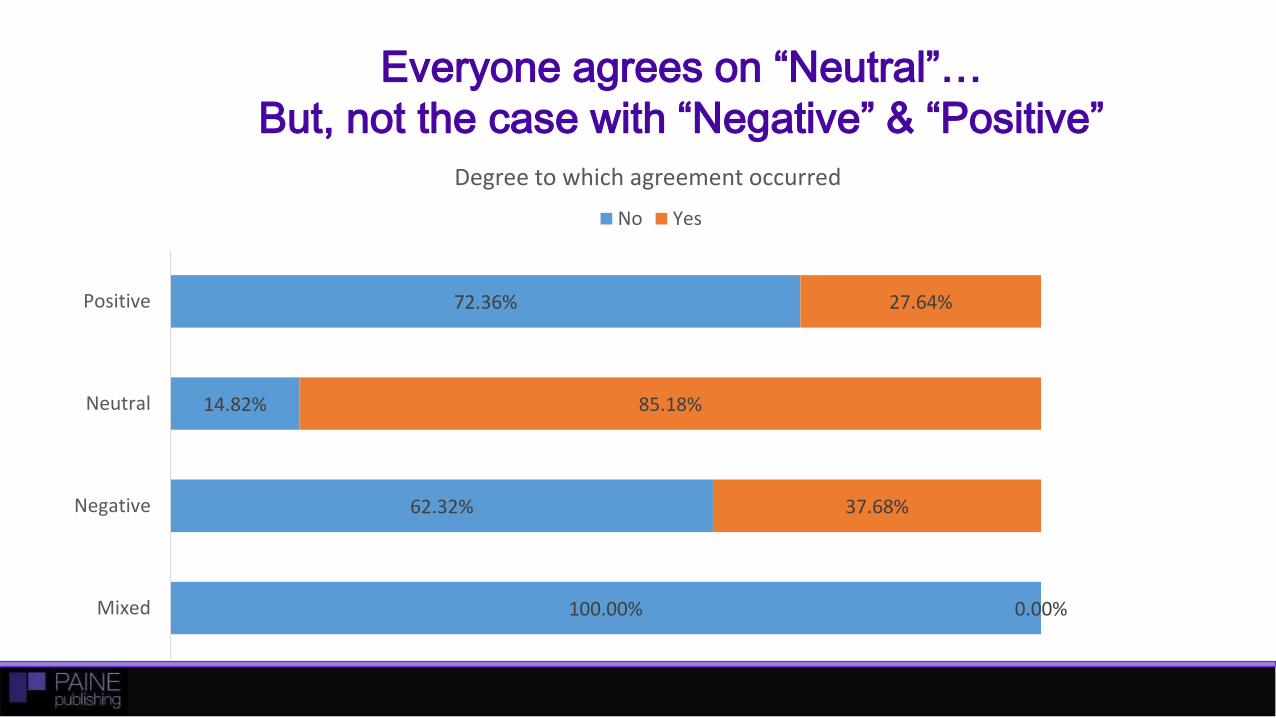
Everyone agrees on “Neutral”…
But, not the case with “Negative” & “Positive”
100.00%
62.32%
14.82%
72.36%
0.00%
37.68%
85.18%
27.64%
Mixed
Negative
Neutral
Positive
Degree to which agreement occurred
No Yes
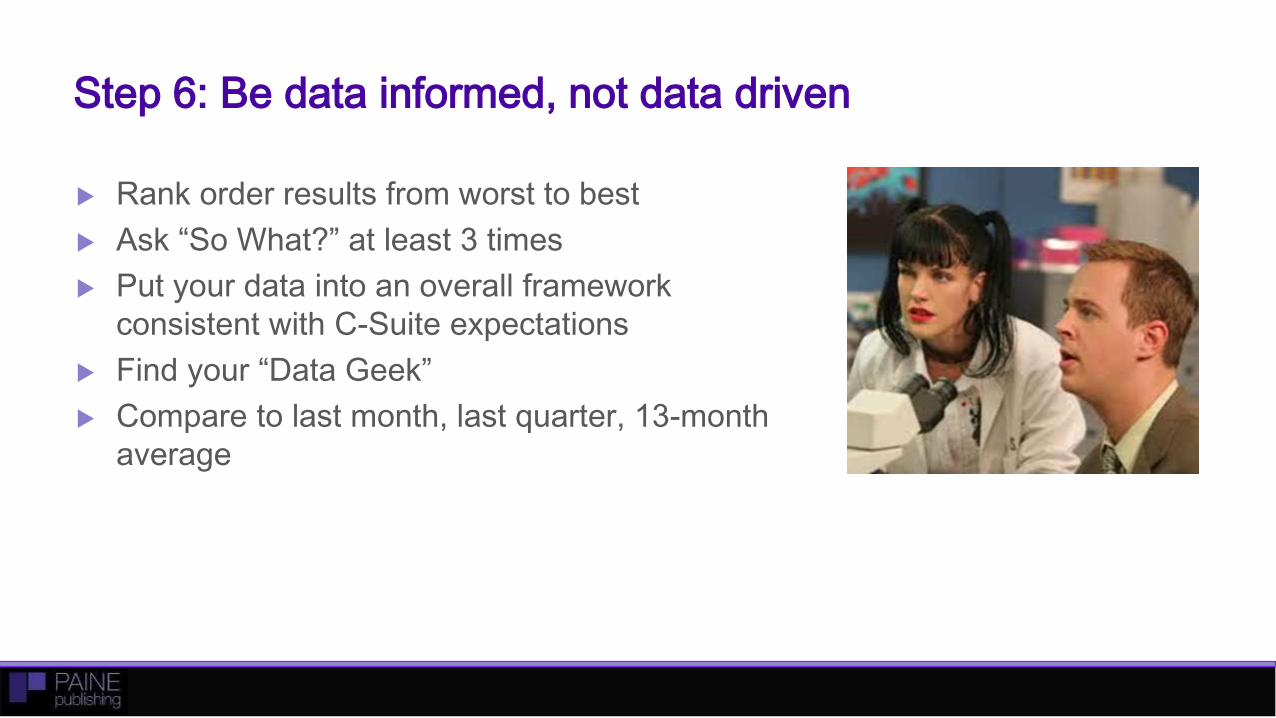
Step 6: Be data informed, not data driven
Rank order results from worst to best
Ask “So What?” at least 3 times
Put your data into an overall framework
consistent with C-Suite expectations
Find your “Data Geek”
Compare to last month, last quarter, 13-month
average
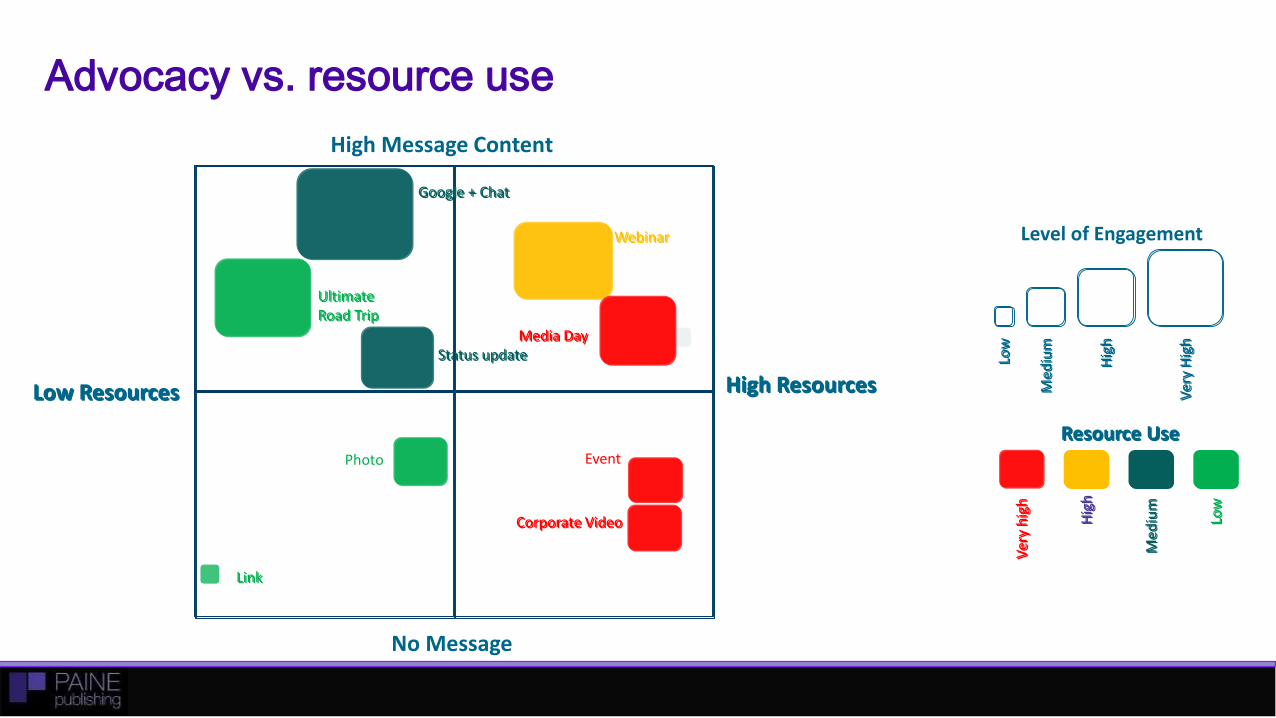
Photo Event
High Message Content
Resource Use
Low
Hig
h
Me
diu
m
Ver
y h
igh
Level of Engagement
Ver
y H
igh
Med
ium
Hig
h
Low
High Resources
No Message
Low Resources
Webinar
Status update
Link
Ultimate Road Trip
Google + Chat
Media Day
Corporate Video
Advocacy vs. resource use
Resource Use
Low
Hig
h
Med
ium
Ver
y h
igh
Ver
y H
igh
Med
ium
Hig
h
Low
High Resources Low Resources
Webinar
Status update
Link
Ultimate Road Trip
Google + Chat
Media Day
Corporate Video
Real-time metrics focus on outcomes
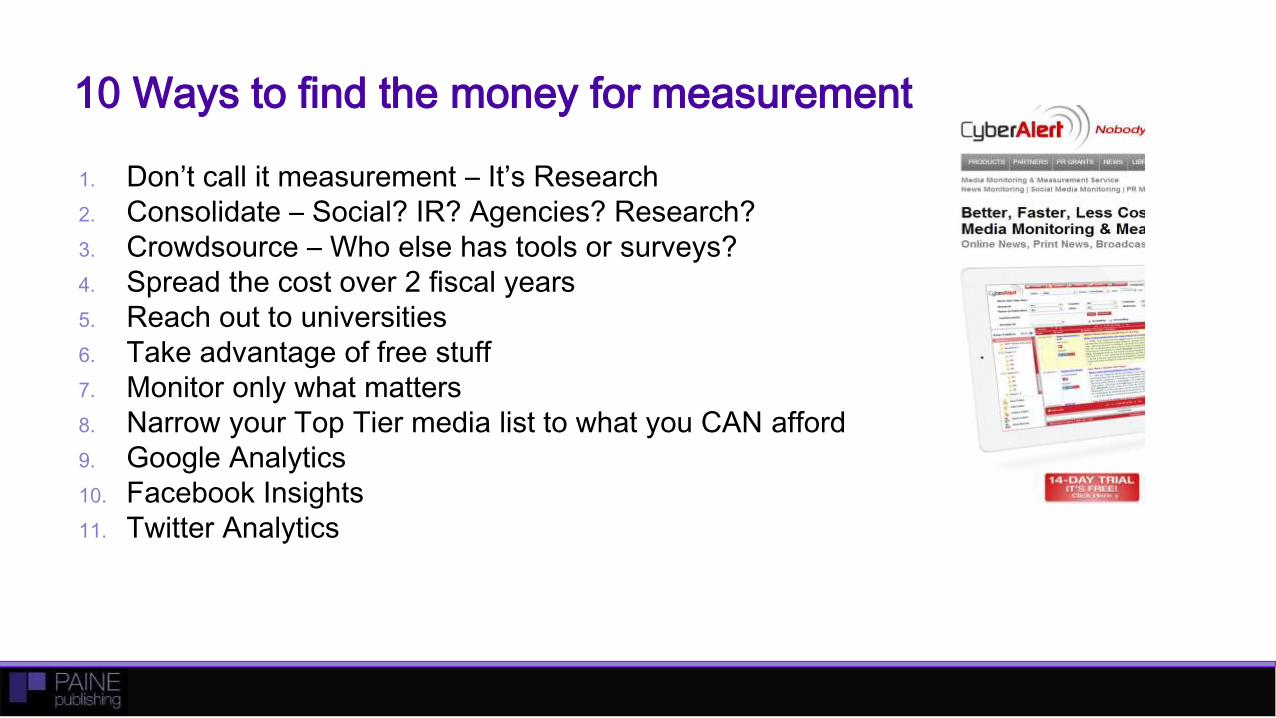
10 Ways to find the money for measurement
1. Don’t call it measurement – It’s Research
2. Consolidate – Social? IR? Agencies? Research?
3. Crowdsource – Who else has tools or surveys?
4. Spread the cost over 2 fiscal years
5. Reach out to universities
6. Take advantage of free stuff
7. Monitor only what matters
8. Narrow your Top Tier media list to what you CAN afford
9. Google Analytics
10. Facebook Insights
11. Twitter Analytics
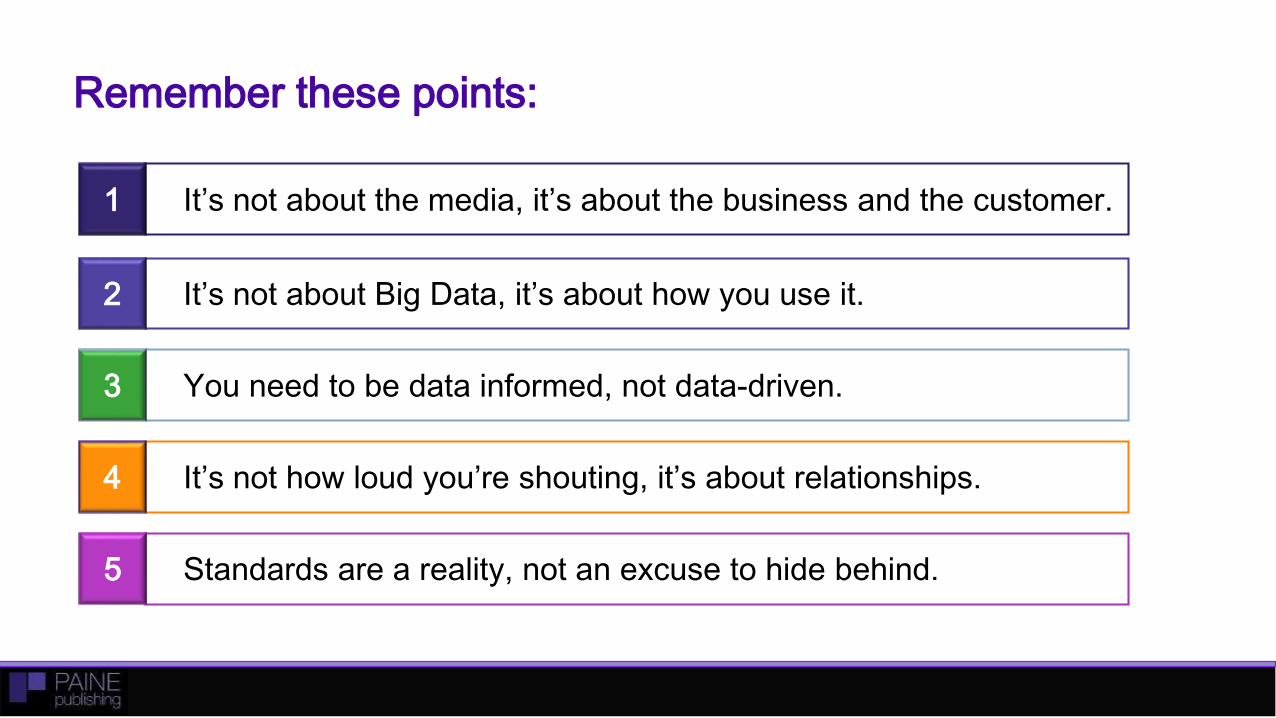
Remember these points:
It’s not about the media, it’s about the business and the customer.1
It’s not about Big Data, it’s about how you use it.2
You need to be data informed, not data-driven.3
It’s not how loud you’re shouting, it’s about relationships.4
Standards are a reality, not an excuse to hide behind.5
Thank You!
For more information on measurement, read my blog:
http://www.painepublishing.com/blog
For a copy of this presentation or to subscribe to our newsletter, give me
your card or email me at [email protected]
Follow me on Twitter: @queenofmetrics
“Like” Paine Publishing’s Facebook account
Call me at 1-603-682-0735