


Languages
Pages
Legal


Proprietary & Confidential – E-LOAN, Inc. ©2005

Page 2
This presentation contains forward-looking statements based on
current expectations that involve risks and uncertainties. E-LOAN
actual results may differ from the results described here. Factors
that could cause actual results to differ include, but are not limited
to, general conditions in the lending industry, interest rate
fluctuations, and the impact of competitive products. These and
other risk factors are detailed in reports E-LOAN files with the
Securities and Exchange Commission.
Safe Harbor

Page 3
Refinance
Purchase
Auto
Home Equity
$1,174 B
$692 B$431 B
$1,479 B
* MBAA (Mortgage), SMR Research (Home Equity), Company Estimate (Auto)** Revenue estimate assumes the market revenue basis points is equal to E-LOAN Q4 2004 levels.
• 2004 Originations of $3.8 Trillion
• $80 Billion Revenue Market
Consumer Lending Market

Page 4
• Unnecessary Costs and ConflictsHighly compensated sales people
Pricing based on negotiation not creditworthiness
Recommendations based on salesperson’s commission structure
• Confusing and Mistrusted ProcessLack of pricing transparency – “junk fees”
Complex terminology – “points, index rate, impounds”
Lack of control – distrust of process and profession, “black box”
• Slow ProcessMany intermediaries – time demand on customer
Too much paperwork – disclosures, documentation
Problem: Getting a Loan is a Pain

Page 5
• Leverage the InternetCreate Customer Loyalty Through Transparency
Reduce Customer Acquisition Costs
Reduce Loan Processing Costs – Offshore & Paperless Process
• Apply a Manufacturer Mentality to Lower Costs
• Eliminate the Middleman
E-LOAN Solution: Streamline the Process

Page 6
Shop
Apply
Underwrite
Document
Fund
Monitor
$
Brokers/Auto Dlrs.
WholesaleLenders
RetailLenders E-LOAN
LeadCompanies
End-to-End Solution

Page 7
Fast ProcessGreat Rates
Internet = Enormous Operating Leverage
Low Cost Producer
Low Rates
Market Share
Scale

Page 8
927 25
43
8098
122
7
13
9
43
60
73 37
43
$0
$20
$40
$60
$80
$100
$120
$140
$160
1998 1999 2000 2001 2002 2003 2004 2005Est*
$ M
illio
ns
Refinance
Diversified
* Guidance as of February 17, 2005 (Q4’04 Earnings Conference Call)
153
103
68
36
22
135
165
Our Revenue has Grown…

Page 9
RefinanceMortgagePurchaseMortgageNon-PrimeMortgage (1)Auto
Home Equity (2)
Q1 2003
Total Revenue $36 M
Diversified Revenue $15 M
Q1 2005
Total Revenue $38 M
Diversified Revenue $27 M
(1) Non-Prime originations, similar to purchase mortgages, have proven to be stable in various interest rate environments. (2) Q1 2005 includes revenue from E-LOAN Closing Services, Inc.
58%
30%16%
8%12%
16%
34%
14%
6%
6%
… and Diversified for Greater Predictability

Page 10
2002($ in billions)
2003
($ in billions)
2004($ in billions)
Total US Home Equity Originations (1) 257 327 431
Total Value of US Homes (2) 14,900 16,000 17,100
Total US mortgage debt outstanding (2) 6,900 7,600 8,300
Total US home equity available (2) 8,000 8,400 8,800
• Significant home equity available to borrowers
• Lower rates & tax advantages compared to credit card debt
Source: (1) SMR Research: Home Equity Loans: 2005 Outlook (exclusive of any home equity securitizations done by non-federally regulated institutions (2) Federal Reserve, NYSE and NASDAQ
Home Equity Finance Market

Page 11
-
200,000
400,000
600,000
800,000
1,000,000
1,200,000
1,400,000
1,600,000
$ M
illio
ns
* Source: Mortgage Bankers’ Association of America
Large, Stable, Growing Market
Purchase Mortgage Market

Page 12
2002 2003 2004 Target
% Diversified Revenue 42% 53% 72% 85%
Revenue 100% 100% 100% 100%
Expenses:
Operations 51% 46% 49% 40%
Marketing 25% 27% 35% 27%
Technology 6% 6% 7% 7%
G&A 7% 6% 9% 6%
Pre-tax Income 11% 16% 1% 20%
E-LOAN Financial Model

Page 13
• Gain on sale of loansFirst Mortgages, Home Equity, & Subprime Auto = cash gain on sale
Prime Auto Loans = discounted cash flow gain on sale
• Interest spread on loans held prior to saleMortgage & Home Equity = typically held approx. 30 days
Auto Loans = typically held under 10 days
Loan Average Loan Size Gain On Sale - Basis Points Gain On Sale - Dollars
Mortgage $ 215,000 207 bps $ 4,500
Home Equity $ 54,000 305 bps $ 1,630
Auto * $ 16,000 220 bps $ 300
Q1 2005
How We Make Money
* Excludes the $2.65 benefit from the QSPE Auto loan sale

Page 14
Expense MortgageHome Equity
Auto
Headcount & Related 50% 63% 66%
Commissions 21% 13% ---
Processing Costs 18% 15% 20%
Facilities & Other 11% 9% 14%
• Majority of cost is headcount & commission related (66% - 71%)
• Significant leverage to operations cost as we automate process
Operations Cost Mix

Page 15
• Labor Cost
Offshore – India & Philippines
Express / “No Commission” Products
Process automation / streamline efforts
• Technology Automation
Paperless loan processing
Upgraded loan origination system
Expand automated underwriting
Tools to improve application to fund conversion
Operations Cost Initiatives

Page 16
Product Q1 2005 Target % Change
Mortgage $ 1,830 $ 1,250 (32%)
Home Equity
$ 800 $ 500 (38%)
Auto $ 250 $ 125 (50%)
• Includes both fixed and variable costs to originate & sell loans
• Excludes interest expense
Operations Cost Per Loan

Page 17
• Shift to internet marketing – online advertising / search
Television
Direct Mail
Online/Search
Other
Overhead
Q1 2004
Total Marketing $11.1 M
Q1 2005
Total Marketing $13.4 M
54%45%
15%
1%
11%
1%
8%
5%
19%
41%
Marketing Mix is Evolving

Page 18
Early Uses
Simple Purchases
Books
Music
Financial Transactions
Pay Bills
Trade Stocks
Airline Tickets
Online Loans
Security
Privacy
More Experience
Complex Uses
Evolution of Internet Usage

Page 19
0.90%
3.60%
2.50%
6.10%
2001 2007
Purchase Refinance
Online % of Market
Source: Jupiter Research [Oct 2002]
Online Growth – Internet Home Mortgage

Page 20
• Lower Acquisition Costs Maximize advertising channel spend through use of application attribution model
Lower TV costs through fixed rate purchases, better station selection and enhanced focus on profitable local markets
Use recent trademark registration to lower search word costs
More aggressive approach to obtaining Internet partnerships
• Better Utilize Substantive Brand We’ve Developed 90% of customers say they are highly likely to use us again, another 6% say they are
likely – they cite our fast, easy, transparent and affordable approach
• Increase Realtor Partnerships
Marketing Initiatives
Page 21
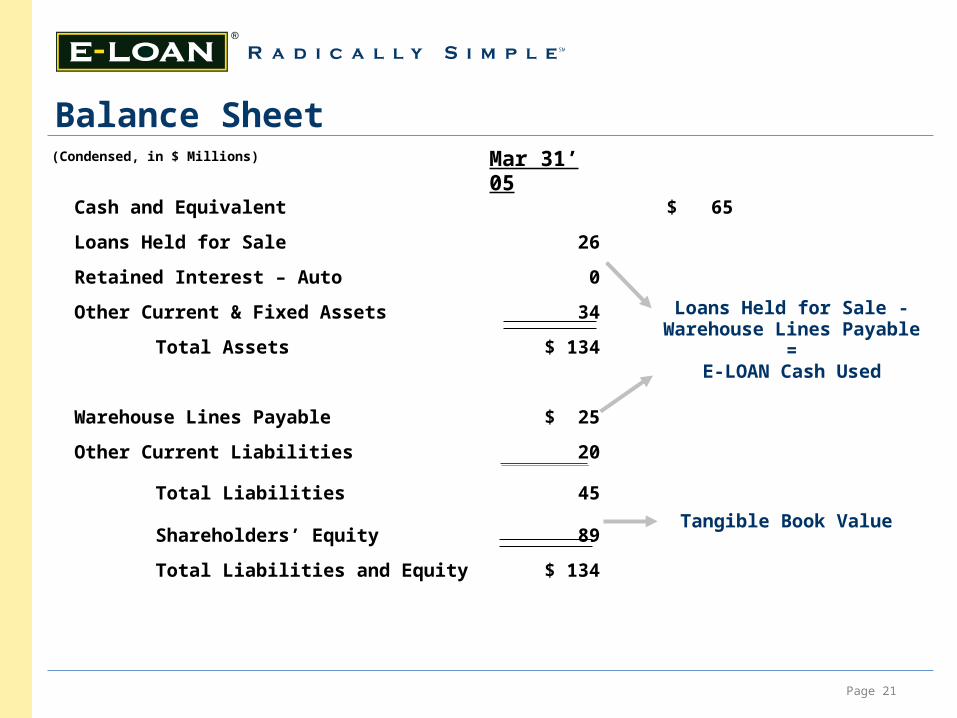
Cash and Equivalent $ 65
Loans Held for Sale 26
Retained Interest – Auto 0
Other Current & Fixed Assets 34
Total Assets $ 134
Warehouse Lines Payable $ 25
Other Current Liabilities 20
Total Liabilities 45
Shareholders’ Equity 89
Total Liabilities and Equity $ 134
(Condensed, in $ Millions) Mar 31’ 05
Tangible Book Value
Loans Held for Sale -Warehouse Lines Payable
=E-LOAN Cash Used
Balance Sheet

Proprietary & Confidential – E-LOAN, Inc. ©2005
Top Related