


Languages
Pages
Legal

Promoting consumption of traditional African
vegetables and its effect on food and nutrition security
in Tanzania
Justus Ochieng, Victor Afari-Sefa, Daniel Karanja,
Srinivasulu Rajendran, Samali Silvest, Radegunda Kessy
Invited paper presented at the 5th International Conference of the African Association of
Agricultural Economists, September 23-26, 2016, Addis Ababa, Ethiopia
Copyright 2016 by [authors]. All rights reserved. Readers may make verbatim copies of this
document for non-commercial purposes by any means, provided that this copyright notice
appears on all such copies.

1
Promoting consumption of traditional African vegetables and its effect on food and
nutrition security in Tanzania
Justus Ochieng*1
, Victor Afari-Sefa1, Daniel Karanja
2, Srinivasulu Rajendran
3, Samali Silvest
4,
Radegunda Kessy1
1World Vegetable Center, Eastern and Southern Africa, PO Box 10, Duluti, Tengeru, Arusha,
Tanzania;
2CABI, Nairobi Kenya;
3International Potato Center (CIP), Nairobi, Kenya
4Horticultural Research and Training Institute (HORTI)-Tengeru, Tanzania.
A paper presented at the fifth conference of the African Association of Agricultural Economists
(5th CAAAE)
“Transforming smallholder agriculture in Africa: The role of policy and governance.”
26-29 September 2016, Addis Ababa, Ethiopia
* Corresponding author email: [email protected].
2
Promoting consumption of traditional African vegetables and its effect on food and
nutrition security in Tanzania†
Justus Ochieng, Victor Afari-Sefa, Daniel Karanja, Srinivasulu Rajendran, Samali Silvest,
Radegunda Kessy
Abstract
Traditional African vegetables have recently received considerable attention for their
contribution to food and nutrition security and opportunities for enhancing smallholder
livelihoods. Promoting the production and consumption of traditional vegetables is expected to
enhance household nutrition among urban and rural households. The Good Seed Initiative (GSI)
program promoted production and consumption of nutrient-dense traditional African vegetables
in Arusha region in Tanzania to reduce malnutrition through diet diversification. This study
estimated the impact of the program on households, women of childbearing age, and children’s
dietary diversity. The study used cross-sectional data from 258 program participants and 242
non-participants households and applied matching techniques to control for problems associated
with unobserved heterogeneity, which could otherwise bias the outcome estimates. We compared
our findings with the inverse probability of treatment weighting to correct for selection bias. We
found that households participating in traditional vegetable promotion program had significantly
higher dietary diversity of children under five and women in reproductive age. We found no
significant impact of promotion program on households’ dietary diversity. The policy
implication is that scaling up promotional activities to encourage consumers to grow and eat
traditional vegetables would be an important element in initiatives to increase dietary diversity,
particularly for children under five and women of childbearing age in Tanzania.
1 Introduction
In sub-Saharan Africa, limited dietary diversity is a major challenge and cause of malnutrition in
rural farming communities (Afari-Sefa et al., 2012; Thompson and Meerman, 2013). This
situation persists because most households rely on carbohydrate-rich staples; only small
quantities of animal products, fruit, and vegetables are consumed, and thus diets lack the
spectrum of nutrients needed for health. Although Tanzania has made good progress in many
health indicators over the past decade, the nutritional status of the population remains low.
(UNICEF, 2016). Women and children under 5 years old are particularly at risk of poor health,
and are susceptible to infectious diseases such as diarrhea and respiratory infections that inhibit
nutrient absorption and decrease appetite (Ivers and Cullen, 2011). Currently, in Tanzania,
malnutrition affects about 34.7% of children under five, and 5.5% of women 15-49 years of age
are considered to be thin. (TNNS, 2014).
† This paper has been submitted for publication in Renewable Agriculture and food systems

3
Malnutrition is high among most rural and urban households in Tanzania, particularly in the low
income group, which consumes a diet of mainly carbohydrate-rich staples with low minerals and
vitamins (Leach and Kilama, 2009). Agriculture is the primary source of livelihood for most
households. Dietary diversity is a qualitative measure of food consumption that reflects
household access to a variety of foods including traditional vegetables, and is also a proxy for
nutrient adequacy of the diet of individuals (FAO, 2011). Diversifying diets with traditional
African vegetables is a sustainable way to supply a range of nutrients to the human body while
combating micronutrient malnutrition and associated health problems, particularly for poor urban
and rural households. Traditional vegetables are a vitally important source of micronutrients,
fibre, vitamins and minerals and are essential components of a balanced and healthy diet. In
addition, traditional vegetables are better adapted to the environment than standard vegetables,
and thus can provide low-cost quality nutrition to a large population segment (Chweya and
Eyzaguirre, 1999).
Vegetables and particularly, traditional vegetables, are rich in micronutrients and other health-
promoting phytochemicals. These nutrient-dense vegetables complement staple foods and
improve the nutritional quality of diets (Ojiewo et al., 2013a). Integrating a diversity of
micronutrient-rich foods such as vegetables, fruit and some animal products into diets has been
found to be one of the easiest and most sustainable ways to stop micronutrient deficiency (Ali
and Tsou. 1997). These vegetables have high levels of minerals, especially calcium, iron and
phosphorus, vitamins A and C and proteins (Nesamvuni et al., 2001), which are important to
vulnerable groups such as pregnant and nursing mothers. Spider plant (Chlorophytum comosum),
Roselle (Hibiscus sabdariffa) and Hair lettuce (Lactuca sativa) are excellent sources of iron
(Weinberger and Msuya, 2004) while African nightshade (Solanum nigrum), jute mallow
(Corchorus olitorius), and moringa (Moringa oleifera) are substantive sources of provitamin A
(Muchiri, 2004).
The existing demand for vegetables, particularly traditional vegetables, is very low and that this
is largely a problem of low consumer awareness. Demand creation activities such as promotion
campaigns through road, cook shows, nutritional awareness and educational programs in
hospitals, schools and markets are widely used in Africa to increase consumption of traditional
vegetables by rural and urban consumers. For example, promotional activities by selected
research institutes and nongovernmental organizations in East Africa have increased demand for
African nightshade in urban supermarkets, groceries, retail markets, and hotels (Ojiewo et al.,
2013b). However, there is a lack of evidence for the impact of such campaigns. This paper
contributes to filling this gap by estimating the impact of these promotion campaigns on
household dietary diversity in Tanzania. This evaluation will be useful to program implementers
when deciding to scale up promotion activities in different regions in Tanzania. The rest of the
paper is organized as follows: section two describes the methods employed including a brief
description of the theory of change of promotion campaign, estimation strategy, data sources and

4
sampling techniques. Section three discusses the results from the empirical analysis while the
last section concludes the paper.

5
2 METHODS
(a) Theory of change of traditional African vegetable promotion program
Consumption of traditional vegetables has increased among 88% of consumers in Tanzania while
70% of respondents were influenced by increased awareness of the potential of vegetables to
improve health and nutrition (Amaza, 2010). The activities implemented by CABI’s Good Seed
Initiative funded by Irish Aid are expected to contribute to a further increase in consumption of
vegetables. Traditional vegetables are generally considered to be of high nutritive value, and
resistant to pests, diseases and climatic extremes compared with standard vegetables. The
program strategy aims to (a) enhance nutrition security for poor urban and rural populations,
including farmers, by increasing their consumption of nutrient dense traditional African
vegetables to complement staple-based diets; and (b) improve food and income security for poor
rural farmers producing seed through the increased use of high quality seeds of improved
vegetable varieties and adoption of good agricultural practices (GAP). The program is being led
by CABI, with AVRDC – The World Vegetable Center, INADES Formation International, and
the Horticultural Research and Training Institute (HORTI)-Tengeru as implementing partners.
The program aims to reach a large number of consumers and growers directly and indirectly
through diverse, community-focused mass media approaches (i.e., road shows, seed rallies and
agricultural shows and events) to delivering information and knowledge.
The project conducted promotional activities in 2014 and 2015, which includes road shows, cook
shows, nutritional sensitization and awareness program campaigns in hospitals, schools, markets
and villages to increase consumption of traditional vegetables by rural and urban consumers,
improve diet diversity, and create demand for traditional vegetables and market incentives for
producers. The program distributed health and nutrition fact sheets about different vegetables to
consumer households with children under 5 and women in reproductive age (15-35 years). These
activities are expected to lead to increased awareness of the nutritional importance of traditional
African vegetables, and to changes in knowledge, attitudes and behaviors related to their
production and consumption. These activities have been carried out because, in other locations
(i.e., some parts of Kenya and Tanzania), traditional vegetables are competing with standard
vegetables in supermarkets and different market outlets (Ojiewo, 2013b). Therefore, it is
important to understand the impact of these activities on nutrition security among consumers in
the Arusha region of Tanzania and by extension to other similar agro-ecologies.
(b) Estimation strategy
In theory, evaluating the impacts of a program, an experimental approach is normally appropriate
to obtain a comparison group to prevent selection bias. However, in this study, it was not
possible to randomly assign consumers into intervention and control groups to prevent the
underlying selection bias. In this kind of situation, an impact evaluation is often carried out using
a suitable non-experimental method (Caliendo and Kopeinig, 2008). We adopted propenisity
score matching approach as originally proposed by Rosenbaum and Rubin (1983) to estimate the
impact of the Good Seed Initiative traditional African vegetables promotion program on dietary
diversity of consumer households. We evaluated the impact of the promotion program by
estimating the average treatment eff ect on treated (ATT) which explicitly evaluate the effects on
those for whom the program was actually intended. Average treatment effects (ATE) is useful to
6
evaluate what is the expected effect on the outcome if individuals in the population were
randomly assigned to treatment but might not be of relevance to policy makers because it
includes the effect on persons for whom the program was never intended (Heckman 1997). ATT,
the parameter of interest in most evaluation studies is estimated as follows:
)1()1()1|( 01 IYEIYEIE iii (1)
where i denotes the unbiased welfare eff ect for consumers’ households i that participate in
the promotion program, 1I . In this case, 1I means that households participate in the
promotion program. 1iY is the outcome variable (e.g., dietary diversity and consumption levels)
with participation in promotion activities, while iY0is the outcome variable if the same
consumer/household did not participate. Unfortunately, estimating the impact of promotional
activities from equation 1 is practically impossible because the same consumer cannot be
observed with and without the program intervention, thus one can only compare participants and
non-participants in Eq. 2:
)0()1()1|( 010 IYEIYEIE ii (2)
where )0( 0 IY i is the outcome for consumers not participating in the traditional African
vegetable promotion program. Equations (1) and (2) lead to similar results when there is no
systematic diff erence between participating and non-participating consumers, except for the
underlying promotion activities being evaluated. Normally, when participating and non-
participating consumers diff er in terms of observed or unobserved characteristics, Eq. (2) will
lead to biased impact (outcome) estimates, where the selection bias µ can be represented as:
)0()1( 00 IYEIYE ii (3)
Using PSM reduces selection bias µ (equation 3) while also identifying non-intervention
consumer households who are similar to program participants in their observable characteristics
(See Table 1). PSM is often used to evaluate impacts of a binary treatment variable (e.g. Fischer
and Qaim, 2012; Ochieng et al., 2015; Schreinemachers et al. 2016). The first step of PSM is to
summarize the pre-treatment characteristics of each subject into a single index variable
(propensity score), and then uses the propensity score to match similar consumers. Propensity
score is the predicted probability of a household participating in the promotion program,
conditional on confounding covariates. We estimated the propensity score using a probit model
following the work of Johnston and DiNardo, 2007.
The next step in the implementation of PSM method is to choose a matching estimator. Caliendo
and Kopeinig, (2008) indicates that a good matching estimator does not eliminate too many of
the original observations from the final analysis but yield statistically equal covariate means for
individuals in the intervention and control groups. The difference in outcome variables is
7
calculated for each matched pair and then averaged over the entire sample to obtain the average
treatment effect (ATT). The outcome variables in this paper are the dietary diversity of children,
women and household. In this paper, we employed nearest neighbor matching (NNM) and kernel
matching (KM), two commonly used algorithms for empirical analysis (Caliendo & Kopeinig,
2008). The NNM involves choosing an individual consumer from the control group for matching
purposes with each treated individual based on propensity scores.
NNM is likely to yield poor matches especially if the closest neighbor is far away. Therefore, we
matched each treated household with the nearest neighbors (without replacement) in terms of
propensity score distances. Kernel matching, compares treated and control households based on
kernel-weighted averages (Caliendo & Kopeinig, 2008). PSM is based on the assummption of
conditional independence assumption (CIA), which is also called selection on observables
(Rosenbaum & Rubin, 1983). This implies that PSM controls for only observed heterogeneity
between treated and control groups. Thus, ATT estimates could still be biased when there is
unobserved heterogeneity. We test for influence of such hidden bias by calculating Rosenbaum
bounds (Rosenbaum, 2010). Rosenbaum's bounds helps to assess how robust the results are to
hidden biases due to unobserved characteristics. High sensitivity to hidden bias exists when
conclusions change, for the critical value of gamma (Γ) is just slightly above one while low
sensitivity exists if conclusions change at large values of Γ (Rosenbaum, 2005). We estimated
PSM using Psmatch2 command in STATA as proposed by Leuven and Sianesi, (2003).
Given that PSM was initially developed and used for the estimation of treatment effects with
large sample sizes (Rosenbaum & Rubin, 1983). When the sample size is small, the matching
procedure may possibly lead to biased results. Estimating the impact with small samples, it may
be difficult to find enough matches to produce reliable estimates due to loss in the statistical
power of the comparison between intervention and control households. Pirracchio et al. (2012)
used simulations to demonstrate that PSM can produce reliable estimates with small samples,
particularly when the propensity model is properly specified. Following Pirracchio et al.’s study,
we adopted the inverse probability of treatment weighting (IPTW) to further test our results.
IPTW has often been used to reduce selection bias in studies with observational data (Hirano &
Imbens, 2001).
(c) Dietary diversity
Dietary diversity was determined by a qualitative 24-hour recall of all the different categories of
foods and drinks consumed by the respondent (individual level) or any other household member
(household level). The household dietary diversity score (HDDS) is meant to reflect, in snapshot
form, the economic ability of a household to access a variety of foods. Individual dietary
diversity scores (IDDS) aim to reflect nutrient adequacy (Kennedy et al 2010). Measuring IDDS
in different age groups has shown that an increase in an individual dietary diversity score is
related to increased nutrient adequacy of the diet (Kennedy et al, 2010). For the purpose of this

8
study, we calculated children’s dietary diversity (CDDS) and women’s dietary diversity score
(WDDS).
The WDDS and CDDS reflect the probability of micronutrient adequacy of the diet and therefore
food groups included in the score are tailored towards this purpose. They basically show the
quality of the diet consumed by women (aged 14-35 years) and children (under 5 years). Savy et
al. (2005) found out that the dietary diversity score represents the overall dietary quality of
women and children in a poor rural African setting very well and can be linked easily to their
nutritional status. We focus on girls and women only as they are usually responsible for
household food preparation and they are also a vulnerable group in terms of nutritional health
(Keding et al., 2007). To estimate the HDDS, the questions were answered by the person
responsible for food preparation for the household on the previous day while for IDDS,
responses were elicited from girls/women aged 14-35 years. The WDDS and CDDS captured all
the foods a woman consumed the previous day, both inside and outside the home.
The questionnaire captured the respondents’ dietary history based on a 24-hour dietary recall to
obtain information about the food intake of respondents or households3. Respondents were asked
to recall all the foods eaten and beverages taken in the previous 24 hours prior to the interview.
A set of 12 food groups was used in assessing the HDDS while 9 food groups were used to
compute WDDS and CDDS. This was justified, as previous research has shown that some food
groups—fats and oils, sugar/honey, and spices, condiments and beverages—do not contribute to
the micronutrient density of the diet. These food groups were not part of the women’s and
children’s dietary diversity scores (Kennedy, 2010). As part of the field survey, we did more
probing for snacks eaten between main meals and special foods given to children.
(d) Data sources and sampling
A purposive sampling technique was adopted to identify the survey area based on interaction
with project partners. The target population was identified from a survey carried out in the study
locations in year 2013-144. The intervention areas were those regions where the program team
and partners performed promotion activities while in control areas no promotion was carried.
The sample include consumers from rural and urban areas and includes farmers, traders and
urban consumers. A random sample from intervention and control areas yielded a total sample
size of 500 households with children under 5 years and women in reproductive age (15-35
years). Out of this sample, 258 and 242 were designated as households from intervention and
control regions, respectively. The sample was in three major categories: Direct beneficiaries
were selected randomly from those who participated in the survey during promotional activities
3 The questionnaire was administered between November and December, 2015 among consumer households in
Arusha region. 4 Both cook show and road rallies were performed in public places and open to all people, mainly in villages,
hospitals and schools. Anyone who participated in the program or got information from the participants was
considered a beneficiary. A random walk was done for indirect beneficiaries by mapping the location and randomly
selecting the people. For example, we did road rallies in the market, so we randomly approached traders who were
considered to be indirect beneficiaries.

9
such as road shows and cook shows; this category was randomly sampled from the list of
beneficiaries generated during the promotional activities. The second category were indirect
beneficiaries-people who lived in the same locations and received information from neighbors or
participants. The control group had never been exposed to any of the promotional activities
introduced by project team members. The survey team interviewed household heads or spouses
and in some instances the person responsible for preparing food in the household.
3. ESTIMATION RESULTS AND DISCUSSION
(a) Descriptive statistics
Farmers need to integrate traditional vegetables into dominant staple-based farming systems to
complement other sources of household income in Tanzania in order to meet the increased
demand. African nightshade (S. nigrum), African eggplant (Solanum aethiopicum), amaranth,
okra (Abelmoschus esculentus), sweet potato (Ipomoea batatas) and pumpkin leaves (Cucurbita
maxima) were the most widely consumed traditional vegetables, mainly purchased from markets
in the Arusha region (Fig. 1). Traditional vegetables such as baobab leaves (Adansonia digitate),
false sesame (Ceratotheca sesamoides), black jack (Bidens pilosa and “Vishonanguo” in
Swahili) and Crotalaria (“Majerea” in Swahili) were not consumed by the sampled households.
A study in rural areas of East Africa has shown that starchy staples provide somewhat more than
70% of the calorie intake of farmers in Rwanda, Uganda and Tanzania (Ecker et al., 2010). The
sources of important micronutrients (such as fruit and vegetables) are not being consumed in
sufficient amounts to provide the necessary vitamins and minerals for good health.
Figure 1. Percentage of households consuming traditional African vegetables (TAVs) in 7 days.
Source: Survey results, 2015
0.0% 20.0% 40.0% 60.0% 80.0% 100.0%
African eggplant (ngogwe)
African nightshade (mnavu)
Amaranth (mchicha)
Okra (bamia)
Sweet potato leaves
Pumpkin leaves (maboga)
Ethiopian mustard (loshuu)
Cowpea leaves (kunde)
Spider plant (mgagani)
Jute mallow (mlenda)
Cassava leaves
Percent of households consuming different TAVs
All households
Control households
Treatment households
10
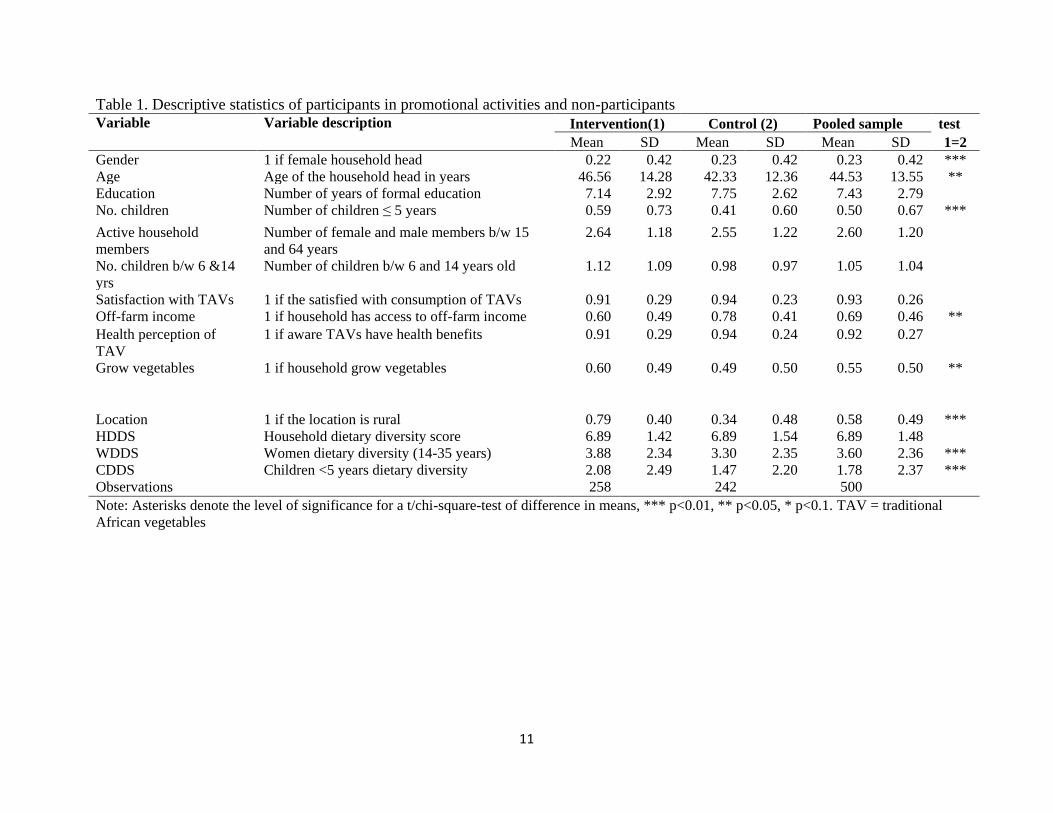
We included a number of variables hypothesized to influence participation in the promotion
program. The number of children under 5 years of age and those above 5 has been included to
indicate the number of dependents, a factor that may influence household participation in the
program. This is because children are the most affected in terms of nutrient deficiency in
Tanzania (TNNS, 2014). The variable for active members of the household between 15 and 64
years of age indicates household labor self-sufficiency, which has a positive influence on both
vegetable production and purchase decisions. The average household size was 4.6 and 4 persons
in treated and control participants, respectively (Table 1). The average age of the household
head was 46 years in intervention groups and 42 years in the control group. Overall, 23% of the
sampled households were headed by women. The gender of the household head is important
because it influences decisions and is linked to natural, financial and labor resource access,
which consequently affects the accessibility to information and dietary diversity.
Education facilitates acquisition of skills that would enable a household to have better access to
human nutritional education information and may enhance understanding of the importance of
increasing consumption of traditional vegetables. However, based on previous research,
household heads with a higher educational status have a lower probability of consuming
traditional vegetables compared to the less educated (Taruvinga and Nengovhela, 2015).
Households in rural areas significantly spent more on traditional vegetables than households
living in urban areas. We hypothesized that households growing vegetables and those living in
rural areas would have a higher probability of participation in the program, as they would be
expected to consume more traditional vegetables.
11
Table 1. Descriptive statistics of participants in promotional activities and non-participants Variable Variable description Intervention(1) Control (2) Pooled sample test
Mean SD Mean SD Mean SD 1=2
Gender 1 if female household head 0.22 0.42 0.23 0.42 0.23 0.42 ***
Age Age of the household head in years 46.56 14.28 42.33 12.36 44.53 13.55 **
Education Number of years of formal education 7.14 2.92 7.75 2.62 7.43 2.79
No. children Number of children ≤ 5 years 0.59 0.73 0.41 0.60 0.50 0.67 ***
Active household
members
Number of female and male members b/w 15
and 64 years
2.64 1.18 2.55 1.22 2.60 1.20
No. children b/w 6 &14
yrs
Number of children b/w 6 and 14 years old 1.12 1.09 0.98 0.97 1.05 1.04
Satisfaction with TAVs 1 if the satisfied with consumption of TAVs 0.91 0.29 0.94 0.23 0.93 0.26
Off-farm income 1 if household has access to off-farm income 0.60 0.49 0.78 0.41 0.69 0.46 **
Health perception of
TAV
1 if aware TAVs have health benefits 0.91 0.29 0.94 0.24 0.92 0.27
Grow vegetables 1 if household grow vegetables 0.60 0.49 0.49 0.50 0.55 0.50 **
Location 1 if the location is rural 0.79 0.40 0.34 0.48 0.58 0.49 ***
HDDS Household dietary diversity score 6.89 1.42 6.89 1.54 6.89 1.48
WDDS Women dietary diversity (14-35 years) 3.88 2.34 3.30 2.35 3.60 2.36 ***
CDDS Children <5 years dietary diversity 2.08 2.49 1.47 2.20 1.78 2.37 ***
Observations 258 242 500
Note: Asterisks denote the level of significance for a t/chi-square-test of difference in means, *** p<0.01, ** p<0.05, * p<0.1. TAV = traditional
African vegetables

12
(b) Factors influencing program participation
The estimation results indicated that participation in the Good Seed Initiative traditional African
vegetable promotion program is strongly associated with the household’s socioeconomic as well
as location characteristics (Table 2). The simple mean comparisons of the outcome variables
between the two groups do not control for the effect of other covariates (see Table 1). In
particular, the households with more numbers of children aged between 6 and 14 years old were
likely to participate in the program, probably because this age category of children are in a much
better position age-wise to consume all types of traditional vegetables. Also households with
many children under 5 years also were more likely to participate in traditional African vegetable
promotion activities. Households in Tanzania have been advised to increase feeding of children
on fruits and vegetables to protect children against stunting and vitamin and mineral deficiencies
(UNICEF, 2010). Previously, cereals and tubers such as Irish potatoes have been the most
common child-weaning foods across sub-Sahara Africa (Sawadogo et al., 2010). Households
located in rural areas were more likely to participate in the program. This is consistent with the
results that rural populations often have positive perceptions of traditional vegetables and have a
higher propensity to consume them than urban consumers (Johns, and Sthapit, 2004).
Table 2. Factors influencing consumers’ participation in the Good Seed Initiative
traditional African vegetable promotion program
Variables Coefficient Standard error Marginal effect
Gender 0.196 0.165 0.078
Age 0.008 0.006 0.003
Education -0.041 0.026 -0.016
Number of No. of children ≤ 5years 0.187* 0.101 0.075
Active household members 0.028 0.056 0.011
No. of children b/w 6 &14years 0.129** 0.064 0.052
Satisfaction with TAVs -0.328 0.273 -0.128
Off-farm income -0.252* 0.145 -0.100
Health perception of TAV 0.274 0.266 0.108
Grow vegetables 0.314** 0.134 0.125
Location 1.296*** 0.134 0.482
Constant -0.044 0.508
LR chi2(11) 135.410
Prob > chi2 0.000
Pseudo R2 0.207
Log likelihood = -259.191
Note: Asterisks denote the level of significance, *** p<0.01, ** p<0.05, * p<0.1. TAV =
traditional African vegetables

13
(b) Impact of promotion program
The probit model to calculate individual propensity scores was used to match program
participants and non-participants (Table 2). The procedure revealed the underlying causal effects
of participating in promotions on household food and nutrition security. As is typically the case,
PSM controls for all confounding factors that correlate with both dietary diversity and program
participation. Before assessing the impacts of participation, we test the quality of matches to
check for the fulfilment of common support conditions, and to ensure that the balancing
requirement of PSM is satisfied. The density distribution of estimated propensity scores for the
two groups of farmers is presented in Fig. 2. The propensity score distributions of the
intervention and control farmers indicate that there might be a lack of overlap at the left- and
right-hand side of the distributions. We will therefore test if ATT are sensitive to dropping
observations outside the common support in section 2(c). We further plot the density plots for the
matched sample which are nearly indistinguishable, implying that matching on the estimated
propensity score balanced the covariates (Fig. 1A in Annex).
Figure 2. Distribution of estimated propensity scores and common support for the intervention
and control groups
0 .2 .4 .6 .8 1Propensity Score
Untreated Treated: On support
Treated: Off support

14
We further carried out several tests including a balancing test based on kernel matching for all
the covariates (Table 1A in Annex). Participants and non-participants had statistically similar
characteristics after matching in contrast to the unmatched sample. In particular, the test for
equality of the two group means shows that there was no statistically significant difference
between participants and non-participants after matching. Moreover, the standardized differences
(% bias) for the mean values of all covariates after matching are below 20% (Table 1A Annex).
Based on Rosenbaum and Rubin (1983), matching is regarded as successful if it results in bias
less than 20% for all covariates.
The outcome impacts are estimated using alternative matching estimators to ensure robustness
(Table 3). All the matching estimators yielded similar results and show that participating in the
program had a positive and significant effect on children’s dietary diversity (CDDS) and
women’s dietary diversity (WDDS) However, the program seemingly did not favor the whole
household dietary diversity (HDDS), probably because the household heads gave priority to
young women (14-35 years) and children under 5 years old with regard to household nutrition.
According to Backer and Ichino (2002), a combination of matching approaches is adequate to
reach a reliable conclusion on the relative effect of an intervention. The underlying results from
our study thus offer useful insights and recommendations for the Good Seed Initiative project
implementers, other development partners, and policy makers on how best to scale up
promotional activities to improve diet diversity for rural and urban households while also
creating demand for traditional vegetables and market incentives for producers. This is
important, particularly for children below 5 years, girls and women who are usually vulnerable in
terms of nutrition, and whose health would benefit from traditional African vegetable
consumption (Keding et al., 2007). Our results are thus consistent with those of several authors
on the need to increase fruit and vegetable consumption to increase a household’s opportunities
to achieve a properly balanced diet (Afari-Sefa et al., 2012; Keatinge et al., 2011).
Table 3. Estimation of average treatment effect of program participation and sensitivity analysis
Dietary Diversity outcome ATT SE t-statistic Γ
Nearest neighbor matching (NNM)
HDDS -0.044 0.142 -0.31
WDDS 0.724 0.216 3.34*** 1.15-1.90
CDDS 0.539 0.222 2.43** 1.25-1.65
Kernel matching
HDDS -0.221 0.177 -1.24 n.a
WDDS 0.093 0.275 0.45 n.a
CDDS 0.679 2.530 2.53** 1.15-1.63
Inverse probability of treatment weighting (IPTW)
HDDS -0.118 0.158 -0.75 n.a
WDDS 0.649 0.236 2.75*** n.a
CDDS 0.377 0.210 1.79* n.a Note: Asterisks denote the level of significance *p<0.1, p<0.05 and *** p<0.01. Γ= Critical level of hidden bias; SE is
standard error and n.a-not applicable. CDDS=Children dietary diversity; WDDS=Women’s dietary diversity and HDDS-
Household dietary diversity

15
(c) Robustness checks
We carried out additional analyses to test the robustness of our estimated results with respect to
possible hidden bias and sample size challenges in PSM estimation. PSM does control for
selection bias in impact/outcome assessment that is caused by observed heterogeneity between
intervention and control groups. Despite using a broad set of household socioeconomic factors to
calculate the propensity scores (Table 2), it is still possible that there were unobserved factors
that could be jointly correlated with the decision to participate in the promotion program, and
with household nutrition status. This kind of unobserved heterogeneity could bias the estimated
treatment effects. To test the robustness of the results, we calculated Rosenbaum bounds
sensitivity analysis for hidden bias (Rosenbaum, 2005). Rosenbaum bounds show the critical
values of gamma (Γ) at which the estimated impact can be questioned. It measures how large the
difference in unobserved factors influencing the decision to participate would have to render the
estimated impact insignificant.
The test for the significant impact on CDDS gave values ranging from 1.15 to 1.90. The critical
values of gamma (Γ) are presented in the second last column of Table 3. The upper bound of
1.90 implies that matched households with the same observed covariates would have to differ in
terms of unobserved covariates by a factor of 1.90 (90%) to invalidate the conclusion of a
significant treatment effect. We acknowledge that the 1.15 critical value of Γ indicates that the
result is highly vulnerable to unobserved bias. However, the results conform to those of other
studies such as Clement (2011), Becerril and Abdulai (2010), and Ochieng et al. (2015) that have
also reported low values of Γ. Based on the test results we can conclude that the impact of the
program on dietary diversity, particularly on children below 5 years, is robust to possible hidden
bias. The inverse probability of treatment weighting (IPTW) results are presented in Table 3.
The estimated treatment effects with PSM and IPTW approaches are very similar, which further
increases the confidence in our estimated PSM results.
5 CONCLUSION
Reducing malnutrition, particularly among women and children under 5 years, is a priority of
Tanzania’s government (URT, 2008), given that more than one-third of all under-5 deaths are
linked with malnutrition (UNICEF, 2010). Therefore, the Good Seed Initiative traditional
African vegetable promotion program sought to contribute to the government’s goal of reducing
malnutrition through diet diversification by promoting the production and consumption of
nutrient-dense traditional African vegetables. Our study estimated the impact of the nutrition
education promotional activities on the dietary diversity of households, women of childbearing
age, and children using matching technique to control for problems associated with unobserved
heterogeneity, which often bias the estimated outcomes. Promoting production and consumption
of traditional vegetables is expected to play an important role in achieving better nutrition among
urban and rural households in Tanzania. Our results suggest that participating in traditional
vegetable promotion programs has a statistically significant and positive impact on dietary

16
diversity of children and women. We do not find positive and significant impact of the
promotion program on household dietary diversity. Given that we compared our findings with
the inverse probability of treatment weighting (IPTW) and conducted robustness tests, our results
can be considered reasonably robust. We acknowledge, however, that these results cannot be
generalized at the national level because the sample is not representative of the whole country.
Despite this limitation, the findings of this paper contribute to the limited body of knowledge on
household nutrition and benefits of promoting production and consumption of traditional African
vegetables in Tanzania. Specifically, our findings suggest that scaling up promotional activities
and encouraging consumers to grow traditional vegetables would be important in increasing
dietary diversity, particularly for children under 5 years and women of childbearing age.
However, participation in such programs could be made easier by targeting children and women
in hospitals and schools.
ACKNOWLEDGEMENTS
We would like to acknowledge the contributions of staff from our collaborating partners,
INADES Formation International and HORTI-Tengeru, who participated in planning and rolling
out the Good Seed Initiative traditional African vegetable nutrition education promotion
program. Financial support provided by the Irish Aid for the Good Seed Initiative through CABI is
gratefully acknowledged. We also wish to thank Karen Hampson and Japhet Emmanuel for their
contribution in the implementation of the Good Seed Initiative in Tanzania.
REFERENCES
Afari-Sefa, V., Tenkouano, A., Ojiewo, C., Keatinge, J.D.H. and Hughes, J. d’A. 2012.
Vegetable breeding in Africa: Constraints, complexity and contributions towards
achieving food and nutritional security. Food Security, 4:115-127
Ali, M. and Tsou, S.C.S. 1997. Combating Micronutrient Deficiencies through Vegetables – A
Neglected Food Frontier in Asia, Food Policy, 22: 17-38
Amaza P.S. 2010. An Analysis of Traditional African Vegetables and Sweet potato Consumer
Demand in Kenya and Tanzania. Technical Report Submitted to AVRDC – The World
Vegetable Center, Arusha, Tanzania.
Becerril, J. and Abdulai, A. 2010. The Impact of Improved Maize Varieties on Poverty in
Mexico: A Propensity Score-Matching Approach. World Development, (38)7: 1024–
1035.
Caliendo, M., and Kopeinig, S. 2008. Some practical guidance for the implementation of
propensity score matching. Journal of economic surveys, 22(1): 31-72.
Chweya, J. A. and Eyzaguirre, P.B. 1999. The biodiversity of traditional leafy vegetables.
International Plant Genetics Resources Institute. Rome, Italy

17
Clement, M. 2011. Remittance and household expenditure patterns in Tajikistan: A propensity
score matching analysis. GREThA, CNRS, UMR 5113, University of Bordeaux, Talence,
France. http://cahiersdugretha.u-bordeaux4.fr/2011/2011-09.pdf Accessed on 3rd
February, 2016.
Ecker, O., Weinberger, K., and Qaim, M. 2010. Patterns and determinants of dietary
micronutrient deficiencies in rural areas of East Africa. African Journal of
Agricultural and Resource Economics, 4:175-194.
Fischer, E. and Qaim, M. 2012. Linking smallholders to markets: Determinants and impacts of
farmer collective action in Kenya. World Development, 40: 1255–1268.
Heckman. J. 1997. Instrumental Variables - A Study of the Implicit Behavioral Assumptions
Used in Making Program Evaluations, The Journal of Human Resources, 32(3), 441–462.
Hirano, K. and Imbens, G. W. 2001. Estimation of causal effects using propensity score
weighting: An application to data on right heart catheterization. Health Services and
Outcomes Research Methodology, 2: 259–278.
Ivers, L. C. and Cullen, K. A. 2011. Food insecurity: special considerations for women,” The
American Journal of Clinical Nutrition, 94:1740–1744.
Johns, T. and Sthapit, B. 2004. Bio-cultural diversity in the sustainability of developing country
food systems. Food and Nutrition Bulletin. 25: 143-155.
Johnston, J. and DiNardo, J. 2007. Econometric Methods. Fourth Edition.McGraw-Hill
Publishers, Singapore.
Keatinge, J.D.H., Yang, R-Y., Hughes, J. d’A., Easdown W.J., and Holmer, R. 2011. The
importance of ensuring both food and nutritional security in the likely future
attainment of the millennium development goals. Food Security 3: 491-501.
Keding, G.B., Msuya J.M., Maass B.L., and Krawinkel M.B. 2012. Relating dietary diversity and
food variety scores to vegetable production and socio-economic status of women in
rural Tanzania. Food Security. 4:129–140.
Kennedy, G., Ballard, T., & Dop, M. (2010). Guidelines for measuring household and individual
dietary diversity. Rome: Nutrition and Consumer Protection Division, Food and
Agriculture Organization of the United Nations. Available from
http://www.fao.org/3/a-i1983e.pdf. Accessed on 20th December, 2015.
Leach, V. and Kilama, B. 2009. Institutional Analysis of Nutrition in Tanzania. Special Paper
09.31, Dar es Salaam, Research on Poverty Alleviation (REPOA).Downloadable at:
http://www.repoa.or.tz/documents/Special_Paper_09.31_.pdf. Accessed on 1st March,
2016
Leuven, E., and Sianesi, B., 2003. PSMATCH2: Stata module to perform full Mahalanobis and
propensity score matching, common support graphing, and covariate imbalance
testing. Boston College Department of Economics, Statistical Software Components.
Downloadable from http://ideas.repec.org/c/boc/bocode/s432001.html.
18
Muchiri, S.V. 2004 Characterization and Purification of African Nightshade Accessions for
Sustainable Seed Purification in Kenya, In the Proceedings of the Third Horticulture
Workshop on Sustainable Horticultural Production in the Tropics, 26th -29th
November 2003. Maseno University, MSU, Maseno, Kenya. http://www.igps.uni-
hannover.de/fileadmin/gemuesebau/pdf/SVepit/PROCEEDINGS_2003.pdf. Accessed
on 25th
February, 2016.
Nesamvuni, C., Steyn, N.P., and Potgieter, M.J. 2001. Nutritional value of wild leafy plants
consumed by the Vhavenda, South African Journal of Science, 97:52–54.
Ochieng, J., Ouma, E., Knerr, B. and Owuor, G. 2015. Agricultural commercialization and
household food security: The case of smallholders in Great Lakes Region of Central
Africa. A paper presented at IAAE conference, Milan, Italy. http://purl.umn.edu/212588.
Accessed on 3rd February, 2016.
Ojiewo, C. O., Abdou, T., Hughes, J., and Keatinge, J.D.H. 2013a. “Diversifying Diets: Using
African Indigenous Vegetables to Improve Nutrition and Health.” In Diversifying Food
and Diets: Using Agricultural Biodiversity to Improve Nutrition and Health, eds. J.
Fanzo, D. Hunter, T. Borelli, and F. Mattei Earthscan. Abingdon, UK: Routledge, 291–
302.
Ojiewo, C.O., Mwai, G.N., Abukutsa-Onyango, M. O., Aging, S.G., and Nono- Womdim, R.
2013b. “Exploiting the Genetic Diversity of Vegetable African Nightshades.”
Bioremediation, Biodiversity and Bioavailability, 7: 6–13.
Pirracchio, R., Resche-Rigon, M., and Chevret, S. 2012. Evaluation of the propensity score
methods for estimating marginal odds ratios in case of small sample size. BMC Medical
Research Methodology, 12: 70.
Rosenbaum, P. R. and Rubin, D. B. 1983. The central role of the propensity score in
observational studies for causal effects. Biometrica, 70: 41–55.
Rosenbaum, P.R. 2005. Sensitivity Analysis in Observational Studies. Encyclopedia of Statistics
in Behavioral Science, 4: 1809-1814.
Schreinemachers, P., Wu, M.-h., Uddin, M. N., Ahmad, S., and Hanson, P. 2016. Farmer training
in off-season vegetables: Effects on income and pesticide use in Bangladesh. Food
Policy, 61, 132-140.
Sawadogo, S. P., Yves, M. P., Claire, M. R., Alain, B., Alfred, T. S., Serge, T., and Francis, D.
2010. Late introduction and poor diversity were the main weaknesses of complementary
foods in a cohort study in rural Burkina Faso. Nutrition, 26: 746-752.
Savy, M., Martin-Prevel, Y., Sawadogo, P., Kameli, Y., and Delpeuch, F. 2005. Use of
variety/diversity scores for diet quality measurement: relation with nutritional status of
women in a rural area in Burkina Faso. European Journal of Clinical Nutrition, 59:
703–716.
Taruvinga, A., and Nengovhela, R. 2015. Consumers Perceptions and Consumption Dynamics of
African Leafy Vegetables (ALVs): Evidence from Feni Communal Area, Eastern Cape
Province, South Africa. 5th International Conference on Biomedical Engineering and

19
Technology (ICBET 2015). http://www.ipcbee.com/vol81/016-ICBET2015-
Y3004.pdf. Accessed on 22nd
January, 2016.
Thompson, B., and Meerman, J. 2010. Towards Long-Term Nutrition Security: The Role of
Agriculture in Dietary Diversity, Proceedings of the international symposium on food
and nutrition security: Food-based approaches for improving diets and raising levels of
nutrition, Rome, FAO and Wallingford, UK, CABI.
TNNS. 2014. Tanzania National Nutrition Survey, 2014.
http://www.unicef.org/esaro/Tanzania_National_Nutrition_Survey_2014_Final_Repor
t_18012015.pdf. Accessed on 22nd
January, 2016.
UNICEF. 2016. http://www.unicef.org/tanzania/nutrition.html. Accessed on 22nd
January, 2016.
UNICEF. 2010. Children and Women in Tanzania.
http://www.unicef.org/tanzania/SITAN_Mainland_report.pdf. Accessed on 9th March,
2015.
URT. 2008. United Republic of Tanzania. The National Road Map Strategic Plan to Accelerate
Reduction of Maternal, Newborn and Child Deaths in Tanzania. The National Road
Map Strategic Plan -2008 – 2015. Ministry of Health and Social Welfare.
http://www.who.int/pmnch/countries/tanzaniamapstrategic.pdf. Accessed on 9th
March, 2015.
Weinberger, K. and Msuya, J. 2004. Indigenous Vegetables in Tanzania: Significance and
Prospects, Technical Bulletin No. 31, AVRDC – The World Vegetable Center,
Shanhua, Taiwan.

20
ANNEX: Supporting information
Figure 1A. Kernel density distribution showing overlap between intervention and control
households
Table 1A. Testing for the matching quality
Variables Before Matching After Matching
Treated Control %(bias) Treated Control %(bias)
Gender 0.221 0.228 -1.6 0.216 0.207 2.1
Age 46.713 42.526 31.4 46.631 46.754 -0.9
Education 7.131 7.741 -21.9 7.183 7.662 -17.2 Number of No. of children ≤
5years 0.578 0.430 22.1 0.568 0.519 7.4 Active household members 2.680 2.575 8.7 2.676 2.830 -12.6 No. of children b/w 6
&14years 1.115 0.961 15 1.108 1.004 10.1 Satisfaction with TAVs 0.930 0.947 -7.1 0.938 0.937 0.4 Off-farm income 0.623 0.776 -33.9 0.627 0.576 11.2
Health perception of TAV 0.934 0.943 -3.6 0.938 0.921 6.8
Grow vegetables 0.594 0.487 21.6 0.589 0.592 -0.5
Location 0.799 0.346 102.7 0.797 0.794 0.6 Notes: The results are for Kernel matching procedure. TAV = traditional African vegetables
01
23
0 .5 1 0 .5 1
Unmatched Matched
Control Intervention
Den
sity
Propensity Score
Top Related