


Languages
Pages
Legal


Product and service adaptation

Marketing Policies
• Same products sold everywhere the same way = (full) standardization = global strategy
• Adapt to local conditions = adaptation = multidomestic strategy

Benefits from Standardization
• lower costs
• improved quality
• enhanced customer preference
• increased competitive leverage
• global customers and suppliers

Lower Costs
• Experience curve
• Bargaining power
• Economies of scale

Economies of Scale
• in manufacturing
• in research and development
• in advertising– scale economies in advertising– media overlaps– pan-European events

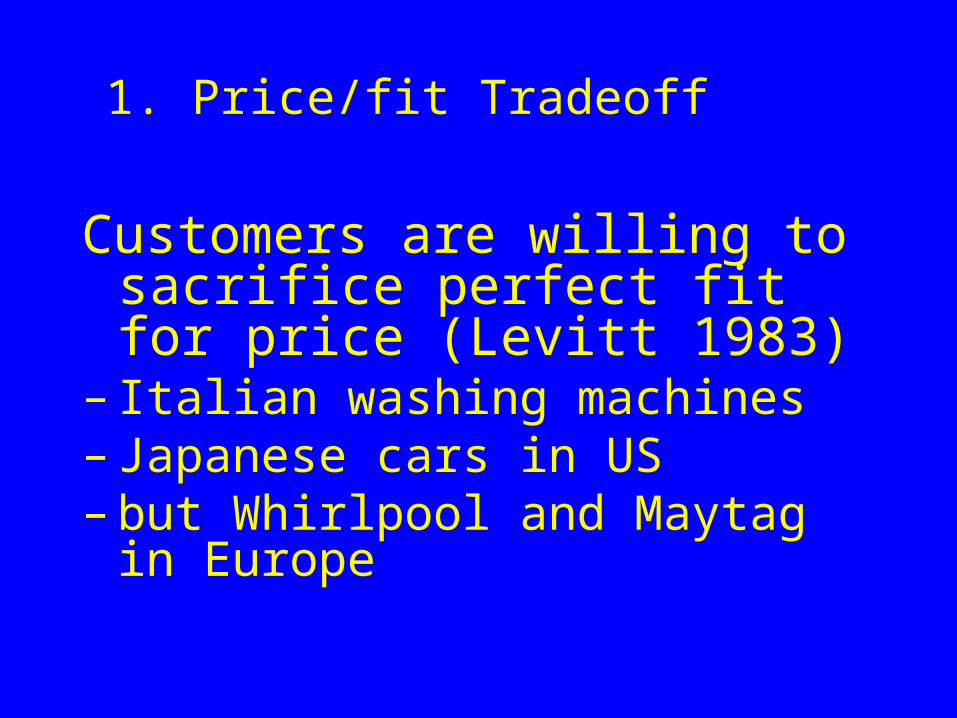
Price/fit Tradeoff
• Customers are willing to sacrifice perfect fit for price (Levitt 1983)
– Italian washing machines– Japanese cars in US– but Whirlpool and Maytag in Europe

• Improved quality
• Enhanced customer preference– better service to global customers– greater recognition, authority, and credibility of
the product/brand• increasingly the case as customers travel
• Increased competitive leverage– prevents imitation– Greater bargaining power
– Global customers and suppliers

Benefits of standardization are reduced by…
• Transportation costs
• Government barriers
• Currency risk
• Management costs
• Intercountry taste differences

Benefits of standardization are reduced by government barriers
• Tax discrimination
• Foreign exchange risk
• Trade barriers• Standards and regulations

Benefits of standardization are reduced by management costs
• Increased coordination costs
• Information loss
• Loss of local motivation

Benefits of standardization are reduced by differences in consumer
tastes
Consumer taste homogeneity– Uniformity (same consumption patterns
across countries)
– Vs. Interpenetration (more common segments across countries)
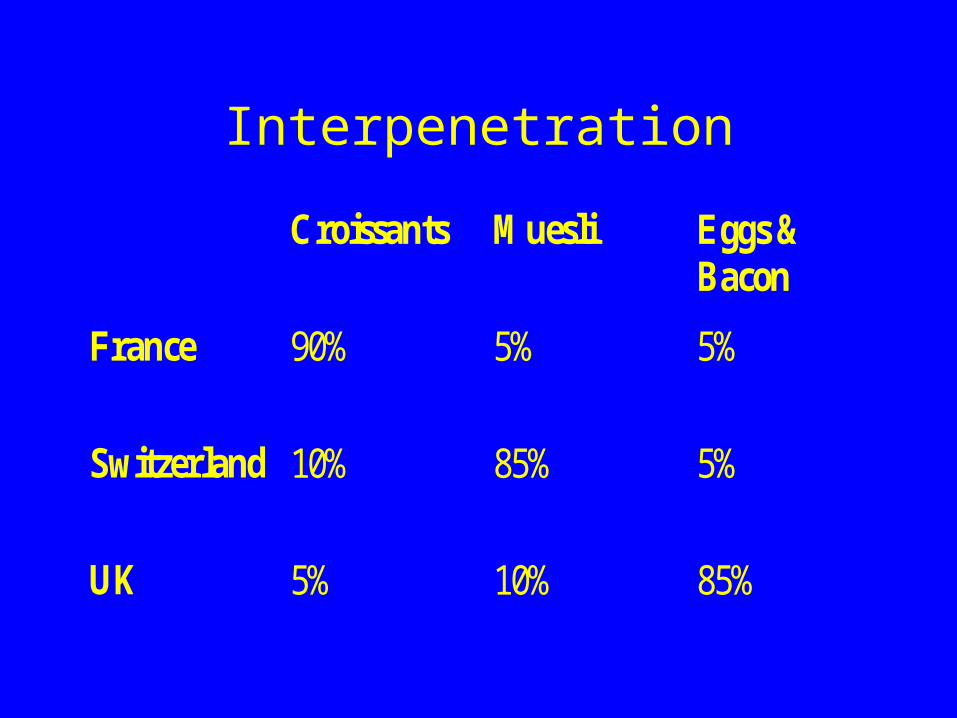
Interpenetration
Croissants Muesli Eggs & Bacon
France 90% 5% 5%
Switzerland 10% 85% 5%
UK 5% 10% 85%

Uniformity?
• Emergence of global products
• But still major differences across Europe for some products
– cigarettes
– Alcohol

Annual per-capita cigarette consumption 2004 (000)
0,866
0,905
1,23
1,373
1,446
2,058
2,068
2,209
2,274
2,354
2,693
3,131
0 1 2 3 4
U.K.
France
U.S.
Germany
China
Russia
Czech Republic
South Korea
Spain
Japan
Bulgaria
Greece

Adult alcohol intake per year(litres of pure alcohol)
4.74.84.8
6.48.4
9.49.4
10.411.411.511.711.811.811.912.1
13.614.1
9.8
0 2 4 6 8 10 12 14 16
United StatesNorwayIceland
SwedenFinland
ItalyBritain
NetherlandsGreece
SpainIreland
BelgiumGermany
SwitzerlandAustria
DenmarkPortugal
France
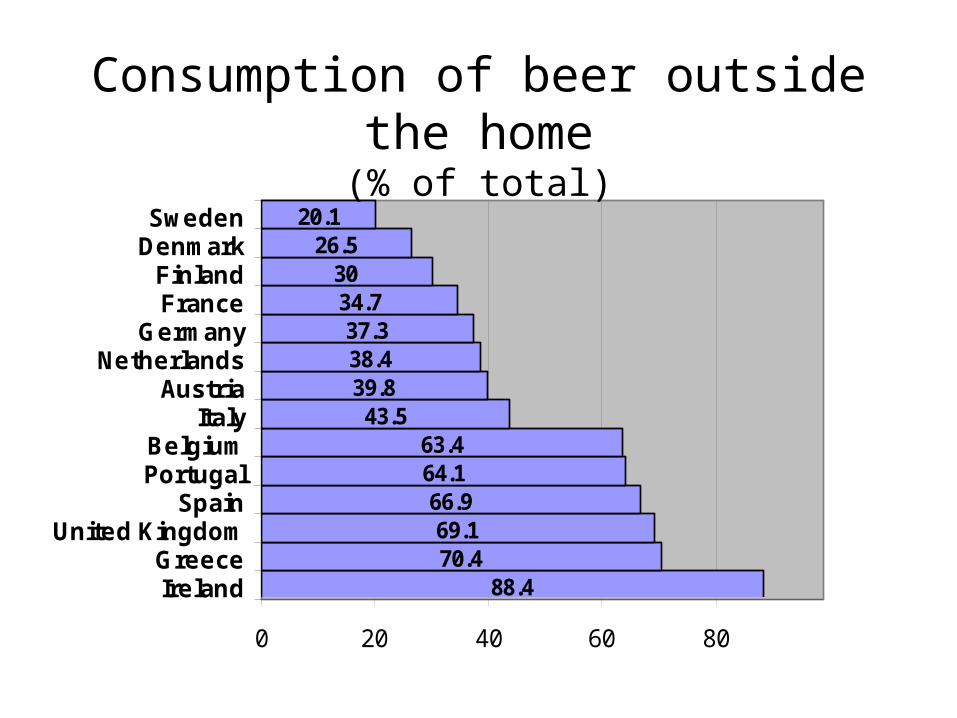
88.470.469.1
66.964.163.4
43.539.838.437.3
34.730
26.520.1
0 20 40 60 80
IrelandGreece
United KingdomSpain
PortugalBelgium
ItalyAustria
NetherlandsGermany
FranceFinland
DenmarkSweden
Consumption of beer outside the home(% of total)

Drinking occasions for beer
0
10
20
30
40
50
60
70
80
90
Netherlands Greece Ireland
Lunch
Afternoon
Dinner
Evening

Convergence?
• Yes for some products, no for others

Annual per-capita cigarette consumption
-40
-42
-34
-17
4
75
9
3
13
-12
14
15%Greece 2,719 3,131
Bulgaria 2,371 2,693
Japan 2,668 2,354
Spain 2,019 2,274
South Korea 2,150 2,209
Czech Republic 1,890 2,068
Russia 1,177 2,058
China 1,397 1,446
Germany 1,646 1,373
U.S. 1,858 1,230
France 1,556 905
U.K. 1,448 866
Country 1994 2004 Percentage Change
Note: Consumption defined by duty-paid sales; actual consumption can be higher.
Source: ERC Group

0 4 8 12 16 20
Netherlands
France
Denmark
Germany
Spain
Belgium
Luxembourg
Greece
Portugal
United Kingdom
Italy
Ireland1987
1994
Evolution of Yogurt Consumption(Kg per capita)

• Less adaptation needed for producer than for consumer goods, yet still differences
(earth moving equipment)
• In general, any product/service transferred to a foreign country will be “reconstructed” locally
“wine and cheese parties”
melons in Japan

Whyat needs to be adapted? Marketing Adaptation Checklist
1. product/service
2. price
3. promotion
4. distribution

1. Why Product/Service adaptation?
• Conditions of use (size, features)– population density, weather
• Preferences (taste, smell)
• Habits and values– social class, religion

Why product/service adaptation? (2)
• Economic conditions– stage of development– degree of competition
• Standards and regulations– admissible ingredients and techniques

2. Price Adaptations
• product positioning (elasticity of demand)
• competition
• government regulation

Automobile Price Differences in the EU
Small Segment Medium Segment Large Segment
Opel Corsa 24.0% VW Golf 43.5% BMW 318I 12.0%
Ford Fiesta 44.7% Opel Astra 26.0% Audi A4 13.0%
Renault Clio 33.8% Ford Escort/ Orion 33.8% Ford Mondeo 58.5%
Peugeot 106 21.1% Renault Mégane 27.9% Opel Vectra 18.2%
VW Polo 36.7% Peugeot 306 46.2% VW Passat 36.4%
Source: European Commission

3. Promotion adaptations
• Brand
• Advertising

Global or Local Brand?
• Cost of creating and maintaining global brand?
• Scale economies in global brand?
• Value association with global vs. local brand?
• Cultural and legal hindrances with global brand?

Some Brands do not Transfer
• Pschitt• Sissy• Toyota MR2• Chevrolet Nova• American Motors Matador• Mitsubishi Pajero• Air• Mymorning Water• Creap• Clairol Mist Stick

Brands of 6 MNCs in 67 countries
Brands found in 50% or more countries
Brands marketed in only one country
Company Total no. of brands
Number % of total Number % of total
Colgate 163 6 4 59 36 Kraft GF 238 6 3 104 44 Nestlé 560 19 4 250 45 P & G 217 18 8 80 37 Quaker 143 2 1 55 38 Unilever 471 17 4 236 50 Total 1792 68 4 784 44

"Our company's product/service brand(s) are more local than pan-European"
0
1
2
3
4
5
6
7
NowIn 5-10 yearsEuropean-based
firmsSubsidiaries of
U.S.-based firmsAll firms
European Firms Are Integrating Across the Continent
Key: 7…Agree strongly
…
…
…
…
…
1…Disagree strongly
3.52.8 2.6
1.9
3.42.6

Country of Origin Effects
Apparent country of origin affects reputation
Germany = Robust
France = Luxury
Italy = Design
Finland = Pure

Advertising
• Response to advertising• Response to message• Media availability• Advertising restrictions

Response to Message
• Silent language– color– numbers– symbols
• Spoken language– perceptual gaps– encoding/decoding gaps

EncoderSender
Culture Choice of words
Choice of symbols
Meaning
Seller’s field of experience
Seller in country A
Decoder Receiver
CultureChoice of wordsChoice of symbols Understanding
Buyer in country B
Message
Medium


Share of advertising revenue by support, 2003
0% 10% 20% 30% 40% 50%
Others
Magazines
Radio
Television
Newspapers
China
United States
0 20 40 60 80 100 120
Tota
lre
venu
es
(b$)

Distribution
• Channels– availability
– cost
– regulations

Store Density per 1000 inhabitants
2,21
5,30 5,61
6,49
8,94
11,1111,48
Russia UK France Brazil US India China

Top 5 Chains Share in Supermarkets – 2004
2%
2%
9%
41,40%
45%
62%
74,30%
88%
India
China
Russia
Brazil
US
France
UK
Canada

Vending machines
Japan: 1 for every 25 persons
US: 1 for every 40 persons
China: 1 for every 26,000 people

Three points to keep in mind
• Price-Fit tradeoff• Core vs. peripheral
standardization• Selective standardization
1. Price/fit Tradeoff
Customers are willing to sacrifice perfect fit for price (Levitt 1983)
– Italian washing machines– Japanese cars in US – but Whirlpool and Maytag in Europe

2. Product/service Core and Peripheral Elements
McDonald’s– core: clean, family, fast
– non-core: menus

McDonald’s Menu Adaptation • Norway: McLaks, grilled salmon sandwich with dill sauce on a
whole-grain bun• Canada: Cheese vegetable, pepperoni and deluxe pizza• France: Wine• Uruguay: McHuevo, a hamburger with a poached egg on top,
and McQueso, a toasted cheese sandwich• Netherlands: Groenteburger, vegetable burger• Germany: Frankfurters, tortellini and a cold four-course meal• Greece and Italy: Salad bar• Thailand: Samurai Pork Burger, marinated with teriyaki sauce,
and palm-fruit sundae• Singapore: Vanilla ice cream swirled with chocolate and
strawberry and spiced for Singaporean tastes• Philipines: McSpaghetti, a sweet tomato and meat sauce with
frankfurter bits• Japan: Chicken Tatsuta sandwich, fried chicken spiced with
soy sauce and ginger served with cabbage and mustard mayonaise

3. Optimal standardization almost never full standardization and
varies...
• across products
• across elements of the marketing mix
• across areas
• across time
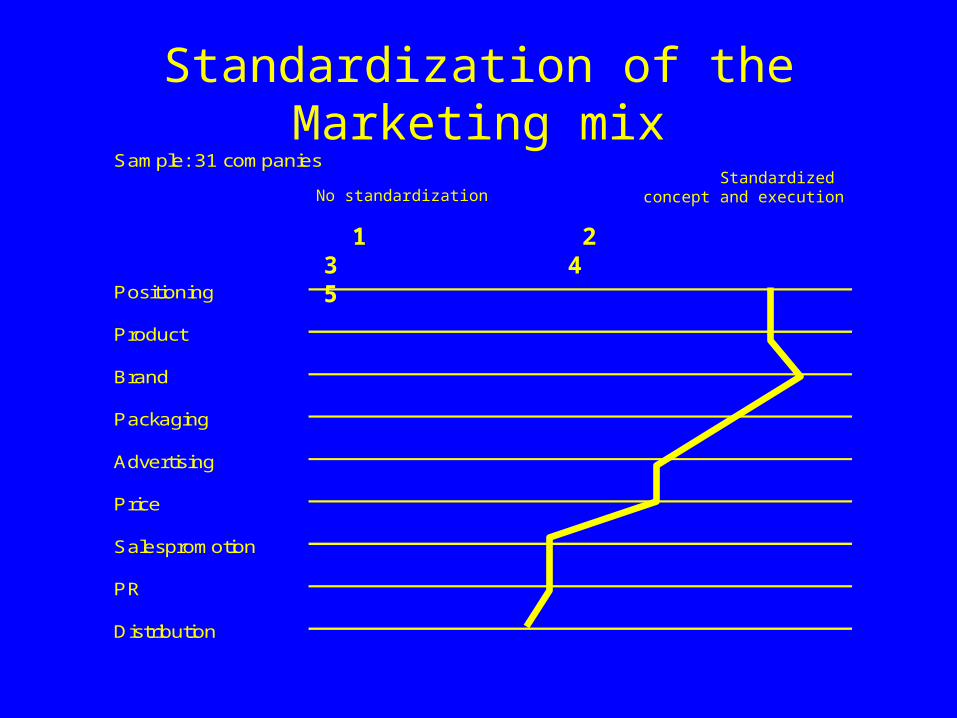
Standardization of the Marketing mix Sample: 31 companies
Positioning
Product
Brand
Packaging
Advertising
Price
Salespromotion
PR
Distribution
1 2 3 4 5
No standardizationStandardized
concept and execution

Core Standardization
Y = Standardized element Bacardi
Gervais Danone
American Express
Henkel Pritt
Levi 501s
Samsonite Johnie Walker
Benetton Swatch
Product
- Positioning Y Y Y Y Y Y Y
- Brand name Y Y Y Y Y Y Y Y Y
- Core product Y Y Y Y Y Y Y Y Y
- Ingredients Y Y Y Y Y
Advertising
TV spots
- Concept Y Y Y Y Y Y
- Execution Y Y Y Y Y Y
- Concept Y Y Y Y Y
- Execution Y Y
Packaging
- Design Y Y Y
- Size Y
Price Y Y
Salespromotion
PR
Salesconcept (distribution)
Y

Conclusion
• One must search for the proper balance between full adaptation and full standardization
• Decision must be on a case-by-case basis
• Implementation difficulties should be taken into account
Top Related