


Languages
Pages
Legal


University of Nebraska at OmahaDigitalCommons@UNO
Student Work
7-1994
Procedural Justice and Voice: Do IndividualDifferences Moderate the Voice Effect?Mark N. Van OsdelUniversity of Nebraska at Omaha
Follow this and additional works at: https://digitalcommons.unomaha.edu/studentwork
Part of the Psychology Commons
This Thesis is brought to you for free and open access byDigitalCommons@UNO. It has been accepted for inclusion in StudentWork by an authorized administrator of DigitalCommons@UNO. Formore information, please contact [email protected].
Recommended CitationVan Osdel, Mark N., "Procedural Justice and Voice: Do Individual Differences Moderate the Voice Effect?" (1994). Student Work. 221.https://digitalcommons.unomaha.edu/studentwork/221

Procedural Justice and Voice: Do Individual
Differences Moderate the Voice Effect?
A Thesis
Presented to the
Department of Psychology
and the
Faculty of the Graduate College
University of Nebraska
In Partial Fulfillment
of the Requirements for the Degree
Master of Arts
University of Nebraska at Omaha
By
Mark N. Van Osdel
July 1994

UMI Number: EP72851
All rights reserved
INFORMATION TO ALL USERS The quality of this reproduction is dependent upon the quality of the copy submitted.
In the unlikely event that the author did not send a complete manuscript and there are missing pages, these will be noted. Also, if material had to be removed,
a note will indicate the deletion.
Dissertation Publishing
UMI EP72851
Published by ProQuest LLC (2015). Copyright in the Dissertation held by the Author.
Microform Edition © ProQuest LLC.All rights reserved. This work is protected against
unauthorized copying under Title 17, United States Code
ProQuest LLC.789 East Eisenhower Parkway
P.O. Box 1346 Ann Arbor, Ml 48106- 1346

Procedural Justice and Voice: Do Individual
Differences Moderate the Voice Effect?
Acceptance for the faculty of the Graduate College, University of Nebraska, in partial fulfillment of the requirements for the degree Master of Arts, University of Nebraska at Omaha.
Committee
Name Department
Chairmarv J \ j
7 / z . G JDate' '

ACKNOWLEDGEMENTS
I would like to express my gratitude to the members of my committee: Dr.
Raymond Millimet, Dr. Lisa Scherer, and Dr. Lynn Harland who aided the
development of my thesis. I would also like to extend thanks to Dr. Wayne
Harrison; his critique greatly improved the quality of this thesis.
I would also like to express appreciation to my parents and siblings for
their continuous guidance. My accomplishments are a result of their endless
support. Lastly, I would like to thank all those who aided in the development of
my values, ethics, and knowledge.

TABLE OF CONTENTS
List of T a b le s ......................................................................................................... iii
List of Figures .............................................. iv
Abstract .................................................................................................................v
Chapter
I. Introduction ..............................................................................................1
Justice ................................................................................................2
Voice ..................................................................................................5
Instrumental V o ic e .............................................................................7
Symbolic Voice ................................................................................. 8
Applicable R e su lts ...........................................................................11
Proposal . . ................................................................................. 16
Locus of Control ............................................................................. 18
Need for A ffilia tion .......................................................................... 20
Least Preferred Coworker.............................................................. 22
Hypotheses...................................................................................... 23
II. Method ................................... 26
Subjects ...........................................................................................26
Measures .........................................................................................26
P rocedures...................................................................................... 29

Chapter
III. Results ...................................................................................................33
Study V ariab les............................................................................... 33
Manipulation Checks ......................................................................39
Group Value Desirability . ...............................................................39
Process C ontro l............................................................................... 41
Decision Control .............................................................................42
Procedural Fairness........................................................................ 42
Moderator Analysis ........................................................................ 43
Distributive Fairness........................................................................ 46
Exploratory Moderator Analysis..................................................... 46
IV. Discussion ........................................................................................... 51
References ..........................................................................................................62
Appendix
A - Procedural and Distributive Fairness I te m s .................................. 67
B - Locus of Control Scale ........................................................................ 68
C - Need for Affiliation S c a le ......................................................................72
D - Least Preferred Coworker S ca le ..........................................................74
E - Manipulation Check Q uestions............................................................ 77
F - Course Schedule Construction T a s k ...................................................79
G - Experimental S c r ip t............................................................................... 83
ii

LIST OF TABLES
Tables
1 - Reliability Estimates of Study V a riab les .................................................32
2 - Correlations Between Study V ariab les ...................................................33
3 - Condition Means of Study Variables ..................................................... 38
4 - Regression Analysis for Procedural F a irn ess .......................................42
5 - Regression Analysis for Distributive Fa irness....................................... 46
iii

LIST OF FIGURES
Figures
1 - Subject Scores on the Locus of Control Scale ..................................... 34
2 - Subject Scores on the Need for Affiliation S ca le ...................................35
3 - Subject Scores on the Least Preferred Coworker Scale ......................36
4 - Subject Scores on Distributive Fairness as a Function of
Experimental Condition and Need for Affiliation Scores ....................48
iv
Abstract
Previous researchers (see Lind & Tyler, 1988) have reported that
persons allowed an opportunity to express their opinions (voice) typically report
a heightened level of perceived fairness-labeled as the voice effect.
Instrumental and group-value theories have been proposed as explanations for
this effect. The present study examined the voice effect in the context of
personality theory to explore individual differences in relation to instrumental
and group value theories of voice. This study was designed to test the effect of
two individual difference components, Locus of Control and Need for Affiliation,
across three conditions of voice (predecision, postdecision, and no-voice).
Predecision voice represents the instrumental aspect of influencing the third
party’s allocation decision; postdecision voice represents the noninstrumental
group value aspect of symbolic voice. It was predicted that individuals who
score in the internal Locus of Control direction focus mainly on instrumental
aspects of voice, whereas individuals who score in the Need for Affiliation
direction focus mainly on group-related issues of voice. One hundred twenty-
eight undergraduate students were administered personality inventories and
experienced one of three voice conditions. Subjects performed a course
construction task during the experimental procedure. The results of this study
did not support the predicted hypotheses. Three possible explanations for the
observed results are presented along with implications for future research.
v
1
Chapter I
Introduction
In the broadest sense, justice relates to a group’s right for equality of
outcome and treatment. The African American civil rights movement
demonstrated that a large group can unite to pursue fair and equal treatment.
As the focus is narrowed, justice can relate to smaller groups such as
employees in a particular industry. The use of collective bargaining allowed
laborers to unite and demand reasonable working conditions. Narrowed further,
justice relates to the individual, such as a worker’s desire for a fair and
unbiased performance appraisal. Researchers have reported that justice
relates to a wide array of employee attitudes and behaviors (see Sheppard,
Lewicki, & Minton, 1993). Employees may focus on instrumental aspects of
justice, such as receiving a merit raise for exceptional performance, or they
may focus on group-related issues of justice, such as being respected by
supervisors. The purpose of this research is to determine if perceptions of
justice are influenced by an individual’s desire to maximize personal outcomes,
to be treated as a respected group member, or both.
The expression of one’s opinion to a decision-maker is referred to as
voice in justice literature (Folger, 1977). Procedural justice, the subjective
reaction to the process of resource distribution, is influenced by the degree of
voice allowed. Several authors have found that procedural justice ratings are

2
enhanced when people are allowed voice (e.g., Bies, 1987; Bies & Shapiro,
1988; Folger, 1977; Lind, Earley, & Kanfer, 1990; Tyler, Rasinski, & Spodick,
1985), labeled the voice effect by Folger (1977). Two explanations have been
cited as reasons for this effect. One explanation asserts that people prefer an
opportunity to voice their opinion because they believe it will lead to more
favorable outcomes (Thibaut & Walker, 1975). The other explanation contends
that people prefer voice because the opportunity to express their opinion affirms
both group membership status and interactional fairness (Lind and Tyler, 1988;
Tyler, 1990). For example, noninstrumental voice may be viewed as fair since
being allowed an opportunity to voice even if it will not influence the outcome
portrays respect, status, and interactional fairness to the individual voicing his
or her opinion. To differentiate between the two explanations of voice, the
present study examines the voice effect in relation to individual differences.
Specifically, perceptions of procedural justice and fairness are investigated by
the study of individual difference characteristics in relation to voice. In the
following section, the progression of research from distributive to procedural
justice will be described.
Justice
Distributive justice, developed by Homans (1961), is the allocation of
resources and the subjective reaction of participants to the equity of the
outcome. Adam’s (1965) equity theory was a major contributor to distributive

3
justice literature. Equity theory contributed to the notion that distributive justice
is a prominent factor in social behavior (for a review, see Greenberg, 1982; and
Lind & Tyler, 1988). According to the distributive justice theory, outcomes
engender feelings of satisfaction and fairness. Positive outcomes produce
heightened levels of perceived fairness, whereas negative outcomes do not
(Thibaut & Walker, 1975). Thus, an individual’s reaction regarding fairness and
satisfaction is influenced by the perceived distribution of resources or outcomes.
According to distributive justice, people are driven by the ends of a social
relationship rather than the means (Folger, 1986).
Procedural justice concerns the process by which limited resources are
allocated, and the subjective reaction to the process (for a review, see Lind &
Tyler, 1988). In one of the earliest studies conducted on procedural justice,
Thibaut and Walker (1975) studied subjective and objective consequences
towards differing legal procedures in which the type of third-party intervention
was manipulated. The authors reported that procedures, mandated by a third-
party, influence reactions towards the decision. These reactions are
independent of decision desirability or the degree to which the decision is
pleasing to the individual. For example, the researchers studied arbitration
methods of a third-party regarding a disagreement between plaintiffs. Results
indicated that, regardless of the outcome, the third-party arbitration method
influenced the plaintiffs’ perception of justice.

4
Specifically, Thibaut and Walker (1975) manipulated decision control
which is the amount of control an individual possesses over the outcomes
allocated by a third-party. For example, in a courtroom setting, high decision
control allowed disputants to control the outcome of the third-party decision.
When individuals are allowed high decision control, they typically report high
fairness ratings because decision control is perceived as a way to increase
desired outcomes (Thibaut and Walker, 1975). However, these authors report
that individuals with high decision control will perceive a situation as fair even
when they receive undesirable outcomes. Thus, focusing solely on distributive
outcomes is too simplistic to fully explain these results.
Process control is defined as the amount of control that an individual
possesses over an allocation procedure. For example, in a courtroom setting,
high process control allowed disputants to control the amount and type of
information presented. Thibaut and Walker’s research focused on assessing
the perceived fairness of a procedure with varying levels of personal control in
the decision-making process. They found that when individuals were allowed to
express their views (high process control), procedural justice ratings were
enhanced. This finding was designated the process control effect by Thibaut
and Walker (1978) and is one of the most reliable and consistent findings in
justice literature (Lind & Tyler, 1988).

5
A related issue is whether the process control effect occurs regardless of
outcome desirability. Although there are discrepancies in the literature (for a
review, see Greenberg, 1987), it appears that outcomes of medium to high
desirability are perceived as unbiased regardless of the procedure used.
Further, outcomes of low desirability are perceived as unbiased only during fair
procedures (Greenberg, 1987). it is possible that negative outcomes serve to
increase the procedural salience and motivate evaluative reactions.
Voice
During procedural justice experiments, subjects are commonly asked to
evaluate procedural fairness after receiving positive or negative outcomes.
Leventhal (1980) proposed six rules or criteria people may use when evaluating
procedures as subjectively fair or unfair. Rule one, consistency, states that
decision making procedures should be consistent across persons and time.
Rule two, bias-suppression, focuses on two types of biases - "unrestrained self
interest" and "devotion to doctrine". This rule asserts that these two biases
must be suppressed for a procedure to be perceived as fair. Rule three,
accuracy, maintains that the use of inaccurate information will cause
procedures to be viewed as unfair. Rule four, correctability, asserts that an
opportunity to change an allocative decision must exist at some point in the
process. Rule five, representativeness, articulates that the phases of an
allocation process must adhere in some degree to the concerns of the parties

6
involved. Rule six, ethicality, states that subjective reaction to a decision
process is based on the relationship between the process and the individual’s
moral and ethical values.
The representativeness rule includes process control. One form of
process control is voice, and it has been regarded as such in many studies
(see Lind & Tyler, 1988). Voice procedures are typically those in which people
are given the opportunity to present their opinions, feelings, or beliefs to
another who is responsible for making a decision (Bies, 1987). In contrast, no
voice procedures are those in which people are not allowed the opportunity to
present their views to the decision maker.
Procedural justice ratings are enhanced when individuals, affected by
the decision being made, are allowed an opportunity to express their views.
The voice effect directly relates to the fair process effect. When voice is
allowed, people report heightened perceptions of procedural fairness regardless
of outcome. A number of authors have replicated the voice effect with both
positive and neutral outcomes (e.g., Bies, 1987; Folger, 1977; Greenberg &
Folger, 1983; Lind et al., 1990; Tyler et al., 1985). Others have reported the
voice effect only with negative outcomes (Bies & Shapiro, 1988; Greenberg,
1987; La Tour, 1978). These studies have been conducted in experimental and
field settings.

7
Instrumental Voice
Early explanations of the voice effect concentrated on instrumental
reasons (i.e., the attempt to improve outcomes by influencing the decision
maker). Instrumental explanations focus on increasing equitable outcomes
(Thibaut & Walker, 1975), increasing favorable outcomes (Leventhal, 1980), or
providing control over outcomes (Brett, 1985). As previously stated, voice
opportunities increase fairness ratings; this may result because voice is seen as
a means of obtaining favorable outcomes. According to the instrumental
perspective, persons value voice only to the extent that it will increase desired
outcomes, because voice is perceived as a means of increasing the probability
of attaining favorable outcomes. Thus, voice propels procedural justice ratings
because it promotes distributive justice (Thibaut & Walker, 1975).
Support for instrumental voice arises from research in legal settings.
Thibaut and Walker (1975) reported that people have an interest in retaining
decision control by minimizing third-party intervention and maximizing process
control. However, disputants will relinquish decision control to a third party if
doing so is viewed as the best means for fair conflict resolution. Thus, low
decision control (i.e., third party intervention) is tolerated if process control (i.e.,
voice) is granted. This situation is viewed as fair because process control or
voice is perceived to be influential in obtaining desired outcomes.

8
According to this rationale, the voice effect should disappear if
expressing one's opinion is perceived as noninstrumental. Researchers have
documented that noninstrumental voice may lead to perceptions of injustice
called the frustration effect (Folger, 1977). However, this effect is rare and
seems to occur only if the individual perceives the opportunity to voice as a
sham, such as when voice is allowed in order to beguile the individual (Lind &
Tyler, 1988). It has been established that instrumental voice produces
increased fairness rating, yet what effect does noninstrumental voice have on
ratings of fairness? In the next section, results from noninstrumental voice
studies are presented.
Symbolic Voice
Since Thibaut and Walker (1975) reported their instrumental process
control results, there has been increasing evidence that noninstrumental voice
produces similar results identified as the symbolic voice effect. According to
Lind and Tyler (1988), this effect relates to the desire to voice because of the
symbolic aspect of expressing one’s opinion to a receptive group member. An
opportunity to voice, regardless of instrumentality, increases an individual’s
feelings of group identification and membership which is thought to be a very
potent aspect of people’s lives. "Humans are by their very nature affiliative
creatures, and they devote much of their energy to understanding the
functioning of the various groups to which they belong and to participating in

9
social processes within those groups" (Lind & Tyler, 1988, p. 231). As a result,
people seek membership in many work-related and social groups.
Lind and Tyler (1988) proposed the group value model of procedural
justice to explain the symbolic voice effect. According to this model,
procedures are evaluated in terms of their relationship to group values (Tyler &
Lind, 1992). According to the group value model, procedural fairness is viewed
as a group norm, and it is desired by group members as a standard rather than
as an exception. Perceived fairness results when procedures occur within the
boundary of values held by the group and individual members (Lind & Tyler,
1988). When a procedure is viewed as an indication of a group value, such as
voice, the procedure is judged as fair. According to Tyler and Lind (1992),
people are affiliative and are attracted to the "signs and symbols" that display
information concerning group membership status (p. 140).
The basic tenet of this model is that people define their self-identity by
their membership in groups, and group members often have a positive regard
for other members (Tyler & Lind, 1992). Thus, voice is viewed as fair because
it is in accord with fundamental group values, and it reinforces group
membership status. Through membership status, the resources of the group
are provided to the individual in terms of self-esteem, self identity, and self
knowledge (Tajfel & Turner, 1979; Tyler, 1990).

10
However, after receiving undesirable outcomes, members may evaluate
whether they are being exploited by the group. During these times, people
resolve negative feelings about the group by evaluating positive group assets
(Tyler, 1990), such as the long term advantages of group membership. If these
privileges (e.g., status) are affirmed by fair procedural treatment, such as voice,
then self-affirmation is augmented and group membership desirability stabilizes
(Tyler, 1989).
Furthermore, values are thought to be socialized from an early age;
young members learn from the more experienced (Tajfel & Turner, 1979). Yet,
the socialization of group values may not be universal, resulting in procedural
values that vary between groups. Differential socialization of values may
explain reported cross-cultural differences in procedural justice (for a review,
see Lind & Tyler, 1988). However, Lind and Tyler (1988) state that there are
fundamental group values that are common to all persons. These fundamental
values may represent procedural propensities initially learned at an early age
and are subsequently more resistant to change.
The following predictions, according to the group value model, are
theorized by Lind and Tyler (1988). First, the fundamental aspect of the model
deals with the recognition of one’s status as a group member. Allowing
individuals the opportunity to express their opinions conveys respect and status
because in doing so, they are treated as full-fledged group members. Second,

11
procedural factors are predicted to have a greater impact when associated with
fundamental values. For example, the opportunity to express one’s opinions
may have an additive impact because it is related to the fundamental value of
group membership status. Third, as a result of the importance of group
procedures, procedural justice issues will be regarded more importantly than
other models would predict. Fourth, procedural justice will have a profound
impact on new group members who are unsure of their group status. Lastly,
procedural fairness judgments will have a large influence on people’s attitudes
toward the group and its authorities. Group loyalty and commitment will also be
seriously affected by procedures.
Applicable Results
Researchers have reported that fairness ratings for symbolic voice are
intermediate to fairness ratings for instrumental voice and no-voice conditions
(Lind et al., 1990; Tyler et al., 1985). These researchers address the
underlying reason for the voice effect (i.e., instrumental and symbolic
explanations). First, Tyler et al. (1985) assessed procedural justice with varying
levels of both decision and process control. Second, Lind et al. (1990)
temporally manipulated the opportunity to voice in relation to an outcome
decision.
Tyler et al. (1985) conducted two correlational studies and one scenario
study. In the first correlational study, participants were defendants who

12
appeared in traffic and misdemeanor court, and were interviewed by phone
after their courtroom appearance. Process control was assessed by asking
subjects how much opportunity they had in presenting evidence, and how much
control they had in the way evidence was presented. Decision control was
assessed by asking subjects how much control they had over the decision that
was made regarding their case. In general, subjects felt they had high process
control and low decision control.
In the second study, participants were students who completed a
questionnaire assessing decision control, process control, and procedural
justice in relation to a college course they had completed. Half of the subjects
rated a course they liked most, and the other half rated a course they liked
least. Process control was assessed by asking subjects how much opportunity
they were given to "demonstrate their knowledge concerning material that was
graded." Decision control was measured by asking the subjects to approximate
the extent to which they could "influence the grade they received." Generally,
the subjects expressed a perception of low process control and high decision
control.
In both studies, subjects were placed in one of four groups based on a
median split of ratings for the questions on decision and process control. The
results of the regression analyses for both studies indicated that heightened
levels of process control under conditions of high or low decision control

13
produced augmented procedural justice ratings (Tyler et al., 1985).
Study three, a scenario study, involved a budget allocation of a
leadership counsel. In the experimental scenario, subjects were members of
the general public who were asked to rate the level of fairness of the allocation
procedure. The independent variables were process control (high/low) and
decision control (high/low). In the low decision control situation, the counsel
had sole responsibility for the decision, and in the high decision control
situation, the counsel recommended a budget for public approval. In the low
process control situation, the public was allowed to listen to the debate but not
participate, and in the high process control situation, the public could speak to
the counsel. The analysis revealed that high process control and high decision
control produce heightened procedural justice ratings. Furthermore, in either
high or low decision control situations, increasing the amount of process control
produced a significant increase in ratings of procedural justice (Tyler et al.,
1985).
Tyler et al. (1985) used the results of the three studies to test the
instrumental and group value models of procedural justice. According to the
instrumental perspective, heightened procedural justice ratings should not occur
when subjects experience high process control and low decision control. Yet,
according to the results, an increase in process control was responsible for
heightened levels of procedural justice and leadership endorsement during both

14
high and low levels of decision control. Thus, the results support the group
value aspect of voice because noninstrumental process control was viewed as
procedurally fair. However, as noted by Lind et al. (1990) problems with the
interpretation of these results occur due to the correlational nature of studies
one and two and the subjectively believed instrumentality of voice in study
three. To eliminate these concerns, Lind et al. (1990) designed a true
experiment for the test of instrumental and group value theories of voice.
The experimental procedure utilized by Lind et al. (1990) was a goal-
setting allocation in which voice was allowed at different times in relation to the
goal-setting decision (before, after, or not at all). This study also manipulated
task strategy information provided to the subjects. Some subjects received
relevant strategy information for goal attainment, while some received irrelevant
information, and others did not receive any strategy information. The
experimental task for the subjects was the construction of course schedules.
The researchers used a 3 (Voice Procedure) X 3 (Strategy Information) design.
Lind et al. (1990) used the three voice conditions to investigate the
instrumental and group value explanations of voice. In this study, subjects were
allowed to voice prior to a decision (predecision), after the decision
(postdecision) or not at all (no-voice). Predecision voice represents the
instrumental aspect of influencing the third party’s allocation decision.
Postdecision voice represents the noninstrumental group value aspect of

15
symbolic voice. The authors compared the two voice conditions with the no
voice condition to explore the strength of the symbolic aspects of voice. They
also compared the predecision voice condition with the postdecision voice
condition to investigate the instrumental aspects of voice.
The study analyses revealed that both voice conditions produced higher
procedural and distributive fairness ratings than the no-voice condition. Also,
the predecision voice condition produced greater procedural and outcome
fairness ratings than the postdecision voice condition. These results support
both instrumental and group value explanations of voice. Furthermore, all three
conditions were significantly different. Ratings of procedural fairness were
greatest in the predecision voice condition, intermediate in the postdecision
voice condition, and lowest in the no-voice condition. In terms of cell means for
the three levels of voice, the authors found slightly larger mean differences
between predecision and postdecision voice conditions than between
postdecision and no-voice conditions. The authors concluded, "The mean
values we observed suggest that the symbolic voice effect is at least as strong
as the instrumental voice effect..." (Lind et al., 1990 p. 957).
Lind et al. (1990) also considered the subjects’ perceived control over
outcomes. They found that subjects in the postdecision voice condition
reported feeling greater control over outcomes than subjects in the no-voice
condition. The authors conducted a mediational analysis to determine if the

16
voice effect could be attributed entirely to a perception of control. The results
suggest that the ratings of perceived control do not entirely account for the
voice effect. The authors used the results of the mediational analysis to
discredit the possibility that an "illusion" of control, experienced by the subjects
in the postdecision condition, was responsible for the heightened fairness
ratings in that condition. However, the subjects in this condition indicated that
they perceived control over the allocation decision. As a result, the
postdecision voice condition may have been confounded. In other words,
subjects in the postdecision voice condition may have responded with inflated
procedural ratings due to the perceived instrumentality of voice.
Bies (1987) has stated there is growing evidence that factors beyond
voice are influential in ratings of procedural justice. Thus, the presence of
moderating variables may influence procedural justice ratings. The investigation
of the role moderator variables play during a voicing experience will help to
further differentiate the two theories of voice.
Proposal
Researchers have declared that both instrumental and group value
considerations are evaluated when people rate procedural fairness (Lind et al.,
1990; Tyler et al., 1985). In effect, these researchers have stated that people
desire instrumental voice because they hope to maximize outcomes by
expressing their opinions. Additionally, symbolic voice is valued because an

17
opportunity to express opinions augments the individual’s group status.
Therefore, a voice condition produces greater procedural satisfaction than a
condition in which instrumentality and personal respect are absent. However,
this explanation is too simplistic to adequately differentiate between instrumental
and symbolic voice.
The present proposal incorporates personality theory in order to further
differentiate the instrumental and group value theories of voice. It is proposed
that an interaction between an individual’s personality and the voice situation
result in differential evaluations of procedural fairness. It is submitted that
individuals vary in terms of their focus on instrumental and group value
considerations. Some individuals are oriented towards controlling outcomes
while others focus on social affiliation. An individual’s orientation is dependent
on his or her dominant personality characteristic. Therefore, knowing this
personality orientation will facilitate the prediction of the individual’s procedural
justice reaction.
Presently, two individual difference variables are hypothesized as
moderators of the voice effect. First, people differ in respect to the attention
they place on control issues related to voice. To differentiate people on the
basis of perceived control, Rotter’s (1966) Locus of Control Theory will be
utilized. Secondly, people differ in respect to their desire for group membership
and related aspects such as respect and status. To differentiate people on the

18
basis of their desire for group membership, Need for Affiliation theory (Murray,
1938) will be used. Additionally, Fiedler’s (1967) Least Preferred Coworker
scale was administered for exploratory purposes.
Locus of Control
Rotter (1966) developed the concept of Locus of Control along the lines
of social learning theory, which states that reinforcement strengthens the
expectancy that a particular behavior will produce the same consequence in the
future. However, behaviors and expectancies will vary in magnitude, depending
on the perceived strength of the performance to reinforcement contingency.
Rotter (1966) contends that expectancies generalize from specific to similar
conditions.
Rotter’s (1966) l-E scale was developed in order to differentiate between
people on the basis of their belief in internal versus external contingencies of
reinforcement. Reinforcement and social learning theories address the crucial
role of behavioral consequences in the acquisition of behaviors. However,
Rotter (1966) contends that an individual difference component is responsible
for reinforcement being differentially perceived. People vary in the degree to
which they believe that a consequence is contingent on their own behavior
versus the degree to which they believe a consequence is controlled by outside
forces. The varying levels of belief about behavioral consequences fall on a
bipolar continuum. This is consistent with Rotter’s statement that "a perception

19
of causal relationship need not be all or none but can vary in degree" (Rotter,
1966, p. 1). One polar side of the continuum is conceptualized as the belief
that consequences are contingent on one’s actions. The opposite side of the
continuum is characterized by the belief that consequences result from powers
outside the individual.
Rotter (1966) labels this continuum as Locus of Control and the polar
sides as external control and internal control. Individuals who are oriented to an
external control position (externals) do not perceive reinforcement following their
behavior as dependent on their actions. Instead, externals view reinforcement
as the result of chance, luck, or under the control of powerful others. Internal
control oriented individuals (internals) perceive reinforcement following an action
as contingent on their own behavior or enduring characteristics. "In general,
internals tend to believe that they have personal control over rewards and
events" (Spector, 1982 p. 493). The critical difference between internals and
externals is one of causality - whether or not the person believes a causal path
exists between their actions and the following consequences.
A complete review of Rotter’s (1966) l-E scale is beyond the scope of
this paper. For a thorough review see Spector (1982) and Joe (1971). Rotter’s
l-E scale has traditionally been the most popular scale to measure Locus of
Control. However, the l-E scale has been criticized for a number of reasons,
the most serious of which is a strong relationship between the scale and

20
political and social desirability (Nowicki & Duke, 1973). The Nowicki-Strickland
Internal-External control scale for adults (ANS-IE) was developed in order to
minimize the shortcomings of Rotter’s l-E scale. Nowicki and Duke (1973)
provide split-half reliability assessments which range from .74 to .86 and a test-
retest reliability assessment of .83 for a six-week period. Discriminant validity is
indicated for this measure since scale scores are not related to variables such
as intelligence and social desirability. Construct validity has been supported by
significant positive correlations between the ANS-IE scale and the l-E scale.
Correlations between these scales were established in three separate studies
for gender and achievement (Duke & Nowicki, 1973). Finally, convergent
validity has been established by significant correlations between the ANS-IE
scale and the Adjective Check List scale; the correlations are in the same
direction and approximate degree as with correlations of the l-E scale (Duke &
Nowicki, 1973).
Need for Affiliation
Jackson (1989) developed most of the scales on the Personality
Research Form (PRF) from Murray’s (1938) Need Theory of Personality.
Murray’s theory has been extensively researched over the years. The following
presentation is limited in scope, focusing solely on the Need for Affiliation scale
of the Personality Research Form - version E (PRF-E). Affiliative tendencies are
regarded as a person’s stable and typical behavioral response to other people,

21
groups, or social situations (Mehrabian & Ksionzky, 1974).
Jackson’s first step in the creation of the PRF was to operationally define
each trait. The trait dimensions that were chosen for the PRF are bipolar. Half
of the scale items represent each pole. The Need for Affiliation scale measures
two sets of trait behaviors. According to the author, high scores on the
affiliation scale indicate the presence of an affiliative trait. Jackson (1989)
defines a high affiliative score as one who "Enjoys being with friends and
people in general; accepts people readily; makes efforts to win friendships and
maintain associations with people" (p. 6). Low scores indicate the presence of
a rejection trait, whereas moderate scores represent the presence of both traits
to a similar extent. The author does not define low or moderate scores, but
encourages test users to define these scoring profiles.
According to the PRF-E test manual (Jackson, 1989), reliability and
validity estimates are adequate, although the sample sizes are generally low or
not reported. The odd-even split-half reliability of the PRE-E affiliation scale
was .86 for a college population (N=84) after Spearman-Brown correction. The
reported test-retest reliability for the 40 item PRE-AA affiliation scale ranged
from .79 (N=135) to .93 (N=82). The items from this scale were used as the
item pool for the development of the PRE-E and are presented for an additional
reliability estimate.

22
The strongest evidence for scale validity is presented in terms of the
correlational indices between the PRF-E affiliative scale and CattelPs High
School Personality Questionnaire (HSPQ) (cited in Jackson, 1989). Convergent
validity is suggested by the .46 correlation between the affiliation scale on the
PRF-E and the agreeableness scale on the HSPQ. Information concerning
divergent validity was not reported.
Least Preferred Coworker
The origin of Fiedler’s (1967) Least Preferred Coworker (LPC) score
occurred during the development of a measure for therapeutic and diagnostic
competence of clinical psychologists. After focusing on leadership
effectiveness, Fiedler (1967) developed the LPC scale to differentiate between
people who are task motivated versus relationship motivated. According to
Fiedler and Garcia (1987), a task motivated individual is someone who
completely focuses on the completion of a task at the cost of interpersonal
relationships with other workers. In terms of voice, a task oriented individual
would focus solely on the instrumental aspects of voice. Additionally, a
relationship motivated individual attributes relatively good personality traits to
the least preferred coworker because the individual focuses on personal
relationships and less on task completion (Fiedler & Garcia, 1987). In terms of
voice considerations, a relationship oriented individual would care less about
the instrumentality of voice and instead focus on group-related issues. The

23
psychometric properties of the LPC scale are adequate. Split-half reliability
estimates range from .86 to .92, and the mean correlation of test-retest
reliability from 23 studies is .64 (Rice, 1978 as reported in Fiedler and Garcia,
1987).
Hypotheses
The purpose of the present proposal is to further advance the
understanding and explanation of the voice effect. Two possible explanations
for this effect (instrumental and group value theories) have each received
empirical support. Lind and Tyler (1988) reported that the two theories are not
mutually exclusive. These authors support the acceptance of both models as
reasonable explanations of the voice effect. Furthermore, Lind et al. (1990)
conclude that the psychological process regarding the voice effect is "...more
complex than is suggested by any of the current theories of procedural justice"
(p. 957). Presently, the complexity of the voice effect is addressed in terms of
personality theory. It is proposed that the voice effect is moderated by Locus of
Control and Need for Affiliation.
This proposal was designed to test the effect of two individual difference
components, Locus of Control and Need for Affiliation, across three conditions
of voice (predecision voice, postdecision voice, and no-voice). It is proposed
that individuals who score in the direction of internality focus mainly on the
instrumental aspects of voice. These individuals will respond with higher

24
procedural justice ratings only when they are allowed control in the form of
instrumental voice as in the predecision voice condition. In the postdecision
voice condition, these individuals will respond by rating procedural justice lower
because this condition is perceived as noninstrumental. Presently, Locus of
Control orientation will be utilized as a test of the instrumental explanation of
the voice effect. Specifically, internally oriented Locus of Control individuals will
focus solely on the instrumental voice, whereas, externally oriented persons will
not have this same focus. The direction of this effect is a replication of the
results of Lind et al. (1990). However, these authors did not investigate the
possibility that certain individuals focus mainly on instrumental concerns.
Additionally, it is proposed that individuals who score in the affiliative
direction focus on issues that relate to group values such as respect and status.
These individuals will respond with higher procedural justice ratings only when
they are shown respect and status as in the two voice conditions. For these
individuals, procedural justice ratings will decrease in those situations where
group value considerations are not present as in the no-voice condition.
Presently, Need for Affiliation orientation will be utilized as a test of the group
value explanation of the voice effect. Specifically, affiliative individuals will
focus solely on the symbolic voice, whereas, nonaffiliative oriented persons will
not have this same focus. The direction of this comparison is a partial
replication of the Lind et al. (1990) study. These authors, however, did not

25
investigate individual differences in relation to group value considerations.
Individuals who focus on group value affiliation will rate the voice conditions
higher and the no-voice condition lower than nonaffiliative persons.
This study proposes three hypotheses. First, after aggregating across all
subjects, perceptions of procedural and outcome fairness will range from a high
in the predecision voice condition to a low in the no-voice condition with an
intermediate postdecision voice condition (Hypothesis 1). The direction of this
hypothesized result is a replication of Lind et al. (1990). Secondly, to the extent
that subjects score in the direction of internality on the Locus of Control scale
(ANS-IE), a larger discrepancy in perceptions of procedural fairness will occur
between the predecision and postdecision voice conditions than for subjects
that score as externals (Hypothesis 2). This hypothesis will be tested by the
interaction of Locus of Control score and a contrast between the predecision
voice condition versus the postdecision plus no-voice conditions. Lastly, for
subjects that score in the affiliative direction on the Need for Affiliation scale
(PRF-E), a larger discrepancy in perceptions of procedural fairness is predicted
occur between the voice conditions (predecision and postdecision) and the no
voice condition than for individuals that score in the non-affiliative direction
(Hypothesis 3). This hypothesis will be tested by the interaction of Need for
Affiliation score and a contrast between the predecision plus postdecision voice
conditions versus the no-voice condition.

26
Chapter II
Method
Subjects
Students enrolled in an introductory psychology course at a midwestern
university participated as volunteers. A total of 138 individuals participated;
subjects received extra-credit for their participation. On arrival, each person
was randomly assigned to one of the three experimental conditions.
Design and Analysis
The one-way between-subjects experimental design had three conditions
(Procedure: predecision voice, postdecision voice, no-voice). Two personality
measures were also employed as predictors of subjects’ responses to the
experimental conditions. Multiple regression analyses were conducted to
assess the effect of voice and the interaction of personality types and voice on
perceptions of justice.
Measures
Dependent measures. Each dependent variable was measured by two
questions (see Appendix A). Responses were recorded on a 6-point Likert-
type scale with "1 = Very Low" and "6 = Very High" as endpoints. Procedural
justice was measured by asking subjects whether they felt the process used to
set the performance goal was fair. Distributive justice (satisfaction with
outcome) was measured by assessing the perceived fairness of the assigned
27
goal. The dependent variables assessed both fairness and satisfaction which is
a common practice among justice researchers. Lind & Tyler (1988) reported
that many studies have established that both question types load on one factor.
Personality measures. Locus of Control, measured by the ANS-AE
scale, consists of 40 questions asking respondents to answer how they feel
about a particular topic (see Appendix B). Each question was scored
dichotomously as either yes or no. For example, two questions from the ANS-
IE scale are: (a) Do you believe you can stop yourself from catching a cold?
and (b) Do you feel that most of the time parents listen to what their children
have to say? According to the scoring procedure, a high score reflects external
orientation. Reliability and validity scores for this scale are provided by Nowicki
and Duke (1973).
The PRF-E Need for Affiliation scale consists of 16 questions that
generally ask how respondents feel about themselves (see Appendix C). Each
question was scored dichotomously as either true or false. Two affiliative
statements from this scale are: (a) I choose hobbies that I can share with other
people and (b) I go out of my way to meet people. According to the scoring
procedure, a high score reflects affiliative orientation. Reliability and validity
scores for this subscale are provided by Jackson (1989).
Additionally, the Least Preferred Coworker scale was administered for
exploratory purposes (see Appendix D). This scale is composed of 18 items,

each consisting of two bipolar adjectives. Responses are recorded on 8-point
scales and the bipolar endpoints of favorable and unfavorable adjectives are
alternated. Respondents are asked to think of a coworker with whom they
worked the least well. This individual serves as the reference point when the
18-item adjective sets are completed. According to the scoring procedure, a
low score represents a relationship-motivated leader versus a high score that
represents a task-motivated leader. Reliability and validity scores for this
subscale are provided by Fiedler and Garcia (1987).
Manipulation check measures. Manipulation check questions assessed
subjects’ perceptions concerning their opportunity to voice, perceived level of
control, and group value desirability (see Appendix E). Responses were
recorded on a 6-point Likert-type scale with "1 = Very Low" and "6 = Very
High" as endpoints. The opportunity to voice manipulation check measured the
degree to which subjects believed they had expressed their opinion to the
experimenter. Furthermore, subjects’ perceived level of control was assessed
by questions concerning both process and decision control (see Appendix E).
The amount of process control perceived by subjects evaluated the extent to
which subjects felt they had control over the goal-setting decision. The amount
of decision control perceived by subjects assessed the degree to which subjects
felt they had control over the assigned goal. Additionally, subjects’ perceived

29
level of group value desirability was assessed by four exploratory questions
concerning the experimenter’s actions and decision-making procedure
(see Appendix E).
Procedure
The procedure enacted for this study mirrored the experimental
procedure used by Lind et al. (1990). Although a different procedure could
increase generalizability, the use of this well understood method is the practical
approach for exploring relatively unknown relationships. In the words of
Ashcraft (1989), ’’occasionally, it pays to use a thoroughly understood ’shovel’
when you’re digging for something new" (p. 357).
On arrival, subjects were informed that the purpose of the study was to
investigate the role of practice on performance. Subjects were informed that
the experiment had two parts, and they were given an overview of the
procedure (see Appendix F). Subjects were instructed that they would
complete two surveys in part one and then work on the construction of course
schedules in part two (see Appendix G). The experimental materials were
reviewed, and subjects were given an explanation of the course scheduling
task. Afterwards, subjects were seated in separate rooms and instructed to
start part one of the experiment.
In part one, subjects completed the ANS-IE scale and the PRF-E Need
for Affiliation subscale. On completion of the surveys, the subjects were

30
instructed to open the door to their room and await the arrival of the
experimenter. On average, subjects took approximately 30 minutes to complete
the questionnaires. After the personality measures were administered, the
experimenter entered the room and asked subjects if they had any questions
concerning the course scheduling task. Often times, the experimenter
answered questions or further explained the course scheduling process.
Subjects were then asked to practice the scheduling task for five minutes and
complete as many schedules as possible. The experimenter set a timer and
left the room. After the five minute practice trial, the experimenter reentered the
room, and the subjects were asked how many schedules they had completed
and if they had any questions concerning the scheduling task. In order to
"prime" subjects’ willingness to express their opinions, they were asked if they
thought the scheduling task was easy or difficult, and interesting or boring.
Following the practice trial, subjects were informed of the required
number of schedules they would be required to complete in the final stage of
the experiment. In the predecision voice condition, subjects were informed that
the experimenter was tentatively thinking of requiring them to complete 12
schedules during the 15 minute trial period (see Appendix F). The
experimenter stated that before the goal of 12 schedules was assigned he
would like to hear the subject’s opinion concerning the performance goal. If the
subjects were reluctant to express their views, the experimenter asked
31
additional probing questions and confirmed that he was interested in the
subject’s opinion. Due to the challenging nature of the goal, subjects expressed
a desire to lower the goal. After listening to the subject’s view, the
experimenter lowered the assigned goal of 10 schedules for the performance
trial.
In the postdecision voice condition, the experimenter informed the
subjects that they would be required to complete a predetermined goal of 10
schedules for the final 15 minute task period (see Appendix F).
Encouragement for the subjects to express their opinions was offered by stating
that the experimenter was interested in any views subjects had regarding the
goal even though it could not be changed. As in the predecision voice
condition, if subjects were reluctant to express their views, they were asked
probing questions regarding the assigned goal. After the subjects expressed
their views, the experimenter restated the goal of 10 schedules. Subjects in
this condition also stated that they would prefer a lower goal. According to Lind
et al. (1990), "...any perception of control in the postdecision voice condition
would run contrary to both the experimenter’s explicit denial of any influence of
the subjects’ input and his failure to change the goal" (p. 957).
In the no-voice condition, the experimenter assigned subjects a 10
schedule performance goal for the 15 minute task period (see Appendix F).
Subjects were not invited to offer their views concerning the performance goal.

32
After goal assignment, all subjects were instructed to complete the goal of 10
schedules in the allotted time. After the 15 minute interval, the experimenter
entered the room and asked the subjects to stop working. Subjects were
instructed to replace all experimental materials in their folder and were then
handed an additional survey to complete. The survey packet contained
manipulation check and dependent variable questions. After completion of the
questionnaire, subjects were debriefed as to the purpose of the experiment and
issued extra credit vouchers.

33
Chapter III
Results
Study Variables
An analysis of internal consistency was conducted on each multiple-item
scale used in the study. Table 1 presents the number of items and coefficient
alpha for each scale. Additionally, the relationships among study variables are
presented in the correlation matrix displayed in Table 2.
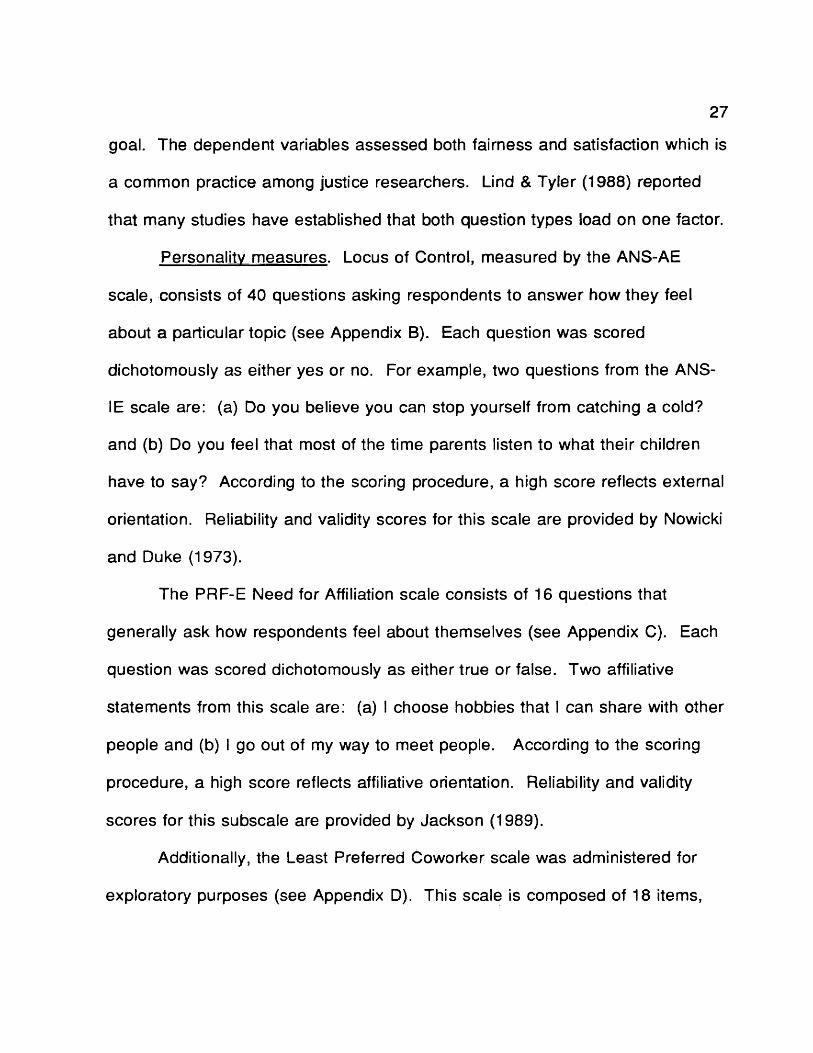
Score frequencies for the two personality measures, hypothesized as
moderator variables, are presented. Figure 1 presents score frequencies of the
Locus of Control (ANS-IE) scale and Figure 2 presents score frequencies of the
Need for Affiliation (PRF-E) scale. To determine if gender differences occurred
on these scales, a one-way analysis of variance was conducted on the Locus of
Control and Need for Affiliation scales. The analysis revealed that there was no
gender effect on Locus of Control (F (1, 136) = 1.0, ns.) nor on Need for
Affiliation (F (1, 136) = 1.4, ns.). Fiedler and Chemers’ Least Preferred
Coworker (LPC) Scale (cited in Fiedler & Garcia, 1987) was also administered
to subjects for the purpose of exploratory analysis and to aid in the
interpretation of hypotheses two and three. Figure 3 presents subject scores
for the Least Preferred Coworker Scale.

34
Table 1
Reliability Estimates of Study Scales
Measure Number of items Alpha
Opportunity to Voice (OV) 2 .58
Process Control (PC) 2 .69
Decision Control (DC) 2 .64
Procedural Fairness (PF) 2 .74
Distributive Fairness (DF) 2 .64
Group Value Desirability (GV) 4 .54
Locus of Control (LOC) 40 .69
Need for Affiliation (AFF) 16 .73
Least Preferred Coworker (LPC) 18 .92

35
Table 2
Correlations Among Study Scales
OV PC DC PF DF GV LOC AFF LPC
OV - .45** .51** .28** .18* .32**
Nor -.08 .04
PC - .67** .47** .43** .39** - .1 1 i o .15
DC - .38** .40** .35** i o CO -.05 .02
PF .72** .68** -.06 b CO .04
DF - .69**
COo
.19* .13
GV - .01 .13 .01
LOC .18* -.17*
AFF - -.19*
LPC
Note. Entries are Pearson correlation coefficients (N = 138). OV = Opportunity
to Voice; PC = Process Control; DC = Decision Control; PF = Procedural
Fairness; DF = Distributive Fairness; GV = Group Value Desirability; LOC =
Locus of Control; AFF = Need for Affiliation; LPC = Least Preferred Coworker.
* £ < .05, 2-tailed.
** £ < -01» 2-tailed.

Figure 1
Subject Scores on the Locus of Control Scale
—p-ii—|—1L-r_JJ—J— r~“ I— —|— —1~ |' ''T1- J — “ii--j1 1* -ji T""' | "’E r" T 'I i"'
57 58 59 61 62 63 64 65 66 67 68 69 70 71 72 73 74 75 76 77 78
Locus of Control
Note. Higher Scores indicate internal Locus of Control Orientation.

Freq
uenc
y
37
Figure 2
Subject Scores on the Need for Affiliation Scale
30 i
Need for Affilltlon Scale
Note. Higher scores indicate affiliative orientation.

Freq
uenc
y
38
Figure 3
Subject Scores on the Least Preferred Coworker Scale
30 -i
25 H
20 H
10 H
.. .v.
m
I-:-:-:*:-:-:-:-:-:-:*:*
liiillii
T *r
20-29T -------1------
40-49T T
60-69 80-89 100-109 120-129
30-39 50-59 70-79 90-99 110-119 130-139
Least Preferred Coworker Scale
Note: Higher scores indicate positive attributes.

39
Manipulation Checks
Opportunity to voice was manipulated in the experimental conditions by
allowing subjects either predecision voice, postdecision voice, or no voice.
Subjects’ perceived opportunity to voice was measured by two questions.
Table 3 presents cell means for the composite scale. To gauge the subjects’
perceptions of the experimental conditions, a one-way analysis of variance
(ANOVA) was conducted on ratings of the voice manipulation check. The
analysis revealed significant main effects for the voice manipulation, F (2, 135)
= 26.66, £ < .001. A Tukey post hoc multiple comparison analysis among the
three treatment conditions was conducted. Results indicate subjects felt they
had been given a greater opportunity to voice in both conditions allowing voice
than in the no-voice condition (£ < .05). The pattern of results indicate that
opportunity to voice was successfully manipulated across the three
experimental conditions.
Group Value Desirability
To investigate subjects’ perceptions regarding procedure desirability
and the level of trust and respect the experimenter demonstrated, four group-
value desirability items were administered for exploratory purposes. The items
were combined, and the ratings on the scale were analyzed by experimental
condition. Table 3 presents cell means for the four-item composite scale. A
one-way analysis of variance (ANOVA) was conducted on subjects’ ratings of

40
Table 3
Condition Means of Study Variables
Condition
Variable Predecision Postdecision No-Voice
Opportunity to Voice 4.70 4.37 2.78
Group-Value Desirability 4.64 4.72 4.45
Process Control 3.72 2.64 2.60
Decision Control 4.19 3.12 2.42
Procedural Fairness 3.88 3.84 4.01
Distributive Fairness 4.06 3.99 4.15
Note. Entries are cell means on 7-point scales; higher values indicate higher ratings.

41
group value desirability. The analysis revealed that the test of group value
desirability by experimental condition was not significant (F (2, 135) = .931, ns.).
Results indicate subjects did not perceive a difference across conditions in
terms of procedure desirability, the extent to which the experimenter was
trusted, or the extent to which subjects felt the experimenter was respectful.
Process Control
To investigate subjects’ perceived level of control over the goal-setting
procedure, two process control items were administered. The items were
combined and ratings on the scale were analyzed by experimental condition.
Table 3 presents cell means for the composite scale. A one-way analysis of
variance (ANOVA) was conducted on subjects’ ratings of perceived control over
the goal-setting procedure (process control). The analysis revealed a
significant main effect for process control (F (2, 135) = 7.21, p < .001). A
Tukey post hoc multiple comparison analysis among the three treatment
conditions was conducted. Results indicate subjects felt they had greater
process control in the predecision voice condition than in either the postdecision
voice condition or the no-voice condition (p < .05). These results further
support the conclusion that subjects perceived the experimental conditions in
the intended manner. In the predecision voice condition, subjects experienced
a change in the assigned goal after they voiced their opinion, and they
perceived greater process control as a result.

42
Decision Control
To investigate subjects’ perceived level of control over the assigned goal,
two decision control items were administered. The two items were combined
and ratings were analyzed by experimental condition. Table 3 presents cell
means for the composite scale. A one-way analysis of variance (ANOVA) was
conducted on subjects’ ratings of perceived control over the assigned goal
(decision control). The analysis revealed a significant main effect for decision
control (F (2,135) = 17.36, g_< .001) . A Tukey post hoc multiple comparison
analysis among the three treatment conditions was conducted. Results indicate
all three conditions differed significantly in the amount of decision control
subjects felt they had over the assigned goal (jd < .05). The predecision voice
condition was rated highest in decision control; postdecision voice was rated
intermediate, and no-voice was rated the lowest. This suggests that subjects
falsely perceived postdecision voice as instrumental in terms of influencing the
experimenter’s decision. Lind et al. (1990) also reported this "leakage of
instrumentality" in their postdecision voice condition.
Procedural Fairness
Hypothesis 1 predicted that perceptions of procedural fairness would range
from high to low across the experimental conditions. This hypothesized linear
relationship is a replication of Lind et al. (1990). Specifically, it was predicted
that subjects’ would perceive the level of procedural fairness to be greatest in

43
the predecision voice condition, moderate in the postdecision voice condition,
and least in the no-voice condition. Table 3 presents cell means for the two-
item procedural fairness scale. To test this hypothesis, a one-way analysis of
variance (ANOVA) was conducted on ratings of procedural fairness. The
analysis revealed that the test of procedural fairness by experimental condition
was not significant (F (2, 135) = .16, ns.). Hypothesis 1 was not supported;
subjects did not perceive a difference in procedural fairness across the
experimental conditions.
Moderator analysis. Hypothesis 2 predicted an interaction between Locus of
Control orientation and experimental condition. Locus of Control orientation
was measured by the ANS-IE scale. Specifically, it was hypothesized that
subjects scoring in the direction of internality would perceive a larger
discrepancy in perceptions of procedural fairness between the predecision voice
condition and the postdecision voice plus no-voice conditions than subjects
scoring in the external direction.
To test this hypothesis, a three-step multiple regression analysis was
conducted with perceptions of procedural justice as the dependent variable (see
Table 4). On step 1, the contrast of experimental condition (predecision voice
vs. postdecision plus no-voice) was entered. The variance accounted for by
this contrast was not significant (F (1, 136) = .03, ns.). On step 2, scores on
the Locus of Control scale were entered. The variance accounted for by Locus

44
Table 4
Regression Analysis of Hypotheses 2 and 3 for Procedural Fairness
Hypothesis 2 Hypothesis 3
R-square R-square R-square R-squareIncrement Total Increment Total
Step 1 .000 .000 .002 .002(contrast)
Step 2 .004 .004 .009 .011(personalityscale)
Step 3 .008 .012 .000 .011(interaction)

45
of Control was not significant (F (1, 136) = .52, ns.). On step 3, the cross-
product term representing the interaction between Locus of Control and the
experimental condition contrast was entered. This step allowed for the test of
Hypothesis 2. The variance accounted for by the interaction term was not
significant (F (1, 136) = 1.15, ns.); Hypothesis 2 was not supported. Locus of
Control orientation was not related to perceptions of procedural fairness.
Hypothesis 3 predicted an interaction between Need for Affiliation and
experimental condition. Affiliative orientation was measured by the PRF-E
Need for Affiliation scale. It was hypothesized that subjects scoring in the
affiliative direction would perceive a larger discrepancy in perceptions of
procedural fairness between the voice conditions (predecision and postdecision)
vs. the no-voice condition than subjects scoring in the nonaffiNative direction.
To test this hypothesis, a three-step multiple regression analysis was conducted
with perceptions of procedural justice as the dependent variable (see Table 4).
On step 1, the contrast between the predecision plus postdecision voice
conditions and the no-voice condition was entered. The variance accounted for
by the contrast of experimental condition was not significant (F (1, 136) = .31,
ns.). On step 2, scores on the Need for Affiliation scale were entered. The
variance accounted for on this step was not significant (F (1, 136) = 1.21, ns.).
On step 3, the cross-product term representing the interaction between Need
for Affiliation and the experimental condition contrast was entered. This step

46
allowed for the test of Hypothesis 3. The variance accounted for by the
interaction term was not significant (F (1, 136) = .04, ns.); Hypothesis 3 was not
supported. Affiliative orientation was not related to perceptions of procedural
fairness.
Distributive Fairness
Hypothesis 1 predicted that perceptions of distributive fairness would
range from high to low across the experimental conditions. Specifically, it was
predicted that subjects would perceive the level of distributive fairness to be
greatest in the predecision voice condition, moderate in the postdecision voice
condition, and least in the no-voice condition. Table 3 presents cell means for
the two-item distributive fairness scale. To test this hypothesis, a one-way
analysis of variance (ANOVA) was conducted on ratings of distributive fairness.
The analysis revealed that the test of distributive fairness by experimental
condition was not significant (F (2, 135) = .15, ns.). Overall, Hypothesis 1 was
not supported; subjects did not perceive a difference in either procedural or
distributive fairness across the experimental conditions.
Exploratory moderator analysis. Although only differences in procedural
fairness were predicted in Hypotheses 2 and 3, for exploratory purposes post-
hoc tests of these hypotheses were conducted using distributive fairness as the
dependent variable. The three-step multiple regression procedures, used to
test Hypotheses 1 and 2 with procedural justice as the dependent variable,

47
were repeated with distributive fairness as the dependent variable. A multiple
regression analysis was conducted with perceptions of distributive justice as the
dependent variable for the exploratory analysis of Hypothesis 2 (see Table 5).
On step 1, the contrast between experimental condition (predecision voice
versus postdecision voice plus no-voice) was entered. The variance accounted
for by the contrast of experimental condition was not significant (F (1, 136) =
.00, ns.). On step 2, scores on the Locus of Control scale were entered. The
variance accounted for on this step was not significant (F (1, 136) = .14, ns.).
On step 3, the cross-product term representing the interaction between Locus
of Control and the experimental condition contrast was entered. The variance
accounted for by the interaction term was not significant (F (1, 136) = 2.03,
ns.); the post-hoc analysis of Hypothesis 2 in relation to distributive fairness
was not supported. Locus of Control orientation was not related to perceptions
of distributive fairness.
A multiple regression analysis was conducted with perceptions of
distributive justice as the dependent variable for the exploratory analysis of
Hypothesis 3 (see Table 5). On step 1, the contrast between the predecision
plus postdecision voice conditions and the no-voice condition was entered. The
variance accounted for by the contrast of experimental condition was not
significant (F (1, 136) - .23, ns.). On step 2, scores on the Need for Affiliation
scale (PRF-E) were entered. The variance accounted for on this step was

48
Table 5
Exploratory Regression Analysis of Hypotheses 2 and 3 for Distributive Fairness
Pos-hoc Analysis of Hypothesis 2
Post-hoc Analysis of Hypothesis 3
R-squareIncrement
R-squareTotal
R-squareIncrement
R-squareTotal
Step 1 (contrast)
.000 .000 .001 .001
Step 2 (personality scale)
.001 .001 .038 .039
Step 3 (interaction)
.015 .016 .026 .066
49
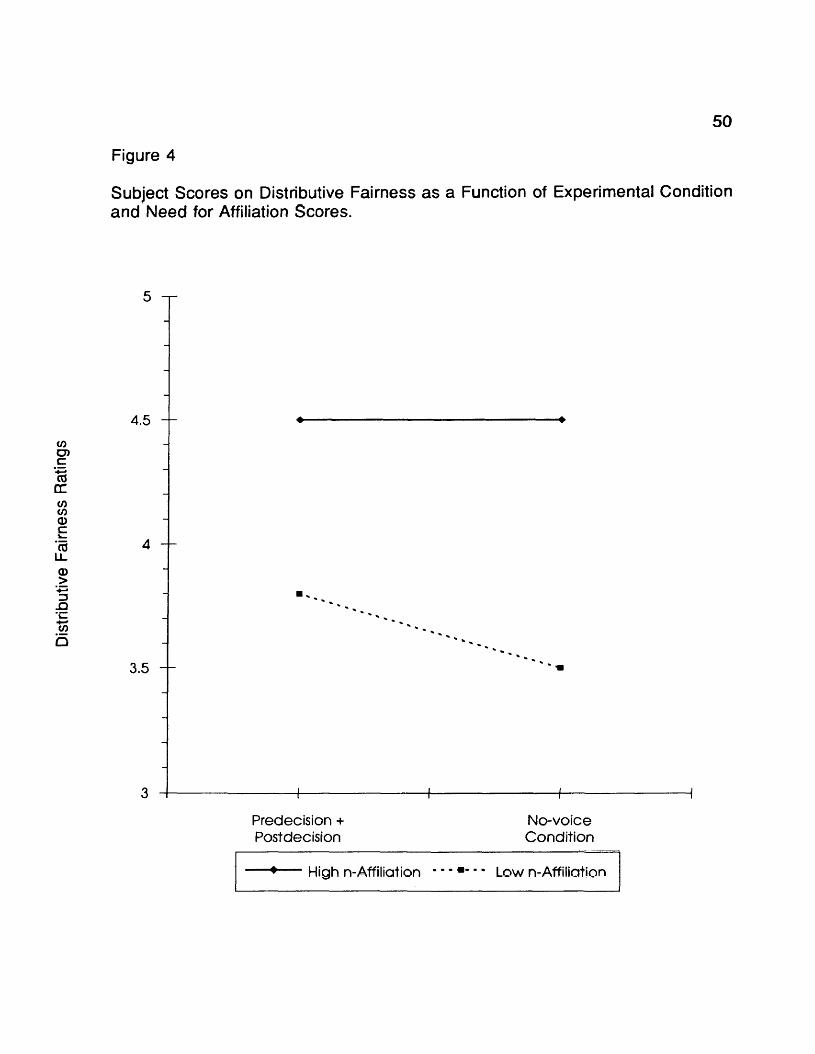
significant (F (1, 136) = 5.35, £ < .05). As subjects scored in the affiliative
direction on the Need for Affiliation scale they rated distributive justice higher
regardless of condition as compared to the subjects who scored in the non-
affiliative direction. This is an important result which indicates an individual
difference component in relation to distributive justice for Need for Affiliation.
On step 3, the cross-product term representing the interaction between Locus
of Control and the experimental condition contrast was entered. The variance
accounted for by the interaction term was marginally significant (F (1, 136) =
3.79, £ = .54). To explore this effect, subjects were divided into two groups
based on their scores on the Need for Affiliation scale. Subjects who scored in
the upper and lower 40 percent on the Need for Affiliation scale were divided
into groups. Subjects in the mid-range of the Need for Affiliation scale were not
included because Jackson (1989) states that mid-range scores are not
interpretable. Distributive fairness ratings were graphed by experimental
contrast for the upper and lower Need for Affiliation groups (see Figure 4).
Overall, subjects who scored in the affiliative direction on the Need for Affiliation
scale rated the voice and no-voice conditions as identical in distributive fairness;
thus, the direction of this interaction was not in the intended direction.
However, subjects who scored in the non-affiliative direction on the Need for
Affiliation scale rated the voice conditions higher in fairness than the no-voice
condition. An individual difference in relation to voice for low need for affiliation
individuals exists.
Dist
ribut
ive
Fairn
ess
Rat
ings
50
Figure 4
Subject Scores on Distributive Fairness as a Function of Experimental Conditionand Need for Affiliation Scores.
5
4.5
4
3.5
3
P re d e c is io n + N o -v o ic e
P o s td e c is io n C o n d itio n
High n-Affiliation — * — Low n-Affi!iation

51
Chapter IV
Discussion
The present study examined the voice effect using personality theory to
explore individual differences in relation to instrumental and group-value
theories of voice. Previous researchers (see Lind & Tyler, 1988) have reported
that persons who are allowed an opportunity to express their opinions typically
report a heightened level of perceived fairness which has been labeled the
voice effect. Instrumental and group-value theories have been proposed as
explanations for this effect. According to the instrumental perspective, people
value voice only to the extent that it will increase desired outcomes (Lind &
Tyler, 1988). The group-value explanation contends that people prefer voice
because of the symbolic aspect of expressing one’s opinion to a receptive
group member which affirms group status (Lind &Tyler, 1988; Tyler, 1990). The
present study proposed an interaction between personality orientation and voice
resulting in differential evaluations of procedural fairness. It has been submitted
that persons oriented towards controlling outcomes will perceive instrumental
voice as more fair than symbolic or no-voice situations; persons oriented in the
affiliative direction will perceive voice, regardless of instrumentality, as more fair
than no-voice situations.
Essential to the tests of the proposed hypotheses is whether the
experimental conditions were adequately manipulated. Examination of the

52
manipulation check questions revealed that subjects perceived a greater
opportunity to express their opinions in the voice conditions compared to the
no-voice condition. This result indicates that the opportunity to voice was
successfully manipulated since subjects were asked their opinions only in the
voice conditions. Next, the analysis of process control revealed that subjects
perceived greater control over the way the goal-setting decision was made in
the predecision voice condition than in either the postdecision or no-voice
conditions. This result indicates that subjects interpreted predecision voice as
instrumental for controlling the method that was used to set their performance
goal. Lastly, the analysis of decision control questions revealed that subjects
perceived greater control over the goal-setting decision in the predecision voice
condition than the postdecision voice condition which further supports the
perceived instrumentality of predecision voice. However, subjects also
perceived greater decision control in the postdecision voice condition than in the
no-voice condition. Recall, the experimental procedure in the postdecision
condition entailed assigning a performance goal and informing subjects that the
experimenter was interested in their opinions regarding the goal. Subjects in
this condition perceived the opportunity to voice as a way of controlling the
decision. Lind et al. (1990) reported the same result pattern with a single
question assessing how much control subjects had over the goal. Subjects in
both studies falsely perceived control over the goal setting decision, referred to

53
as an "illusion” of control. The present finding further supports the difficulty in
separating perceived instrumentality from voice. Evidently, allowing subjects to
voice, even after the decision has been made, is perceived as a means of
influencing the decision maker’s verdict. With the exception of this leakage of
instrumentality in the postdecision voice condition, the independent variable was
adequately manipulated.
Hypothesis 1 was important to the present study since it was merely a
replication of results by Lind et al. (1990). Similar results would have ensured
that the experimental procedure was properly enacted. Hypothesis 1 predicted
ratings of procedural and distributive fairness to be greatest in the predecision
voice condition, moderate in the postdecision voice condition, and least in the
no-voice condition. Hypothesis 1 was not supported; subjects did not rate
procedural or distributive fairness differently as a result of experimental
condition. In fact, the three conditions produced nearly identical group means
and standard deviations for both dependent variables. This result is puzzling,
especially in light of the main effect for process control and decision control.
According to Tyler et al. (1985) procedures that are high in process control tend
to produce enhanced ratings of procedural justice. Additionally, Brett (1985)
reports that high decision control situations, regardless of the level of process
control, will produce enhanced fairness ratings. In either event, a procedure
that has high process control and high decision control, such as the predecision

54
voice condition, should produce enhanced fairness ratings.
Hypotheses 2 and 3 were unique to the present study, predicting an
interaction between personality orientation and experimental condition.
Specifically, Hypothesis 2 predicted subjects scoring in the direction of
internality on the Locus of Control scale would perceive a greater discrepancy
in fairness between the instrumental and noninstrumental conditions than
subjects scoring in the external direction. Hypothesis 2 was tested using a
three-step multiple regression equation. The apriori test of this hypothesis was
not supported with procedural fairness as the dependent. Hypothesis 3
predicted that subjects scoring in the affiliative direction on the PRF-E Need for
Affiliation subscale would perceive a larger discrepancy in perceptions of
fairness between the voice conditions as compared to the no-voice condition
than subjects scoring in the non-affiliative direction. Hypothesis 3 was also
tested using a three-step multiple regression equation. This hypothesis was not
supported with procedural fairness as the dependent variable.
Exploratory analyses of both Hypothesis 2 and 3 with distributive fairness
as the dependent variable were conducted. The post-hoc analysis of
Hypothesis 2 with distributive fairness as the dependent variable did not
produce significance during three step moderated regression analysis.
However, the post-hoc analysis of Hypothesis 3 with distributive fairness
produced significance at two steps. On step 1, the contrast between the

55
predecision plus postdecision voice conditions and the no-voice condition was
entered and the variance accounted for was not significant. On step 2, scores
on the Need for Affiliation scale (PRF-E) were entered; the variance accounted
for on this step was significant. As subjects scored in the Affiliative direction on
the Need for Affiliation scale they rated distributive justice higher regardless of
voice condition. On step 3, the test of Hypothesis 3, the cross-product term
representing the interaction between Need for Affiliation and the experimental
condition contrast was entered. The variance accounted for by the interaction
term was marginally significant, however, the direction of the interaction was not
as predicted since subjects scoring in the affiliative direction rated the
predecision plus postdecision voice conditions the same as the no-voice
condition.
Furthermore, subjects scoring in the nonaffiliative direction tended to rate
the voice conditions higher than the no-voice condition, whereas subjects
scoring in the affiliative direction tended not to rate the conditions differently.
This is a very interesting and surprising result that identifies an individual
difference associated with differential ratings of distributive justice. This finding
validates the use of Need for Affiliation as a moderator of the voice effect.
Presently, a sound theoretical explanation is not available to explain why low
Need for Affiliation individuals rated the voice conditions higher than the no
voice condition. Yet, it may be theorized that the lack of procedural fairness in

56
the no-voice condition was of a greater salience to these individuals since they
did not focus on the affiliative aspects of the experiment. If the decision making
process were more salient to these nonaffiliative individuals, then situations
allowing voice would be perceived as more fair than situations in which input is
not permitted, such as the no-voice situation.
Three scenarios are explored as explanations for the nonsignificant
results of the predicted hypotheses. First, the study hypotheses may be
incorrect, however, it is unlikely that Hypothesis 1 is incorrect since ample
evidence for the voice effect has been documented. Hypotheses 2 and 3 may
be incorrect as the voice effect may be independent of personality orientation.
However, it is difficult to fully reject the feasibility of Hypotheses 2 and 3 since
Hypothesis 1 was not replicated in this study. If Hypothesis 1 had been
replicated and Hypotheses 2 and 3 not supported, one could reasonably
conclude that the moderating effect of personality on voice is questionable.
Since this was not the case, one could argue that the experimental
manipulation or instrumentation is at fault for the nonsignificant findings. In any
event, it is prudent to withhold judgment concerning the feasibility of all three
hypotheses until further testing can be performed.
A second explanation for the present findings is that a flawed
experimental method may be responsible. The method used in this study,
however, was a replication of the one used by Lind et al. (1990), so one can

57
reasonably conclude that the method is sound. Yet, the postdecision voice
condition was not perceived as completely noninstrumental because subjects’
opportunity to voice occurred prior to the performance task. A stronger
symbolic voice condition would entail a postdecision and postperformance task
voice opportunity that would be perceived as clearly noninstrumental by
subjects. Yet, the present experiment did not completely mirror the previous
authors’ methodology since the present study introduced two types of variability
that were not present in the Lind et al. (1990) study. First of all, the
administration of personality measures before the experimental manipulation
may have influenced subjects’ ratings of procedural and distributive fairness.
Secondly, an intercom system was used for the exchange of information and
voice in the Lind et al. (1990) study that was not used in the present study.
Instead, subjects personally interacted with the experimenter throughout the
experiment, and subjects were treated with courtesy and respect throughout the
experiment, and the experimenter was attentive to subjects’ questions and
comments. The interaction between participants may have influenced subjects’
perceptions of voice and confounded the experimental method.
Lastly, the third explanation for the nonsignificant findings of the present
study is flawed instrumentation. Yet, the dependent variable questions
assessing procedural and distributive fairness have been used in numerous
studies (see Lind & Tyler, 1988). Therefore, a reasonable amount of

58
confidence can be placed in the fidelity of the dependent measures. The
dependent variables still may have been influenced by the social interaction that
occurred between subjects and the experimenter. If this interaction influenced
subjects’ ratings of fairness, it could explain why Hypothesis 1 was not
replicated in the present study.
Limitations of the present study are concentrated in the methodological
domain. One limitation relates to the introduction of additional social interaction
between the experimenter and subjects. It is possible that the experimenter
corrupted the experimental setting by expressions of gratitude and friendliness
to subjects before and during the experiment. The social exchange between
the experimenter and subjects may have created a social climate that
influenced procedural and distributive fairness ratings. In essence, this
conclusion could be used to support the group-value theory since the social
interaction between the experimenter and subjects may have augmented
fairness ratings.
If the social interaction explanation of this study’s results is true, future
researchers of the voice effect should thoroughly examine the participant
interactions. These researchers should closely examine the nature of the voice
effect by focusing on verbal and nonverbal social exchange issues.
Researchers may want to examine whether positive interaction influences rating
of procedural and distributive fairness, and procedures should then be designed

59
to minimize the amount of contact between experimenter and subject. For
example, Lind et al. (1990) utilized an intercom system for transmitting
instructions and voice. Additional personality measures should be explored as
possible moderators to the voice effect, as well as the development of a
procedural justice sensitivity scale that incorporates instrumental and group-
value considerations. Some persons may respond to decision-makers by trying
to exercise control or manipulation while others may respond apathetically. A
justice sensitivity scale should focus on the amount of attention individuals
place on both procedures and outcomes.
Additional areas of future investigations should include studies that focus
on group dynamics and voice. These studies could manipulate the size and
dynamics of the group for the investigation of the voice effect. Future
researchers should focus on Tajfel and Turner’s (1979) work with social conflict
and other work such as the use of a super-ordinate goal for conflict resolution.
Lastly, the Need for Affiliation scale may be quite useful for future researchers
in an attempt to isolate an individual difference component to the voice effect.
Under highly social situations the low Need for Affiliation individuals may be the
only group that identifies the no-voice situations as unfair, where as high Need
for Affiliation persons may focus on the social nature of the setting and not on
the decisional justice of the situation.

60
The investigation of the voice effect continues to be an major emphasis
in the justice literature, and the debate over instrumental and group-value
considerations of voice remains. Whether or not predictable individual
differences moderate the voice effect remains unknown. Although, significant
differences in perceptions of distributive fairness were documented by subjects
who had high versus low Need for Affiliation scores. An interesting yet puzzling
finding which suggest the need for further study of the Need for Affiliation
measure as it relates to procedural and distributive justice. Thus, Need for
Affiliation Regardless of the explanation of the voice effect, researchers have
documented that subjective perceptions of procedures and outcomes drive
ratings of procedural fairness. Individuals may be deceived by a procedure that
appears to be fair, such as voice, though, objectively, the procedure is not.
This has led researchers to issue warnings to decision-makers who may portray
noninstrumental voice as influential.
In conclusion, the results of the present study do not fully answer the
question of whether the voice effect is moderated by individual differences. In
terms of the experimental methodology, it appears that the three experimental
conditions were successfully implemented. The examination of three possible
reasons for lack of significance neither eliminated nor supported any one
explanation, although the social interaction which occurred between the
61
subjects and experimenter may best explain the present results. Furthermore,
it was shown that the Need for Affiliation scale may prove quite useful in future
research for the study of individual differences and the voice effect. The results
of the present study take one step in the right direction of validating a scale for
use as a predictor of an individual difference moderator variable.

62
References
Adams, J. S. (1965). Inequity in social exchange. In L. Berkowitz (Ed.),
Advances in experimental social psychology (Vol. 2, pp. 267-299).
San Diego, CA: Academic Press.
Ashcraft, M. H. (1989). Human memory and cognition. Glenview, IL:
Scott/Fores man.
Bies, R. J. (1987). Beyond "voice": The influence of decision-maker
justification and sincerity on procedural fairness judgments.
Representative Research in Social Psychology. 17, 2-15.
Bies, R. J., & Shapiro D. L. (1988). Voice and justification: Their
influence on procedural fairness judgments. Academy of
Management Journal, 31 (3), 676-685.
Brett, J. M. (1986). Commentary on procedural justice papers. In R.
Lewicki, M. Bazerman, & B. Sheppard (Eds.), Research on
negotiation in organizations (Vol. 1, pp.81-90). Greenwich, CT: JAI
Press.
Duke, M. P., & Nowicki, S., Jr. (1973). Personality correlates of the
Nowicki-Strickland locus of control scale for adults. Psychological
Reports. 33. 267-270.

63
Fiedler, F. E., & Garcia, J. E. (1987). New approaches to effective
leadership: Cognitive resources and organizational performance.
New York: John Wiley & Sons.
Folger, R. (1977). Distributive and procedural justice: Combined impact
of "voice" and improvement on experienced inequity. Journal of
Personality and Social Psychology. 35. 108-118.
Folger, R. (1986). Mediation, arbitration, and the psychology of
procedural justice. In R. Lewicki, M. Bazerman, & B. Sheppard
(Eds.), Research on negotiation in organizations (Vol. 1, pp. 57-79).
Greenwich, CT: Jai Press.
Greenberg, J. (1982). Approaching equity and avoiding inequity in
groups and organizations. In J. Greenberg & R. L. Cohen (Eds.),
Equity and justice in social behavior (pp. 389-435). New York:
Academic Press.
Greenberg, J. (1987). Reactions to procedural injustice in payment
distributions: Do the means justify the ends? Journal of Applied
Psychology. 72, 55-61.
Greenberg, J., & Folger, R. (1983). Procedural justice, participation, and
the fair process effect in groups and organizations. In P. B. Paulus
(Ed.), Basic group processes (pp. 235-256). New York: Springer-
Verlag.

64
Homans, G. C. (1961). Social behavior: Its elementary forms. London:
Routledge and Kegan Paul.
Jackson, D. N. (1989). Personality research form manual (3rd ed.). Port
Huron, Ml: Sigma Assessment Systems.
Joe, V. C. (1971). Review of the internal-external control construct as a
personality variable. Psychological Reports. 28. 619-640.
LaTour, S. (1978). Determinants of participant and observer satisfaction
with adversary and inquisitorial modes of adjudication. Journal of
Personality and Social Psychology. 36. 1531-1545.
Leventhal, G. S. (1980). What should be done with equity theory? New
approaches to the study of fairness in social relationships. In K.
Gergen, M. Greenberg, & R. Willis (Eds.), Social exchange:
Advances in theory and research (pp.27-55). New York: Plenum
Press.
Lind, E. A., Earley, P. C., & Kanfer, R. (1990). Voice, control, and
procedural justice: Instrumental and noninstrumental concerns in
fairness judgements. Journal of Personality and Social Psychology,
59(5), 952-959.
Lind, E. A., & Tyler, T. R. (1988). The social psychology of procedural
justice. New York: Plenum Press.

Nowicki, S., Jr., & Duke, M. P. (1973). A locus of control scale for
noncollege as well as college adults. Journal of Personality
Assessment. 10, 136-137.
Mehrabian, A., & Ksionzky, S. (1974). A theory of affiliation. Lexington,
MA: Lexington Books.
Murray, H. A. (1938). Explorations in personality. Cambridge: Harvard
University Press.
Rotter, J. B. (1966). Generalized expectancies for internal versus
external control of reinforcement. Psychological Monographs,
80, 1-28.
Sheppard, B. H., Lewicki, R. J., & Minton, J. W. (1992). Organizational
justice: The search for fairness in the workplace. New York:
Lexington Books.
Spector, P. E. (1982). Behavior in organizations as a function of
employee’s locus of control. Psychological Bulletin. 91, 482-497.
Tajfel, H., & Turner, J. C. (1979). An integrative theory of social conflict.
In W. Austin and S. Worchel (Eds.), The social psychology of
intergroup relations (pp. 33-47). Monterey, CA: Brooks/Cole.
Thibaut, J. W., & Walker, L. (1975). Procedural justice: A psychological
analysis. Hillsdale, NJ: Lawrence Erlbaum Associates.

Tyler, T. R. (1989). The psychology of procedural justice: A test of the
group-value model. Journal of Personality and Social Psychology,
57, 830-838.
Tyler, T. R. (1990). Why people follow the law: Procedural justice.
legitimacy, and compliance. New Haven, CT: Yale University Press.
Tyler, T. R. & Lind, E. A. (1992). A relational model of authority in
groups. In M. Zanna (Ed.), Advances in experimental social
psychology (Vol. 25, pp. 115-191). New York: Academic Press.
Tyler, T. R., Rasinski, K. A., & Spodick, N. (1985). Influence of voice on
satisfaction with leaders: Exploring the meaning of process control.
Journal of Personality and Social Psychology. 48. 72-81.
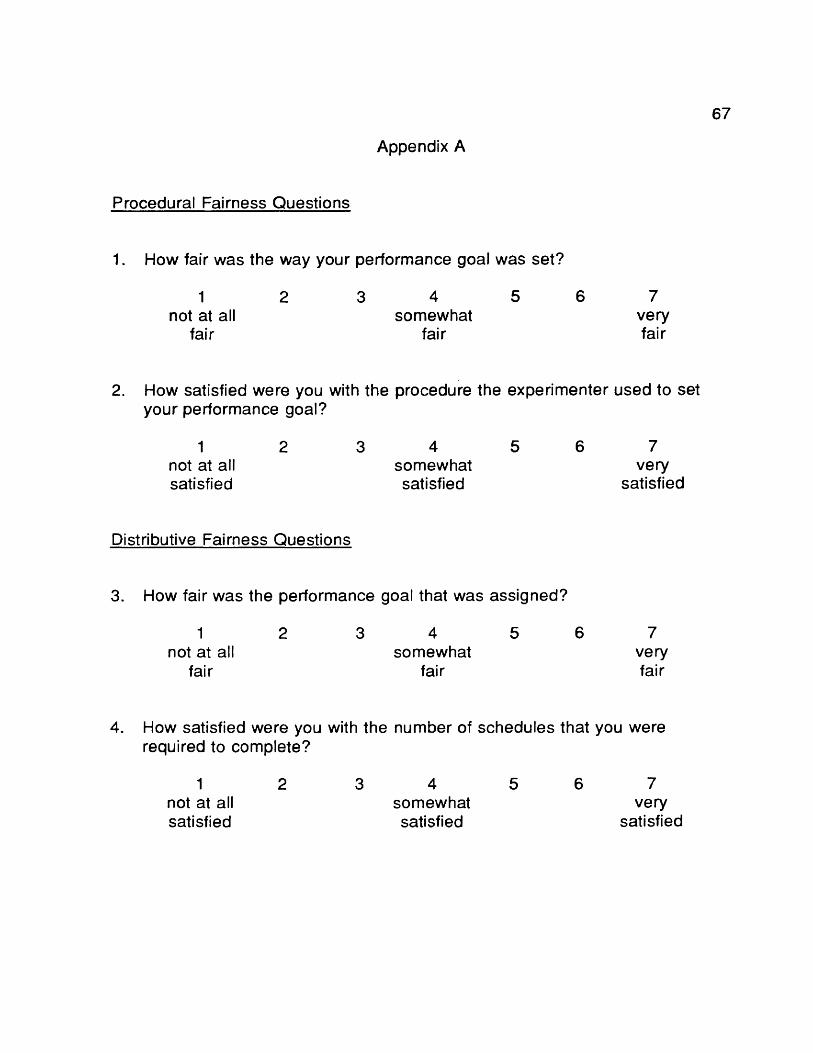
Appendix A
67
Procedural Fairness Questions
1. How fair was the way your performance goal was set?
1 2 3 4 5 6 7not at all somewhat very
fair fair fair
2. How satisfied were you with the procedure the experimenter used to set your performance goal?
1 2 3 4 5 6 7not at all somewhat verysatisfied satisfied satisfied
Distributive Fairness Questions
3. How fair was the performance goal that was assigned?
1 2 3 4 5 6 7not at all somewhat very
fair fair fair
4. How satisfied were you with the number of schedules that you were required to complete?
1 2 3 4 5 6 7not at all somewhat verysatisfied satisfied satisfied
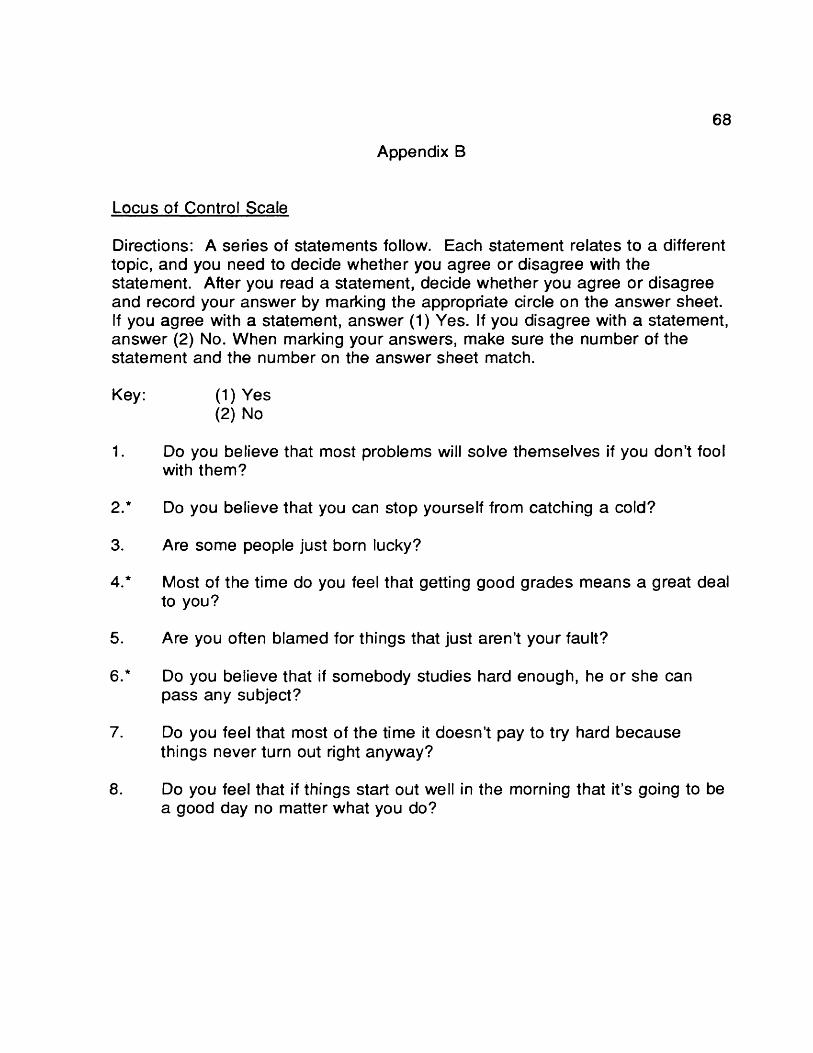
Appendix B
68
Locus of Control Scale
Directions: A series of statements follow. Each statement relates to a different topic, and you need to decide whether you agree or disagree with the statement. After you read a statement, decide whether you agree or disagree and record your answer by marking the appropriate circle on the answer sheet. If you agree with a statement, answer (1) Yes. If you disagree with a statement, answer (2) No. When marking your answers, make sure the number of the statement and the number on the answer sheet match.
Key: (1) Yes(2) No
1. Do you believe that most problems will solve themselves if you don’t foolwith them?
2.* Do you believe that you can stop yourself from catching a cold?
3. Are some people just born lucky?
4.* Most of the time do you feel that getting good grades means a great dealto you?
5. Are you often blamed for things that just aren’t your fault?
6.* Do you believe that if somebody studies hard enough, he or she canpass any subject?
7. Do you feel that most of the time it doesn’t pay to try hard because things never turn out right anyway?
8. Do you feel that if things start out well in the morning that it’s going to be a good day no matter what you do?

69
9.* Do you feel that most of the time parents listen to what their children have to say?
10. Do you believe that wishing can make good things happen?
11. When you get criticized, does it usually seem it’s for no good reason at all?
12. Most of the time do you find it hard to change a friend’s (mind) opinion?
13.* Do you think that cheering more than luck helps a team to win?
14. Did you feel that it was nearly impossible to change your parent’s mind about anything?
15.* Do you believe that parents should allow children to make most of their own decisions?
16. Do you feel that when you do something wrong there’s very little you can do to make it right?
17. Do you believe that most people are just born good at sports?
18. Are most of the other people your age and sex stronger than you are?
19.* Do you feel that one of the best ways to handle most problems is just not to think about them?
20.* Do you feel that you have a lot of choice in deciding whom your friends are?
21. if you find a four leaf clover, do you believe that it might bring you good luck?
22.* Did you often feel that whether or not you do your homework has much to do with what kind of grades you get?

70
23. Do you feel that when a person your age is angry at you, there’s little you can do to stop him or her?
24. Have you ever had a good luck charm?
25.* Do you believe that whether or not people like you depends on howyou act?
26.* Did your parents usually help you if you asked them to?
27. Have you felt that when people were angry with you, it was usually forno reason at all?
28.* Most of the time, do you feel that you can change what might happen tomorrow by what you do today?
29. Do you believe that when bad things are going to happen, they just are going to happen no matter what you try to do to stop them?
30.* Do you think that people can get their own way if they just keep trying?
31. Most of the time did you find it’s useless to try to get your own way athome?
32.* Do you feel that when good things happen, they happen because of hard work?
33. Do you feel that when somebody your age wants to be your enemy, there’s little you can do to change matters?
34.* Do you feel that it’s easy to get friends to do what you want them to do?
35. Do you usually feel that you have little to say about what you get to eatat home?
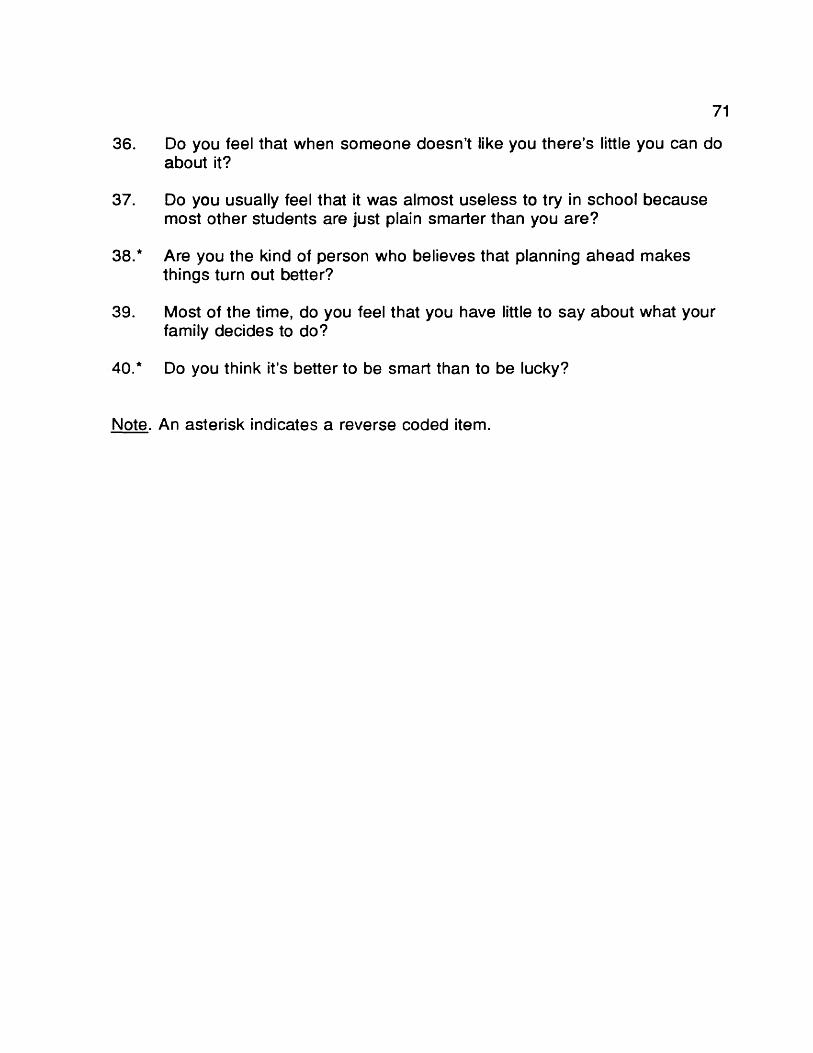
71
36. Do you feel that when someone doesn’t like you there’s little you can do about it?
37. Do you usually feel that it was almost useless to try in school because most other students are just plain smarter than you are?
38.* Are you the kind of person who believes that planning ahead makes things turn out better?
39. Most of the time, do you feel that you have little to say about what your family decides to do?
40.* Do you think it’s better to be smart than to be lucky?
Note. An asterisk indicates a reverse coded item.

72
Appendix C
Need for Affiliation Scale
Directions: A series of statements follow that one might use to describe oneself. Read each statement and decide whether or not it describes you. Then indicate your answer by marking the appropriate circle on the green answer sheet. If you agree with a statement or decide that it does describe you, answer (1) true. If you disagree with a statement or feel that it is not descriptive of you, answer (2) false. When marking your answers, make sure the number of the statement and the number on the answer sheet match.
Key: (1) True(2) False
1. I choose hobbies that I can share with other people.
2.* I am quite independent of the people I know.
3. I go out of my way to meet people.
4.* I would not be very good at a job which required me to meet people allday long.
5.* I seldom put out extra effort to make friends.
6. People consider me to be quite friendly.
7* I don’t really have fun at large parties.
8.* Often I would rather be alone than with a group of friends.
9.* When I see someone I know from a distance, I don’t go out of my way tosay hello.
10. My friendships are many.
11. I trust my friends completely.

73
12.* I don’t spend much of my time talking with people I see every day.
13. I try to be in the company of friends as much as possible.
14. I truly enjoy myself at social functions.
15.* Sometime I have to make a real effort to be sociable.
16. I spend a lot of time visiting friends.
Note. An asterisk indicates a reverse coded item.

74
Appendix D
Least Preferred Coworker Scale
Directions: Throughout your life you have worked in many groups with a wide variety of different people - on your job, in social clubs, In church organizations, in volunteer groups, on athletic teams, and in many others. You probably found working with most of your coworkers quite easy, but working with others may have been very difficult or all but impossible.
Now think of all the people with whom you have ever worked. Next, think of the one person in your life with whom you could work least well. This individual may or may not be the person you also dislike most. It must be the one person with whom you had the most difficulty getting a job done, the one single individual with whom you would least want to work. This person is called your "Least Preferred Coworker" (LPC).
On the scale below, describe this person by picking the number that best represents the person. The scale consists of pairs of words which are opposite in meaning, such as Very Neat and Very Untidy. Between each pair of words are eight spaces which form the following scale:
Examples:
Very VeryNeat 1 2 3 4 5 6 7 8 Untidy
Think of those eight numbers as steps which range from one extreme to the other. Thus, if you ordinarily think that this least preferred coworker is quite neat you would choose number 2 as your answer and mark the corresponding circle on the answer sheet.
Very VeryUntidyNeat 1 2 3 4 5 6 7 8
Very Quit Some Slightly Slightly Some Quite VeryNeat Neat what
NeatNeat Untidy what
UntidyUntidy Untidy

75
However, if you ordinarily think of this person as being only slightly neat, you would choose number 4 as your answer. If you think of this person as very untidy (not neat), you would choose number 8. After you have decided upon an answer, mark the corresponding circle on the answer sheet.
Before you decide upon a number, look at the words at both ends of the line. There are no right or wrong answers. Work rapidly: your first answer is likely to be the best. Do not omit any items and mark each item only once. Think of the real person in your experience, not an imaginary character. Remember, it is not necessarily the person whom you liked least, but the person with whom it is (or was) most difficult to work. Now use the scale to describe the person with whom you can work least well.
Note. On the following scale, an asterisk indicates a reverse coded item.

76
Example
Neat 1 2 3Very Quit Some- Neat Neat what
Neat
4Slightly
Neat
5SlightlyUntidy
6Somewhat
Untidy
7QuiteUntidy
8Very
Untidy
Untidy
1. Pleasant 1 2 3 4 5 6 7 8 Unpleasant
2. Friendly 1 2 3 4 5 6 7 8 Unfriendly
3.* Rejecting 1 2 3 4 5 6 7 8 Accepting
4.* Tense 1 2 3 4 5 6 7 8 Relaxed
5.* Distant 1 2 3 4 5 6 7 8 Close
6.* Cold 1 2 3 4 5 6 7 8 Warm
7. Supportive 1 2 3 4 5 6 7 8 Hostile
8.* Boring 1 2 3 4 5 6 7 8 Interesting
9.* Quarrelsome 1 2 3 4 5 6 7 8 Harmonious
10/ Gloomy 1 2 3 4 5 6 7 8 Cheerful
11. Open 1 2 3 4 5 6 7 8 Guarded
12/ Backbiting 1 2 3 4 5 6 7 8 Loyal
13/ Untrustworthy 1 2 3 4 5 6 7 8 Trustworthy
14. Considerate 1 2 3 4 5 6 7 8 Inconsiderate
15/ Nasty 1 2 3 4 5 6 7 8 Nice
16. Agreeable 1 2 3 4 5 6 7 8 Disagreeable
17/ Insincere 1 2 3 4 5 6 7 8 Sincere
18. Kind 1 2 3 4 5 6 7 8 Unkind

Appendix E
77
Manipulation Check Questions
1. How much information did you give the experimenter concerning your feelings about your performance goal?
1 2 3 4 5 6 7none at all some very much
2. How much opportunity did you have to express your opinions about your performance goal before the decision was made by the experimenter?
1 2 3 4 5 6 7not at all somewhat verysatisfied satisfied satisfied
Process Control Questions
3. Overall, how much control would you say you had over the way your performance goal was set?
1 2 3 4 5 6 7none at all some very much
4. How much control did you have over the method that was used to set your performance goal?
1 2 3 4 5 6 7none at all some very much

78
Decision Control Questions
5. How much control did you have over the number of schedules that you were required to complete?
1 2 3 4 5 6 7none at all some very much
6. To what extent could you influence the performance goal that was set by the experimenter?
1 2 3 4 5 6 7not at ail somewhat very much
Group Value Desirability Questions
7. To what extent do you trust the experimenter’s decision-making?
1 2 3 4 5 6 7not at all somewhat very much
8. To what extent was the experimenter respectful to you?
1 2 3 4 5 6 7not at all somewhat very much
9. Would you consider being a member of a group that used the same procedure as the experimenter did in order to make a decision?
1 2 3 4 5 6 7not at all somewhat very much
10. If your supervisor/boss used the same goal setting procedure as the experimenter did, how would you rate your standing/status as a member of the work group?
1 2 3 4 5 6 7very low moderate very high

Appendix F
79
Course Schedule Construction Task
Directions: The purpose of the experimental task is the construction of course schedules. You will need the following: a class grouping sheet, Schedule Sheets, a Fall Class Schedule, dice, and a pencil. If any of these are missing, please contact the experimenter. When you have completed the schedules that were assigned to you, attach a paper clip to the completed SCHEDULE SHEETS and return the other supplies to the folder.
Use the following rules for the construction of all schedules:
1. Each schedule must contain one class from each of the three course grouping for a total of three classes. You will be required to select the three classes for each course schedule by a dice roll.You may only use the classes listed in the three class groupings.
2. Start the construction task by rolling the dice provided. On the courseschedule sheet record the following from group one on the Schedulesheet: the number rolled, and the corresponding Course ID number,Course Name, and page number. Repeat this procedure for group two and group three to complete the selection of classes for a single course schedule.
3. After you have recorded the information for each of the three groups by the procedure outlined above, you will need to access individual class times and call numbers from the Fall Schedule Booklet.A Fall 1993 Class Schedule is supplied. DO NOT WRITE IN THE COURSE CATALOG.
4. In order to complete a schedule, you will have to choose individual classes that can be combined to create a course schedule. Therefore, you can not choose class that have conflicting times. Note the weekly limitations that represent a work schedule; you can not choose class times that conflict with these limitations.
5. Under rare circumstances, you will not be able to finish a schedule due to time conflicts. If this occurs, write "Conflict" across the section labeled Start & End Times and move to the next problem.

80
Course Grouping Sheet
Group One
Dice # Course ID Course Name Page
1. ANTH 1050 INTRO TO GENERAL ANTH p. 232. BIOL 1330 ENVIRONMENTAL BIOLOGY p. 243. PSYC 3520 CHILD PSYCHOLOGY p. 444. SOC 1010 INTRO TO SOCIOLOGY p. 455. PHIL 1010 INTRO TO PHILOSOPHY p. 406. FREN 1110 ELEMENTARY FRENCH I p. 317. SPAN 1110 ELEMENTARY SPANISH I p. 328. CHEM 1180 GEN CHEM & QUAL ANALYSIS p. 299. GERM 1110 ELEMENTARY GERMAN I p. 31
10. MATH 1950 CALCLUS I p. 3411. PSCI 1100 INTRO AMERICAN NATL GOVT p. 4212. MATH 1324 PRECALC ALGEBRA p. 34
Group Two
Dice # Course ID Course Name Page
1. GEOG 1020 INTRO TO HUMAN GEOGRAPHY p. 372. HIST 1010 WORLD CIV I p. 393. HIST 1010 WORLD CIV II p. 394. CJUS 1010 SURVEY OF CRIM JUSTICE p. 505. EDUC 2020 EDUCATIONAL FOUNDATIONS p. 546. RELI 1010 INTRO TO WORLD RELIGIONS p. 407. PSCI 1000 INTRO TO POL SCI p. 428. SPCH2410 SMALL GROUP COMM & LEADERSHIP p. 289. EDUC 2010 HUMAN GROWTH & LEARNING p. 54
10. PE 1800 FITNESS FOR LIVING p. 5711. EDUC 2020 HUMAN RELATIONS p. 5512. CSCI 1500 COMPUTER LITERACY/PROGRAM p. 32
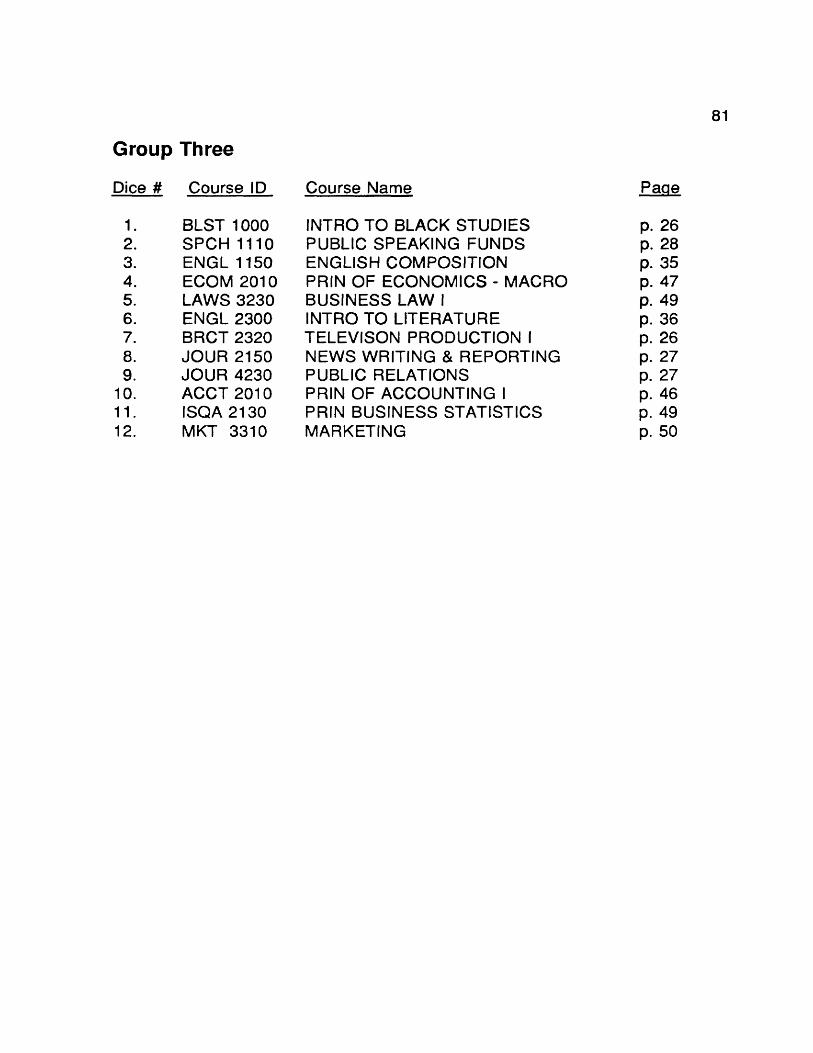
81
Group Three
Dice # Course ID Course Name Pape
1. BLST 1000 INTRO TO BLACK STUDIES p. 262. SPCH 1110 PUBLIC SPEAKING FUNDS p. 283. ENGL 1150 ENGLISH COMPOSITION p. 354. ECOM 2010 PRIN OF ECONOMICS - MACRO p. 475. LAWS 3230 BUSINESS LAW I p. 496. ENGL 2300 INTRO TO LITERATURE p. 367. BRCT 2320 TELEVISON PRODUCTION I p. 268. JOUR 2150 NEWS WRITING & REPORTING P- 279. JOUR 4230 PUBLIC RELATIONS p. 27
10. ACCT 2010 PRIN OF ACCOUNTING I p. 4611. ISQA 2130 PRIN BUSINESS STATISTICS p. 4912. MKT 3310 MARKETING p. 50

82
Course Schedule Recording Sheets
SCHEDULE SHEET
Dice # ID, Name, Pge Call Class Start & EndNumber Days Times
(Work Schedule: 8:00 am - 4:00 pm M-W-F)
SCHEDULE SHEET
Dice # ID, Name, Pge Call Class Start & EndNumber Days Times
(Work Schedule: 8:00 am - 4:00 pm T, R)

83
Appendix G
Experimental Script
My, name is . There are two parts to this experiment. In part one, you willbe asked to complete three surveys for at total of 76 questions. In part two, you will work on constructing course schedules. You’ll be given five minutes for practice and then you will construct course schedules during a 15 minute trial. There is no deception involved with this experiment. If you have any questions at any time feel free to ask.
These folders have all the information that you will need during the experiment. Please remove the page labeled consent form. Read the entire form, please initial page one and sign page two.
[Afterwards]
Does everyone understand the written text in the consent form?
Now, please turn the scan sheet to side one. Look at the lower left corner and locate the area called "Identification Number." You should all have a three digit number recorded in this area. Use a number two pencil to fill in the corresponding circles under the four digit number. TAKE YOU TIME WHEN MARKING YOUR ANSWERS, AND USE REASONABLE PRESSURE WHEN DARKENING THE CIRCLES. DON’T PRESS TOO HARD.
[When subjects are finished]
Ok, now look at the right side, notice that the column on the left goes from 1 to 10 and number 11 starts on the next column to the right, and so on...
In each of your folders is a survey question packet, like this, it contains three surveys. Each survey has unique directions, so please read the directions carefully. In a minute, I’ll assign you a room where you can get started on the surveys.
However, before I do that, I would like briefly explain the course scheduling task for part two.

84
You'll roll the dice and chose the corresponding course in group one from the course grouping sheet. Record the dice roll, the course ID number, and the page number. Next, repeat this procedure for group two and three. After you record the course information, you'll need to access class times from the official Course Catalog schedule book to complete a single course schedule. Do not pick class times that conflict with the work schedule or other class times. DO NOT WRITE ON ANYTHING BUT THE RECORD SHEET.
Please note, that the last page of the survey instructs you to read through the course schedule instructions. When you are done come and see me for the dice.
[After subjects have completed surveys]
Do you have any questions regarding the course scheduling task? Ok, I would like you to complete as many schedules as you can in the next five minutes, I’ll set the timer, for five minutes. When the bell goes off, please stop working and wait until I return. You may have to wait a minute or two. You will have to work rapidly, so you can get as many schedules completed as possible in the five minutes
[After the practice trail - send subjects to their individual room]
1. Pre-decision voice
Do you have any question? I would like to know what you think of the scheduling task? Do you feel that it is easy or difficult, interesting or boring?
[Voice]
Well, I was thinking of setting the performance goal at 12 schedules, this is the number of course schedules that you will be required to complete in fifteen minutes. However, before doing so, I would like to hear your opinion. What are you feelings about being required to complete 12 course schedules in 15 minutes?
[Voice]
85
Ok, I will set the performance goal at 10 schedules. So please complete 10 schedules in the next 15 minutes. Please start now, I'll set the timer, and when the bell sounds please stop working. When your time is up, I’ll be back.
[After the 15 minute trail]
The 15 minute trail is over, please organize your materials and return them to the folder. I have an additional survey I would like you to complete. Please read the instructions carefully. The first question begins where you ended on the scan sheet. When you’re done, gather you materials and come see me.
2. Post-decision Voice
Do you have any questions? How many schedules did you complete? Each schedule does take some time. I would like to know what you think of the scheduling task? How easy or difficult, interesting or boring is the task?
[Voice]
All subjects are required to complete 10 course schedules in 15 minutes, this is your performance goal. Nevertheless, I would like to know what you think about the performance goal of ten schedules.
Probes:
What are your feelings about being required to complete 10 schedules in 15 minutes?
Do you think you can complete 10 schedules in 15 minutes?
How difficult will it be to complete 10 schedules in 15 minutes?
I’m really interested in how you feel about the goal...
[Voice]

86
Ok, please complete 10 schedules in the next 15 minutes. Please start now, I’ll set the timer. When your time is up I’ll be back.
[After the 15 minute trail]
The 15 minute trail is over, please organize your materials and return them to the folder. I have an additional survey I would like you to complete. Please read the instructions carefully. The first question begins where you ended on the scan sheet. When you’re done, gather you materials and come see me.
3. No-Voice
Do you have any questions? All subjects are required to complete 10 schedules in 15 minutes, this is your performance goal. Please start now, I’ll set the timer. When your time is up, I’ll be back.
[After the 15 minute trail]
The 15 minute trail is over, please organize your materials and return them to the folder. I have an additional survey I would like you to complete. Please read the instructions carefully. The first question begins where you ended on the scan sheet. When you’re done, gather you materials and come see me.
Top Related