


Languages
Pages
Legal


Census of India 2011Census of India 2011Press Conference, 4th April, 2011Press Conference, 4th April, 2011 Our Census, Our Future
Press Conference for
Release of Provisional Population Totals
MADHYA PRADESH
Directorate of Census Operations, Madhya Pradesh,Ministry of Home Affairs, Government of India Janaganana Bhavan, Jail Road, Bhopal
Census of India 2011Census of India 2011Press Conference, 4th April, 2011Press Conference, 4th April, 2011 Our Census, Our Future
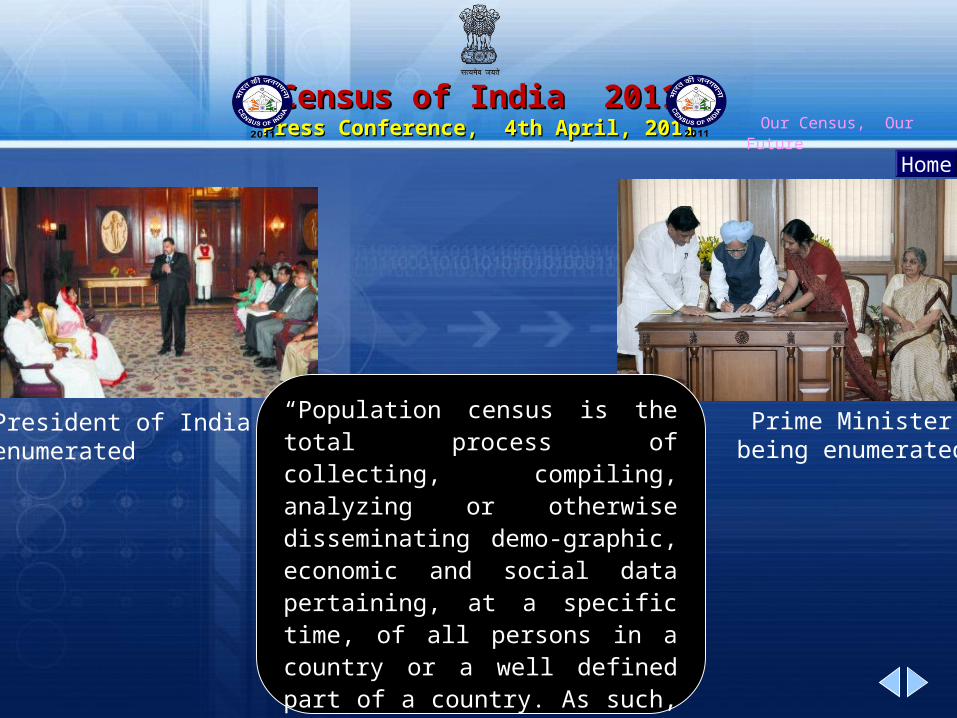
“Population census is the total process of collecting, compiling, analyzing or otherwise disseminating demo-graphic, economic and social data pertaining, at a specific time, of all persons in a country or a well defined part of a country. As such, the Census provides a snapshot of the country’s population and housing at a given point of time.”
President of Indiaenumerated
Prime Minister being enumerated
Home

Census of India 2011Census of India 2011Press Conference, 4th April, 2011Press Conference, 4th April, 2011 Our Census, Our Future
Governor, Madhya Pradesh
Chief Secretary, Madhya Pradesh
Home
Ex-Chief Minister
PS ,Home , Madhya Pradesh
Chief Minister , Madhya Pradesh
1st PhaseEnumeration

Census of India 2011Census of India 2011Press Conference, 4th April, 2011Press Conference, 4th April, 2011 Our Census, Our Future
Governor, Madhya Pradesh Chief Secretary, Madhya Pradesh
Home
Chief Minister , Madhya Pradesh
2nd PhaseEnumeration

Census of India 2011Census of India 2011Press Conference, 4th April, 2011Press Conference, 4th April, 2011 Our Census, Our Future
It’s the biggest source of comprehensive data on :
• Demography
• Economic Activity
• Literacy & Education
• Housing & Household Amenities
• Urbanization
• Fertility and Mortality
• Scheduled castes and Scheduled Tribes
• Language, Religion & Migration
Home

Census of India 2011Census of India 2011Press Conference, 4th April, 2011Press Conference, 4th April, 2011 Our Census, Our Future
Census 2011: Census 2011 is the 15th Census of India since1872 Census 2011 was held in two phases: Phase I : Houselisting & Housing Census
(April to September 2010)
in Madhya Pradesh
held between 7th May to 22nd June 2010
Phase II : Population Enumeration
(9th to 28th February 2011) Reference Date: 0:00 Hours of 1st March 2011

Census of India 2011Census of India 2011Press Conference, 4th April, 2011Press Conference, 4th April, 2011 Our Census, Our Future
Pre-census Activities
Number of Administrative units in 2011 Census - Madhya Pradesh
Divisions 10
Districts 50
Sub-districts 342
Towns 476
Villages 54,903
Home
Number of Administrative units in 2011 Census - India
States/UTs 35
Districts 640
Sub-districts 5,924
Towns 7,936
Villages 6. 41 lakh
Administrative units :

Census of India 2011Census of India 2011Press Conference, 4th April, 2011Press Conference, 4th April, 2011 Our Census, Our Future
What is Provisional Population?Provisional Population is arrived at by adding the
Population as reported by each Enumerator for
the Enumeration Block assigned to her/himThere could be errors in addition or there could
be cases of omission/ duplication of Enumeration
BlocksThe final population will be arrived at by
scanning of Schedules, data processing and
other checksThe Final Population is likely to be released next
year

Census of India 2011Census of India 2011Press Conference, 4th April, 2011Press Conference, 4th April, 2011 Our Census, Our Future
PopulationPopulation

Census of India 2011Census of India 2011Press Conference, 4th April, 2011Press Conference, 4th April, 2011 Our Census, Our Future
Population India: CENSUS 2011
Persons 1,21,01,93,422
Males 62,37,24,248
Females 58,64,69,174
Population Madhya Pradesh : CENSUS 2011
Persons 7,25,97, 565
Males 3,76,11,370
Females 3,49,84,645Males include ‘Males’ and ‘Others’

Census of India 2011Census of India 2011Press Conference, 4th April, 2011Press Conference, 4th April, 2011 Our Census, Our Future
DISTRICT-WISE ANALYSIS :Among districts,
Indore stands first in terms of population (32,72,335) followed by
Jabalpur (24,60,714), Sagar (23,78,295), Bhopal (23,68,145) and Rewa (23,63,744)
Lowest populated districts are:
Harda (5,70,302), Umaria (6,43,579), Sheopur (6,87,952), Dindori (7,04,218) and Alirajpur(7,28,677).

Census of India 2011Census of India 2011Press Conference, 4th April, 2011Press Conference, 4th April, 2011 Our Census, Our Future
Census 2001
Census 2011
Difference Growth Rate
(2001- 2011)
Persons 6,03,48,023 7,25,97, 565 1,22,49,542 20.3
Males 3,14,43,652 3,76,11,370 61,67,718 19.6
Females 2,89,04,371 3,49,84,645 60,80,274 21.0
Males include ‘Males’ and ‘Others’
Population; Madhya Pradesh : 2001 and 2011

Census of India 2011Census of India 2011Press Conference, 4th April, 2011Press Conference, 4th April, 2011 Our Census, Our Future
Population 1901-2011: India and Madhya Pradesh
Year India Madhya Pradesh
Year India Madhya Pradesh
1901 238,396,327 12,679,214 1961 439,234,771 23,217,910
1911 252,093,390 14,249,382 1971 548,159,652 30,016,625
1921 251,321,213 13,906,774 1981 683,329,097 38,168,507
1931 278,977,238 15,326,879 1991 846,302,688 48,566,242
1941 318,660,580 17,175,722 2001 1,027,015,247 60,348,023
1951 361,088,090 18,614,931 2011 1,210,193,422 72,597,565

Census of India 2011Census of India 2011Press Conference, 4th April, 2011Press Conference, 4th April, 2011 Our Census, Our Future
Madhya Pradesh and its neighbouring States
Rank in 2011
State Population 2011
Percentage share to total population of
India
Rank in 2001
2011 2001
1 Uttar Pradesh
199,581,477 16.49 16.17 1
2 Maharashtra 112,372,972 9.29 9.42 2
6 Madhya Pradesh
72,597,565 6.00 6.05 7
8 Rajasthan 68,621,012 5.67 5.50 8
10 Gujarat 60,383,628 4.99 4.93 10
16 Chhattisgarh 25,540,196 2.11 2.03 17

Census of India 2011Census of India 2011Press Conference, 4th April, 2011Press Conference, 4th April, 2011 Our Census, Our Future
Top Five States/UTs
State/UT Population
Uttar Pradesh 19,95,81,477
Maharashtra 11,23,72,972
Bihar 10,38,04,637
West Bengal 9,13,47,736
Andhra Pradesh 8,46,65,533
Bottom Five States/UTs
State/UT Population
Lakshadweep 64,429
Daman & Diu 2,42,911
Dadra & Nagar Haveli 3,42,853
Andaman& Nicobar Islands
3,79,944
Sikkim 6,07,688
Top five and bottom five States/UT by population size
Census of India 2011Census of India 2011Press Conference, 4th April, 2011Press Conference, 4th April, 2011 Our Census, Our Future

Census of India 2011Census of India 2011Press Conference, 4th April, 2011Press Conference, 4th April, 2011 Our Census, Our Future
India is the second most populated country in the world, next to China.
Comparing the population size of
India with that of other countries, along with its neighbouring countries, there seems to be a wide gap in population size.
India and World PopulationCountries Population (in
Thousand)China 13,54,146
India * 12,10,193
USA 3,17,641
Indonesia 2,32,517
Brazil 1,95,423
Pakistan1,84,753
Bangladesh1,64,425
Thailand68,139
Nepal29,853
Afghanistan29,117
Sri Lanka 20,410
* India as per provisional figures of Census 2011 (Source: World Population Prospects, the 2008 Revision 2010)

Census of India 2011Census of India 2011Press Conference, 4th April, 2011Press Conference, 4th April, 2011 Our Census, Our Future
The population of Madhya Pradesh is more than that of many countries like Thailand, France, United Kingdom, Italy, Myanmar and South Africa,
Its population is slightly lower than that of countries like Iran, Turkey and Germany.
The population of Madhya Pradesh is higher than the combined population of Australia, Sri lanka and Afghanistan
Sixteenth countries in the world have population more than that of Madhya Pradesh .
The increase in population during decade is higher than the total population of Greece (1.13 crore)
A Comparison: Madhya Pradesh and Countries
Madhya Pradesh and Other Countries
Population (in Thousand)
Germany 82,057Turkey 75,705Iran 75,078Madhya Pradesh 72,597*Thailand 68,139France 62,637United Kingdom 61,899Italy 60,098Myanmar 50,496South Africa 50,492
* India as per provisional figures of Census 2011 (Source: World Population Prospects, the 2008 Revision 2010)

Census of India 2011Census of India 2011Press Conference, 4th April, 2011Press Conference, 4th April, 2011 Our Census, Our Future
82
05
7
75
70
5
75
07
8
72
59
7
68
13
9
62
63
7
61
89
9
60
09
8
50
49
6
50
49
2
45000
55000
65000
75000
85000
Ge
rma
ny
Tu
rke
y
Ira
n
Ma
dh
ya
P
rad
esh
Th
aila
nd
Fra
nce
Un
ite
d
Kin
gd
om
Ita
ly
Mym
ma
r
So
uth
Afr
ica
Po
pu
lati
on
in t
ho
us
an
d
Countries and Madhya Pradesh
World Population Prospects, the 2008 Revision 2010 and Census of India 2011
Germany Turkey Iran Madhya Pradesh Thailand France United Kingdom Italy Mymmar South Africa

Census of India 2011Census of India 2011Press Conference, 4th April, 2011Press Conference, 4th April, 2011 Our Census, Our Future
Madhya Pradesh and its neighbouring States
Rank in
2011State
Population 2011
Percentage share to total population
of IndiaRank in
20012011 2001
1Uttar Pradesh
199,581,477 16.49 16.17 1
2 Maharashtra 112,372,972 9.29 9.42 2
6Madhya Pradesh
72,597,565 6.00 6.05 7
8 Rajasthan 68,621,012 5.67 5.50 8
10 Gujarat 60,383,628 4.99 4.93 10
16 Chhattisgarh 25,540,196 2.11 2.03 17

Census of India 2011Census of India 2011Press Conference, 4th April, 2011Press Conference, 4th April, 2011 Our Census, Our Future
Growth Rate

Census of India 2011Census of India 2011Press Conference, 4th April, 2011Press Conference, 4th April, 2011 Our Census, Our Future
DECADAL GROWTH OF POPULATION In 2011 Census, India registered 17.64% and Madhya Pradesh registered 20.30% decadal growth rate over 2001 Census.
Growth rate in the state is higher by 2.66 percent points compared to Country.
On comparison of Growth rate(GR) during last 10 decades in the state: Slow pace of growth rate during the first half of 1901-1951. Steady growth rate of population during the decade 1951-71. Declining trend in population GR started from 1971 Census
onwards Growth rate of India and Madhya Pradesh is presented in the
Chart

Census of India 2011Census of India 2011Press Conference, 4th April, 2011Press Conference, 4th April, 2011 Our Census, Our Future
Decadal Growth Rate: 1901-11 to 2001-115.7
5
24.8
21.6
4
13.3
1
11 17.6
4
-0.3
1
24.6
6
23.8
6
21.5
4
14.2
2
12.3
8
8.3
8
10.2
1
20.3
-2.4
24.7
3
27.1
6
29.2
8
27.2
4
24.2
6
12.0
6
-5
0
5
10
15
20
25
30
35
19
01
-11
19
11-2
1
19
21
-31
19
31
-41
19
41
-51
19
51
-61
19
61
-71
19
71
-81
19
81
-91
19
91
-01
20
01
-11
Decadal Years
Gro
wth
Rate
India Madhya Pradesh

Census of India 2011Census of India 2011Press Conference, 4th April, 2011Press Conference, 4th April, 2011 Our Census, Our Future

Census of India 2011Census of India 2011Press Conference, 4th April, 2011Press Conference, 4th April, 2011 Our Census, Our Future
Top Five States/UTs
State/UT Growth Rate
Meghalaya 27.82
Arunachal Pradesh 25.92
Bihar 25.07
Jammu & Kashmir 23.71
Mizoram 22.78
Bottom Five States/UTs
State/UT Growth Rate
Nagaland -0.47
Kerala 4.86
Andman &Nicobar Islands 6.68
Lakshadweep 6.23
Goa 8.17
Top five and bottom five States/UTs by Growth Rate

Census of India 2011Census of India 2011Press Conference, 4th April, 2011Press Conference, 4th April, 2011 Our Census, Our Future
Top Five Districts
Districts Growth Rate
Indore 32.7
Jhabua 30.6
Bhopal 28.5
Singrauli 28.0
Barwani 27.6
Bottom Five Districts
Districts Growth Rate
Anuppur 12.3
Betul 12.9
Chhindwara 13.0
Mandsaur 13.2
Balaghat 13.6
Top five and bottom districts by Growth Rate

Census of India 2011Census of India 2011Press Conference, 4th April, 2011Press Conference, 4th April, 2011 Our Census, Our Future
Distribution of Districts by range of Percentage Decadal Growth : 1991-2001 and 2001-2011
Percentage Decadal Growth
Number of Districts
1991-2001
Percentage to total Population
2001
Number of Districts
2001-2011
Percentage to total Population
2011
<12 1 1.6 0 0
12-15 2 4.5 9 18.0115-18 3 7.1 6 12.75
18-21 7 11.1 15 28.321-24 11 18.3 11 19.82
24-27 11 25.1 4 8.4
27-30 10 23.4 3 6.79
30+ 5 8.8 2 5.92

Census of India 2011Census of India 2011Press Conference, 4th April, 2011Press Conference, 4th April, 2011 Our Census, Our Future
Distribution of Districts by range of average annual exponential growth : 1991-2001 and 2001-2011
Average annual
exponential growth rate
Number of Districts 1991-2001
Percentage to total population
Number of Districts 2001-2011
Percentage to total population
<1.0 1 2.48 0 0.00
1.0-1.4 2 2.44 10 20.75
1.5-1.9 15 27.44 24 44.68
2.0-2.4 25 53.11 13 25.39
2.5-2.9 5 9.94 3 9.18
3.0+ 2 4.58 0 0.00
<1.0 1 2.48 0
1.0-1.4 2 2.44 10 20.75

Census of India 2011Census of India 2011Press Conference, 4th April, 2011Press Conference, 4th April, 2011 Our Census, Our Future
Division-wise Decadal Growth Rate 1991-01 & 2001-11
State/Division 1991-2001 2001-2011
Madhya Pradesh 24.3 20.3
Chambal 22.2 21.7Gwalior 26.3 23.5Sagar 24.5 18.5Rewa 29.2 21.5Shahdol 18.5 18.4Ujjain 24.4 16.8Indore 27.4 26.3Bhopal 29.5 23.0Narmadapuram 20.6 14.7Jabalpur 17.6 15.5
Highest growth rate during 1991-2001 was observed in Bhopal Division while in 2001-2011 it is observed in Indore Division.
Lowest growth rate during 1991-2001 was in Jabalpur Division while in 2001-2011 is in Narmadapuram Division.
Highest fall in the growth rate observed in Rewa Division (7.70 points) followed by Ujjain Division (7.60 points).
The lowest fall in the growth rate observed in Shahdol Division (0.10 points) followed by Chambal Division (0.50 points)

Census of India 2011Census of India 2011Press Conference, 4th April, 2011Press Conference, 4th April, 2011 Our Census, Our Future
-20.00
-15.00
-10.00
-5.00
0.00
5.00
10.00
15.00
20.00
25.00
30.00
35.00
1901-1
1
1911-2
1
1921-3
1
1931-4
1
1941-5
1
1951-6
1
1961-7
1
1971-8
1
1981-9
1
1991-0
1
2001-1
1
Gro
wth
Rate
Decadal Year
Divisional Decadal Growth Rate:1901-2011
Madhya Pradesh Chambal Gwalior Sagar Rewa Shahdol Jabalpur

Census of India 2011Census of India 2011Press Conference, 4th April, 2011Press Conference, 4th April, 2011 Our Census, Our Future
Divisional Decadal Growth Rate:1901-2011
-30.00
-20.00
-10.00
0.00
10.00
20.00
30.00
40.00
1901-1
1
1911-2
1
1921-3
1
1931-4
1
1941-5
1
1951-6
1
1961-7
1
1971-8
1
1981-9
1
1991-0
1
2001-1
1
Decadal Year
Gro
wth
Rate
Madhya Pradesh Ujjain Indore Bhopal Narmadapuram

Census of India 2011Census of India 2011Press Conference, 4th April, 2011Press Conference, 4th April, 2011 Our Census, Our Future

Census of India 2011Census of India 2011Press Conference, 4th April, 2011Press Conference, 4th April, 2011 Our Census, Our Future
DENSITY OF POPULATION

Census of India 2011Census of India 2011Press Conference, 4th April, 2011Press Conference, 4th April, 2011 Our Census, Our Future
Geographical Area :
Area of the country is 3,287,263 sq. km
Madhya Pradesh is second in terms of its geographical spread (308,244 sq. km.)
It shares 9.38% of the country's total area
Rajasthan State stands first in the country in terms of geographical area (342,239 sq. km)
Maharashtra is the third largest State (307,713 sq. km)
No change in the area of the state during decade 2001-11
In Madhya Pradesh Districts has gone up from 45 in 2001 to 50 in Census 2011

Census of India 2011Census of India 2011Press Conference, 4th April, 2011Press Conference, 4th April, 2011 Our Census, Our Future
Population Density 1901-2011: India and Madhya Pradesh
Country / State
1901 1911 1921 1931 1941 1951 1961 1971 1981 1991 2001 2011
India 73 77 76 85 97 110 134 167 208 267 324 382
Madhya Pradesh
41 46 45 50 56 60 75 97 124 158 196 236
Population Density :
Population Density is expressed in terms of total number of persons per sq. km. The population density of the country is 382 in 2011 Census as compared to 324 in 2001 Census
an increase of 58 points. In Madhya Pradesh, the population density is 236 in 2011 Census as compared to 196 in 2001 Census, an increase of 40 points. The Population Density is 18 points more in India compared to Madhya Pradesh. Density during 10 decades are as follows :

Census of India 2011Census of India 2011Press Conference, 4th April, 2011Press Conference, 4th April, 2011 Our Census, Our Future
Top Five States/UTs
State/UT Density
Delhi 11,297
Bihar 1,102
West Bengal 1,029
Chandigarh 9,252
Puducherry 2,598
Top five and bottom five States/UTs by Population Density : 2011

Census of India 2011Census of India 2011Press Conference, 4th April, 2011Press Conference, 4th April, 2011 Our Census, Our Future

Census of India 2011Census of India 2011Press Conference, 4th April, 2011Press Conference, 4th April, 2011 Our Census, Our Future
Top Five Districts
District Density
Bhopal 854
Indore 839
Jabalpur 472
Gwalior 445
Morena 394
Bottom Five Districts
District Density
Raisen 157
Betul 157
Panna 142
Sheopur 104
Dindori 94
Top five and bottom five districts by Population Density : 2011

Census of India 2011Census of India 2011Press Conference, 4th April, 2011Press Conference, 4th April, 2011 Our Census, Our Future

Census of India 2011Census of India 2011Press Conference, 4th April, 2011Press Conference, 4th April, 2011 Our Census, Our Future
Child Population ( 0-6 years)
Child Population ( 0-6 years)

Census of India 2011Census of India 2011Press Conference, 4th April, 2011Press Conference, 4th April, 2011 Our Census, Our Future
Child Population( 0-6 years) analysis :Proportion of Child population in the age group 0-6 by sex: 2001 and 2011The change in the proportion of male and female child population (0-6) at the count of 2001 and 2011 Census influences the sex ratio of child population.
During the decade 2001 and 2011, it is observed that it was adverse towards female child.
In Madhya Pradesh, the total number of children in the age-group 0-6 yearsIn Census 2011 2001 Census
Persons - 1,05,48,295 1,07,82,214Males- 55,16,957 55,79,847Females - 50, 31,338 52,02,367The proportion of child population (0-6 years) to total population comes out to 14.5 percentage for persons 14.7 percentage for males 14.4 percentage for femalesThere is a net decline of 2,33,919 child population in the decade 2001-2011.

Census of India 2011Census of India 2011Press Conference, 4th April, 2011Press Conference, 4th April, 2011 Our Census, Our Future
District level analysis :
Considering the literacy rate by sex, Indore district has the highest male literacy rate (82.2%) Bhopal district has the highest female literacy rate (76.6%). Alirajpur district has the lowest male literacy rate (43.6%) as well as female literacy rate (31.0%).
Population aged seven years and above and the absolute number of literates in 2001, and their absolute decadal and percentage difference between
2001and 2011.The percentage decadal increase in population aged seven years and above during 2001-2011 is 25.19 Corresponding increase in the number of literates is 38.73.

Census of India 2011Census of India 2011Press Conference, 4th April, 2011Press Conference, 4th April, 2011 Our Census, Our Future
Proportion of Child population (0-6 years) : 2001-2011India and Madhya Pradesh
India/State 2001 2011
Males Females Males Females
India 15.97 15.88 13.30 12.93
Madhya Pradesh 17.7 18.0 14.7 14.4

Census of India 2011Census of India 2011Press Conference, 4th April, 2011Press Conference, 4th April, 2011 Our Census, Our Future
India & Madhya Pradesh 0-6 years male and female percentage,2001-2011
15.88
12.93
18.0
14.413.30
15.9714.7
17.7
10111213141516171819
Males Females Males Females
2001 2011
Per
cen
tag
e
India Madhya Pradesh

Census of India 2011Census of India 2011Press Conference, 4th April, 2011Press Conference, 4th April, 2011 Our Census, Our Future
Madhya Pradesh
child 0-6 17.87%
others 82.13%
child 0-6 Others
Madhya Pradesh
others 85.47%
child 0-6 14.53%
child 0-6 Others
India
others 84.07%
child 0-6 15.93%
India Others
India
others 86.88%
child 0-6 13.12%
India Others
Share of children in the age group 0-6 years to total population, India and Madhya Pradesh: 2001-20112001 2011

Census of India 2011Census of India 2011Press Conference, 4th April, 2011Press Conference, 4th April, 2011 Our Census, Our Future
Proportion of children's 0-6 age group to the total population
In Madhya Pradesh
It declined sharply from 17.87 percent in 2001 to 14.53 percent in 2011. A decline of 3.34 percentage point
In India :
It decline from 15.93 percent in 2001 to 13.12 percentage in 2011. A decline of 2.01 percentage point.

Census of India 2011Census of India 2011Press Conference, 4th April, 2011Press Conference, 4th April, 2011 Our Census, Our Future
Top Three States/UTs
State/UT Child population
(0-6)
Uttar Pradesh 2,97,28,235
Bihar 1,85,82,229
Maharashtra 1,28,48,375
There are only three states having 0-6 child population more than Madhya Pradesh.
Bottom Five States/UTs
State/UT Child population
(0-6)
Lakshdweep 7,088
Daman & Diu 25,880
Andaman & Nicobar
Islands
39,497
Dadra & Nagar Havelli 49,196
Sikkim 61,077
Top three and bottom five States/UTs by Child population (0-6 years) -2011

Census of India 2011Census of India 2011Press Conference, 4th April, 2011Press Conference, 4th April, 2011 Our Census, Our Future
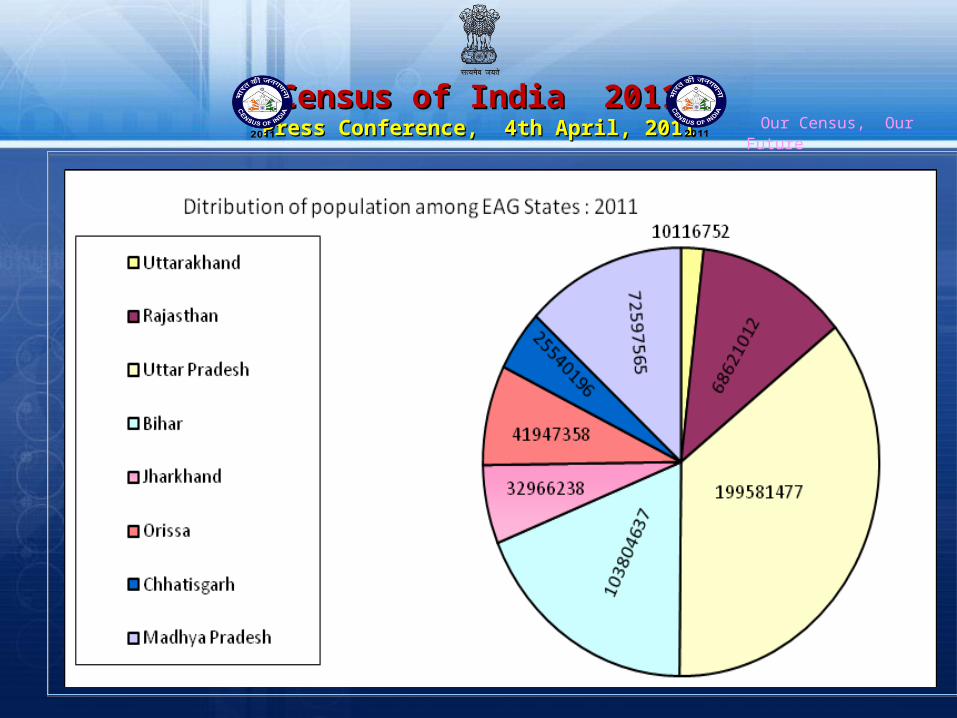
Proportion of child population (0-6 years) to total population :India and EAG states
India/EAG StateAbsolute Figures Percentage
Persons Males Females Persons Males Females
India 15,87,89,287 82,952,135 75837,152 100 100 100
Uttar Pradesh 2,97,28,235 1,56,53,175 1,40,75,060 18.72 18.87 18.56
Uttarakhand 13,28,844 7,04,769 6,24,075 0.84 0.85 0.82
Rajasthan 1,05,04,916 55,80,212 49,24,704 6.62 6.73 6.49
Orissa 50,35,650 26,03,208 24,32,442 3.17 3.14 3.21
Madhya Pradesh 1,05,48,295 55,16,957 50,31,338 6.64 6.65 6.63
Chhattisgarh 35,84,028 18,24,987 17,59,041 2.26 2.20 2.32
Bihar 1,85,82,229 96,15,280 89,66,949 11.70 11.59 11.82
Jharkhand 52,37,582 26,95,921 25,41,661 3.30 3.25 3.35
Total of EAG States 84549779 44194509 40355270 53.25 53.28 53.21

Census of India 2011Census of India 2011Press Conference, 4th April, 2011Press Conference, 4th April, 2011 Our Census, Our Future
Share of child population (0-6 years) -Madhya Pradesh and other Empowered Action Group states: 2001-2011
State & Other EAG states
2001 2011
Madhya Pradesh 17.87 14.53
Uttar Pradesh 19.03 14.9
Uttarakhand 16.02 13.14
Rajasthan 18.85 15.31
Orissa 14.56 12
Chhattisgarh 17.06 14.03
Bihar 20.25 17.9
Jharkhand 18.4 15.89
17.8719.03
16.02
18.85
14.5617.06
20.2518.4
15.8917.9
14.0312
15.31
13.1414.914.53
0
5
10
15
20
25
Madh
yaPr
ades
h
Uttar
Prad
esh
Uttar
akha
nd
Rajas
than
Oriss
a
Chha
ttisga
rh
Bihar
Jhark
hand
Madhya Pradesh & other EAG states
Perce
ntag
e
2001 2011

Census of India 2011Census of India 2011Press Conference, 4th April, 2011Press Conference, 4th April, 2011 Our Census, Our Future
Proportion of child population (0-6 years) to total population :Madhya Pradesh and neighbouring States, 2011
StateAbsolute Figures Percentage
Persons Males Females Persons Males Females
Madhya Pradesh
1,05,48,295 55,16,957 50,31,338 14.53 14.67 14.38
Uttar Pradesh 2,97,28,235 1,56,53,175 1,40,,75,060 14.90 14.97 14.82
Maharashtra 1,28,48,375 68,22,262 60,26,113 11.43 11.69 11.16
Rajasthan 1,05,04,916 55,80,212 49,24,704 15.31 15.67 14.92
Gujarat 74,94,176 39,74,286 35,19,890 12.41 12.62 12.18
Chhattisgarh 35,84,028 18,24,987 17,59,041 14.03 14.23 13.84

Census of India 2011Census of India 2011Press Conference, 4th April, 2011Press Conference, 4th April, 2011 Our Census, Our Future
Division wise proportion of child population (0-6 years) : 2001 and 2011
State/Division 2001 2011
Madhya Pradesh 17.87 14.53Chambal 18.59 15.07
Gwalior 18.11 14.81
Sagar 18.91 15.29
Rewa 19.35 15.30
Shahdol 17.33 14.64
Ujjain 17.10 13.73
Indore 18.80 15.85
Bhopal 17.96 14.33
Narmadapuram 16.85 13.31
Jabalpur 15.88 12.74

Census of India 2011Census of India 2011Press Conference, 4th April, 2011Press Conference, 4th April, 2011 Our Census, Our Future
Top Five Districts
District Proportion of child population
Jhabua 20.3
Alirajpur 19.8
Barwani 18.8
Singrauli 17.3
Sheopur 16.8
Bottom Five Districts
District Proportion of child population
Jabalpur 11.7
Balaghat 12.2
Bhopal 12.4
Indore 12.5
Gwalior 12.5
Top five and bottom five districts by Child population (0-6 years) : 2011

Census of India 2011Census of India 2011Press Conference, 4th April, 2011Press Conference, 4th April, 2011 Our Census, Our Future
Districts by range in proportion of children in the age group 0-6 year to total population : 2001-2011
Range Number districts
Percentage to total population, 2001
Number districts
Percentage to total population, 2011
9.00-11.99 0 0.0 1 3.4
12.00-13.99 0 0.0 0 32.4
14.00-15.99 5 15.9 40 50.6
16..00-17.99 17 31.2 6 9.4
18.00 and above 28 52.9 3 4.3

Census of India 2011Census of India 2011Press Conference, 4th April, 2011Press Conference, 4th April, 2011 Our Census, Our Future
Gender Composition - Sex Ratio
Gender Composition - Sex Ratio

Census of India 2011Census of India 2011Press Conference, 4th April, 2011Press Conference, 4th April, 2011 Our Census, Our Future
Sex Ratio :Population enumeration by sex composition is one of the basic demographic characteristics, and provides meaningful demographic analysis.
Changes in sex composition largely reflect the underlying socio economic and cultural patterns of the society in different ways.
Definition :
Sex ratio is defined as the number of females per 1000 males in the population .
It is an important social indicator to measure the extent of prevailing equity between males and females in a society at a given point of time. According to experts sex differential in mortality, Sex selective out- migration, differential Sex ratio at birth are the major reasons for changes in Sex ratio.

Census of India 2011Census of India 2011Press Conference, 4th April, 2011Press Conference, 4th April, 2011 Our Census, Our Future
Census 2001
Census 2011 ( Provisional)
Population Proportion ( in %)
Population Proportion ( in %)
India
Males 53,22,23,090 51.5 62,37,24,248 51.5
Females 49,65,14,346 48.5 58,64,69,174 48.5
Sex Ratio 933 940
Madhya Pradesh
Males 3,14,43,652 52.1 3,76,12,920 51.8
Females 2,89,04,371 47.9 3,49,84,645 48.2
Sex Ratio 919 930
Gender Composition of Population; India and Madhya Pradesh : 2001 and 2011

Census of India 2011Census of India 2011Press Conference, 4th April, 2011Press Conference, 4th April, 2011 Our Census, Our Future
India:
Overall Sex ratio at the National level has increased by 7 points since Census 2001 to reach 940 at Census 2011
This is the highest Sex Ratio recorded since Census 1971 and a shade lower than 1961
Increase in Sex Ratio is observed in 29 States/UTs
Madhya Pradesh:
Sex ratio at the State level has increased by 11 points since Census 2001 to reach 930 at Census 2011
This is the highest Sex Ratio recorded since Census 1971 and a shade lower than 1961
Increase in Sex Ratio is observed in 29 Districts

Census of India 2011Census of India 2011Press Conference, 4th April, 2011Press Conference, 4th April, 2011 Our Census, Our Future
The sex ratio of a few countries is presented in the statement to understand the trend prevailing in various parts of the world.
The sex ratio of India is slightly better as compared to China, the most populated country.
However, the sex ratios in Europian, African and American countries are comparatively better than India.
A Comparison: India and Other Countries
Country Sex ratio
World 984Russian Federation 1165
France 1056
Japan 1054
Germany 1038
United Kingdom 1037
Brazil 1031
South Africa 1028
United States of America 1026
Republic of Korea 1020Australia 1011
Ethiopia 1010
Indonesia 1003
Nigeria 995
Malaysia 970
Iran 968
India* 940
China 927
Saudi Arab 828* India as per provisional figures of Census 2011 (Source: World Population Prospects (mid year estimates), 2010 revision, Sex and age United Nation)

Census of India 2011Census of India 2011Press Conference, 4th April, 2011Press Conference, 4th April, 2011 Our Census, Our Future
India & neighbouring countries:
The sex ratio of Sri Lanka, Nepal & Myanmar is better compared to India. whereas the sex ratio of Afghanistan & Bhutan is lower than India
A Comparison: India and Other neighbouring Countries
Neighbouring Country
Sex ratio
Myanmar 1048Srilanka 1032Nepal 1014Bangladesh 978Pakistan 942India* 940Afghanistan 931Bhutan 897
* India as per provisional figures of Census 2011 (Source: World Population Prospects (mid year estimates), 2010 revision, Sex and age United Nation)

Census of India 2011Census of India 2011Press Conference, 4th April, 2011Press Conference, 4th April, 2011 Our Census, Our Future
Top Five States/UTs
State/UT Sex ratio
Kerela 1,084
Puducherry 1,038
Tamil Nadu 995
Andhra Pradesh 992
Chhattisgarh 991
Bottom Five States/UTs
State/UT Sex ratio
Daman & Diu 618
Dadra & Nagar Haveli 775
Chandigarh 818
NCT of Delhi 866
Andaman & Nicobar 878
Top five and bottom five States/UTs by Sex Ratio : 2011
* Sex Ratio is defined as the Number of females per 1000 males

Census of India 2011Census of India 2011Press Conference, 4th April, 2011Press Conference, 4th April, 2011 Our Census, Our Future
Sex Ratio 1901-2011: India and Madhya PradeshCountry / State
1901
1911 1921 1931 1941 1951 1961 1971 1981 1991 2001 2011
India 972 964 955 950 945 946 941 930 934 927 933 940
Madhya Pradesh 972 967 949 947 946 945 932 920 921 912 919 930
Sex ratio : India & Madhya Pradesh
The sex ratio of India & Madhya Pradesh during last 10 decades is presented below. It is continuously declined until 1971 and thereafter a slighly increasing trend is reflected in subsequent censuses except in 1991 Census.

Census of India 2011Census of India 2011Press Conference, 4th April, 2011Press Conference, 4th April, 2011 Our Census, Our Future
Madhya Pradesh and other EAG (Empowered Action Group) States :
In the 8 EAG states,
Highest sex ratio 991 recorded in Chhattisgarh
Lowest sex ratio 908 recorded in Uttar Pradesh
Madhya Pradesh is fourth lowest among these states
A Comparison: Madhya Pradesh and other EAG (Empowered Action Group) States , Census 2011
EAG states Sex ratioChhattisgarh 991Orissa 978Uttarakhand 963Jharkhand 947Madhya Pradesh 930Rajasthan 926Bihar 916Uttar Pradesh 908
* Sex Ratio is defined as the Number of females per 1000 males

Census of India 2011Census of India 2011Press Conference, 4th April, 2011Press Conference, 4th April, 2011 Our Census, Our Future

Census of India 2011Census of India 2011Press Conference, 4th April, 2011Press Conference, 4th April, 2011 Our Census, Our Future
District wise Sex Ratio analysis :Looking at the trend of sex ratio more than 1000 at the district level,
17 districts had reported sex ratio more than 1000 in 1911. then,
10 in 1921
7 in 1931
5 in 1941
3 in 1951
4 in 1961
1 in 1971
2 in 1981
1 in 1991 & 2001
4 in 2011. These districts are Balaghat (1021), followed by Alirajpur (1009), Mandla (1005), Dindori (1004).

Census of India 2011Census of India 2011Press Conference, 4th April, 2011Press Conference, 4th April, 2011 Our Census, Our Future
Top Five Districts
District Sex Ratio
Balaghat 1,021
Alirajpur 1,009
Mandla 1,005
Dindori 1,004
Jhabua 989
Bottom Five Districts
District Sex Ratio
Bhind 838
Morena 839
Gwalior 862
Datia 875
Shivpuri 877
Top five and bottom five districts by Sex Ratio : 2011
* Sex Ratio is defined as the Number of females per 1000 males

Census of India 2011Census of India 2011Press Conference, 4th April, 2011Press Conference, 4th April, 2011 Our Census, Our Future
Sex Ratio :
23 districts reporting sex ratio less than the state are, Satna, Jabalpur, Indore, Sehore, Narsimhapur, Singrauli, Damoh,
Hoshangabad, Bhopal, Guna, Panna, Sheopur, Tikamgarh, Ashoknagar, Raisen, Vidisha, Sagar, Chhatarpur, Shivpuri, Datia, Gwalior, Morena and Bhind.
26 districts reporting higher sex ratio than state are, Balaghat, Alirajpur, Mandla, Dindori, Jhabua, Seoni, Barwani, Anuppur, Ratlam, Betul, Shahdol Mandsaur, Chhindwara, West Nimar, Dhar, Neemuch, Rajgarh, Ujjain, Umaria, Sidhi, Burhanpur, Katni, East Nimar, Dewas, Shajapur and Harda.
1 district Rewa is reporting sex ratio 930 at par with the state in 2011.

Census of India 2011Census of India 2011Press Conference, 4th April, 2011Press Conference, 4th April, 2011 Our Census, Our Future
Distribution of Districts by range of sex ratio Madhya Pradesh: 2001 and 2011
Sex ratio 2001Percentage to total
population, 2001 (All age)
2011Percentage to total
population, 2011 (All age)
880 & below
8 16.74 5 11.31
881-915 13 28.85 12 23.47
916-950 15 28.6 12 27.76
951-985 10 19.88 16 30.28
986 & above
4 5.94 5 7.18

Census of India 2011Census of India 2011Press Conference, 4th April, 2011Press Conference, 4th April, 2011 Our Census, Our Future
Distribution of Districts by sex ratio below & above the state level : 2001 and 2011
Sex ratioNumber
of Districts
Percentage to total population
2001 (All age)
Number of Districts
Percentage to total population
2011 (All age)
Below state average
22 46.37 24 53.94
Above state average
28 53.63 26 46.06
Number of districts below the state average has increased from 22 in 2001 to 24 in 2011.
The remaining districts are above the state average. The districts above state average, which are 26 in
numbers, constitute 46.06 percent population

Census of India 2011Census of India 2011Press Conference, 4th April, 2011Press Conference, 4th April, 2011 Our Census, Our Future

Census of India 2011Census of India 2011Press Conference, 4th April, 2011Press Conference, 4th April, 2011 Our Census, Our Future
Gender Composition - Sex Ratio (0-6 years)Gender Composition
- Sex Ratio (0-6 years)

Census of India 2011Census of India 2011Press Conference, 4th April, 2011Press Conference, 4th April, 2011 Our Census, Our Future
Child Sex Ratio (0 - 6 years)The child sex ratio (0-6 years) at country level , 945 in 1991, 927 in 2001914 in Census 2011. In Madhya Pradesh child sex ratio (0-6 years), 941 in 1991 932 in 2001 912 in 2011
The child sex ratio (0-6 years) at country level and in Madhya Pradesh has declined by 13 points and 20 points respectively during the decade 2001-2011, 7 points more decline compared to India

Census of India 2011Census of India 2011Press Conference, 4th April, 2011Press Conference, 4th April, 2011 Our Census, Our Future

Census of India 2011Census of India 2011Press Conference, 4th April, 2011Press Conference, 4th April, 2011 Our Census, Our Future
Census of India 2011Census of India 2011Press Conference, 4th April, 2011Press Conference, 4th April, 2011 Our Census, Our Future
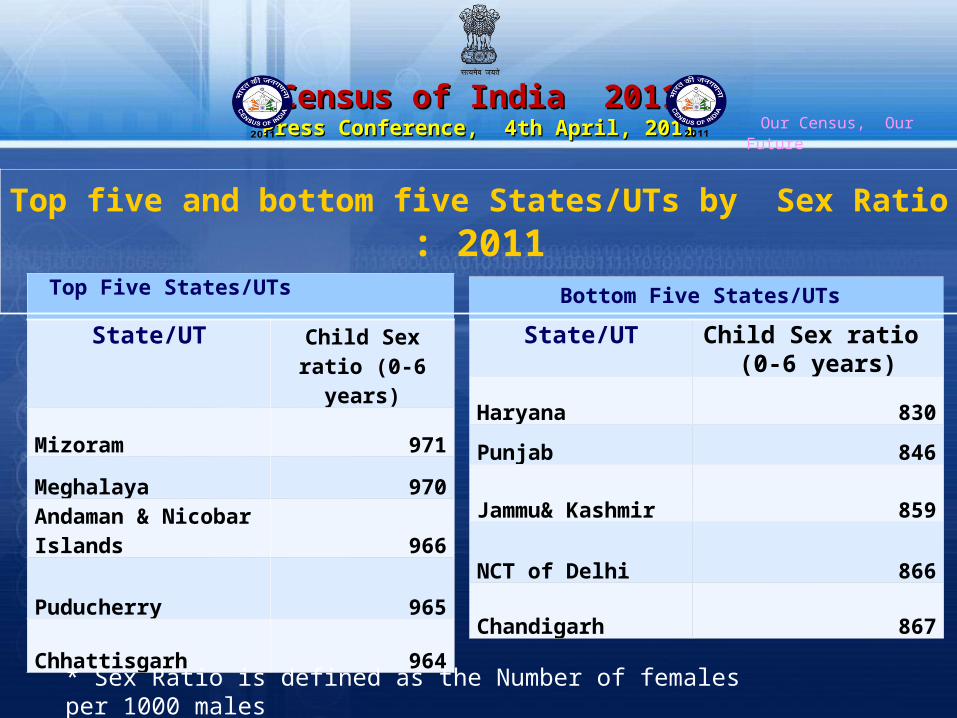
Top Five States/UTs
State/UT Child Sex ratio (0-6 years)
Mizoram 971
Meghalaya 970Andaman & Nicobar Islands 966
Puducherry 965
Chhattisgarh 964
Bottom Five States/UTs
State/UT Child Sex ratio (0-6 years)
Haryana 830
Punjab 846
Jammu& Kashmir 859
NCT of Delhi 866
Chandigarh 867
Top five and bottom five States/UTs by Sex Ratio : 2011
* Sex Ratio is defined as the Number of females per 1000 males

Census of India 2011Census of India 2011Press Conference, 4th April, 2011Press Conference, 4th April, 2011 Our Census, Our Future

Census of India 2011Census of India 2011Press Conference, 4th April, 2011Press Conference, 4th April, 2011 Our Census, Our Future
Top Five Districts
District Child Sex Ratio (0-6 years)
Alirajpur971
Dindori970
Mandla 965
Balaghat961
Seoni 954
Bottom Five Districts
District Child Sex Ratio (0-6 years)
Morena 825
Gwalior 832
Bhind 835
Datia 852
Rewa 883
Top five and bottom five districts by Child Sex Ratio (0-6 years) : 2011
* Sex Ratio is defined as the Number of females per 1000 males

Census of India 2011Census of India 2011Press Conference, 4th April, 2011Press Conference, 4th April, 2011 Our Census, Our Future
Distribution of Districts by range of Child Sex Ratio Madhya Pradesh: 2001 and 2011
Sex ratioNumber
of Districts
Percentage to total population 2001
(0-6 years)
Number of Districts
Percentage to total population 2011
(0-6 years)
880 & below 4 8.57 4 8.57
881-915 2 5.98 17 37.34
916-950 27 55.78 24 46.71
951-985 16 28.77 5 7.38
986 & above 1 0.9 0 0

Census of India 2011Census of India 2011Press Conference, 4th April, 2011Press Conference, 4th April, 2011 Our Census, Our Future

Census of India 2011Census of India 2011Press Conference, 4th April, 2011Press Conference, 4th April, 2011 Our Census, Our Future

Census of India 2011Census of India 2011Press Conference, 4th April, 2011Press Conference, 4th April, 2011 Our Census, Our Future
Division wise sex ratio of total population: 1971 – 2011
State / Division
Sex Ratio
1971 1981 1991 2001 2011
Madhya Pradesh 920 921 912 919 930
Chambal 836 831 821 836 848
Gwalior 863 859 851 863 881
Sagar 896 892 880 886 898
Rewa 962 952 924 933 930
Shahdol 966 960 950 962 974
Ujjain 927 935 933 942 955
Indore 936 944 941 946 956
Bhopal 887 899 893 898 916
Narmadapuram 945 938 931 932 942
Jabalpur 957 957 950 954 964
Highest growth rate during 1991-2001 was observed in Bhopal Division while in 2001-2011 it is observed in Indore Division. Lowest growth rate during 1991-2001 was in Jabalpur Division while in 2001-2011 is in Narmadapuram Division. Highest fall in the growth rate observed in Rewa Division (7.70 points) followed by Ujjain Division (7.60 points). The lowest fall in the growth rate observed in Shahdol Division (0.10 points) followed by Chambal Division (0.50 points)

Census of India 2011Census of India 2011Press Conference, 4th April, 2011Press Conference, 4th April, 2011 Our Census, Our Future
-20.00
-15.00
-10.00
-5.00
0.00
5.00
10.00
15.00
20.00
25.00
30.00
35.00
1901-1
1
1911-2
1
1921-3
1
1931-4
1
1941-5
1
1951-6
1
1961-7
1
1971-8
1
1981-9
1
1991-0
1
2001-1
1
Gro
wth
Rate
Decadal Year
Divisional Decadal Growth Rate:1901-2011
Madhya Pradesh Chambal Gwalior Sagar Rewa Shahdol Jabalpur

Census of India 2011Census of India 2011Press Conference, 4th April, 2011Press Conference, 4th April, 2011 Our Census, Our Future

Census of India 2011Census of India 2011Press Conference, 4th April, 2011Press Conference, 4th April, 2011 Our Census, Our Future
Division wise sex ratio of total population: 1971 – 2011
State / Division
Sex Ratio
1991 2001 2011
Madhya Pradesh 941 932 912
Chambal 867 850 840
Gwalior 910 896 875
Sagar 929 926 909
Rewa 950 937 902
Shahdol 980 973 951
Ujjain 943 940 918
Indore 963 947 923
Bhopal 931 933 917
Narmadapuram 956 946 930
Jabalpur 962 954 939
Highest growth rate during 1991-2001 was observed in Bhopal Division while in 2001-2011 it is observed in Indore Division. Lowest growth rate during 1991-2001 was in Jabalpur Division while in 2001-2011 is in Narmadapuram Division. Highest fall in the growth rate observed in Rewa Division (7.70 points) followed by Ujjain Division (7.60 points). The lowest fall in the growth rate observed in Shahdol Division (0.10 points) followed by Chambal Division (0.50 points)

Census of India 2011Census of India 2011Press Conference, 4th April, 2011Press Conference, 4th April, 2011 Our Census, Our Future

Census of India 2011Census of India 2011Press Conference, 4th April, 2011Press Conference, 4th April, 2011 Our Census, Our Future
Literacy RateLiteracy Rate

Census of India 2011Census of India 2011Press Conference, 4th April, 2011Press Conference, 4th April, 2011 Our Census, Our Future
Literacy status: India- Census 2011,Total population - 1,21,01,93,422
Literates persons - 77,84,54,120Literates Males - 44,42,03,762Literates Females - 33,42,50,358
Literacy RateLiterates Rate Persons - 74.0Literates Rate Males - 82.1Literates Rate Females - 65.5
Literacy status: India- Census 2011,Total population - 1,21,01,93,422
Literates persons - 77,84,54,120Literates Males - 44,42,03,762Literates Females - 33,42,50,358
Literacy RateLiterates Rate Persons - 74.0Literates Rate Males - 82.1Literates Rate Females - 65.5

Census of India 2011Census of India 2011Press Conference, 4th April, 2011Press Conference, 4th April, 2011 Our Census, Our Future
Literacy Rate by Sex: India 1981-2011Year Literacy Rate
Person Male Female
1981 43.57 56.38 29.76
1991 52.21 64.13 39.29
2001 65.4 75.9 54.2
2011 74.0 82.1 65.5
Note: The Literacy rate for 1981 is Crude Literacy Rate whereas, 1991 onwards Effective Literacy Rate has been given.

Census of India 2011Census of India 2011Press Conference, 4th April, 2011Press Conference, 4th April, 2011 Our Census, Our Future
Five Top States/Union Territories by Literacy Rate : 2011
Name of State /
UT
Literacy
Rate
Person
Name of
State / UT
Literacy
Rate Male
Name of
State / UT
Literacy
Rate
Female
INDIA 74.0 INDIA 82.1 INDIA 65.5
Kerala 93.9 Lakshadweep 96.1 Kerala 92.0
Lakshadweep 92.3 Kerala 96.0 Mizoram 89.4
Mizoram 91.6 Mizoram 93.7 Lakshadweep 88.2
Tripura 87.8 Goa 92.8 Tripura 83.1
Goa87.4
Tripura92.2
Andaman &
Nicobar Islands
81.8

Census of India 2011Census of India 2011Press Conference, 4th April, 2011Press Conference, 4th April, 2011 Our Census, Our Future
Five Bottom States/Union Territories by Literacy Rate : 2011
Name of State /
UT
Literacy
Rate
Person
Name of
State / UT
Literacy
Rate Male
Name of
State / UT
Literacy
Rate
Female
INDIA 74.0 INDIA 82.1 INDIA 65.5
Bihar 63.8 Bihar 73.4 Rajasthan 52.7
Arunachal
Pradesh 67.0
Arunachal
Pradesh 73.7 Bihar 53.3
Rajasthan 67.1Andhra Pradesh
75.6 Jharkhand 56.2
Jharkhand 67.6 Meghalaya 77.2
Jammu &
Kashmir 58.0
Andhra Pradesh67.7
Jammu & Kashmir78.3
Uttar Pradesh59.3

Census of India 2011Census of India 2011Press Conference, 4th April, 2011Press Conference, 4th April, 2011 Our Census, Our Future
Literacy status: Madhya Pradesh- Census 2011Total population - 7,25,97,565Literates persons - 4,38,27,193Literates Males - 2,58,48,137Literates Females - 1,79,79,056
Literacy Rate - Census 2011 and Census 2001 2011 2001 Increase
Literates Rate Persons - 70.6 63.7 6.9Literates Rate Males - 80.5 76.1 4.4Literates Rate Females - 60.0 50.3 9.7
In Census 2001, Madhya Pradesh stood 25th in the country in literacy whereasIn 2011 it has got 28th position. In female literacy rate also, Madhya Pradesh is on 28th position.

Census of India 2011Census of India 2011Press Conference, 4th April, 2011Press Conference, 4th April, 2011 Our Census, Our Future
Decadal variation in Literacy rate: Madhya Pradesh 1981-2011
Year Literacy RatePerson Male Female
1981 28.3 39.7 16.0
1991 44.7 58.6 29.4
2001 63.7 76.1 50.3
2011 70.6 80.5 60.0
Note: The Literacy rate for 1981 is Crude Literacy Rate whereas, 1991 onwards Effective Literacy Rate has been given.

Census of India 2011Census of India 2011Press Conference, 4th April, 2011Press Conference, 4th April, 2011 Our Census, Our Future
Number of literates and illiterates among population aged 7 years and above and their change : 2001
and 2011
Literates/Illiterates Persons Males Females
Literate
2001 3,15,92,563
1,96,72,274
1,19,20,289
2011 4,38,27,193
2,58,48,137
1,79,79,056
Increase in 2011 over 2001 1,22,34,630
61,75,863
60,58,767
Illiterates
2001 1,79,73,246
61,91,531
1,17,81,715
2011 1,82,22,077
62,47,826
1,19,74,251
Increase in 2011 over 2001 2,48,831
56,295 1,92,536

Census of India 2011Census of India 2011Press Conference, 4th April, 2011Press Conference, 4th April, 2011 Our Census, Our Future

Census of India 2011Census of India 2011Press Conference, 4th April, 2011Press Conference, 4th April, 2011 Our Census, Our Future
Literacy Rate by sex-2011:Madhya Pradesh and EAG States
States Persons Males Females
Uttarakhand 79.6 88.3 70.7
Orissa 73.5 82.4 64.4
Chattisgarh 71.0 81.5 60.6
Madhya Pradesh 70.6 80.5 60.0
Uttar Pradesh 69.7 79.2 59.3
Jharkhand 67.6 78.5 56.2
Rajasthan 67.1 80.5 52.7
Bihar 63.8 73.4 53.3

Census of India 2011Census of India 2011Press Conference, 4th April, 2011Press Conference, 4th April, 2011 Our Census, Our Future

Census of India 2011Census of India 2011Press Conference, 4th April, 2011Press Conference, 4th April, 2011 Our Census, Our Future

Census of India 2011Census of India 2011Press Conference, 4th April, 2011Press Conference, 4th April, 2011 Our Census, Our Future
Literacy Rate : India, Madhya Pradesh and neighboring States 2011
India/State Literacy rate(Person)
Person Male Female
India 74.0 82.1 65.5
Madhya Pradesh 70.6 80.5 60.0
Uttar Pradesh 69.7 79.2 59.3
Maharashtra 82.9 89.8 75.5
Gujarat 79.3 87.2 70.7
Chhatisgarh 71.0 81.5 60.6
Rajasthan 67.1 80.5 52.7

Census of India 2011Census of India 2011Press Conference, 4th April, 2011Press Conference, 4th April, 2011 Our Census, Our Future
Decadal variation in Literacy Rate : India, Madhya Pradesh and neighboring States 1971-2011
India/State Literacy rate(Person)
1971 1981 1991 2001 2011
India 29.45 43.56 52.21 65.38 74.04
Madhya Pradesh 27.27 38.63 44.67 64.11 70.63
Uttar Pradesh 23.99 32.65 40.71 57.36 69.72
Maharashtra 39.18 55.83 64.87 77.27 82.91
Gujarat 35.79 52.21 61.29 69.97 79.31
Chhatisgarh 24.08 41.38 42.91 65.18 71.04
Rajasthan 19.07 30.09 38.55 61.03 67.06

Census of India 2011Census of India 2011Press Conference, 4th April, 2011Press Conference, 4th April, 2011 Our Census, Our Future

Census of India 2011Census of India 2011Press Conference, 4th April, 2011Press Conference, 4th April, 2011 Our Census, Our Future
Five Top States/Union Territories by Literacy Rate : 2011
Name of State /
District
Literacy
Rate
Person
Name of
State / District
Literacy
Rate Male
Name of
State / District
Literacy
Rate
Female
Madhya Pradesh 70.63 Madhya Pradesh 80.53 Madhya Pradesh 60.02
Jabalpur 82.47 Indore 89.22 Bhopal 76.57
Indore 82.32 Jabalpur 89.11 Jabalpur 75.30
Bhopal 82.26 Bhopal 87.44 Indore 74.89
Balaghat 78.29 Bhind 87.17 Balaghat 69.71
Gwalior 77.93 Balaghat 87.13 Gwalior 68.29
Census of India 2011Census of India 2011Press Conference, 4th April, 2011Press Conference, 4th April, 2011 Our Census, Our Future
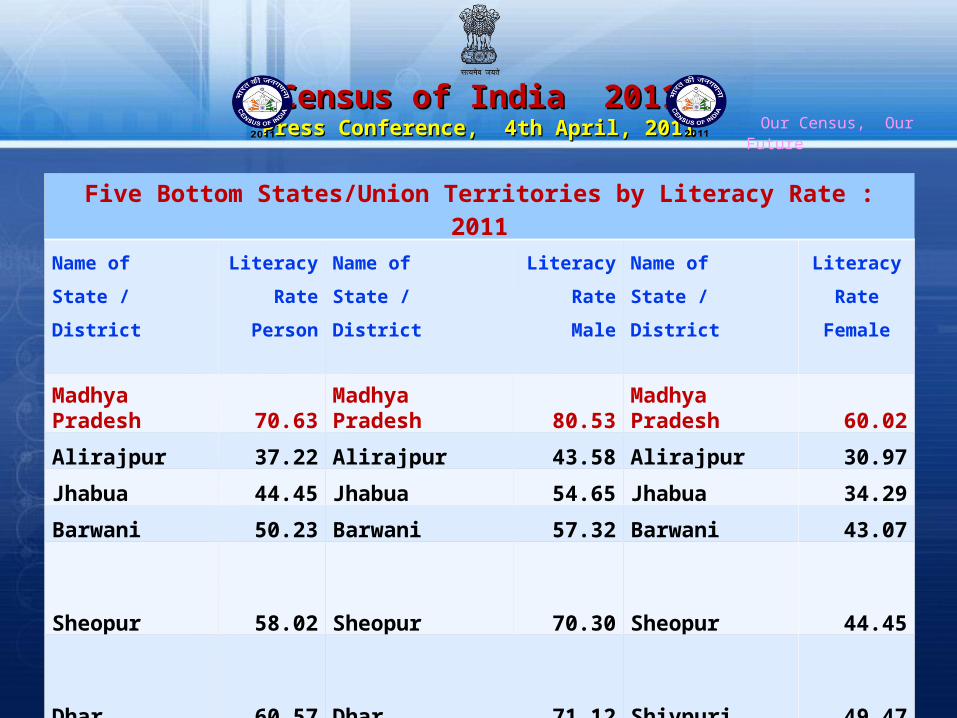
Five Bottom States/Union Territories by Literacy Rate : 2011
Name of State /
District
Literacy
Rate
Person
Name of
State / District
Literacy
Rate Male
Name of
State / District
Literacy
Rate
Female
Madhya Pradesh 70.63 Madhya Pradesh 80.53 Madhya Pradesh 60.02
Alirajpur 37.22 Alirajpur 43.58 Alirajpur 30.97
Jhabua 44.45 Jhabua 54.65 Jhabua 34.29
Barwani 50.23 Barwani 57.32 Barwani 43.07
Sheopur 58.02 Sheopur 70.30 Sheopur 44.45
Dhar 60.57 Dhar 71.12 Shivpuri 49.47

Census of India 2011Census of India 2011Press Conference, 4th April, 2011Press Conference, 4th April, 2011 Our Census, Our Future
Five Bottom States/Union Territories by Literacy Rate : 2011
Name of State /
UT
Literacy
Rate
Person
Name of
State / UT
Literacy
Rate Male
Name of
State / UT
Literacy
Rate
Female
INDIA 74.0 INDIA 82.1 INDIA 65.5
Bihar 63.8 Bihar 73.4 Rajasthan 52.7
Arunachal
Pradesh 67.0
Arunachal
Pradesh 73.7 Bihar 53.3
Rajasthan 67.1Andhra Pradesh
75.6 Jharkhand 56.2
Jharkhand 67.6 Meghalaya 77.2
Jammu &
Kashmir 58.0
Andhra Pradesh
67.7
Jammu & Kashmir
78.3Uttar Pradesh
59.3

Census of India 2011Census of India 2011Press Conference, 4th April, 2011Press Conference, 4th April, 2011 Our Census, Our Future
District level analysis :
Considering the literacy rate by sex, Indore district has the highest male literacy rate (82.2%) Bhopal district has the highest female literacy rate (76.6%). Alirajpur district has the lowest male literacy rate (43.6%) as well as female literacy rate (31.0%).
population aged seven years and above and the absolute number of literates in 2001, and their absolute decadal and percentage difference between
2001and 2011.The percentage decadal increase in population aged seven years and above during 2001-2011 is 25.19 Corresponding increase in the number of literates is 38.73.

Census of India 2011Census of India 2011Press Conference, 4th April, 2011Press Conference, 4th April, 2011 Our Census, Our Future
District level analysis :
illiterates :
Although the total number of illiterates in the state has increased during the decade, there are 26 districts where absolute number of illiterates has declined. The highest contribution in this decline is from Sagar district, where the number of illiterates decreased by 77,588.
In remaining 24 districts, the number of illiterates has increased.
The maximum increase in the number of illiterates has taken place in West Nimar with an increase of 1,11,896.

Census of India 2011Census of India 2011Press Conference, 4th April, 2011Press Conference, 4th April, 2011 Our Census, Our Future
District level analysis :
Ranking of districts by literacy rates of 2001 and 2011 along with decadal difference.
Narsimhapur which occupied the first position in 2001 has slipped down to the seventh rank in 2011.
Raisen district has slipped from fifth position in 2001 to the tenth position in 2011.
Balaghat district has improved from the thirteenth rank in 2001 to fourth rank in 2011.
Gwalior and Sagar districts have moved forward from the twelfth and fourteenth rank in 2001 to fifth and sixth rank in 2011, respectively.
Census of India 2011Census of India 2011Press Conference, 4th April, 2011Press Conference, 4th April, 2011 Our Census, Our Future
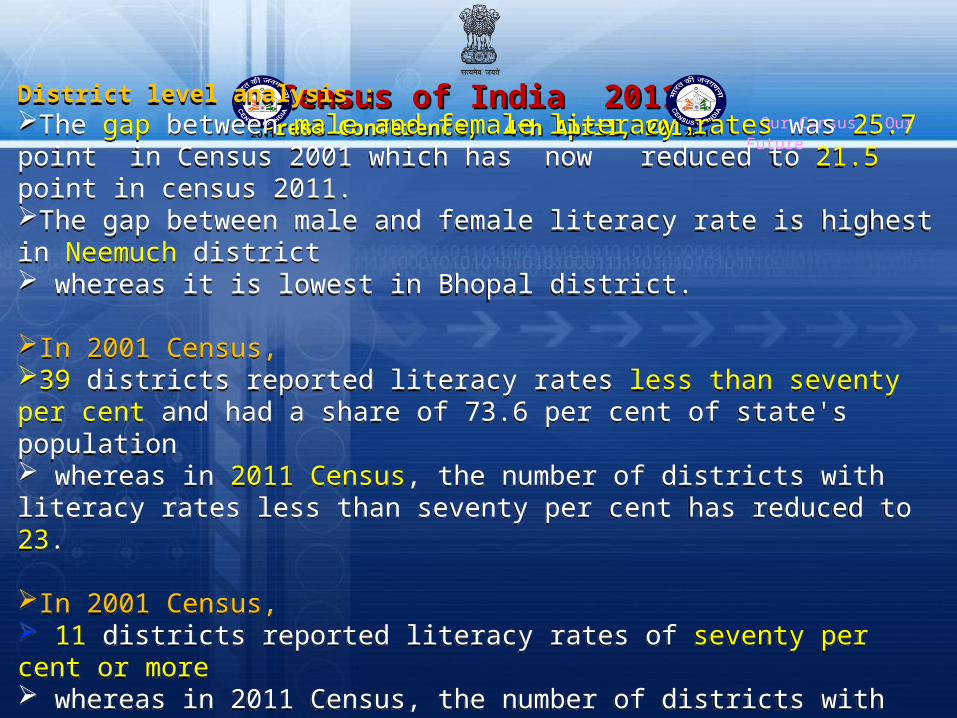
District level analysis :The gap between male and female literacy rates was 25.7 point in Census 2001 which has now reduced to 21.5 point in census 2011.The gap between male and female literacy rate is highest in Neemuch district whereas it is lowest in Bhopal district.
In 2001 Census, 39 districts reported literacy rates less than seventy per cent and had a share of 73.6 per cent of state's population whereas in 2011 Census, the number of districts with literacy rates less than seventy per cent has reduced to 23.
In 2001 Census, 11 districts reported literacy rates of seventy per cent or more whereas in 2011 Census, the number of districts with literacy rates seventy per cent or more has gone up to 27.

Census of India 2011Census of India 2011Press Conference, 4th April, 2011Press Conference, 4th April, 2011 Our Census, Our Future
Decadal variation in Literacy rate of divisions of Madhya Pradesh
State /Divisions Persons Female
1981 1991 2001 2011 1981 1991 2001 2011
Madhya Pradesh 28.3 44.7 63.7 70.6 16.0 29.4 50.3 60.0
Chambal 28.1 44.6 64.3 71.7 12.0 23.9 47.1 58.0
Gwalior 28.0 42.8 63.9 70.2 14.8 25.8 48.3 57.8
Sagar 26.1 42.4 60.6 69.4 14.2 27.5 46.7 58.8
Rewa 22.7 39.8 59.8 70.5 10.1 23.1 45.1 59.3
Shahdol 19.6 34.3 57.8 67.7 8.6 19.5 43.4 56.6
Ujjain 29.3 45.7 68.0 71.2 15.2 27.5 53.6 58.3
Indore 28.5 42.5 58.4 64.4 17.9 29.9 46.5 55.2
Bhopal 28.1 46.1 66.0 73.6 16.5 31.2 53.2 63.9
Narmadapuram 31.8 49.4 67.7 73.1 19.7 35.8 56.2 64.0
Jabalpur 33.4 51.5 68.9 75.8 21.1 37.6 57.2 66.8

Census of India 2011Census of India 2011Press Conference, 4th April, 2011Press Conference, 4th April, 2011 Our Census, Our Future
Census of India 2011Census of India 2011Press Conference, 4th April, 2011Press Conference, 4th April, 2011 Our Census, Our Future

Census of India 2011Census of India 2011Press Conference, 4th April, 2011Press Conference, 4th April, 2011 Our Census, Our Future
Thank youThank you
Top Related