


Languages
Pages
Legal


© comScore, Inc. Proprietary. 2
validated Campaign Essentials - Empowering our clients to grow their
business.

© comScore, Inc. Proprietary.
comScore validated Campaign Essentials™
In-Flight Optimization and Validation of Digital Campaigns
Bas Bartholomeus, Client Service Analyst
comScore, Amsterdam ,The Netherlands

© comScore, Inc. Proprietary.
Agenda
vCE Methodology: in-target / in-view benchmarks
Demo: Campaign Validation and Optimization
Summary and Q&A

© comScore, Inc. Proprietary.
Agenda
vCE Methodology: in-target / in-view benchmarks
Demo: Campaign Validation and Optimization
Summary and Q&A

© comScore, Inc. Proprietary. 9
Increasing complexity within the Online Ad Ecosystem leads to lack of
transparency…

© comScore, Inc. Proprietary. 10
…and “Bad Ads”

© comScore, Inc. Proprietary. 11
What is the definition of Ad viewability?

© comScore, Inc. Proprietary. 12
What is the definition of Ad viewability?
Ads Not Viewed Loaded but not scrolled into view
Ad Viewed IAB definition: 50% of the ad in-
view for 1+ second
Advertisement
Advertisement
Advertisement
Ad non-visible
Direct Viewability Measurements report JavaScript-tagged impressions that were at least 50% viewable for 1+ second.
JavaScript-tagged impressions which are served to non-PC devices or via cross-domain iFrames and loaded in WebKit
browsers are not included in Direct Measurements. Pixel-tagged impressions are not measured for viewability
Viewport:
User’s browser setting

© comScore, Inc. Proprietary. 13
In-View: Why 100% isn’t realistic
User leaves page
before 1 second User’s browser isn’t
on full-screen setting
Non-human traffic drives up
impression counts, when a person
never actually saw the ad
46% Average
In-View Rate

© comScore, Inc. Proprietary. 14
Overall average in-view rate is 46%, with variance seen across
product categories, though spanning a smaller range than in-target
*The Overall Norm comprises data from more than 200 billion impressions over the course of a 12-month rolling period. This includes campaigns that go beyond the select Advertiser / Product categories listed
above to also include additional Advertiser / Product categories as well as studies run directly by publishers and ad networks.
**Viewability benchmarks include display campaigns only; viewability is defined as 50% of the ad’s pixels in-view for at least one second.
***The Health / Wellness category includes campaigns for brands, products and/or services in the following sectors: health associations, health insurance, hospitals, over-the-counter, pharmaceutical, public health
and wellness.
% In-View: Overall* and by Select Advertiser / Product Category** Source: comScore vCE Benchmarks, Q2 2014, U.S.

© comScore, Inc. Proprietary. 15
In-Target: Why 100% isn’t realistic
Not all registration
data is accurate
Demographic data
becomes outdated
Some targeting infers
demography based on
content consumption
More than 60%
of computers are
shared, so
cookies can show
ads to the wrong
person
42% Average
In-Target Rate

© comScore, Inc. Proprietary. 16
Overall average in-target rate is 42%, with variance seen across
product categories
% In-Target: Overall* and by Select Advertiser / Product Category** Source: comScore vCE Benchmarks, Q2 2014, U.S.
*The Overall Norm comprises data from more than 200 billion impressions over the course of a 12-month rolling period. This includes campaigns that go beyond the select Advertiser / Product categories listed
above to also include additional Advertiser / Product categories as well as studies run directly by publishers and ad networks.
**Target audience is categorized based on the primary target selection in vCE, which is self-designated during campaign set-up.
***The Health / Wellness category includes campaigns for brands, products and/or services in the following sectors: health associations, health insurance, hospitals, over-the-counter, pharmaceutical, public health
and wellness

© comScore, Inc. Proprietary. 17
comScore supports every step of the Digital Value Chain
Market Analysis Delivery Evaluation
Web Traffic Analysis
Target Group
Identification
Web / Video / Mobile
Strategy
Media Planning Evaluation
comScore
Audience Analytics
comScore
AdEffx™
Planning Optimization
Behavioral Targets
Campaign
Reach / Frequency
Campaign Validation
In-Flight Optimization
Targeting Efficiency
Viewability
Brand Safety
Advertising Impact
Brand Lift / Action Lift
In-Flight Monitoring
ROI

© comScore, Inc. Proprietary. 18
Total Campaign Delivery Validation & In-Flight Optimization
Right
Audience In-view Brand Safe
In Geography
Non Human
Have ads been
in-view for more
than 50% and
longer than 1
second?
How do you
ensure your ads
are delivered
where your
product is
available?
Have ads served
to real persons
(i.e. impression
was not triggered
by a
spider/robot)?
Were our ads
served to the right
target audience?
Are you counting
cookies or
reaching people?
Have the ads
been served in
brand safe
environments
(i.e. not on our
blacklisted
sites)?
© comScore, Inc. Proprietary. 19
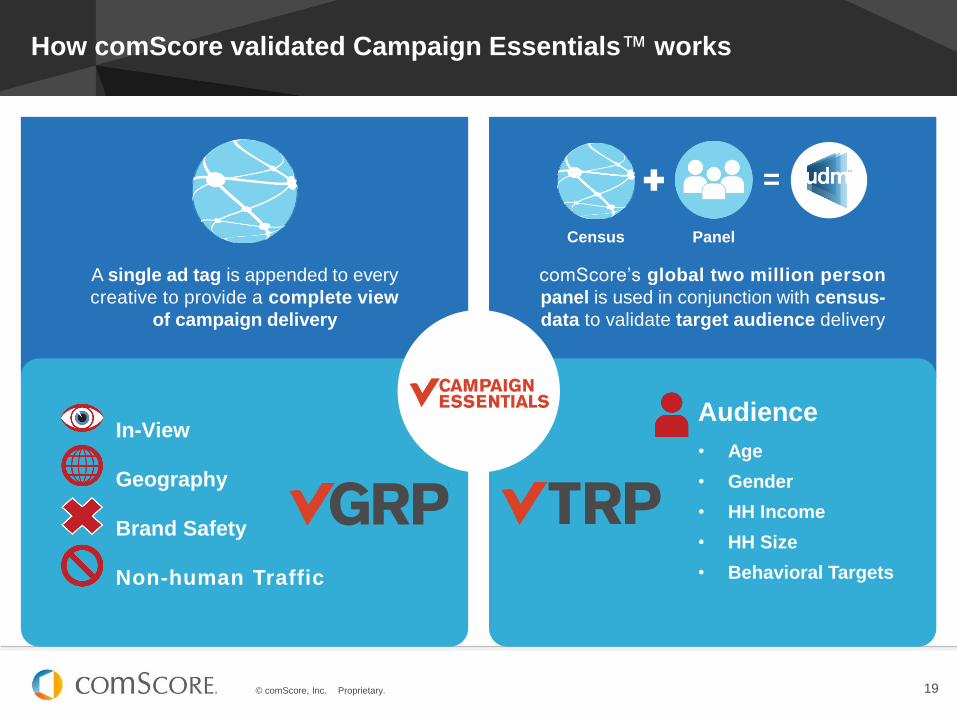
comScore’s global two million person
panel is used in conjunction with census-
data to validate target audience delivery
=
Census Panel
A single ad tag is appended to every
creative to provide a complete view
of campaign delivery
How comScore validated Campaign Essentials™ works
Audience
• Age
• Gender
• HH Income
• HH Size
• Behavioral Targets
In-View
Geography
Brand Safety
Non-human Traffic

© comScore, Inc. Proprietary.
Agenda
vCE Methodology: in-target / in-view benchmarks
Demo: Campaign Validation and Optimization
Summary and Q&A

© comScore, Inc. Proprietary. 21
comScore vCE: Use Case for Campaign Optimization and Validation
Manufacturer of Navigation Devices and Solutions
FRAMEWORK
Branding Campaign: Target Group 25+
Advertiser: Manufacturer of Navigation Devices and Solutions
Volume: 16,3 Million Impressions
Campaign Duration: 7th Nov – 7th Dec 2013
OBJECTIVES
Targeting Efficiency: 50% of Impressions In-Target
Viewability: Surpassing Industry Benchmarks (Technology segment: > 41%)
In-Flight Optimization rather than pure Measurement
vCE Interface Screenshots + Insights

© comScore, Inc. Proprietary. 22
comScore’s global two million person
panel is used in conjunction with census-
data to validate target audience delivery
=
Census Panel
A single ad tag is appended to every
creative to provide a complete view
of campaign delivery
How comScore validated Campaign Essentials™ works
Audience
• Age
• Gender
• HH Income
• HH Size
• Behavioral Targets
In-View
Geography
Brand Safety
Non-human Traffic

© comScore, Inc. Proprietary. 23
GOAL Achieve 4,8 million validated impressions in the target group 25+
Agency and Publisher work together to meet in-target guarantees
RESULT Agency delivered guaranteed in-target volume for the campaign to the client
Agency and Publisher partner work
together to monitor in-target delivery
Publisher increases impression volume to
reach 4.8 MM in-target
30-Day-Campaign
Day 15:
<2 MM in-Target
Goal
Met

© comScore, Inc. Proprietary. 24
GOAL Deliver 50% in-target impressions to adults 25+
50% In-Target
Goal
Identification of optimization potential for
in-target delivery
Client and Agency work with Trading Desk to improve targeting strategy
RESULT 2 of 3 Publishers met in-target goal, while Trading Desk C reviewed its current
targeting strategy for consideration in future campaigns

© comScore, Inc. Proprietary. 25
GOAL Cap average frequencies to reach 3% of target online population
Client and Agency maximize UVs for their reach-building campaign
RESULT Agency identified inefficient placements in-flight and re-allocated budgets; Client
achieved reach goals
Delivery inefficiencies of high
impression volume Adnet

© comScore, Inc. Proprietary. 26
GOAL Prove campaign’s efficient targeting strategy (Composition Index >100)
Agency aims to validate targeting efficiency
RESULT While 77.2% of the Total Internet Uvs fell within the target group, 90.5% of all
Campaign UVs were in-target, proving the campaign’s high targeting efficiency.
Composition persons 25+ reached in campaign
Composition online population persons 25+

© comScore, Inc. Proprietary. 27
GOAL Deliver at least 30% of all impressions to users that are interested in
Technology, Travel or Automotive sites.
Client tries to minimize waste
RESULT Agency continuously monitored the campaign exposure to Behavioral Targets and
successfully minimized impression waste.

© comScore, Inc. Proprietary. 28
comScore’s global two million person
panel is used in conjunction with census-
data to validate target audience delivery
=
Census Panel
A single ad tag is appended to every
creative to provide a complete view
of campaign delivery
How comScore validated Campaign Essentials™ works
Audience
• Age
• Gender
• HH Income
• HH Size
• Behavioral Targets
In-View
Geography
Brand Safety
Non-human Traffic

© comScore, Inc. Proprietary. 29
GOAL Reach in-view benchmarks of Technology sector (41 +%)
Client defines industry viewability benchmarks as minimum target
RESULT Continuous campaign monitoring and in-flight optimization enabled the Agency to
deliver viewability rates of 67%, with an overall validated impression rate of 66%.

© comScore, Inc. Proprietary. 30
GOAL Optimize budget allocation based on partners’ viewability performance
Agency validates Publishers’ potential contribution to the campaign
success
RESULT Agency used vCE Impression Scorecard to allocate higher impression volumes to
strong in-view performers
Agency identifies comparatively weak viewability
performance of Trading Desk C

© comScore, Inc. Proprietary. 31
GOAL Identify and invest in creatives with top engagement rates
Agency uses vCE to understand engagement rates across various
creative formats
RESULT Agency was able to replace Creative C with Creative A in many sites on their media
plan, resulting in higher overall engagement for the campaign
A
B
C
Understand individual creative’s engagement rates to
efficiently re-allocate budget
Person hovers over ad
for longer than ½
second.

© comScore, Inc. Proprietary. 33
GOAL Guarantee Brand Safety for newly launched product (GPS-Tool)
Brand and Agency work together to ensure brand safety
RESULT Client maintained the safety of its brand in order to ensure optimal campaign
performance
5% of media
impressions saved
from delivery next
to unsafe content!
Continuous monitoring of delivery within content-categories
Create blocks and
exceptions based on
observations

© comScore, Inc. Proprietary. 34
Agency monitors geographic delivery for client to avoid wasted
impressions outside their local target
GOAL Achieve 99% geographic delivery within target market (Germany)
RESULT Agency and Ad Network adjusted geographic settings to meet in-geo targets and
eventually achieved 99% delivery in the target market
97% In-Geo

© comScore, Inc. Proprietary.
Agenda
Current challenges Online Advertising
Use Case: Campaign Validation and Optimization
Evaluation of Advertising Effectiveness
Summary and Q&A

© comScore, Inc. Proprietary. 36
Campaign Validation, Optimization and Impact Measurement
comScore
BSL™ Pulse
Analysing Branding Impact of
campaign
comScore
vCE®
In-Flight Campaign
Optimization and Validation
comScore
Action Lift™
Analysing campaign impact on
Consumer Behaviour

© comScore, Inc. Proprietary. 37
Proving the Impact of Digital Campaigns on Online Behavior
comScore
Action Lift™

© comScore, Inc. Proprietary.
Agenda
vCE Methodology: in-target / in-view benchmarks
Live Demo: Campaign Validation and Optimization
Summary and Q&A

© comScore, Inc. Proprietary.
www.comscore.com
www.facebook.com/comscoreinc
@comScore
Bas Bartholomeus, Client Service Analyst
comScore, Amsterdam, The Netherlands
+31 20 5195 492 | [email protected] |
Thank You
@comScoreEMEA
www.comscore.com
www.facebook.com/comscoreinc
Top Related