


Languages
Pages
Legal

i
PREPARATION AND CHARACTERIZATION OF BIODEGRADABLE POLY
LACTIC ACID (PLA) COMPOSITES WITH OIL PALM EMPTY FRUIT
BUNCH (EFB) FIBER
ABU KASHEM MOHAMMAD MOSHIUL ALAM
Thesis submitted in fulfillment of the requirements
For the award of the degree of
Master of Engineering in Chemical
Faculty of Chemical and Natural Resources Engineering
UNIVERSITY MALAYSIA PAHANG
APRIL 2012
vi
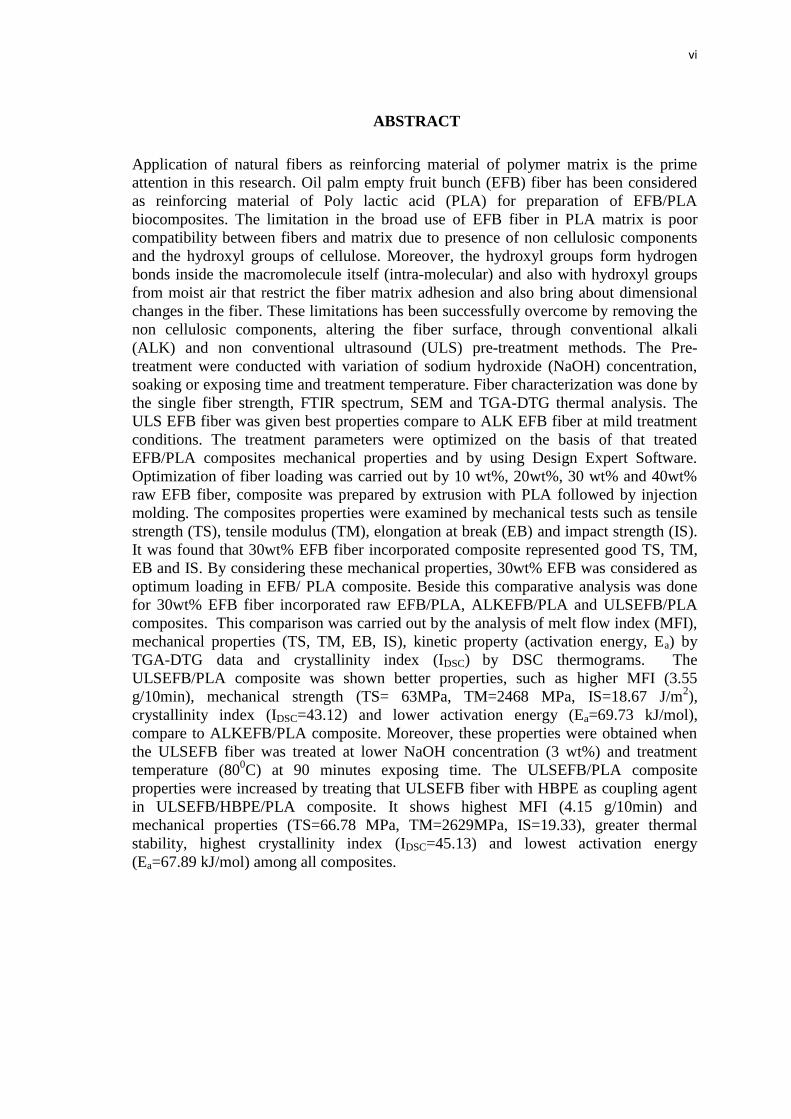
ABSTRACT
Application of natural fibers as reinforcing material of polymer matrix is the prime
attention in this research. Oil palm empty fruit bunch (EFB) fiber has been considered
as reinforcing material of Poly lactic acid (PLA) for preparation of EFB/PLA
biocomposites. The limitation in the broad use of EFB fiber in PLA matrix is poor
compatibility between fibers and matrix due to presence of non cellulosic components
and the hydroxyl groups of cellulose. Moreover, the hydroxyl groups form hydrogen
bonds inside the macromolecule itself (intra-molecular) and also with hydroxyl groups
from moist air that restrict the fiber matrix adhesion and also bring about dimensional
changes in the fiber. These limitations has been successfully overcome by removing the
non cellulosic components, altering the fiber surface, through conventional alkali
(ALK) and non conventional ultrasound (ULS) pre-treatment methods. The Pre-
treatment were conducted with variation of sodium hydroxide (NaOH) concentration,
soaking or exposing time and treatment temperature. Fiber characterization was done by
the single fiber strength, FTIR spectrum, SEM and TGA-DTG thermal analysis. The
ULS EFB fiber was given best properties compare to ALK EFB fiber at mild treatment
conditions. The treatment parameters were optimized on the basis of that treated
EFB/PLA composites mechanical properties and by using Design Expert Software.
Optimization of fiber loading was carried out by 10 wt%, 20wt%, 30 wt% and 40wt%
raw EFB fiber, composite was prepared by extrusion with PLA followed by injection
molding. The composites properties were examined by mechanical tests such as tensile
strength (TS), tensile modulus (TM), elongation at break (EB) and impact strength (IS).
It was found that 30wt% EFB fiber incorporated composite represented good TS, TM,
EB and IS. By considering these mechanical properties, 30wt% EFB was considered as
optimum loading in EFB/ PLA composite. Beside this comparative analysis was done
for 30wt% EFB fiber incorporated raw EFB/PLA, ALKEFB/PLA and ULSEFB/PLA
composites. This comparison was carried out by the analysis of melt flow index (MFI),
mechanical properties (TS, TM, EB, IS), kinetic property (activation energy, Ea) by
TGA-DTG data and crystallinity index (IDSC) by DSC thermograms. The
ULSEFB/PLA composite was shown better properties, such as higher MFI (3.55
g/10min), mechanical strength (TS= 63MPa, TM=2468 MPa, IS=18.67 J/m2),
crystallinity index (IDSC=43.12) and lower activation energy (Ea=69.73 kJ/mol),
compare to ALKEFB/PLA composite. Moreover, these properties were obtained when
the ULSEFB fiber was treated at lower NaOH concentration (3 wt%) and treatment
temperature (800C) at 90 minutes exposing time. The ULSEFB/PLA composite
properties were increased by treating that ULSEFB fiber with HBPE as coupling agent
in ULSEFB/HBPE/PLA composite. It shows highest MFI (4.15 g/10min) and
mechanical properties (TS=66.78 MPa, TM=2629MPa, IS=19.33), greater thermal
stability, highest crystallinity index (IDSC=45.13) and lowest activation energy
(Ea=67.89 kJ/mol) among all composites.
vii
ABSTRAK
Aplikasi fiber semulajadi sebagai bahan penguat matrik plastik menjadi perhatian utama
dalam kajian ini. Serat tandan kelapa sawit kosong (EFB) merupakan bahan penguat
kepada asid polilaktik (PLA) bagi penyediaan biokomposit EFB/PLA. Dalam
penggunaan serat EFB di dalam matrik PLA, kesesuaian antara serat dan matrik plastik
adalah terhad disebabkan kehadiran komponen yang bersifat bukan selulosik dan terdiri
daripada kumpulan hidroksil pada struktur selulosa. Tambahan lagi, kumpulan
hidroksil menbemtuk ikatan hidrogen di dalam makromolekul itu dan kehadiran
kumpulan hidroksil kesan dari kelembapan udara menghadkan lekatan antara serat-
matrik yang akhirnya menyebabkan perubahan dimensi pada serat tersebut. Faktor-
faktor yang menghadkan lekatan ini dapat diatasi melalui penyingkiran bahan yang
tidak bersifat selulosa, pengubahsuaian permukaan serat melalui kaedah pra-rawatan
alkali konvensional dan ultra-bunyi bukan konvensional. Pra-rawatan telah dijalankan
dengan kepelbagaian tahap kepekatan natrium hidroksida (NaOH), tempoh
rendaman atau masa pendedahan dan suhu rawatan. Pencirian serat telah dijalankan
melalui kaedah analisis kekuatan gentian tunggal, spektrum FTIR, imbasan SEM dan
terma TGA-DTG. Serat ULS EFB menunjukkan sifat yang terbaik berbanding dengan
ALK EFB dengan keadaan rawatan yang sederhana. Parameter rawatan telah
dioptimumkan berdasarkan sifat mekanikal komposit EFB/PLA dan menggunakan
perisian Design Expert.Pengoptimuman muatan serat dijalankan dengan peratusan berat
kandungan gentian EFB yang berbeza iaitu 10wt%, 20wt%, 30wt% dan 40wt%,
komposit telah disediakan oleh kisaran campuran dengan PLA diikuti oleh
pembentukan acuan. Sifat-sifat komposit telah dianalisa melalui ujian mekanikal
seperti kekuatan tegangan (TS), modulus tensil (TM), pemanjangan pada takat putus
(BP) dan kekuatan kesan (IS). Didapati bahawa gentian EFB 30wt% gabungan
komposit menunjukkan sifat yang baik bagi sifat-sifat TS, TM, EB dan IS. Dengan
mengambil kira sifat-sifat mekanik ini, EFB 30wt% dianggap sebagai muatan yang
optimum dalam komposit EFB / PLA. Selain analisis ini, perbandingan telah dilakukan
terhadap gentian EFB yang mengandungi 30wt% serat dan PLA, ALK EFB / PLA dan
ULS EFB / PLA komposit. Perbandingan komposit dilakukan melalui analisis indeks
pengaliran leburan (MFI), sifat mekanik (TS, TM, EB, IS), sifat kinetik
(tenaga pengaktifan, Ea) menggunakan TGA-DTG dan indeks penghabluran (IDSC) oleh
DSC termogram. Komposit ULSEFB / PLA telah menunjukkan sifat yang lebih baik,
iaitu nilai yang tinggi bagi MFI (3.55 g/10min), kekuatan mekanikal (TS = 63MPa, TM
= 2468 MPa, IS= 18.67 J/m2), penghabluran indeks (IDSC = 43.12%),. Manakala, tenaga
pengaktifan lebih rendah (Ea = 69.73 kJ / mol), berbanding dengan komposit ALKEFB /
PLA. Selain itu, sifat-sifat ini telah diperolehi apabila ULSEFB serat dirawat pada
kepekatan NaOH yang lebih rendah (3%) dan suhu rawatan (80˚C) selama 90 minit bagi
masa pendedahan. Sifat-sifat komposit ULSEFB / PLA meningkat dengan perawatan
ULSEFB serat dengan HBPE sebagai agen gandingan pada komposit ULSEFB / HBPE
/ PLA. Ia menunjukkan MFI tertinggi (4.15 g/10min) dan sifat mekanik (TS = 66.78
MPa, TM = 2629MPa, IS = 19.33 J/m2), kestabilan terma yang lebih baik, indeks
penghabluran tertinggi (IDSC = 45.13%) dan tenaga pengaktifan terendah (Ea = 67.89 kJ
/ mol) di antara kesemua komposit.
viii
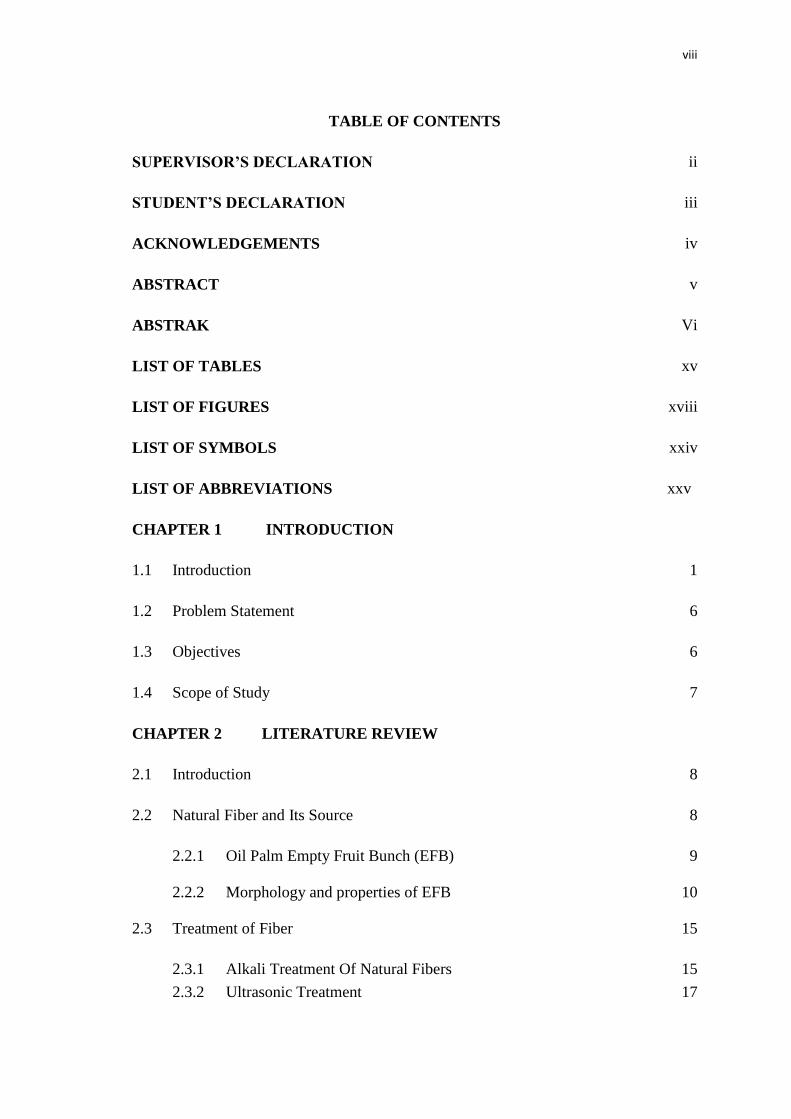
TABLE OF CONTENTS
SUPERVISOR’S DECLARATION ii
STUDENT’S DECLARATION iii
ACKNOWLEDGEMENTS iv
ABSTRACT v
ABSTRAK Vi
LIST OF TABLES xv
LIST OF FIGURES xviii
LIST OF SYMBOLS xxiv
LIST OF ABBREVIATIONS xxv
CHAPTER 1 INTRODUCTION
1.1 Introduction 1
1.2 Problem Statement 6
1.3 Objectives 6
1.4 Scope of Study 7
CHAPTER 2 LITERATURE REVIEW
2.1 Introduction 8
2.2 Natural Fiber and Its Source 8
2.2.1 Oil Palm Empty Fruit Bunch (EFB) 9
2.2.2 Morphology and properties of EFB 10
2.3 Treatment of Fiber 15
2.3.1 Alkali Treatment Of Natural Fibers 15
2.3.2 Ultrasonic Treatment 17

ix
2.3.3 Coupling Agent 19
2.3.4 Pre-Treatment of Fiber with Coupling Agents 23
2.4 Matrix 24
2.4.1 Thermosets 24
2.4.2 Thermoplastics 25
2.4.3 Biodegradable Plastics 27
2.4.4 Poly (lactic acid) 29
2.5 Natural Fiber Reinforced Plastics 33
2.5.1 Mechanism of Reinforcement 33
2.5.2 Factors Controlling Performance of Fiber Reinforced Composites 34
(i) Dispersion of Fiber in to Matrix 34
(ii) Thermal Stability of the Fiber 35
(iii) Hydrophilic Nature of Natural Fiber 35
(iv) Critical Fiber Length 36
(v) Fiber Orientation 36
(vi) Fiber Volume Fraction 37
2.6 Oil Palm Empty Fruit Bunch (EFB) Fiber Reinforced Polymer Composites 37
2.6.1 Physical Properties of EFB Fiber Composites 38
2.6.2 Mechanical Properties of Oil Palm EFB Fiber Composites 39
(i) Effect of Oil Palm EFB Fiber Loading on Composite
Mechanical Properties
39
(ii) Effect of Fiber Size on Mechanical Properties of Oil Palm
EFB Fiber Composites
41
(iii
)
Effect of Fiber Treatment on Mechanical Properties of Oil
Palm EFB Fiber Composites
42
2.6.3 Thermal Properties of Oil palm EFB Fiber Reinforced Polymer
Composites
43
2.7 Natural Fiber Reinforced Poly Lactic Acid Composites 44
2.8 Processing Methods 48
2.8.1 Extrusion 48

x
2.8.2 Injection Molding 49
CHAPTER 3 MATERIALS AND EXPERIMENTAL METHODS
3.1 Introduction 51
3.2 Materials 51
3.2.1 Matrix 51
3.2.2 Fiber 52
3.2.3 Chemicals 52
3.3 Methods 52
3.3.1 Flow Chart of Methodology 52
3.3.2 Materials Processing 53
3.3.3 Fiber Treatment 53
(i) Alkali treatment of EFB fiber 53
(ii) Ultrasonic treatment of EFB fiber 54
(iii) Hyper Branched Polyester (HBP) Treatment of EFB Fiber 54
3.3.4 Composites Fabrication 55
3.3.5 Response Surface Method (RSM) For Optimization of EFB Fiber
Treatment Parameters
55
3.4 Characterization and Testing of Fiber and Composites 58
3.4.1 Fourier Transformation Infrared Spectroscopy (FTIR) 58
3.4.2 Scanning Electron Microscopy (SEM) 58
3.4.3 Density Measurement 59
3.4.4 Single Fiber Tensile Testing 59
3.4.5 Melt Flow Index (MFI) 59
3.4.6 Tensile Testing of Composites 59
3.4.7 Impact Testing 59
3.4.8 Thermogravimetric Analysis (TGA) 60
3.4.9 Differential Scanning Calorimetry (DSC) Analysis 60

xi
CHAPTER 4 RESULTS AND DISCUSSION
4.1 Optimization of EFB Fiber Treatment Parameters Using Response
Surface Method (RSM)
62
4.1.1 Optimization of Alkali Treatment Parameters of Oil Palm EFB
Fiber
62
4.1.2 Optimization of Ultrasound Treatment Parameters of Oil Palm EFB
Fiber
70
4.2 Effect Of Alkali Treatment On The Compatibility And Mechanical
Properties Of Oil Palm Empty Fruit Bunch (EFB) Fiber Reinforced
Polylactic Acid Composites
77
4.2.1 Mechanism of Alkali Treatment 77
4.2.2 SEM of Raw and Alkali Treated EFB Fiber 78
4.2.3 Single Fiber Strength of ALKEFB Fiber 78
(i) Effect of NaOH Concentration on Single Fiber Strength of
ALKEFB Fiber
78
(ii) Effect of Soaking Time on Single Fiber Strength of ALKEFB
Fiber
80
(iii) Effect of Treatment Temperature on Single Fiber Strength of
ALKEFB Fiber
82
4.2.4 Composite Melt Flow Index (MFI) 83
4.2.5 Mechanical Properties of Raw EFB Fiber Incorporated PLA
Composites
85
4.2.6 Mechanical Properties of Alkali Treated EFB/PLA Composites 87
(i) Effect of NaOH Concentration on Mechanical Properties
ALKEFB/PLA Composites
87
(ii) Effect of Soaking Time on Mechanical Properties of
ALKEFB/PLA Composites
89
(iii) Effect of Temperature on Mechanical Properties of
ALKEFB/PLA Composites
92
4.2.7 Thermogravimetric Analysis (TGA) of Oil Palm EFB Fiber 94
(i) TGA Curves Analysis of Raw EFB Fiber and Alkali Treated 94

xii
EFB (ALKEFB) Fiber
(ii) Effect of NaOH Concentration on Thermal Stability of
ALKEFB Fiber
95
(iii) Effect of Soaking Time on Thermal Stability of ALKEFB
Fiber
96
(iv) Effect of Treatment Temperature on Thermal Stability of
ALKEFB Fiber
97
4.2.8 Differential Thermal Analysis (DTG) of Raw EFB and Alkali
Treated EFB (ALKEFB) Fiber
98
(i) DTG Curves of Raw EFB and ALK EFB Fibers 98
(ii) Effect of NaOH Concentration on Activation Energy of Raw
and ALKEFB Fiber
99
(iii) Effect of Soaking Time on Activation Energy of ALKEFB
Fiber
100
(iv) Effect of Treatment Temperature on Activation Energy of
ALKEFB Fiber
101
4.2.9 Thermogravimetric Analysis (TGA) of EFB/PLA Composites 102
(i) TGA Curves Analysis of Alkali Treated EFB/PLA
Composites
102
(ii) Effect of NaOH Concentration on Thermal Stability of ALK
EFB/PLA Composites
103
(iii) Effect of Soaking Time on Thermal Stability of
ALKEFB/PLA Composites
103
(iv) Effect of Treatment Temperature on Thermal Stability of
ALKEFB/PLA Composites
104
4.2.10 Differential Thermal Analysis (DTG) of Raw EFB/PLA and Alkali
Treated ALKEFB/PLA Composites
105
(i) Effect of NaOH Concentration on Activation Energy of
ALKEFB/PLA Composites
106
(ii) Effect of Soaking Time on Activation Energy of ALK
EFB/PLA Composites
107
(iii) Effect of Treatment Temperature on Activation Energy of
ALKEFB/PLA Composites
108
4.2.11 Differential Scanning Calorimetric (DSC) Analysis of ALK
EFB/PLA Composites
108
(i) Effect of NaOH Concentration on DSC Thermograms of
ALKEFB/PLA Composites
109
(ii) Effect of Soaking Time on DSC Thermograms of ALK
EFB/PLA Composites
110

xiii
(iii) Effect of Treatment Temperature on DSC Thermograms of
ALKEFB/PLA Composites
111
4.3 Effect of Ultrasonic Treatment on EFB Fiber and Study of Ultrasound
Treated EFB Fiber Reinforced PLA Composites
113
4.3.1 SEM Raw EFB and Ultrasound Treated ULSEFB Fiber 113
4.3.2 Single Fiber Strength of Ultrasound Treated EFB (ULSEFB) Fiber 114
(i)
Effect of NaOH Concentration on Single Fiber Strength of
ULSEFB Fiber
114
(ii) Effect of Exposing Time on Single Fiber Strength of
ULSEFB Fiber
116
(iii) Effect of Treatment Temperature on Single Fiber Strength of
ULSEFB Fiber
118
4.3.3 FTIR Analysis of Raw EFB and ULSEFB Fiber 120
4.3.4 ULSEFB Fiber Density 122
(i) Effect of NaOH Concentration on Density of ULSEFB Fiber 122
(ii) Effect of Exposing Time on Density of ULSEFB Fiber 123
(iii) Effect of Treatment Temperature on Density of ULSEFB
Fiber
123
4.3.5 ULSEFB/PLA Composites Density 124
(i) Effect of NaOH Concentration on Density of ULSEFB/PLA
Composites
124
(ii) Effect of Exposing Time on Density of ULS EFB/PLA
Composites
125
(iii) Effect of Treatment Temperature on Density of
ULSEFB/PLA Composites
126
4.3.6 Melt Flow Index (MFI) of Different ULSEFB/PLA Composites 127
4.3.7 ULSEFB/PLA Composites Mechanical Properties 128
(i) Effect of NaOH Concentration on Mechanical Properties of
ULSEFB/PLA Composites
128
(ii) Effect of Exposing Time on Mechanical Properties of
ULSEFB/PLA Composite
131
(iii) Effect of Treatment Temperature on Mechanical Properties
of ULSEFB/PLA Composite
134
4.3.8 Thermogravimetric Analysis (TGA) of Ultrasound Treated EFB
(ULS EFB) Fiber
136
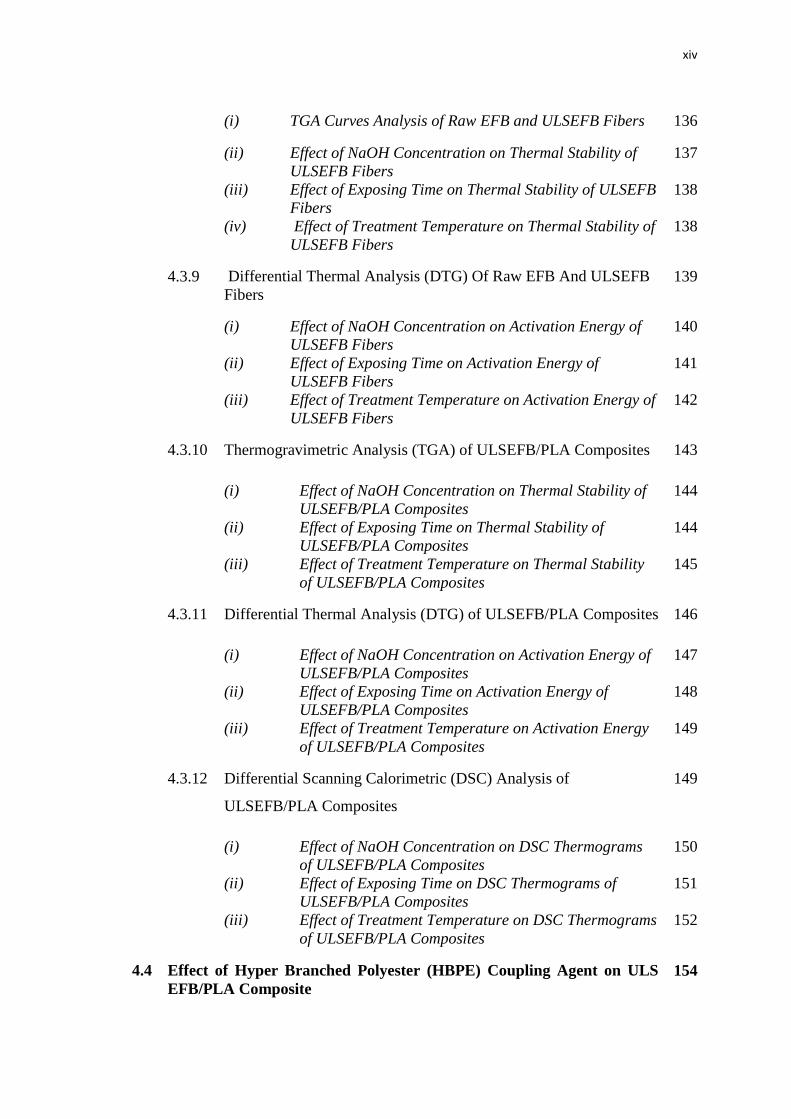
xiv
(i) TGA Curves Analysis of Raw EFB and ULSEFB Fibers 136
(ii) Effect of NaOH Concentration on Thermal Stability of
ULSEFB Fibers
137
(iii) Effect of Exposing Time on Thermal Stability of ULSEFB
Fibers
138
(iv) Effect of Treatment Temperature on Thermal Stability of
ULSEFB Fibers
138
4.3.9 Differential Thermal Analysis (DTG) Of Raw EFB And ULSEFB
Fibers
139
(i) Effect of NaOH Concentration on Activation Energy of
ULSEFB Fibers
140
(ii) Effect of Exposing Time on Activation Energy of
ULSEFB Fibers
141
(iii) Effect of Treatment Temperature on Activation Energy of
ULSEFB Fibers
142
4.3.10 Thermogravimetric Analysis (TGA) of ULSEFB/PLA Composites 143
(i) Effect of NaOH Concentration on Thermal Stability of
ULSEFB/PLA Composites
144
(ii) Effect of Exposing Time on Thermal Stability of
ULSEFB/PLA Composites
144
(iii) Effect of Treatment Temperature on Thermal Stability
of ULSEFB/PLA Composites
145
4.3.11 Differential Thermal Analysis (DTG) of ULSEFB/PLA Composites 146
(i) Effect of NaOH Concentration on Activation Energy of
ULSEFB/PLA Composites
147
(ii) Effect of Exposing Time on Activation Energy of
ULSEFB/PLA Composites
148
(iii) Effect of Treatment Temperature on Activation Energy
of ULSEFB/PLA Composites
149
4.3.12 Differential Scanning Calorimetric (DSC) Analysis of
ULSEFB/PLA Composites
149
(i) Effect of NaOH Concentration on DSC Thermograms
of ULSEFB/PLA Composites
150
(ii) Effect of Exposing Time on DSC Thermograms of
ULSEFB/PLA Composites
151
(iii) Effect of Treatment Temperature on DSC Thermograms
of ULSEFB/PLA Composites
152
4.4 Effect of Hyper Branched Polyester (HBPE) Coupling Agent on ULS
EFB/PLA Composite
154

xv
4.4.1 FTIR Analysis of ULSEFB/PLA and ULSEFB/HBPE/PLA
Composites
154
4.4.2 Melt Flow Index (MFI) of ULSEFB/PLA and
ULSEFB/HBPE/PLA Composites
155
4.4.3 Mechanical Properties of ULSEFB/PLA and ULSEFB/HBPE/PLA
Composites
155
4.5 Comparative Assessment of Composites Properties 159
4.5.1 Comparative Melt Flow Index (MFI) of Raw EFB/PLA and
Treated EFB/PLA Composites
159
4.5.2 Comparative Mechanical Properties of Raw EFB/PLA and Treated
EFB/PLA Composites
159
4.5.3 Comparative FTIR Analysis of Raw EFB and Treated EFB
incorporated PLA Composites
163
4.5.4 Comparative TGA analysis of Raw EFB/PLA and Treated
EFB/PLA Composites
166
4.5.5 Comparative DTG Analysis of Raw EFB/PLA and Treated
EFB/PLA Composites
167
4.5.6 Comparative DSC analysis of Raw EFB/PLA and Treated
EFB/PLA composites
167
CHAPTER 5 CONCLUSION AND RECOMENDATIONS
5.1 CONCLUSION 169
5.2 Recommendations and Future Work 170
REFERENCES 171
APPENDIX A List of Publications 185
xvi
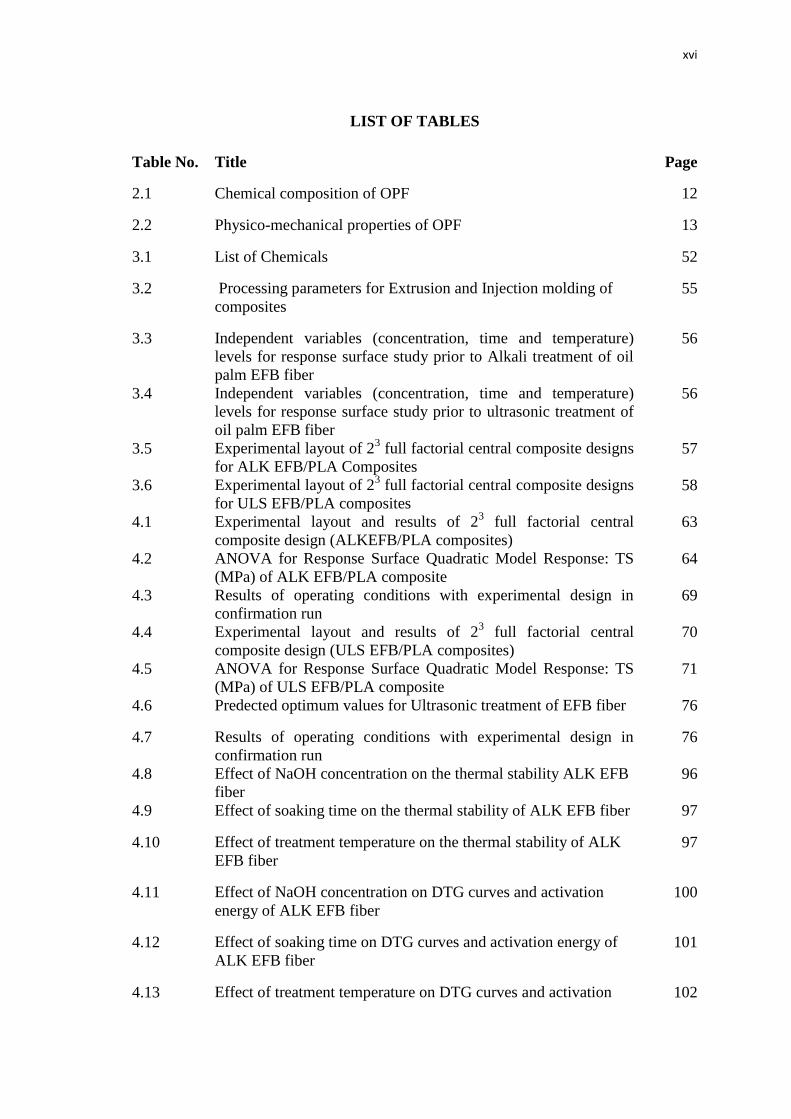
LIST OF TABLES
Table No. Title Page
2.1 Chemical composition of OPF 12
2.2 Physico-mechanical properties of OPF 13
3.1 List of Chemicals 52
3.2 Processing parameters for Extrusion and Injection molding of
composites
55
3.3 Independent variables (concentration, time and temperature)
levels for response surface study prior to Alkali treatment of oil
palm EFB fiber
56
3.4 Independent variables (concentration, time and temperature)
levels for response surface study prior to ultrasonic treatment of
oil palm EFB fiber
56
3.5 Experimental layout of 23 full factorial central composite designs
for ALK EFB/PLA Composites
57
3.6 Experimental layout of 23 full factorial central composite designs
for ULS EFB/PLA composites
58
4.1 Experimental layout and results of 23 full factorial central
composite design (ALKEFB/PLA composites)
63
4.2 ANOVA for Response Surface Quadratic Model Response: TS
(MPa) of ALK EFB/PLA composite
64
4.3 Results of operating conditions with experimental design in
confirmation run
69
4.4 Experimental layout and results of 23 full factorial central
composite design (ULS EFB/PLA composites)
70
4.5 ANOVA for Response Surface Quadratic Model Response: TS
(MPa) of ULS EFB/PLA composite
71
4.6 Predected optimum values for Ultrasonic treatment of EFB fiber 76
4.7 Results of operating conditions with experimental design in
confirmation run
76
4.8 Effect of NaOH concentration on the thermal stability ALK EFB
fiber
96
4.9 Effect of soaking time on the thermal stability of ALK EFB fiber 97
4.10 Effect of treatment temperature on the thermal stability of ALK
EFB fiber
97
4.11 Effect of NaOH concentration on DTG curves and activation
energy of ALK EFB fiber
100
4.12 Effect of soaking time on DTG curves and activation energy of
ALK EFB fiber
101
4.13 Effect of treatment temperature on DTG curves and activation 102

xvii
energy of ALK EFB fiber
4.14 Effect of NaOH concentration on thermal stability of ALK
EFB/PLA composite
103
4.15 Effect soaking time on thermal stability of ALKEFB/PLA
composite
104
4.16 Effect of treatment temperature on the thermal stability of
ALKEFB/PLA composite
104
4.17 Effect of NaOH concentration on DTG curves and activation
energy of ALK EFB/PLA composite
106
4.18 Effect of soaking time on DTG curves and activation energy of
ALK EFB/PLA composite
107
4.19 Effect of treatment temperature on DTG curves and activation
energy of ALK EFB/PLA composite
108
4.20 Effect of NaOH concentration on the DSC thermogram of ALK
EFB/PLA composites
110
4.21 Effect of soaking time on the DSC thermogram of ALK
EFB/PLA composites
111
4.22 Effect of treatment temperature on the DSC thermogram of ALK
EFB/PLA composites
112
4.23 Summary of FT-IR spectra for Raw EFB and ULS EFB fiber 121
4.24 Effect of NaOH concentration on thermal stability ULS EFB
fiber
137
4.25 Effect of exposure time on thermal stability ULS EFB fiber 138
4.26 Effect of treatment temperature on thermal stability of ULS EFB
fiber
139
4.27 Effect of NaOH concentration on DTG curves and activation
energy of ULS EFB fiber
141
4.28 Effect of exposing time on DTG curves and activation energy of
ULS EFB fiber
142
4.29 Effect of treatment temperature on DTG curves and activation
energy of ULS EFB fiber
143
4.30 Effect of NaOH concentration on thermal stability of
ULSEFB/PLA composite
144
4.31 Effect of Exposing time on thermal stability of ULSEFB/PLA
composite
145
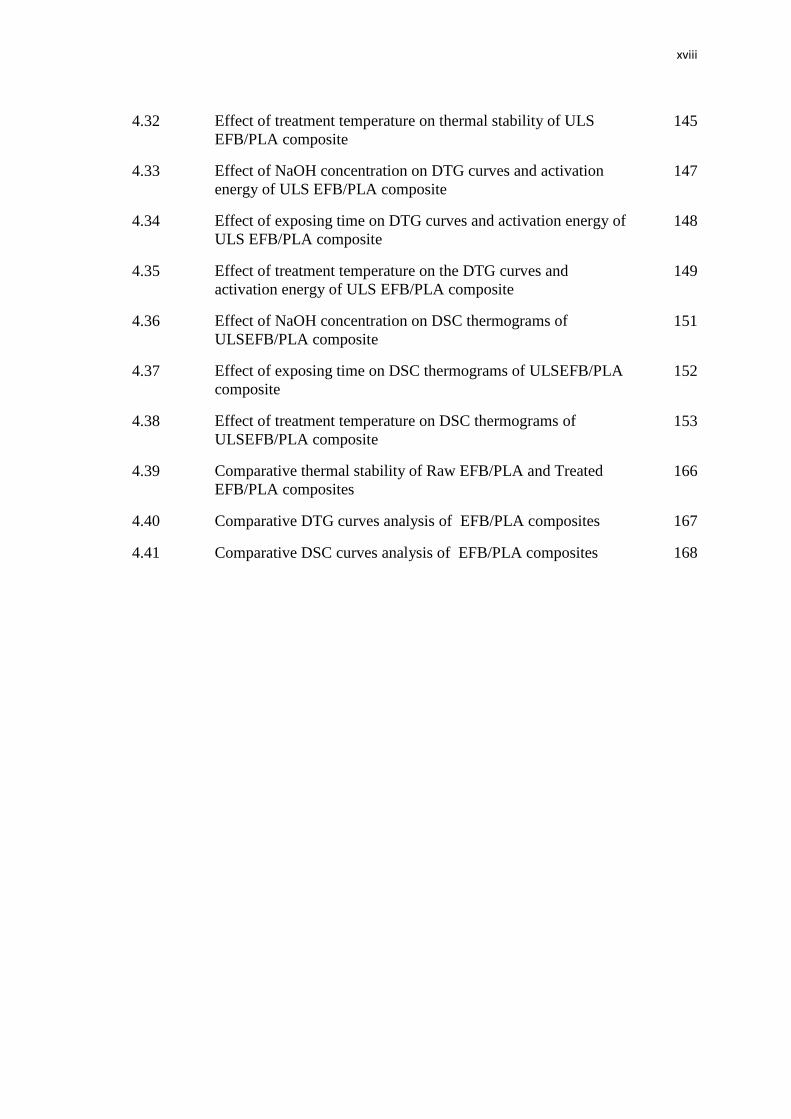
xviii
4.32 Effect of treatment temperature on thermal stability of ULS
EFB/PLA composite
145
4.33 Effect of NaOH concentration on DTG curves and activation
energy of ULS EFB/PLA composite
147
4.34 Effect of exposing time on DTG curves and activation energy of
ULS EFB/PLA composite
148
4.35 Effect of treatment temperature on the DTG curves and
activation energy of ULS EFB/PLA composite
149
4.36 Effect of NaOH concentration on DSC thermograms of
ULSEFB/PLA composite
151
4.37 Effect of exposing time on DSC thermograms of ULSEFB/PLA
composite
152
4.38 Effect of treatment temperature on DSC thermograms of
ULSEFB/PLA composite
153
4.39 Comparative thermal stability of Raw EFB/PLA and Treated
EFB/PLA composites
166
4.40 Comparative DTG curves analysis of EFB/PLA composites 167
4.41 Comparative DSC curves analysis of EFB/PLA composites 168
xix
LIST OF FIGURS
Figure No Title Page
2.1 View of EFB wastes piled up in a palm oil mill premise 10
2.2 SEM images of transverse sections of OPF 11
2.3 Structure of cellulose 13
2.4 Structure of hemicellulose 14
2.5 Structure of Lignin 15
2.6 Structure of hyper branched polyester (HBPE) 23
2.7 Preparation of high molecular weight PLA 31
4.1 Normal probability plot of residual for TS 66
4.2 Plot of residual against predicted responseTS 66
4.3 3D surface of TS from the model equation: effect of NaOH
concentration and Time
67
4.4 3D surface of TS from the model equation: effect of NaOH
concentration and Temperature.
68
4.5 3D surface of TS from the model equation: effect of Time
anTemperature
68
4.6 Normal probability plot of residual for TS 73
4.7 Plot of residual against predicted response TS 73
4.8 3D surface of TS from the model equation: effect of NaOH
concentration and Time
74
4.9 3D surface of TS from the model equation: effect of NaOH
concentration and Temperature
75
4.10 3D surface of TS from the model equation: effect of Time and
Temperature
75
4.11 SEM of Raw EFB and alkali treated (ALKEFB) fiber 78
4.12 Effect of NaOH concentration on tensile strength of ALKEFB
single fiber
78
4.13 Effect of NaOH concentration on tensile modulus of ALKEFB
single fiber
79

xx
4.14 Effect of NaOH concentration on elongation at break of ALKEFB
single fiber
80
4.15 Effect of soaking time on tensile strength of ALKEFB single fiber 80
4.16 Effect of soaking time on tensile modulus of ALKEFB single
fiber
81
4.17 Effect of soaking time on elongation at break of ALKEFB single
fiber
81
4.18 Effect of treatment temperature on tensile strength of ALKEFB
single fiber
82
4.19 Effect of treatment temperature on tensile modulus of ALKEFB
single fiber
83
4.20 Effect of treatment temperature on elongation at break of
ALKEFB single fiber
83
4.21 MFI of Virgin PLA, raw EFB/PLA and different ALKEFB/PLA
composites
84
4.22 Tensile strength of virgin PLA and raw EFB/PLA composites 85
4.23 Tensile modulus of virgin PLA and raw EFB/PLA composites 86
4.24 Elongation at break of virgin PLA and raw EFB/PLA composites 86
4.25 Impact strength of virgin PLA and raw EFB/PLA composites 87
4.26 Effect of NaOH concentration on tensile strength of ALKFB/PLA
composite
88
4.27 Effect of NaOH concentration on tensile modulus of ALK
EFB/PLA composite
88
4.28 Effect of NaOH concentration on elongation at break of ALK
EFB/PLA composite
89
4.29 Effect of NaOH concentration on impact strength of ALK
EFB/PLA composite
89
4.30 Effect of soaking time on tensile strength of ALKEFB/PLA
composite
90
4.31 Effect of soaking time on tensile modulus of ALKEFB/PLA
composite
91
4.32 Effect of soaking time on elongation at break of ALKEFB/PLA
composite
91
4.33 Effect of soaking time on impact strength of ALKEFB/PLA 92

xxi
composite
4.34 Effect of treatment temperature on tensile strength of
ALKEFB/PLA composite
92
4.35 Effect of treatment temperature on tensile modulus of
ALKEFB/PLA composite
93
4.36 Effect of treatment temperature on Elongation at break of
ALKEFB/PLA composite
93
4.37 Effect of treatment temperature on impact strength of
ALKEFB/PLA composite
94
4.38 TGA curves of Raw EFB and different ALKEFB fibers 95
4.39 DTG curves of Raw EFB and different ALKEFB fibers 98
4.40 ln[ln(1/y)] versus 1/T(K) for the second stage decomposition of
raw EFB
99
4.41 SEM and EDX raw EFB fiber 100
4.42 TGA curves of Virgin PLA, Raw EFB/PLA and ALKEFB/PLA
composites at optimum alkali treatment conditions
102
4.43 DTG curves of virgin PLA, Raw EFB/PLA and ALK EFB/PLA
composites at optimum alkali treatment conditions
105
4.44 ln[ln(1/y)] versus 1/T(K) for decomposition stage of ALK
EFB/PLA composite
106
4.45 DSC Thermograms of PLA and ALKEFB/PLA composites 109
4.46 SEM of (a) Raw EFB (b) Alkali treated EFB fiber (ALK EFB) (c)
Ultrasound treated EFB fiber (ULS EFB)
113
4.47 Effect of NaOH concentration on tensile strength of ULS Single
EFB fiber
115
4.48 Effect of NaOH concentration on tensile modulus of ULS Single
EFB fiber
115
4.49 Effect of NaOH concentration on elongation at break of ULS
treated Single EFB fiber
116
4.50 Effect of exposing time on tensile strength of ULS treated Single
EFB fiber
117
4.51 Effect of exposing time on tensile modulus of ULS treated Single
EFB fiber
117
4.52 Effect of exposing time on elongation at break of ULS treated 118

xxii
Single EFB fiber
4.53 Effect of treatment temperature on tensile strength of ULS treated
Single EFB fiber
119
4.54 Effect of treatment temperature on tensile modulus of ULS
treated Single EFB fiber
119
4.55 Effect of treatment temperature on elongation at break of ULS
treated Single EFB fiber
120
4.56 FT-IR spectrum of Raw EFB and Ultrasound treated EFB fiber 121
4.57 Effect of NaOH concentration on density of ULS EFB fiber 122
4.58 Effect of exposing time on density of ULS EFB fiber 123
4.59 Effect of treatment temperature on density of ULS EFB fiber 124
4.60 Effect of NaOH concentration on density of ULS EFB/PLA
composite
125
4.61 Effect of exposing time on density of ULS EFB/PLA composite 126
4.62 Effect of treatment temperature on density of ULS EFB/PLA
composite
126
4.63 Melt flow index of virgin PLA, raw EFB/PLA and different ULS
EFB/PLA composites
127
4.64 Effect of NaOH concentration on tensile strength of ULS
EFB/PLA composites
129
4.65 Effect of NaOH concentration on tensile modulus of ULS
EFB/PLA composite
129
4.66 Effect of NaOH concentration on elongation at break of
ULSEFB/PLA composites
130
4.67 Effect of NaOH concentration on impact strength of
ULSEFB/PLA composites
130
4.68 Effect of exposing time on tensile strength of ULSEFB/PLA
composites
132
4.69 Effect of exposing time on tensile modulus of ULSEFB/PLA
composites
132
4.70 Effect of exposing time on elongation at break of ULSEFB/PLA
composites
133
4.71 Effect of exposing time on impact strength of ULSEFB/PLA
composites
133

xxiii
4.72 Effect of treatment temperature on tensile strength of
ULSEFB/PLA composites
134
4.73 Effect of treatment temperature on tensile modulus of
ULSEFB/PLA composites
135
4.74 Effect of treatment temperature on elongation at break of
ULSEFB/PLA composites
135
4.75 Effect of treatment temperature on impact strength of
ULSEFB/PLA composites
136
4.76 TGA curves of Raw EFB and ULS EFB fiber at optimum
ultrasonic treatment conditions
137
4.77 DTG curves of Raw EFB and ULS EFB at optimum treatment
conditions
140
4.78 ln[ln(1/y)] versus 1/T(K) for the decomposition of 3% NaOH
treated ULS EFB fiber
140
4.79 TGA curves of Raw EFB/ PLA and ULS EFB/PLA composites at
optimum treatment conditions
143
4.80 DTG curves of Raw EFB/PLA and ULS EFB/PLA composites at
optimum treatment conditions
146
4.81 ln[ln(1/y)] versus 1/T(K) for decomposition stage of 800C
temperature treated ULS EFB/PLA composite
147
4.82 DSC thermograms of Raw EFB/PLA and ULS EFB/PLA
composites with optimum treatment conditions
150
4.83 FTIR analysis of ULSEFB/PLA and HBPE treated ULS EFB
incorporated (ULSEFB/HBPE/PLA) PLA composites
154
4.84 MFI of ULSEFB/PLA and HBPE treated ULS EFB incorporated
ULSEFB/HBPE/PLA composites
155
4.85 Tensile strength of ULSEFB/PLA and ULSEFB/HBPE/PLA
composites
156
4.86 Tensile modulus of ULSEFB/PLA and ULSEFB/HBPE/PLA
composites
156
4.87 Elongation at break of ULSEFB/PLA and ULSEFB/HBPE/PLA
composites
157
4.88 Impact strength of ULSEFB/PLA and ULSEFB/HBPE/PLA
composites
157
4.89 SEM of ultrasound treated EFB/PLA (ULSEFB/PLA) and HBPE
treated ULSEFB/PLA (ULSEFB/HBPE/PLA) composites
158

xxiv
4.90 Comparative MFI of raw EFB/PLA and treated EFB/PLA
composites
159
4.91 Comparative tensile strength of raw EFB/PLA and treated
EFB/PLA composites
161
4.92 Comparative tensile modulus of raw EFB/PLA and treated
EFB/PLA composites
162
4.93 Comparative elongation at break of raw EFB/PLA and treated
EFB/PLA composites
162
4.94 Comparative impact strength of raw EFB/PLA and treated
EFB/PLA composites
163
4.95 Comparative FTIR spectra of PLA, EFB and EFB/PLA
composites
163
4.96 Schematic illustration for the probable reaction sites of PLA and
cellulose of EFB fibres
165
4.97 Schematic illustration for the probable reaction sites of PLA and
HBPE grafted cellulose of EFB fibres
165
xxv
LIST OF SYMBOLS
Ea Activation Energy (kJ/mol)
IDSC % Crystallinity determined by DSC
Tc Crystallization Temperature (⁰C)
y Fraction of materials not been decomposed
Z Frequency factor
R Gas constant (J/mol K)
Tg Glass Transition Temperature (⁰C)
∆H Heat of fusion (J/g)
β Heating Rate (⁰C/min)
Tm Melting Temperature (⁰C)
µm Micrometer
Tmax Temperature at maximum reaction rate (⁰C)

xxvi
LIST OF ABBREVIATIONS
ALK Alkali
ASTM American Standard Testing Method
DSC Differential scanning calorimetri
DTG Differential thermo gravimetry
EB Elongation at break
EFB Empty fruit bunch
EDX Energy dispersive X-ray
ENR Epoxidized Natural Rubber
ETP Engineering thermoplastics
GPa Giga Pascals
HBP Hyper branched polyester
HBPEA Hyper branched polyester amide
HMDI Hexamethylene diisocyanate
IS Impact strength
MPa Mega Pascals
MA Methyl acrylate
MCC Microcrystalline cellulose
MFI Melt flow index
NFRPC Natural fiber reinforced polymer composites
OPF Oil palm fiber
xxvii
PF Phenol formaldehyde
PLA Poly(lactic acid)
PP Poly(propylene)
SEM Scanning electron microscopic
TDI Toluene diisocynate
TGA Thermo gravimetric analysis
THF Tetra hydrofuran
TM Tensile moldulus
TPM 3-(trimethoxysilyl)-propylmethacrylate
TS Tensile strength
ULS Ultrasound
UTS Ultimate tensile strength
UV Ultra-violet
CHAPTER 1
INTRODUCTION
1.1 INTRODUCTION
In recent years there has been an expanding search for new materials with high
performance at affordable costs. Due to environmental awareness, this search
particularly emphasis on environment friendly materials, in terms of renewable,
recyclable, sustainable and triggered biodegradable. In this perception composite
materials make from renewable resources are very prospective in the field of composite
science. Several lignocellulosic fibers such as jute, sisal, pineapple, coconut etc. are
source of raw materials in plastic industries. These fibers have established their
potentiality as reinforcing fillers in many polymers to develop new composite materials.
In recent years it has found that the demand of these materials increasing on a
commercial scale. (Satyanarayana et al.,2008; Singh, et al.,2008; Zheng et al., 2008) .
These examples give emphasis to the development of new materials based on renewable
materials.
Similarly, use of natural polymers is not new, since bamboo, straw, paper, silk,
etc., have been used from historical times. The use of natural polymers was superseded
in the 20th
century as a wide-range of synthetic polymers was developed based on raw
materials from low cost petroleum. However, since the 1990s, increased attention has
been paid to the use of natural polymers and lignocellulosic fibers. The reasons for this

2
include: (a) growing interest in reducing the environmental impact of polymers or
composites (b) finite petroleum resources, decreasing pressures for the dependence on
petroleum products with increasing interest in maximizing the use of renewable
materials and (c) the availability of improved data on the properties and morphologies
of natural materials such as lignocellulosic fibers, through modern instruments at
different levels, and hence better understanding of their structure–property correlations.
These factors have greatly increased the understanding and development of new
materials such as biocomposites (Kestur et al., 2009).
Synthetic polymer-based composite materials are now well established all over
the world for a wide variety of applications because of their high specific strength and
modulus compared to conventional materials such as metals and alloys, along with their
long durability (Bledzki and Gassan 1999; Marikarian 2008). However, the use of
large volumes of polymer-based synthetic fiber composites in different sectors in spite
of their high cost has led to disposal problems. In fact, several countries have already
approved laws for the reduction of such environmentally abusive materials, triggering
greater efforts to find materials based on natural resources in view of the latter’s eco-
friendly attributes.
Natural fibers are sourcing of organic materials also a source for carbon and a
host of other useful materials and chemicals, particularly for the production of “green”
materials. Several countries such as India, Malaysia, Indonesia, Philippines, Brazil and
some of the African countries have national projects for the utilization of their agro
wastes such as coconut based materials, wastes from rubber and palm oil industries, rice
husk, etc., These materials thus form inexpensive “new or secondary resources”, which
could make them more valuable for extensive utilization (Rijswijk and Brouwer, 2002).
Lignocellulosic fibers have some unique attributes, such as being less abrasive
to tooling and not causing as many respiratory problems for workers (Kandachar, 2002
and Sanadi, 2004). Furthermore, because they are inexpensive and have load bearing
capacity, the use of natural fiber based composites has spread to various sectors,
including aircraft, construction, grain and fruit storage and footwear. Natural fiber
reinforced polymer composites are used in cars behind the vinyl carpeting on the doors,
consoles and seat backs. Residential construction applications include windows, sidings,
and roof tiles. Many window and door manufacturers are considering natural fiber
Top Related