


Languages
Pages
Legal


Copyright © 2009 Rockwell Automation, Inc. All rights reserved.
Predictive Emissions Monitoring System (PEMS)
Software CEM®

LADCO Workshop
Copyright © 2009 Rockwell Software. All rights reserved.
Software CEM®
Predictive Emissions Monitoring System (PEMS)

(Confidential – For Internal Use Only)
Agenda
1. Introduction to Software CEM
2. Software vs. Hardware
3. Software vs. Software
4. Summary
5. Case Studies
6. Discussion

Industry Challenges
With regulations continually become more stringent many industries and processes now have the responsibility to account for their impact on the environment by replacing an aging system or implementing a new monitoring system that:
– meets all regulatory demands– provides the highest levels of accuracy and reliability – ensures a sustainable long-term solution– minimizes the total cost of ownership
Copyright © 2009 Rockwell Software. All rights reserved.

Solution – Software CEM®
– Meets all performance criteria for regulatory certification– Cost effective solution powered by Pavilion8™ software platform
– Same platform for Model Predictive Control & Optimization– Rockwell Software is an active expert in
technical support to regulatory agencies worldwide.
• Patented - 1st introduced in 1993• Over 250 installations in • Diverse applications
A patented, nonlinear hybrid model-based, Predictive Emission Monitoring System (PEMS) that provides an alternative to hardware-based Continuous Emission Monitoring System (CEMS).
Copyright © 2009 Rockwell Software. All rights reserved.

Solution - Software CEM®
• Software CEM uses a nonlinear hybrid modeling methodology – Models can be empirical, 1st Principles based, or a combination of both.
• Rockwell Software interfaces to all major DCSs, PLCs, and historians– Works with any recording and reporting system
• Have interfaced with software developed in-house by end users – Pavilion OPC interface makes this especially easy by allowing users to interface
with our Software CEM technology without the need to modify source code for over 1000 applications
Copyright © 2009 Rockwell Software. All rights reserved.

Software CEM® Applications
Sources• Boilers• Turbines• Duct Burners• Dryers • Thermal Oxidizers• Reciprocating Engines• Regenerative Thermal
Oxidizers• Process Heaters• Olefin Furnaces• Crude Heaters
Fuel Types• Natural Gas• No. 2 & 6 Fuel Oils• Other Fuel Oils• Refinery Gas• Process Gas• Combined Fuels
Copyright © 2009 Rockwell Software. All rights reserved.
Industry Independent

Software CEM® Advantages
Cost Effective Monitoring & Compliance• A proven, model-based, software solution that leverages existing existing
process instrumentation and data • Does not require additional capital equipment or real estate• Scalable solution that supports multiple Software CEMs in a
standard office environment PC
Highly Accurate & Reliable Emissions Monitoring & Reporting• Detects & alerts operator to sensor failures• Meets strict continuous emissions monitoring data availability
requirements of 95% or more• Continues to operate in the event of sensor/instrument failure• Accurate emissions modeling with robust prediction capabilities
Environmental and Industry Experience & Expertise • Proven solutions that meet unique, local regulatory requirements• Provides added confidence and reduced risk exposure
Copyright © 2009 Rockwell Software. All rights reserved.
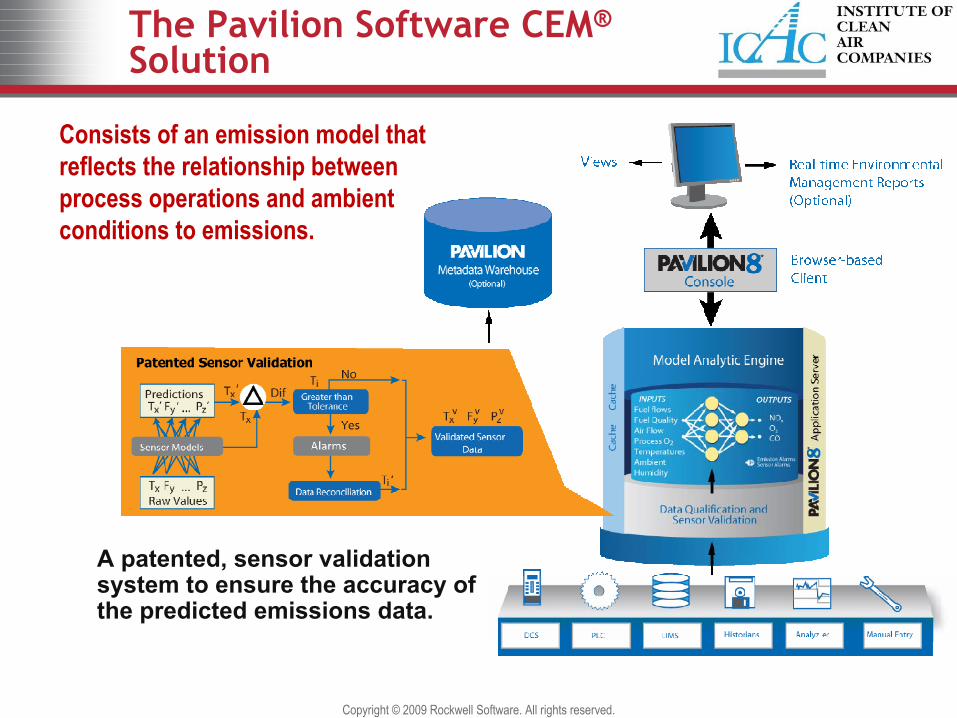
The Pavilion Software CEM®
Solution
Consists of an emission model that reflects the relationship between process operations and ambient conditions to emissions.
A patented, sensor validation system to ensure the accuracy of the predicted emissions data.
Copyright © 2009 Rockwell Software. All rights reserved.

Software CEM® -Sensor Validation
• Definition– An algorithm imbedded in the emissions
model to: • check raw inputs for validity• reconstruct variables that are out of
specification or missing• predict what the failed sensor value should be.
• Method– Development of a model for each key input – Model inputs accuracy with R2>95%
• Results– Sensor Validation is a unique patented process that provides consistent
achievement of the USEPA mandated 95% uptime
Copyright © 2009 Rockwell Software. All rights reserved.
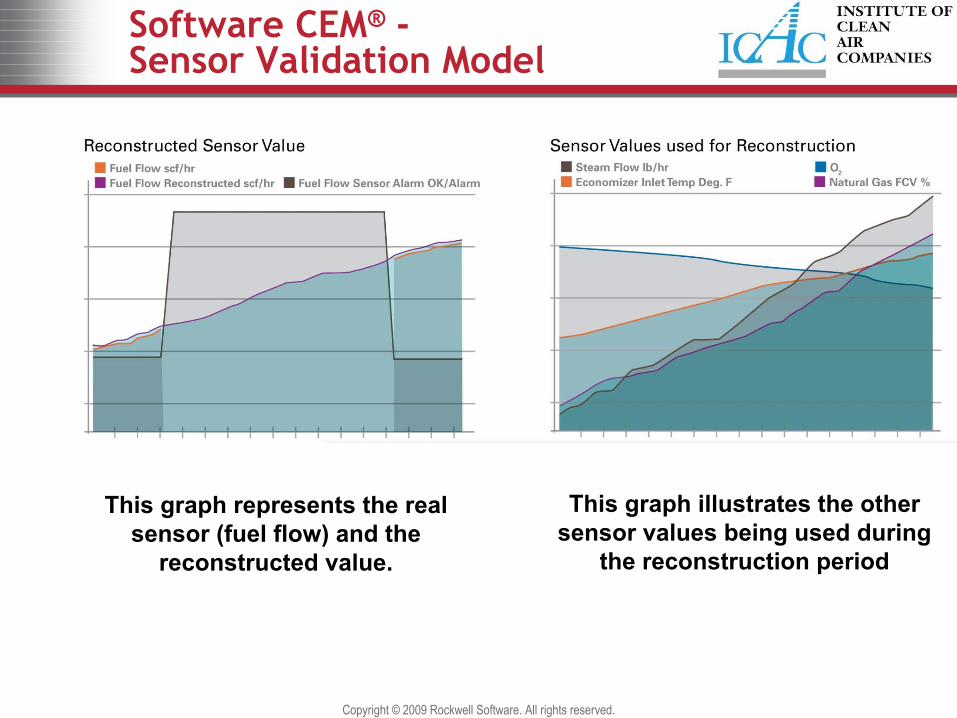
Software CEM® -Sensor Validation Model
This graph represents the real sensor (fuel flow) and the
reconstructed value.
This graph illustrates the other sensor values being used during
the reconstruction period
Copyright © 2009 Rockwell Software. All rights reserved.

Software CEM® –Sensor Validation & PS-16
• Sensor Validation is a requirement of PS-16: As defined in section 6.1.8 and 9.2: – “6.1.8 Sensor Evaluation System. Your PEMS must be designed to perform automatic
or manual determination of defective sensors on at least a daily basis. This sensor evaluation system may consist of a sensor validation sub-model, a comparison of redundant sensors, a spot check of sensor input readings at a reference value, operation, or emission level, or other procedure that detects faulty or failed sensors. Some sensor evaluation systems generate substitute values (reconciled data) that are used when a sensor is perceived to have failed. You must obtain prior approval before using reconciled data.”
– “9.2 Daily Sensor Evaluation Check. Your sensor evaluation system must check the integrity of each PEMS input at least daily.”
• Rockwell Software provides a patented, real-time continuous sensor validation route with the ability to reconstruct data by using an independent model for each sensor. This virtually eliminates any missing data.
Copyright © 2009 Rockwell Software. All rights reserved.

Software CEM® -Model Validation
• Model Validation– A standard feature on Software CEM that provide a daily check on the model’s
integrity; verifying that no unauthorized changes have occurred– Note: the model does not change only the process changes with time
• Definition– A routine that applies known sensor input values and verifies the results against
known output values• Method
– Predetermined input values are applied for low, medium, & high ranges– Output values are then calculated by the model– Calculated values are then compared to the known output values developed during
modeling and RATA
• Results– An equivalency to an EPA mandated Quarterly audit.
Copyright © 2009 Rockwell Software. All rights reserved.

Software CEM® RATA Accuracy within + 7.5% Scale
Copyright © 2009 Rockwell Software. All rights reserved.

Software CEM®
Certification Rate – 100%
• Based on a USEPA Review of Software CEM Installations– Initial Certification Tests
• Average Relative Accuracy (20% or less is goal):– NOx – 6.4%, O2 – 4.9%
• Less than 7.5% Relative Accuracy– NOx – 97 (66%), O2 – 105 (72%)
– Ongoing Relative Accuracy Tests • Average Relative Accuracy:
– NOx – 3.2%,O2 – 3.9%• Less than 7.5% Relative Accuracy
– NOx – 132 (95%)– O2 – 119 (86%)
– No failures– Demonstrated as accurate as CEMS over tougher test
Copyright © 2009 Rockwell Software. All rights reserved.

Sustaining Software CEM®
• Retaining accuracy over long periods of time is a function of physical equipment change and not the software application– Greater than1,600 stack years – Greater than 2,000 RATA (without failure)
• Greater than 100 of our installed Software CEMs are customer or independently maintained and supported– Greater than 40% of all installations
100% data availability lowers the risk of inaccurate reporting with the use of continuous, real-time sensor validation
Copyright © 2009 Rockwell Software. All rights reserved.

Copyright © 2009 Rockwell Automation, Inc. All rights reserved.
Software CEM vs.
Hardware CEM

Software CEM®
Lower Total Cost of Ownership
Cost Analysis Based on USEPA CEM ModelCopyright © 2009 Rockwell Software. All rights reserved.

Increasing Cost of Hardware Validation
• Hardware CEM (analyzers and system) accuracy is verified daily due to equipment drift and aging– Verification is performed with costly Calibration Gas
• Typical 2% certified gas is used – Uptime as required by agencies is >95%
• Continuous routine maintenance is required for operation• Yearly sustainable operating costs are more then double that of Software CEM
• Hardware CEM Linearity is verified quarterly via a Calibration Gas Audit (CGA)– Verification is performed with multiple Calibration Gases that are different then the
gases used for Daily Cal-Check gas• 3 level (low, mid, & high range) gases are used for linearity
– 1% Protocol gas is used
Copyright © 2009 Rockwell Software. All rights reserved.

Software CEM® vs. Hardware CEM Validation
• Software CEM sensor validation routine is equivalent to the daily Cal-gas Check for hardware CEMS– Software CEM validates sensors once per minute versus hardware CEM once every
24 hours • 1440 times to 1 in a 24 hour period.
– Uptime as required by agencies is >95%• Hardware CEM targets 95% (98% for Part 75) • Software CEM is near 100%
• Software CEM Model Validation routine is equivalent to the CGA for a hardware CEM– Software CEM validates the model once per day versus hardware CEM once per
every calendar quarter• 90 times to 1 in a calendar quarter
Copyright © 2009 Rockwell Software. All rights reserved.

Copyright © 2009 Rockwell Automation, Inc. All rights reserved.
Model-based Software CEM vs.
Other Software Methodologies

Software CEM® Methodologies
• Nonlinear hybrid modeling methodology versus a statistical methodology (i.e. table look-up)
– A true Software CEM model is robust for a wider range outside ofthe RATA range
– The table look-up is similar to a classic data substitution method and is more dependent upon the amount and diversity of data collected
• A table look-up method cannot interpolate or extrapolate operating conditions that are not already in the table
• Both methodologies can be built directly from historical data (provided hardware-CEMS data is available) and require no additional inputs
Copyright © 2009 Rockwell Software. All rights reserved.
Software CEM® Accuracy
• Nonlinear Hybrid modeling methodology employs extrapolation (an accepted practice by PS-16) that allows initial testing to be held at a minimum by reducing the number of test points required during model development– Table Look-up systems must include the entire range of the measurement envelope
in order not to have “holes” in the data table. These “holes” will result in unsupported data in the table and result in a missing data flag.
Look-up table data does not extrapolate thus requiring more testing than an empirical equation-based models
Copyright © 2009 Rockwell Software. All rights reserved.

Ambient Conditions –Compliance Accuracy
• The Pavilion modeling methodology does not require additional input sensors such as ambient humidity
– Uses ambient sensors used for high accuracy because:– As NOx levels come down, ambient conditions have a more dramatic
affect on NOx calculations– Omitting or using surrogates for this input places the system at risk of
misrepresenting emissions• Ambient sensors not used with:
– Steam injection, water misting, flue gas recirculation– PS-16 (6.1.4 Ambient Conditions) requires ambient condition affects
PS-16 states that if ambient sensors are not used then sufficient data must be provided to show that ambient conditions do not affect the model accuracy
Copyright © 2009 Rockwell Software. All rights reserved.

Impact of Ambient Conditions
A 25% change in Humidity results in a 12% change in the NOx output.
Weather and seasonal changes can result in humidity changes as much as 50%.
75%
50%
39.89ppm NOx
46.11ppm NOx
Copyright © 2009 Rockwell Software. All rights reserved.

Copyright © 2009 Rockwell Automation, Inc. All rights reserved.
Software CEM®
Summary

How is Software CEM® Different?
Cost Effective Monitoring & Compliance• Up to 50% less cost to install and maintain than hardware CEMS• No specially trained technicians/dangerous environments/hazardous materials• No consumable products, thus no increase in material operating costs
Highly Accurate & Reliable Emissions Monitoring & Reporting• Continuous, real time sensor validation & emission performance• Meets or exceeds regulatory uptime requirements (~99% - 100%) • 100% data validation lowers the risk of inaccurate reporting
Environmental and Industry Experience & Expertise• 1st to patent & introduce (1993) a software-based alternative • 100% Certification Record with 250+ PEMS installations• Proven global applications in major industries • Active member of environmental quality technical support groups
Copyright © 2009 Rockwell Software. All rights reserved.

Software CEM® Highlights
• Nonlinear Hybrid Modeling Methodology– Reliability based on real-time continuous sensor validation – High accuracy by design using non-linear process modeling
• Data set is not the model– Once the model is validated it no longer uses the test data
• Meets all USEPA requirements for PEMS– 40 CFR Part75; Subpart E for “Alternative Monitoring Systems”– 40 CFR Part 60; Appendix A, Performance Specification 16 (PS-16)
• Over 250 applications of diverse emission sources and types as well as local, state, national and global regulatory experience
– Greater than 40% of installed Software CEMs are customer or independently maintained and supported
Copyright © 2009 Rockwell Software. All rights reserved.

Copyright © 2009 Rockwell Automation, Inc. All rights reserved.
Software CEM®
Case Studies

Challenges
Netherlands NOx Emissions Credit Trading• Continuous NOx Emissions Monitoring if > 100 MWth• CEMS (hardware) or PEMS (software)
Performance Requirements• En-14181: QA standards for continuous emissions
monitoring at stationary sources– NOx accuracy ± 20%– Availability > 97%
Gas Turbine• 160 MWth, 19 burners, dry low NOx
Extremely Short Project Schedule• Urgently replace poor performing monitoring system
Gas turbine
0
50
100
150
200
250
5 15 25 35 45 55 65 75 85 95
Load [%]
NO
x [p
pmv]
02468101214161820
Burn
ers
[#]
NOx [ppm]Burners
Pernis, The Netherlands
NOx profile relative to burners in operation
Copyright © 2009 Rockwell Software. All rights reserved.

The Benefits
• Performance– Accurately and reliably predicts NOx emissions on complex sources such as
the dry low NOx gas turbine:• NOx emissions accuracy +/- 9.2% (exceeds the requirement of +/- 20%)• Patented Sensor Validation provides 100% availability
• Fully automated quality assurance testing– Minimal maintenance required (lower TCO)
• Met Tight Project Schedule– Project duration: < 5 weeks including:
• P.O. and contract completion• Model development and deployment• Stack testing• Certification in accordance with EN-14181
• Fast time to value– Quicker ROI
Copyright © 2009 Rockwell Software. All rights reserved.

Boilers with Ultra Low NOx Burner Technology
• Subpart Db Boiler (total 3)– Industrial Powerhouse – 3 – 180MMBTU
• New Air Permit required NOx outputs below 10ppm– New permit required reconfiguration of boilers– Installation of Ultra Low NOx burners and – Firebox extension
• Retrain model for new configuration– Time for all 3 boilers under 8 weeks
• First Ultra Low NOx burner application for a PEM• Passed USEPA and TCEQ certification
– Better then 7.5% relative accuracy
Challenges
Copyright © 2009 Rockwell Software. All rights reserved.

Benefits
• Existing Software CEM reconfigured for low cost • No replacement with Hardware CEM• Cost savings
– Over $1MM in saving over 10 year operating period– No additional personnel needed for HWCEM maintenance– No calibration gases required
Boilers with Ultra Low NOx Burner Technology
Copyright © 2009 Rockwell Software. All rights reserved.

An Gas Compressor Station Ultra Low NOx SCR Application
• Subpart Db Boiler (total 1)– Oil & Gas Compressor and Stripping Station – 1 – 280MMBTU
• New Air Permit required NOx outputs below 10ppm– New permit required reconfiguration of boilers– Installation of SCR with ammonia injection– New boiler installation
• Retrain model for new configuration– Model Boiler and SCR outputs
• First Ultra Low NOx SCR application for a PEMS• Passed USEPA and TCEQ certification
– Better then 6% relative accuracy
Challenges
Copyright © 2009 Rockwell Software. All rights reserved.

Benefits
• Existing Software CEM reconfigured for low cost • No replacement with Hardware CEM• Cost savings
– Over $300K in saving over 10 year operating period– No additional personnel needed for HWCEM maintenance– No calibration gases required
Copyright © 2009 Rockwell Software. All rights reserved.
An Gas Compressor Station Ultra Low NOx SCR Application
Top Related