


Languages
Pages
Legal


http://lib.ulg.ac.be http://matheo.ulg.ac.be
Predicting ratings of Amazon reviews - Techniques for imbalanced datasets
Auteur : Martin, Marie
Promoteur(s) : Ittoo, Ashwin
Faculté : HEC-Ecole de gestion de l'ULg
Diplôme : Master en ingénieur de gestion, à finalité spécialisée en Supply Chain Management and
Business Analytics
Année académique : 2016-2017
URI/URL : http://hdl.handle.net/2268.2/2707
Avertissement à l'attention des usagers :
Tous les documents placés en accès ouvert sur le site le site MatheO sont protégés par le droit d'auteur. Conformément
aux principes énoncés par la "Budapest Open Access Initiative"(BOAI, 2002), l'utilisateur du site peut lire, télécharger,
copier, transmettre, imprimer, chercher ou faire un lien vers le texte intégral de ces documents, les disséquer pour les
indexer, s'en servir de données pour un logiciel, ou s'en servir à toute autre fin légale (ou prévue par la réglementation
relative au droit d'auteur). Toute utilisation du document à des fins commerciales est strictement interdite.
Par ailleurs, l'utilisateur s'engage à respecter les droits moraux de l'auteur, principalement le droit à l'intégrité de l'oeuvre
et le droit de paternité et ce dans toute utilisation que l'utilisateur entreprend. Ainsi, à titre d'exemple, lorsqu'il reproduira
un document par extrait ou dans son intégralité, l'utilisateur citera de manière complète les sources telles que
mentionnées ci-dessus. Toute utilisation non explicitement autorisée ci-avant (telle que par exemple, la modification du
document ou son résumé) nécessite l'autorisation préalable et expresse des auteurs ou de leurs ayants droit.

PREDICTING RATINGS OF AMAZON
REVIEWS
TECHNIQUES FOR IMBALANCED DATASETS
Jury :
Promoter :
Ashwin ITTOO
Readers:
Alessandro BERETTA
Michael SCHYNS
Dissertation by
Marie MARTIN
For a Master’s degree in Business
Engineering with a specialization
in Supply Chain Management and
Business Analytics
Academic year 2016/2017


Acknowledgments
First and foremost, I would like to warmly thank my professor and promoter, Mr. Ashwin
Ittoo, for his time and precious guidance which have been of valuable help throughout the
writing of this dissertation.
I also wish to express my gratitude to the members of the jury, Mr. Alessandro Beretta and
Mr. Michael Schyns, who took the time to read this dissertation.
Also, I would like to acknowledge the Scikit-learn and Stack Overflow Communities who
shared precious information and helped me getting more familiar with computer science,
machine learning and Python language.
Moreover, I would like to thank all the other people who helped me directly or indirectly for
the elaboration of this dissertation.
Finally, I am very grateful to my family, friends and my boyfriend for their continuous
support and encouragement during the completion of this dissertation and throughout the
course of my studies


Table of contents
1. Introduction .......................................................................................................................... 1
2. Theoretical framework ........................................................................................................ 5
2.1 Definition of Machine Learning ....................................................................................... 5
2.2 Distinction between supervised and unsupervised learning ............................................. 5
2.3 Distinction between classification and regression ............................................................ 6
2.4 Text classification ............................................................................................................. 8
2.5 Text classification algorithms ......................................................................................... 10
2.6 Text classification evaluation ......................................................................................... 12
2.7 Imbalanced datasets ........................................................................................................ 15
3. Literature review ................................................................................................................ 19
3.1 Importance of online product reviews from a consumer’s perspective .......................... 19
3.2 Imbalanced distribution of online product reviews ........................................................ 20
3.3 Predicting ratings from the text reviews ......................................................................... 23
3.3.1 Binary classification ................................................................................................. 23
3.3.2 Multi-class classification ......................................................................................... 24
3.3.3 Other approaches ..................................................................................................... 25
4. Methodology ....................................................................................................................... 27
4.1 Approach ........................................................................................................................ 27
4.1.1 Binary text classification - Approach 1 ................................................................... 27
4.1.2 Multi-class classification - Approach 2 ................................................................... 28
4.1.3 Logistic Regression - Approach 3 ............................................................................ 29
4.2 Text classification implementation ................................................................................. 29
4.2.1 Data Gathering ......................................................................................................... 29
4.2.2 Choice of the variables ............................................................................................. 31
4.2.3 Data Cleaning ........................................................................................................... 34
4.2.4 Data Resampling ...................................................................................................... 34
4.2.5 Training a classifier .................................................................................................. 37
4.2.6 Evaluation ................................................................................................................ 37
5. Results ................................................................................................................................. 39
5.1 Videos Games dataset – Experience products ................................................................ 39
5.2 Cell phones and Accessories dataset – Search products ................................................. 45
5.3 Discussion ....................................................................................................................... 49
6. Project Management .......................................................................................................... 53

6.1 Seminar summary ........................................................................................................... 53
6.2 A master thesis seen as a project management approach ............................................... 55
7. Conclusion ........................................................................................................................... 59
List of abbreviations .................................................................................................................. i
Annex 1: Cleaning - Code R ................................................................................................... iii
Annex 2: Sample of annotated reviews ................................................................................. iv
Annex 3: Implementation of text classification - Code Python ........................................... vi
References ............................................................................................................................... vii

1
1. Introduction
Nowadays, a massive amount of reviews is available online. Besides offering a valuable source
of information, these informational contents generated by users, also called User Generated-
Contents (UGC) strongly impact the purchase decision of customers. As a matter of fact, a
recent survey (Hinckley, 2015) revealed that 67.7% of consumers are effectively influenced by
online reviews when making their purchase decisions. More precisely, 54.7% recognized that
these reviews were either fairly, very or absolutely important in their purchase decision making.
Relying on online reviews has thus become a second nature for consumers.
In their research process, consumers want to find useful information as quickly as possible.
However, searching and comparing text reviews can be frustrating for users as they feel
submerged with information (Ganu, Elhada & Marian, 2009). Indeed, the massive amount of
text reviews as well as its unstructured text format prevent the user from choosing a product
with ease.
The star-rating, i.e. stars from 1 to 5 on Amazon, rather than its text content gives a quick
overview of the product quality. This numerical information is the number one factor used in
an early phase by consumers to compare products before making their purchase decision.
However, many product reviews (from other platforms than Amazon) are not accompanied by
a scale rating system, consisting only of a textual evaluation. In this case, it becomes daunting
and time-consuming to compare different products in order to eventually make a choice
between them. Therefore, models able to predict the user rating from the text review are
critically important (Baccianella, Esuli & Sebastiani, 2009). Getting an overall sense of a textual
review could in turn improve consumer experience.
Nevertheless, this predictive task presents some challenges. Firstly, because reviews are human
feedbacks, it may be difficult to accurately predict the rating from the text content. Indeed, users
all have different standards and do not rate a product the same way. For instance a user may
rate a product as good and assign a 5-star score while another user may write the same comment
and give only 3 stars. In addition, reviews may contain anecdotal information, which do not
provide any helpful information and complicates the predictive task. Finally the vocabulary
used can also be very specific according to the product category.

2
The question that arises is how to successfully predict a user’s numerical rating from its review
text content. One solution is to rely on supervised machine learning techniques such as text
classification which allows to automatically classify a document into a fixed set of classes after
being trained over past annotated data. For instance, when presented to the following review
“Amazing movie, I really recommend it, it was one of the best I have ever seen”, we expect a
5-star rating to be returned while in the case of “Worst scenario ever, this movie is really bad”,
a rating of 1-star is expected.
Three different approaches will be presented, namely binary classification, multi-class
classification and logistic regression. More practically, binary classification1 is a simple
technique and a good baseline to start the investigation as it allows customers to compare
products that are good or not. On the other hand, using multi-class classification or logistic
regression can refine the analysis as it informs the customer on how good the product is (scale
from one to five), which is an extreme precious information when consumers want to compare
several products.
In this dissertation, three different classifiers (Naïve Bayes, Support Vector Machine (SVM)
and Random Forest) that are considered as the state-of-the-art for text classification (Pawar &
Gawande, 2012) will be trained on two different datasets from Amazon. Eventually, the
performance of those classifiers will be tested and assessed thanks to accuracy metrics,
including precision, recall and f1-score.
However, one challenge that cannot be overlooked is the issue of class imbalance. The datasets
are relatively skewed in terms of class distribution. This issue is particularly acute for the case
of binary classification. For instance, there are significantly more reviews with 3, 4 and 5-star
ratings than there are reviews with 1 and 2 stars (assuming 2 classes, {1, 2 stars} and {3, 4, 5
stars}). The issue is still present for the multi-class case, with an over-representation of 5-star
ratings.
We overcome this issue by applying sampling techniques to even out the class distributions.
1 Ratings are separated into two classes: high and low ratings

3
Our main contributions are as follows:
- We investigate the performance of state-of-the-art classifiers for addressing the issue of
star rating prediction of online reviews
- We deal with the issue of class imbalance by investigating a number of balancing
techniques
Our results show that the two most successful classifiers are Naïve Bayes and SVM, with a
slight advantage for the latter one in both datasets. Binary classification shows quite good
results (best f1-score of 0.84) while making more precise predictions (i.e. scale from 1 to 5) is
significantly a harder task, our best reported f1-score being 0.57.
From a more practical perspective, our approach enables users’ feedbacks to be automatically
expressed on a numerical scale and therefore to ease the consumer decision process prior to
making a purchase. This can in turn be extended to various other situations where no
numerical rating system is available. As an example, it can be used in order to predict ratings
from articles or blogs related to books or movies or even comments on YouTube or Twitter.
This dissertation is structured as follows.
We will start by giving key information regarding machine learning and more specifically text
classification.
In chapter 3, we analyze the information available in the literature. Aside from figuring out how
consumers are effectively using product reviews and their associated star-ratings to make
purchase decisions as well as emphasizing on the imbalanced distribution of the online reviews,
this chapter outlines the different approaches undertook by researchers to predict ratings from
the text content of reviews.
Chapter 4 is devoted to the methodology and the implementation of the predictive task. After
presenting the chosen approaches, we explain how data was collected and cleaned. Then we
identify the variables of interest and focus on the resampling step in order to cope with the
imbalanced structure of the data. Finally, we describe the two main steps of text classification,
namely training and testing.
Afterwards, chapter 5 presents the results obtained from the implementation of this predictive
task. We compare the different models for the two datasets based on standard performance
metrics.

4
The objective of chapter 6 is to explain how this dissertation falls within the framework of a
structured project management approach such as exposed during the seminar given by Jean-
Pierre Polonovski.
Finally, chapter 7 will summarize the different approaches investigated in this dissertation as
well as the results obtained and propose some practical applications of the model. Eventually,
a few suggestions will be recommended for further improvements and future research.

5
2. Theoretical framework
This chapter aims at briefly introducing and defining key concepts in relation to machine
learning that are relevant to the topic of this dissertation. More precisely, machine learning and
its terminology will first be defined. Secondly, a distinction between supervised and
unsupervised learning will be made. Also, the terms classification and regression will be
distinguished. Afterwards, the emphasis will be put on the definition of text classification, the
way it can be modeled and assessed. Finally, the subject of imbalanced datasets will be
addressed.
2.1 Definition of Machine Learning
According to Awad and Khanna (2015), “Machine learning is a branch of artificial intelligence
that systematically applies algorithm to synthesize the underlying relationships among data and
information”.
In the field of machine learning, data are stored in tabular format. Each row is known as a record
(also named as instance or observation) while each column is known as an attribute (also known
as feature or input).
2.2 Distinction between supervised and unsupervised learning
There are two main categories of machine learning: supervised and unsupervised learning.
Supervised learning (also known as predictive modeling) is the process of extracting
knowledge from data to subsequently predict a specific outcome (binary or any level) in a
new/unseen situation. Note that the features used to predict the class are named the independent
variables, whereas the predicted class is known as the dependent variable (also named as
response, target or outcome).
More precisely, the two main steps of supervised learning, also depicted in Figure 2.1, are the
following ones:
a) Learn a model from the dataset composed of annotated data. This step is called
training because the model is learning the relationship between the attributes of the data
(inputs) and its outcome (output).
b) Use the model to make accurate predictions on new (unseen) data. This step enables
to test the developed machine learning algorithm.

6
In other words, the primary goal of supervised learning is to model an input-output system
based on labeled data that accurately predicts the future data.
Figure 2.1: Supervised machine learning model2
Supervised learning has numerous applications in various domains ranging from disease
diagnostic tools based on biological and clinical data of a patient to financial market analysis.
In contrast, unsupervised learning is the process of extracting structure from data or to learn
how to best represent data. In this case, instances do not have pre-defined classes as target
outputs (unknown outputs). The aim of unsupervised learning tasks is to discover patterns or
detect any association between features in unlabeled datasets. Two widespread examples of
unsupervised learning are clustering (grouping similar instances into clusters) and
dimensionality reduction.
This dissertation will primarily focus on supervised learning.
2.3 Distinction between classification and regression
As a reminder, three types of variables can be differentiated:
- Binary variables, taking only two different values
- Categorical variables, taking two or more possible nominal values.
Note that a binary variable is also a categorical variable.
- Numerical variables whose values are numbers
2 Source : http://www.allprogrammingtutorials.com/tutorials/introduction-to-machine-learning.php

7
Depending on their output domains, supervised learning tasks can be classified into two
categories:
- Classification tasks, which either have binary outputs or categorical outputs, meaning
that the class to be predicted takes on a finite set of nominal values.
Classification consists in assigning new, previously unseen instances to a predefined
class, based on the knowledge acquired by training over past data, annotated with their
respective classes.
- Regression tasks, which take on numerical outputs. The class to be predicted is ordered
such as the price of a building or the high of a person.
Regression is a process that estimates the relationship between a dependent variable Y
(output) and one or more independent variables X (inputs). More precisely, regression
aims at understanding how the dependent variable is affected by the variation of the
independent variables.
Two types of regression can be observed. While in the linear regression, the outcome
is continuous, the logistic regression only takes on discrete target values and thus only
has a limited number of possible values to be predicted. Despites its name, logistic
regression is a model used for classification problems and is used to estimate the
probability to pertain to a specific class.
Figure 2.2: Comparison between Linear Regression and Logistic Regression3
3 Source: Lecture notes of Business Analytics.

8
2.4 Text classification
As mentioned previously, classification is a supervised machine learning task which aims at
creating a model to make predictions. This model is trained on annotated past data.
Text classification, also known as text categorization, is an extension of the classification
problem over structured data. According to Sebastiani (2002), given a collection of documents,
D, and a fixed set of classes C, the aim is to learn a classifier γ using a classification algorithm
and predict the best possible class c ∊ C for each document d.
Instead of manually assigning a class to each document, which can be extremely time-
consuming, text classification enables to automatically decide which predefined category the
text document belongs to, based on human-labeled training documents.
Sebastiani (2002) also separates text classification problems into different types based on the
number of classes a document can belong to:
- Binary classification: there are exactly two classes and each document belongs to one
class or the other, i.e. simple sentiment analysis (positive or negative), spam filtering
(spam or non-spam).
- Multi-class classification: there are more than two classes (categorical outputs) and
each document belongs to exactly one single class. Two types of multi-class
classification are observed:
a) Non-ordinal classification, where C = {c1, …, cn}, with n > 2, i.e. movie genre
classification (action, comedy, drama, etc.)
b) Ordinal classification, where C = c1 < … < cn , with n > 2, i.e. product reviews
classification (1-star, 2-star, 3-star, 4-star or 5-star) where the first class is
considered as the worst and the last one as the best.
Note that binary classification is a special case of multi-class classification.
- Multi-labels classification: there are more than two classes and each document can
pertain to one, several, or none of these classes, i.e. an article can treat the subject of
finance, politics and economy at the same time or none of these.

9
In our work, all reviews can belong to exactly one class. Thus, our task is that of multi-class
classification. It can also be reformulated as a binary classification by grouping the classes, for
e.g. {1, 2 stars} and {3, 4, 5 stars}. The case of multi-label is therefore not applicable to us.
In order to apply text classification, the unstructured format of text has to be converted into a
structured format for the simple reason that it is much easier for computer to deal with numbers
than text. This is mainly achieved by projecting the textual contents into Vector Space
Model, where text data is converted into vectors of numbers.
In the field of text classification, documents are commonly treated like a Bag-of-Words
(BoW), meaning that each word is independent from the others that are present in the document.
They are examined without regard to grammar neither to the word order4. In such a model, the
term-frequency (occurrence of each word) is used as a feature in order to train the classifier.
However, using the term frequency implies that all terms are considered equally important. As
its name suggests, the term frequency simply weights each term based on their occurrence
frequency and does not take the discriminatory power of terms into account. To address this
problem and penalize words that are too frequent, each word is given a term frequency-
inverse document frequency (tf-idf) score which is defined as follow:
t𝑓 − id𝑓𝑡,𝑑 = t𝑓t,d ∗ id𝑓t
where:
t𝑓t,d = nt,d
∑ 𝑛𝑘,𝑑𝑘 with nt,d the number of term t contained in a document d, and
∑ 𝑛𝑘,𝑑𝑘 the total number of terms k in the document d
id𝑓t = log𝑁
𝑑𝑓𝑡 with N the total number of documents and dft the number of documents
containing the term t
Tf-idf reflects the relative frequency of a term in a set of documents. Therefore, a word
occurring too often in a set of documents will be considered as less significant while a word
appearing only in a few documents will be regarded as more important.
4 The Bag-of-word model presents two major weaknesses. It ignores the order of words as well as the semantic
relation between words. An alternative to cope with this issue is to consider the n-gram model, which can be seen
as all the combinations of contiguous words of length n in a text document. It is called a unigram when the value
of n is 1 and a bigram when n equals to 2.
10
Other features can be used in the framework of text classification such as part-of-speech (POS)
which consists in translating words into their nature (e.g. noun, adjective, verb and so on).
Finally, text categorization has numerous and widespread applications in the real world such as
opinion mining, language identification or genre classification.
To recap, 4 steps are essential to develop a text classification algorithm:
1) Structure the data
2) Chose the most pertinent features. Commonly, the words with the higher tf-idf scores
will be selected.
3) Use these features to train a classification algorithm
4) Evaluate the trained classifier to determine its predictive accuracy
2.5 Text classification algorithms
Text classification can be performed using different algorithms. In this context, algorithms
implementing classification are called classifiers. In this section, only the most used classifiers
for text classification (Pawar & Gawande, 2012) will be presented.
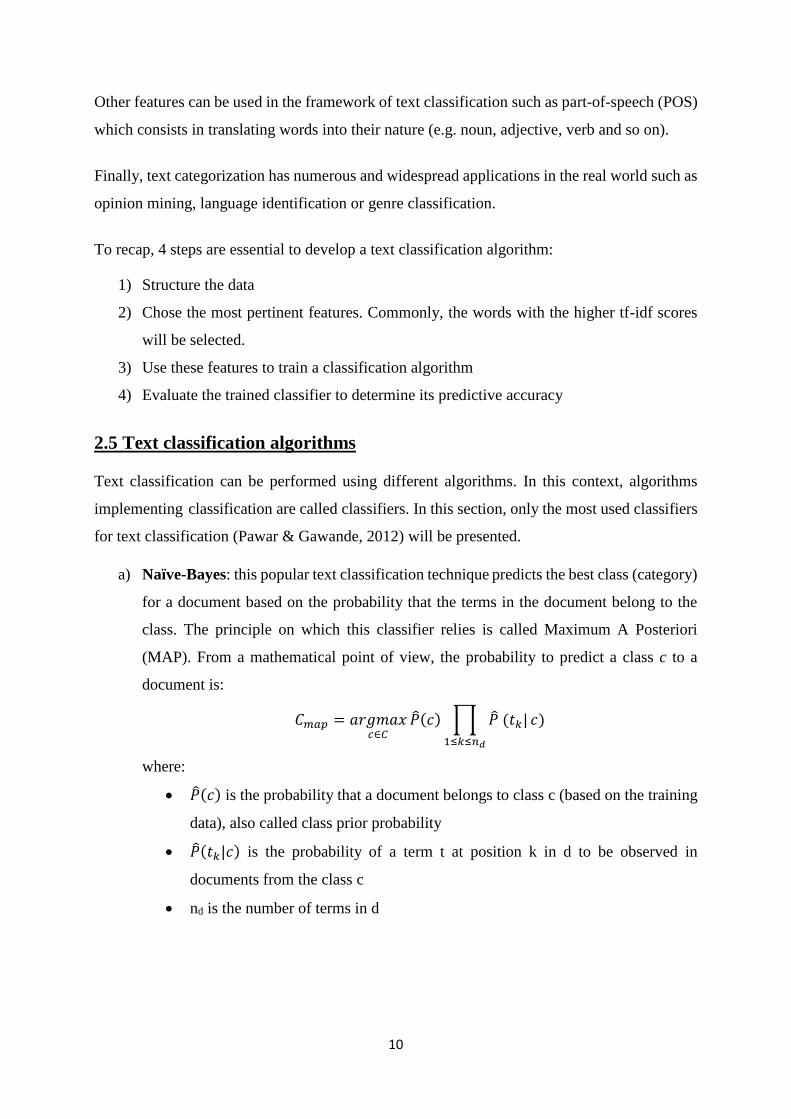
a) Naïve-Bayes: this popular text classification technique predicts the best class (category)
for a document based on the probability that the terms in the document belong to the
class. The principle on which this classifier relies is called Maximum A Posteriori
(MAP). From a mathematical point of view, the probability to predict a class c to a
document is:
𝐶𝑚𝑎𝑝 = 𝑎𝑟𝑔𝑚𝑎𝑥𝑐∈𝐶
�̂�(𝑐) ∏ �̂� (𝑡𝑘|
1≤𝑘≤𝑛𝑑
𝑐)
where:
�̂�(𝑐) is the probability that a document belongs to class c (based on the training
data), also called class prior probability
�̂�(𝑡𝑘|𝑐) is the probability of a term t at position k in d to be observed in
documents from the class c
nd is the number of terms in d
11
Despite its naïve assumptions (conditional independence5 and positional
independence6), the multinomial Naïve-Bayes classifier works reasonably well in
practice (Zhang, 2004).
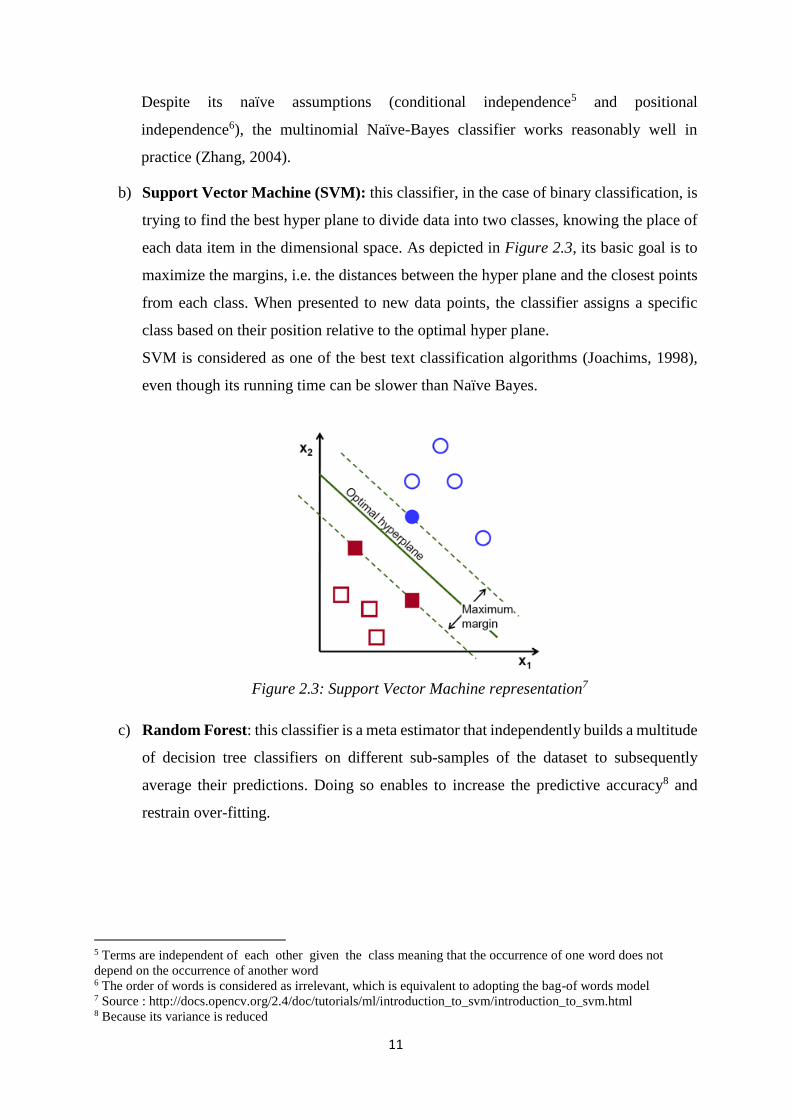
b) Support Vector Machine (SVM): this classifier, in the case of binary classification, is
trying to find the best hyper plane to divide data into two classes, knowing the place of
each data item in the dimensional space. As depicted in Figure 2.3, its basic goal is to
maximize the margins, i.e. the distances between the hyper plane and the closest points
from each class. When presented to new data points, the classifier assigns a specific
class based on their position relative to the optimal hyper plane.
SVM is considered as one of the best text classification algorithms (Joachims, 1998),
even though its running time can be slower than Naïve Bayes.
Figure 2.3: Support Vector Machine representation7
c) Random Forest: this classifier is a meta estimator that independently builds a multitude
of decision tree classifiers on different sub-samples of the dataset to subsequently
average their predictions. Doing so enables to increase the predictive accuracy8 and
restrain over-fitting.
5 Terms are independent of each other given the class meaning that the occurrence of one word does not
depend on the occurrence of another word 6 The order of words is considered as irrelevant, which is equivalent to adopting the bag-of words model 7 Source : http://docs.opencv.org/2.4/doc/tutorials/ml/introduction_to_svm/introduction_to_svm.html 8 Because its variance is reduced
12
2.6 Text classification evaluation
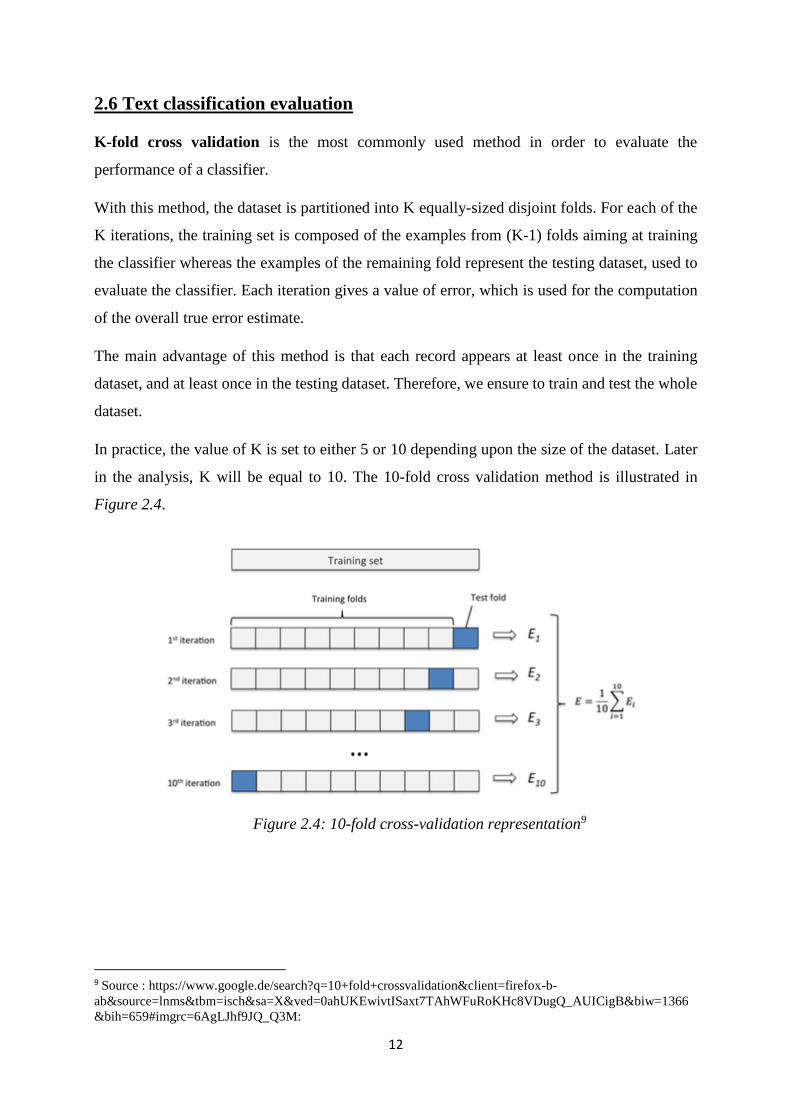
K-fold cross validation is the most commonly used method in order to evaluate the
performance of a classifier.
With this method, the dataset is partitioned into K equally-sized disjoint folds. For each of the
K iterations, the training set is composed of the examples from (K-1) folds aiming at training
the classifier whereas the examples of the remaining fold represent the testing dataset, used to
evaluate the classifier. Each iteration gives a value of error, which is used for the computation
of the overall true error estimate.
The main advantage of this method is that each record appears at least once in the training
dataset, and at least once in the testing dataset. Therefore, we ensure to train and test the whole
dataset.
In practice, the value of K is set to either 5 or 10 depending upon the size of the dataset. Later
in the analysis, K will be equal to 10. The 10-fold cross validation method is illustrated in
Figure 2.4.
Figure 2.4: 10-fold cross-validation representation9
9 Source : https://www.google.de/search?q=10+fold+crossvalidation&client=firefox-b-
ab&source=lnms&tbm=isch&sa=X&ved=0ahUKEwivtISaxt7TAhWFuRoKHc8VDugQ_AUICigB&biw=1366
&bih=659#imgrc=6AgLJhf9JQ_Q3M:

13
Assessing the performance of algorithms is essential as it illustrates how well the algorithm
performs in its classification and also helps choosing the more accurate classifier. The output
quality (prediction performance) of a supervised learning model can be evaluated through
different metrics that can be best understood with a confusion matrix.
A confusion matrix compares the actual classification against the predicted classification for
each binary classification problem.
Predicted Positive Predicted Negative
Actual Positive TP FN
Actual Negative FP TN
Figure 2.5: Confusion matrix
Four categories of predictions can be encountered:
- True Positive (TP): predictions accurately predicted as positive
- True Negative (TN): predictions accurately predicted as negative
- False Positive (FP): predictions incorrectly predicted as positive (predictions that
should be negative but were predicted as positive)
- False Negative (FN): predictions incorrectly predicted as negative (predictions that
should be positive but were predicted as negative)
In brief, in the two last cases, the model wrongly predicts the samples.
From this confusion matrix, some metrics assessing the quality of a classifier can be computed:
- 𝐄𝐫𝐫𝐨𝐫 𝐫𝐚𝐭𝐞 =𝐹𝑃+ 𝐹𝑁
𝑇𝑃+𝑇𝑁+𝐹𝑁+𝐹𝑃
- 𝐀𝐜𝐜𝐮𝐫𝐚𝐜𝐲 = 1 − error rate =𝑇𝑃+ 𝑇𝑁
𝑇𝑃+𝑇𝑁+𝐹𝑁+𝐹𝑃
These two metrics simply estimate the ratio between the number of incorrect (resp. correct)
classifications made by the classifier and the total number of test cases. However, they are not
suitable in many applications and present two significant issues. Firstly the error rate and the
accuracy do not differentiate the false negatives from the false positives or the true positives
from the true negatives. Indeed, two classifiers can return identical values for the accuracy or
error rate and lead to a completely different outcome resulting in an increase of either the
number of false alarms, i.e. false positives, or the number of misses, i.e. false negatives.

14
Moreover, when presented with imbalanced datasets10, the error rate and accuracy metrics tend
to be too optimistic, leading to incorrect results.
Therefore, text classification problems are usually evaluated through other metrics commonly
used in the field of information retrieval11. These metrics include precision, recall and F1-score.
- 𝐏𝐫𝐞𝐜𝐢𝐬𝐢𝐨𝐧 =𝑇𝑃
𝑇𝑃+𝐹𝑃
Precision is interpreted as the proportion of all positive predictions that are correct. In
other words, it measures the exactness of the classifier.
- 𝐑𝐞𝐜𝐚𝐥𝐥 =𝑇𝑃
𝑇𝑃+ 𝐹𝑁
Recall, also known as sensitivity, is interpreted as the proportion of actual positive
observations that were predicted correctly. It thus measures the completeness of the
classifier.
Precision and recall metrics are included between 0 and 1. The higher the precision and
the recall, the better the classifier is. An increase in the precision is often accompanied
by a decrease in recall. Both precision and recall are important, but for different
applications. Some applications will favor high precision while other applications will
favor high recall.
- 𝐅𝟏 − 𝐬𝐜𝐨𝐫𝐞 =2 ∗ 𝑃𝑟𝑒𝑐𝑖𝑠𝑖𝑜𝑛 ∗ 𝑅𝑒𝑐𝑎𝑙𝑙
𝑃𝑟𝑒𝑐𝑖𝑠𝑖𝑜𝑛 + 𝑅𝑒𝑐𝑎𝑙𝑙
The precision and recall can be combined into a single metric called f1-score. This
metric is the harmonic mean of the precision and recall and gives them equal weights.
An f1-score also reaches its best value at 1 and worst score at 0.
10 Explained in section 2.7 11 Research field in which methods are developed in order to retrieve information from huge text collections

15
2.7 Imbalanced datasets
When dealing with data in the context of classification, two different specific cases can be
encountered. The datasets can either be balanced (Figure 2.6) or imbalanced (Figure 2.7). In
the former case, data present approximately a similar distribution for the different classes of
interest. In contrast, imbalanced datasets refer to a situation in which classes are not equally
represented. In the specific case of binary classification, the number of instances belonging to
one class is significantly lower than those pertaining to the other class.
Figure 2.6: Balanced dataset Figure 2.7: Imbalanced dataset12
According to Fawcett (2016), “Conventional algorithms are often biased towards the majority
class because their loss functions attempt to optimize quantities such as error rate, not taking
the data distribution into consideration. In the worst case, minority examples are treated as
outliers of the majority class and ignored. The learning algorithm simply generates a trivial
classifier that classifies every example as the majority class.”
This example perfectly illustrates the issue of imbalanced datasets occurring in classification
problems.
In order to tackle imbalanced classification problems which are becoming increasingly present,
various resampling methods exist. They aim at balancing data before it is provided as inputs
to the training step of the machine learning task. Three main methods are developed hereunder.
12 Source : Fawcet, 2016

16
1. Undersampling
As can be seen on the Figure 2.8, undersampling aims at balancing the dataset distribution
by randomly removing some observations from the majority class until the dataset is
balanced out. The drawback of this method is that it removes observations from the majority
class and therefore may lead to important information loss in the training dataset.
Figure 2.8: Undersampling representation13
2. Oversampling
In contrast to undersampling, oversampling aims at randomly replicating instances from the
minority class (and thus increasing the minority population) until both classes of the dataset
get balanced as illustrated in Figure 2.9. Even if this method has the advantage not to lose
information, replicating instances in the training dataset may lead to overfitting14.
Figure 2.9: Oversampling representation15
13 Source : Fawcet, 2016 14 Overfitting is said to occur when the classification tasks achieves high accuracy on the training dataset, but
performs poorly when presented with new test datasets, i.e. when it has to predict new unseen instances 15 Source : Fawcet, 2016
17
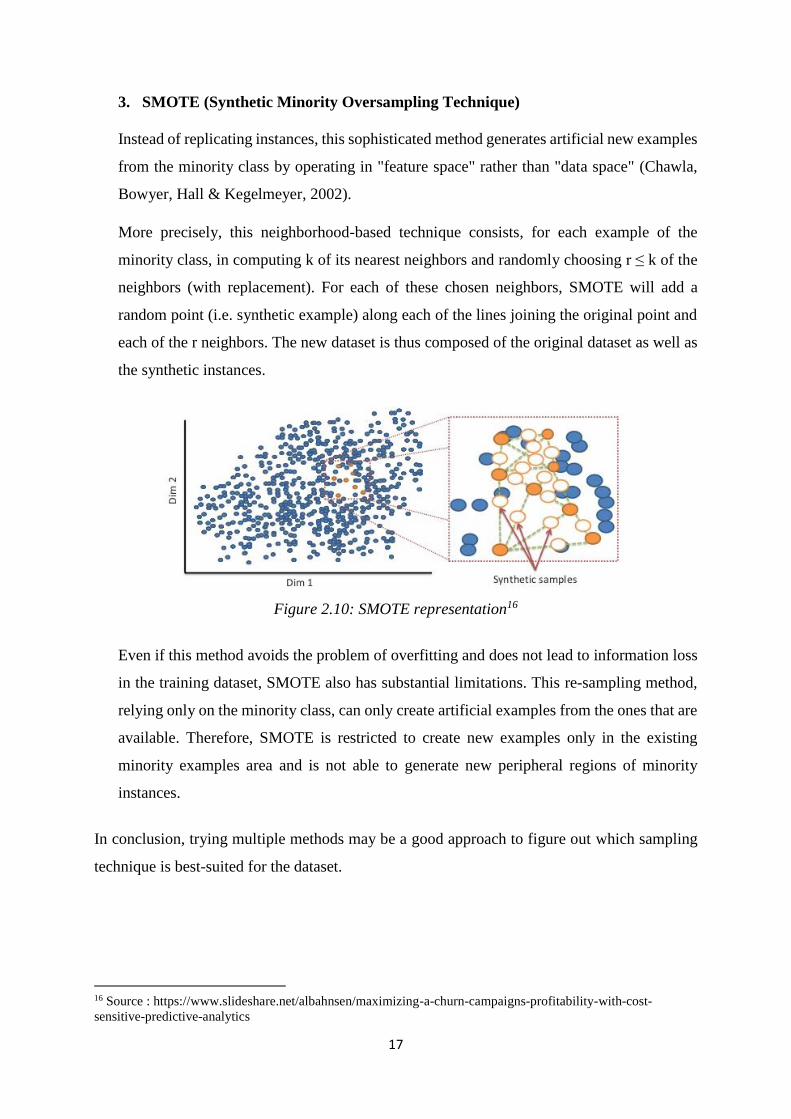
3. SMOTE (Synthetic Minority Oversampling Technique)
Instead of replicating instances, this sophisticated method generates artificial new examples
from the minority class by operating in "feature space" rather than "data space" (Chawla,
Bowyer, Hall & Kegelmeyer, 2002).
More precisely, this neighborhood-based technique consists, for each example of the
minority class, in computing k of its nearest neighbors and randomly choosing r ≤ k of the
neighbors (with replacement). For each of these chosen neighbors, SMOTE will add a
random point (i.e. synthetic example) along each of the lines joining the original point and
each of the r neighbors. The new dataset is thus composed of the original dataset as well as
the synthetic instances.
Figure 2.10: SMOTE representation16
Even if this method avoids the problem of overfitting and does not lead to information loss
in the training dataset, SMOTE also has substantial limitations. This re-sampling method,
relying only on the minority class, can only create artificial examples from the ones that are
available. Therefore, SMOTE is restricted to create new examples only in the existing
minority examples area and is not able to generate new peripheral regions of minority
instances.
In conclusion, trying multiple methods may be a good approach to figure out which sampling
technique is best-suited for the dataset.
16 Source : https://www.slideshare.net/albahnsen/maximizing-a-churn-campaigns-profitability-with-cost-
sensitive-predictive-analytics

18

19
3. Literature review
The aim of this chapter is to provide readers with an understanding of the different
approaches that have been developed in the recent years to address the problem of predicting a
rating from its text review. The first section of this chapter describes the way online consumers
effectively use product reviews and their associated rating to base their purchasing decisions.
The second section is dedicated to the specific distribution of ratings, which has major
implications on the way data have to be treated to be later used with supervised machine
learning. Finally, the third section relates the different approaches undertook to address this
predictive problem.
3.1 Importance of online product reviews from a consumer’s perspective
The article written by Lackermair, Kailer and Kanmaz (2013) introduces the field of online
reviews and star-rating systems and aims at understanding how customers are using product
reviews information for their buying decision.
According to the authors, product reviews and ratings represent an important source of
information17 for consumers and are helpful tools in order to support their buying decisions.
They also found out that consumers are willing to compare both positive and negative reviews
when searching for a specific product. However, reading and comparing textual product reviews
to get an overall sense can be time-consuming and difficult, especially due to their unstructured
nature and long contents. On the basis of this finding, the authors divided the decision making
process for online purchasing into different phases that are depicted on Figure 3.1.
As the number of available product reviews can be consequent, going directly through all of
them is not efficient in an early phase. The authors argue that customers need compact and
concise information about the products. Therefore consumers first need to pre-select the
potential products matching their requirements. With this aim in mind, consumers use the star-
ratings as an indicator for selecting products. Later, when a limited amount of potentials
products have been chosen, reading the associated text review will reveal more details about
the products and therefore help consumers making a final decision.
17 More precisely, the survey conducted revealed that online reviews are considered as important or very
important by 74.04% of the participants, while 4.80% claim that reviews are rather unimportant or not important.
The remaining percentages refer to online reviews seen as neutral.

20
Figure 3.1: Decision making process for online purchasing18
3.2 Imbalanced distribution of online product reviews
The distribution of rating scores has been the subject of various research. Among others, Hu,
Pavlou and Zhang (2009) attempt to understand and demonstrate the existence of a recurrent J-
shaped distribution19 in the majority of Amazon product reviews.
In their article, Hu et al. (2009) calculate the distribution of product ratings for three Amazon
product categories: books, DVDs, and videos. As shown in Figure 3.2, data analysis of these
product reviews reveals a J-shaped distribution where positive reviews are predominant.
Broadly speaking, more than 50% of the reviews are assigned a 5-star rating, followed by 4-
star or 1-star, while very few rewiews belong to the 2-star and 3-star category.
Figure 3.2: J-shaped distribution of product reviews on Amazon20
18 Source : Lackermair, Kailer and Kanmaz, 2013 19 A J-shaped distribution is defined as an extremely asymmetrical frequency distribution where the final frequency
group is represented by the highest frequency, with smaller frequencies elsewhere 20 Source : Hu, Pavlou and Zhang, 2009

21
According to the authors, the J-shaped distribution of products reviews can be explained by two
sources of bias: purchasing bias and under-reporting bias. As a matter of fact, only people
who are interested in a product buy this product and have the opportunity to rate it (purchasing
bias). Customers who purchase a product are therefore more likely to positively review a
product. Moreover, they tend to review products only when they are either really satisfied or
unsatisfied (“brag or moan” model). People with a moderate appreciation will generally not
spend time writing a review (under-reporting bias).
Other authors (Chevalier and Mayzlin (2006), Kadet (2007)) also analyze the distribution of
ratings in online reviews and come to the same conclusion: the resulting data presents an
asymmetric bimodal distribution, where reviews are overwhelmingly positive.
Max Woolf (2017) illustrates and generalizes the J-shaped distribution of online reviews to
various Amazon product categories. The figures hereunder show how user ratings are
distributed among the reviews.
Figure 3.3: Distribution of ratings for electronics reviews21
21 Source: Woolf, 2017

22
Figure 3.4: Distribution of ratings by product category22
In order to alleviate the problem of class imbalance in classification, resampling methods
aiming at balancing the datasets have been the focus of various research23. More specifically,
Chawla, Bowyer, Hall and Kegelmeyer (2002) concentrate on a novel technique called
SMOTE. This resampling technique is by far the most known for its effectiveness and
simplicity. It has been extensively studied in the literature giving rise to many variants of the
original method. However, we will stick to the initial version of SMOTE in the framework of
this dissertation.
Numerous experiments including Dal Pozzolo, Caelen and Bontempi (2013) were conducted
on a variety of datasets to measure the performance of the different sampling techniques. They
show that the SMOTE approach clearly outperforms the other existing resampling techniques
22 Source: Woolf, 2017 23 These studies were not conducted in the particular case of star rating prediction but in a broader context of
imbalanced datasets

23
(under and oversampling) resulting in better classification performance in most of the cases.
Blagus and Lusa (2013) nuance these findings. While SMOTE is effectively beneficial when
presented to low-dimensional data, this sampling method is not effective in most circumstances
when data are high-dimensional, sometimes showing a worst performance than the random
undersampling method.
3.3 Predicting ratings from the text reviews
Predicting ratings from text review cannot be achieved by humans given the huge amount of
existing datasets. Fortunately, machine learning and more specifically text classification
techniques have been extensively studied over the past years enabling to automatically learn
from raw data.
The aim of this section is to describe the different approaches and techniques that have been
lately developed to take up the challenge of predicting ratings from the text review itself. This
section is divided into three parts. The first and second parts focus on respectively binary and
multi-class classification, while the third part concentrates on slightly different approaches to
achieve this text classification task.
3.3.1 Binary classification
Pang, Lee and Vaithyanathan (2002) approach this predictive task as an opinion mining
problem enabling to automatically distinguish between positive and negative reviews24. In order
to determine the reviews polarity, the authors use text classification techniques by training and
testing binary classifiers on movie reviews containing 36.6% of negative reviews and 63.4% of
positive reviews. On the top of that, they also try to identify appropriate features to enhance the
performance of the classifiers. For instance, linguistic features such as Part-of-speech are
implemented but do not yield greater results.
Among others, they compare the performance of Naïve Bayes and SVM. The latter one shows
better results reaching an accuracy of 82.1%. Even if the results obtained are fairly good, the
machine learning methods used show poorer results on sentiment classification than on
traditional topic-based classification, which is probably due to the complexity of capturing
opinions from text.
24 Reviews are considered as positive when they have at least 3 stars out of 5, while reviews are said to be negative
when they received less than 3 stars.

24
Dave, Lawrence, and Pennock (2003) also deal with the issue of class imbalance with a majority
of positive reviews and show similar results. SVM outperforms Naïve Bayes with an accuracy
greater than 85% and the implementation of part-of-speech as well as stemming25 is also
ineffective. Nevertheless, while the previous research lead to better results with unigrams, this
study shows that bigrams turn out to be more effective at capturing context than unigrams in
the specific case of their datasets.
Note that both experiments only take into account the simple accuracy metric as other metrics
such as precision and recall do not provide more details to assess the performance of the
classifiers.
3.3.2 Multi-class classification
Unlike the two previous experiments, other research focus on a finer-grained classification.
Instead of only classifying reviews as positive or negative, they attempt to predict the exact
score of the rating based on its text content. In this context, authors explore numerous features
from the text review (e.g. linguistic features) in order to enhance the performance of the
classifiers.
With this aim in mind, Fan and Khademi (2014) experiment a combination of four different
machine learning algorithms with three feature generations methods26 using a corpus from the
Yelp dataset27. The best prediction result is achieved with the linear regression with top frequent
words extracted from raw data, with a root mean square error of 0.6014. Respectively, the linear
regression with the top frequent words and adjectives after doing part-of-speech analysis on all
reviews has a root mean square error of 0.6488 and 0.6052. So, implementing part-of-speech
does not produce better results.
Pang and Lee (2005) have a quite different approach. They restrict the five classes to only four
in order to cope with the imbalanced distribution of the movie reviews. They suggest an item
similarity measure28 and compare three different algorithms (one vs all, regression, and metric
labelling29), all based on SVM. Combining metric labelling and this novel measure outperforms
the two other algorithms, reaching an accuracy of 0.61.
25 Stemming aims at reducing words to their roots 26 The approach under the three feature generations methods is to “create bag-of-words from the top frequent
words in all raw text reviews, or top frequent words/adjectives from results of part-of-speech analysis” 27 The authors do not mention if they deal with the issue of imbalanced data or not 28 Based on the positive-sentence percentage 29 Labels relations can be measured by a distance metric (ordinal scale)
25
Finally it is important to note that surprisingly, only a few studies have attempted to predict the
star rating with a similar approach as ours. Moreover, they do not necessarily emphasize on the
way they overcome the issue of imbalanced datasets.
3.3.3 Other approaches
Some authors emphasize on other details and try to understand how to better predict the star
ratings. Among others, this sub-section will introduce new independent variables to take into
account such as the reviewer and product information as well as the bag of opinion model.
Li, Liu, Jin, Zhao, Yang and Zhu (2011) bring a new perspective to the review rating prediction
task. As stated in the title of their research paper, they incorporate the reviewer and product
information in order to predict review ratings more accurately. This is achieved with a three-
dimension tensor medialization where each dimension pertains to the reviewer, product or text
feature.
The implementation of this new model results from the observation of two different bias.
a) User bias: consumers may express differently their preferences. For instance, one
consumer may review a medium quality product as good, while another consumer may
use the same term for an outstanding product.
b) Product bias: an opinion word can have different meanings depending on the product
category. For instance, the word “long” gives a positive opinion to a cellphone’s battery
life, while the same word has a negative connotation for a camera’s focus time.
Therefore, it is essential to consider other independent variables such as the author of the review
as well as the target category when predicting review ratings
In a slightly different perspective30, McAuley and Leskovec (2013) intend to understand hidden
dimensions of customer’s opinions to better predict the numerical ratings. They also find out
that the user information is a rich source of information to take into account when predicting
ratings with review text.
Finally, Qu, Ifrim and Weikum (2010) add a new dimension to the problematic of the prediction
of numeric rating from review texts. They introduce a different representation to overcome the
30 Their goal is to predict ratings of products that users have not reviewed yet (collaborative filtering), which
significantly derives from our task of predicting sentiment from text.

26
limitations of the popular unigram (Bag-of-Words) and n-gram representations, respectively
the polarity incoherence and the n-gram sparsity bottleneck.
According to them, a document is represented as a bag of opinions in which opinions consist
of three components:
1. A root word
2. A set of modifier words
3. One or more negation words
For instance, in the text review “not very helpful”, “helpful” corresponds to the opinion root,
“very” belongs to the opinion modifiers and “not” is the negation word.
This model assigns a numeric score to each opinion using a constrained ridge regression based
on several lexicons. More precisely, a prior polarity of the opinion is determined by the opinion
root. Modifiers either increase or weaken the power of the prior polarity. Finally, negation
words strongly decrease or reverse this polarity. In other words, opinion elements scores are
aggregated within one final opinion score, which can be computed by the score function. Figure
3.5 depicts some examples where a numeric score has been computed based on the bag of
opinions method.
Figure 3.5: Example opinions from the Amazon mixed-domain corpus31
Given that each review is assigned a final score, the latter one can be used as a rating system in
order to extrapolate the real star-rating value.
According to the authors, the experiments performed on three different Amazon product
categories (book, movies and music) with the bag of opinions method clearly outperform the
other existing methods used for review rating prediction. It can better understand the expressive
power of opinions, which is not possible using methods such as the bag-of-words model with
regression algorithms.
31 Source: Qu, Ifrim and Weikum, 2010
27
4. Methodology
This chapter is divided into two parts. The first section is devoted to the different approaches
applied in order to implement the text classification task. The second part’s purpose is to explain
the different steps that were carried out in order to develop the machine learning task and
therefore being able to predict the ratings based on the text reviews. More precisely, developing
a machine learning algorithm requires some well-defined steps such as data gathering, choosing
the variables of interest, preprocessing the data, resampling the data, training and finally testing
the algorithm.
4.1 Approach
Three different approaches are presented in order to predict ratings of Amazon reviews from
their text content. First ratings have been separated into two classes (high and low ratings)
leading to a binary classification. The two other approaches concentrate on a deeper analysis
where instances can be classified into five different classes, corresponding to the five existing
star-rating possibilities. This is applied through two different methods: multi-class classification
and logistic regression.
These three distinct approaches enable to understand the complexity of ratings prediction and
figure out which of them performs better in this precise case.
For these three approaches, three different classifiers (Naïve Bayes, SVM, Random forest) will
be tested and evaluated through diverse metrics such as the precision, recall, and f1-score.
4.1.1 Binary text classification - Approach 1
The goal is to predict the opinions conveyed by user reviews from Amazon. For this purpose,
only two classes are used as target output: high and low ratings, which have been defined
with the following threshold:
Low ratings: Rating score < 3 (class 0)
High ratings: 3 ≤ Rating score ≤ 5 (class 1)
The aim of the classifier is to successfully predict whether if a new text review belongs to one
class or another based on the training step that has previously been performed.

28
Figure 4.1: Binary classification representation
Generally, reviews belonging to the high ratings category will positively influence consumers
purchase decision while reviews belonging the low ratings category will tend to discourage
people from buying these reviewed products.
4.1.2 Multi-class classification - Approach 2
A strategy to refine the analysis is to extend binary classifiers to multi-class classification
problems, whose goal is to predict the exact star rating.
In contrast with binary classification, where instances are restricted to two classes, multi-class
classification (also called multinomial classification) aims at classifying instances into one of
more than two classes. The output value can thus go up to k-classes. As illustrated in Figure
4.2, each possible rating value corresponds to one different class. Therefore there are five
distinct classes that instances can be assigned to. Classes are mutually exclusive meaning that
each instance is assigned to one and only one class. For instance, a text review cannot be rated
by 3 and 4 stars at the same time. In short, this classification technique is an extension from the
binary classification, whose aim is to predict more precisely in which class the review is
assigned to.
Figure 4.2: Multi-class classification representation
To address this multi-class classification problem, algorithms previously used can be naturally
extensible to the specific case of having more than two classes. Binary algorithms can thus be
turned into multi-class classifiers. Actually, some classifiers are directly build for multi-class
Amazon text review
5-Star 4-Star 1-Star 2-Star 3-Star
OR OR OR OR
Amazon text review
LOW ratings
1-2 Stars
HIGH ratings
3-5 Stars
OR

29
classification purpose such as Naïve Bayes and logistic regression while other classifiers are
basically binary (SVM for instance) and need further set ups to handle multi-class classification
problems.
4.1.3 Logistic Regression - Approach 3
At first sight, logistic regression and multi-class classification may look quite similar as the
outcome in both approaches is the prediction of one of the five distinct classes. However, they
are theoretically different. In the previous approach, the predicted values are nominal, whereas
in the case of logistic regression, these values are discrete numbers ranging from 1 to 5.
Moreover, regression maintains the order, e.g. 4-rating reviews are better than 1-star reviews.
This notion of ordering is not present in classification. In this case, classifying a real 5-star as
4-star would be considered as more accurate than classifying it as 1-star.
4.2 Text classification implementation
In order to implement text classification, the completion of several well-defined steps is
required. They are depicted in Figure 4.3 and explained in more detail in the following sub-
sections.
Figure 4.3: Text classification steps
4.2.1 Data Gathering
In order to get the required material to achieve this dissertation, files containing consumer
reviews for diverse products derived from Amazon.com were used. These files were collected
by Julian McAuley, researcher at the University of California, and were available on the
following website: http://jmcauley.ucsd.edu/data/amazon/. The extracted files only represented
a subset of the data in which all items and users had at least 5 reviews (5-core). Duplicates,
accounting for less than 1 percent of reviews, were removed.
Data Gathering
Choice of the
variables
Data Cleaning
Resampling Training
Testing
(cross-validation)
30
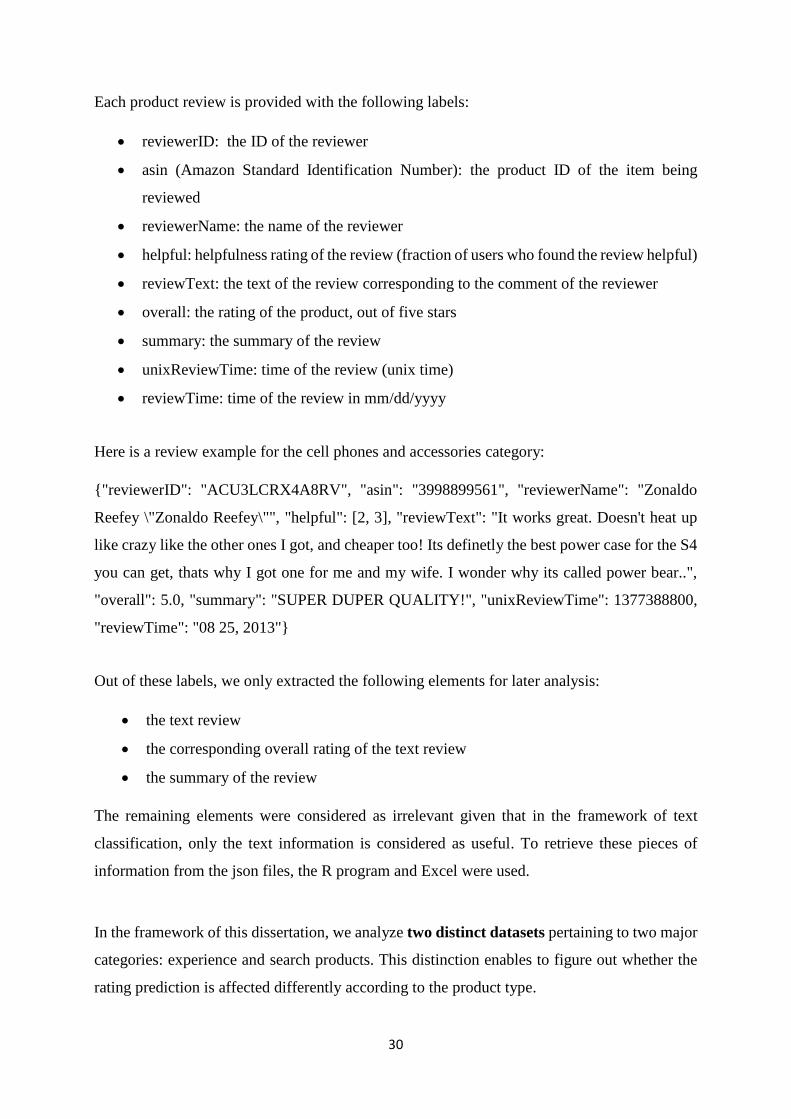
Each product review is provided with the following labels:
reviewerID: the ID of the reviewer
asin (Amazon Standard Identification Number): the product ID of the item being
reviewed
reviewerName: the name of the reviewer
helpful: helpfulness rating of the review (fraction of users who found the review helpful)
reviewText: the text of the review corresponding to the comment of the reviewer
overall: the rating of the product, out of five stars
summary: the summary of the review
unixReviewTime: time of the review (unix time)
reviewTime: time of the review in mm/dd/yyyy
Here is a review example for the cell phones and accessories category:
{"reviewerID": "ACU3LCRX4A8RV", "asin": "3998899561", "reviewerName": "Zonaldo
Reefey \"Zonaldo Reefey\"", "helpful": [2, 3], "reviewText": "It works great. Doesn't heat up
like crazy like the other ones I got, and cheaper too! Its definetly the best power case for the S4
you can get, thats why I got one for me and my wife. I wonder why its called power bear..",
"overall": 5.0, "summary": "SUPER DUPER QUALITY!", "unixReviewTime": 1377388800,
"reviewTime": "08 25, 2013"}
Out of these labels, we only extracted the following elements for later analysis:
the text review
the corresponding overall rating of the text review
the summary of the review
The remaining elements were considered as irrelevant given that in the framework of text
classification, only the text information is considered as useful. To retrieve these pieces of
information from the json files, the R program and Excel were used.
In the framework of this dissertation, we analyze two distinct datasets pertaining to two major
categories: experience and search products. This distinction enables to figure out whether the
rating prediction is affected differently according to the product type.
31
Experience products can be defined as products whose quality is difficult to evaluate as it
largely depends upon the taste of the different consumers. With this kind of products, consumers
have to buy and test the product to form an opinion and thereafter evaluate the quality. The
sample chosen for the experience products is composed of videos games. In order to decide
whether they like a video game or not, consumers need to test it.
On the other hand, search products are products that can be objectively evaluated through key
characteristics. In this case, it is not useful to buy and use the product in order to evaluate the
quality. This information can be obtained prior before purchase. The sample used for the
product type refers to cell phones and accessories. These products are easy to evaluate as some
well-defined attributes describe the product quality, i.e. battery life, connectivity, storage space,
etc.
Finally, as the size of both datasets was extremely large (up to 230,000 reviews for the largest
one), an additional step was performed in order to reduce the datasets to a reasonable size so
that we could efficiently perform our experiments. Out of these large samples, 10,000 product
reviews have been randomly selected for each sample.
4.2.2 Choice of the variables
4.2.2.1 Dependent variable
As stated in the title of this dissertation, the aim is to predict ratings of Amazon reviews.
Therefore, the dependent variable is the numerical rating of a specific review rated by a
consumer.
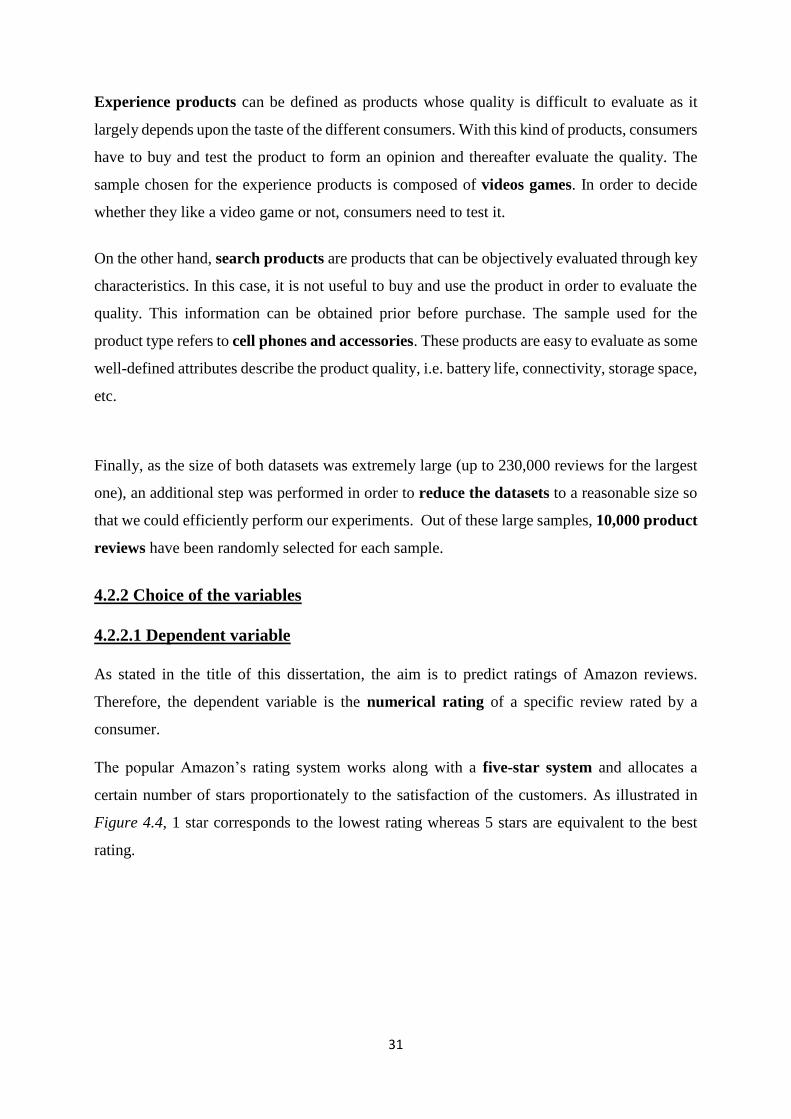
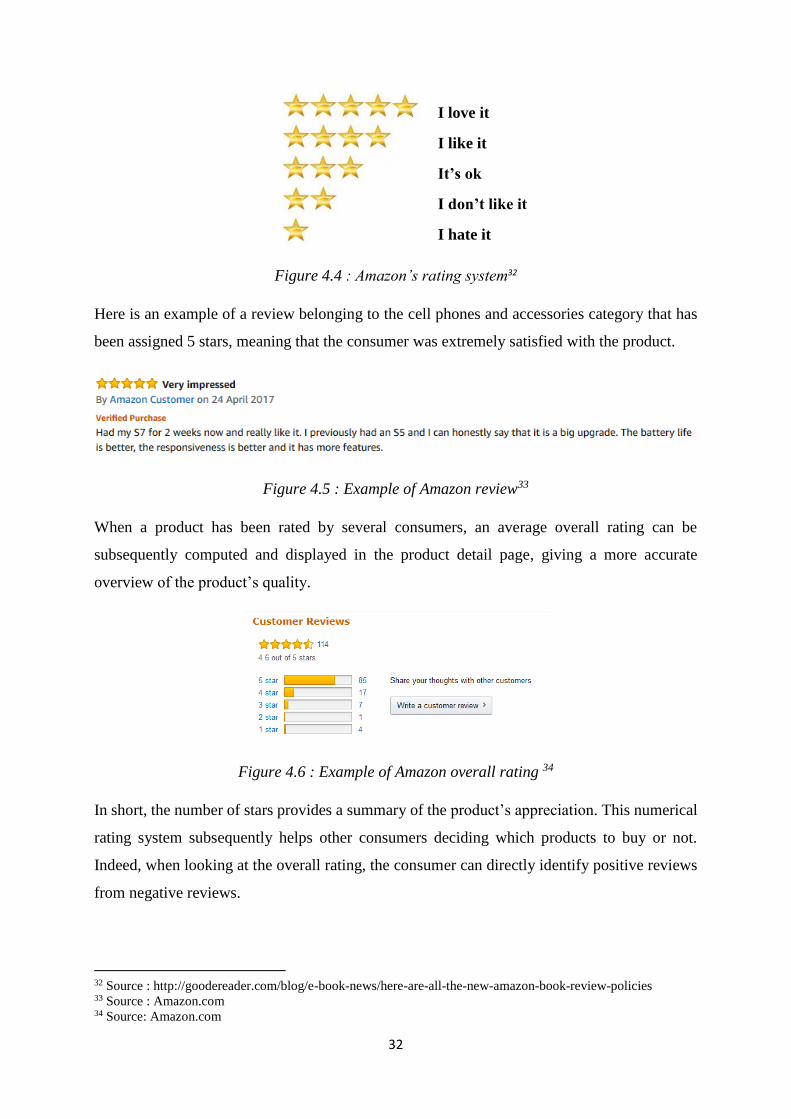
The popular Amazon’s rating system works along with a five-star system and allocates a
certain number of stars proportionately to the satisfaction of the customers. As illustrated in
Figure 4.4, 1 star corresponds to the lowest rating whereas 5 stars are equivalent to the best
rating.
32
Figure 4.4 : Amazon’s rating system32
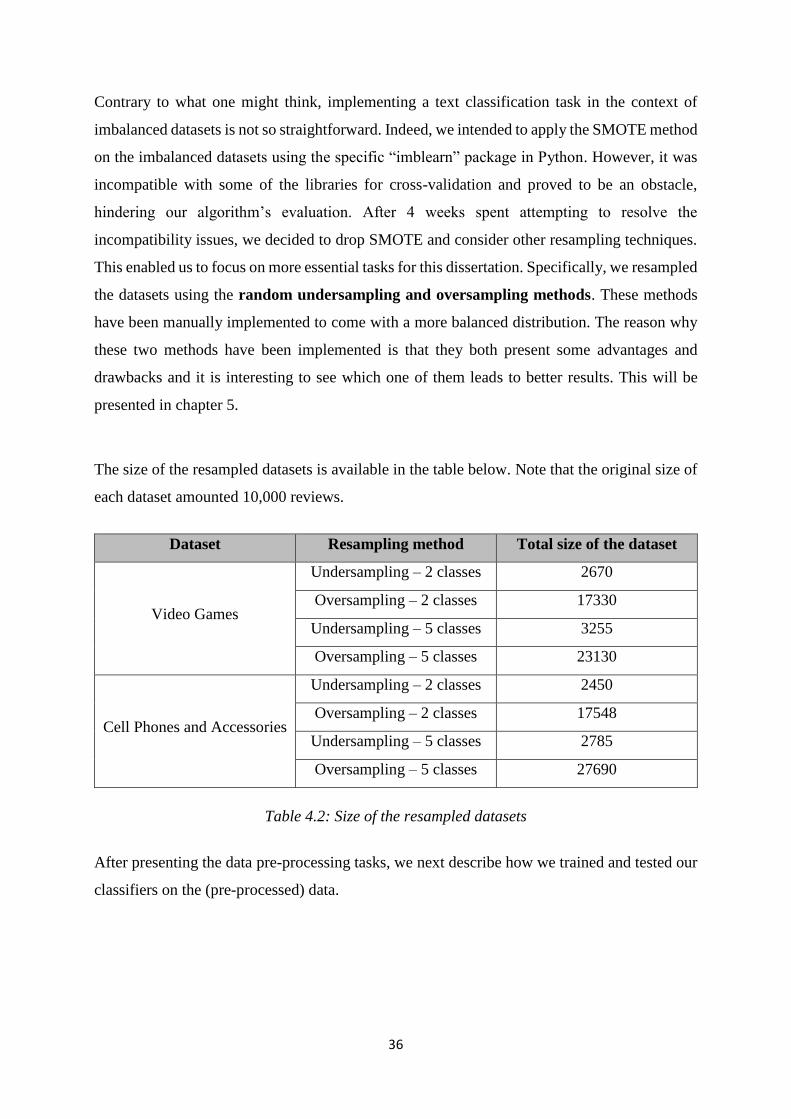
Here is an example of a review belonging to the cell phones and accessories category that has
been assigned 5 stars, meaning that the consumer was extremely satisfied with the product.
Figure 4.5 : Example of Amazon review33
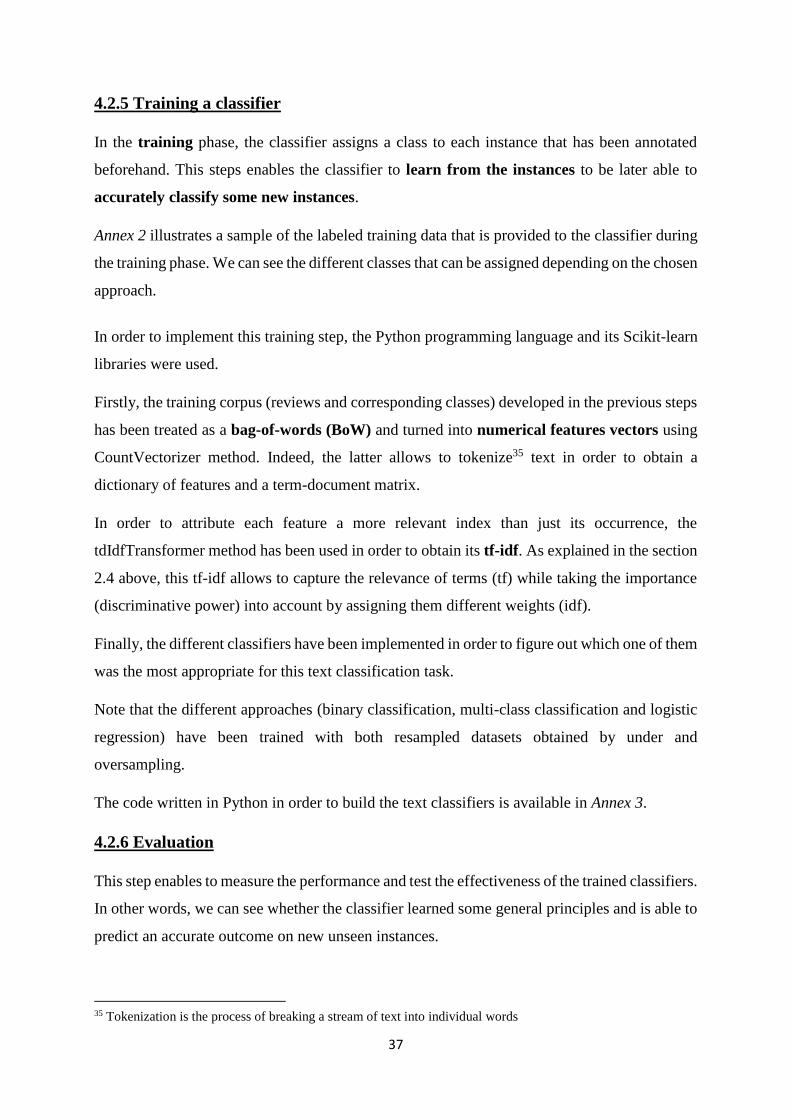
When a product has been rated by several consumers, an average overall rating can be
subsequently computed and displayed in the product detail page, giving a more accurate
overview of the product’s quality.
Figure 4.6 : Example of Amazon overall rating 34
In short, the number of stars provides a summary of the product’s appreciation. This numerical
rating system subsequently helps other consumers deciding which products to buy or not.
Indeed, when looking at the overall rating, the consumer can directly identify positive reviews
from negative reviews.
32 Source : http://goodereader.com/blog/e-book-news/here-are-all-the-new-amazon-book-review-policies 33 Source : Amazon.com 34 Source: Amazon.com
I love it
I like it
It’s ok
I don’t like it
I hate it

33
Note that the dependent variable takes different forms according to the chosen approach. These
forms are described in the table below.
Approach Dependent variable
Binary classification Binary: low or high
Multi-class classification Categorical: 1-star, 2-star, 3-star, 4-star or 5-
star
Logistic regression Numerical: 1, 2, 3, 4 or 5
Table 4.1: Forms of the dependent variable
4.2.2.2 Independent variables
Independent variables are defined as variables having an impact on the variation of the
dependent variable.
In the framework of this dissertation, we decided in a first phase only to concentrate on the text
review to extrapolate the value of the rating. Therefore, the main independent variable is the
text review. As the text review justifies a user’s rating, we expect those two variables to be
highly positively correlated.
In addition, we also considered the review summary. This is because many users prefer to read
the summary (rather than the entire review). Thus, the review summary could also be a relevant
predictor of star-rating. We will test to what extend the performance of the classifiers varies
when taking into account the text review as well as its review summary.
Eventually, we will test the performance of the different classifiers only on the review
summary alone. This aims at figuring out whether the classifier is more accurate when
presented to a short detailed content of information.
To recap, the text classification task developed will try to predict the value of the rating using:
a) the text review
b) the combination of the text review and its summary
c) the review summary only
The aim is to figure out which of these three elements can better capture the complex structure
of the text.

34
4.2.3 Data Cleaning
This step, also known as pre-processing, is aimed at cleaning the data. Indeed, text reviews
contain unnecessary and redundant characters and have to be normalized. More precisely, the
objective of the data cleaning consists in:
a) Removing punctuation
b) Removing numbers
c) Converting text to lower case (no capital letters)
d) Removing extra whitespace
e) Removing stop-words (extremely common words which do not provide any
analytic information and tend to be of little value i.e. a, and, are etc.)
Doing so enables to simplify data and achieve higher accuracy in the classification task.
The data cleaning has been performed on the R program using the text mining package (“tm”).
Once processed, each review was stored individually on the hard drive. To ease manipulations
in the following steps, files have been merged into a single one thanks to a text files merger
(Windows command line). Annex 1 provides the code that has been used in order to preprocess
the data as well as an example of two text reviews before and after the cleaning step.
At the end of this step, we obtained our training data that is the first column containing the
ratings and the second column containing the corresponding cleaned reviews.
4.2.4 Data Resampling
Before implementing a text classification task, plotting the distribution of the data can be a
good start to get to know the data as well as to realize if data need to be resampled.
The distribution of both datasets is shown in Figures 4.7 and 4.8.

35
Figure 4.8 : Distribution of ratings for the Video Games dataset
Figure 4.7 : Distribution of ratings for the Cell phones and Accessories dataset
From these figures, we can clearly observe an imbalanced distribution for both datasets. As
a matter of fact, the video games dataset (resp. cell phones and accessories dataset) contains
46% (resp. 55%) 5-star reviews, 26% (resp. 21%) 4-star reviews, 14% (resp. 11%) 3-star
review, 7% (resp. 6%) 2-star reviews and 7% (resp. 7%) 1-star reviews.
Those reviews follow a similar star-distribution than the one exposed in chapter 3, where
positive reviews are predominant and a J-shaped distribution is observed.
This skewed distribution has major implications for the implementation of the predictive task.
Indeed, due to the probabilistic models on which most machine learning classifiers rely, an
imbalanced distribution will lead to biased and inaccurate results.
Ideally, data should be resampled in such a way that each class is equally represented. As
mentioned in chapter 3, SMOTE has been proven to be the most effective resampling method.
7% 7%
14%
26%
46%
0
1000
2000
3000
4000
5000
1-star 2-star 3-star 4-star 5-star
Nu
mb
er o
f re
view
s
14%
86%
0
2000
4000
6000
8000
10000
LOW RATINGS HIGH RATINGS
Nu
mb
er o
f re
view
s
7% 6%11%
21%
55%
0
1000
2000
3000
4000
5000
6000
1-star 2-star 3-star 4-star 5-star
Nu
mb
er o
f re
view
s
13%
87%
0
2000
4000
6000
8000
10000
LOW RATINGS HIGH RATINGS
Nu
mb
er o
f re
view
s
36
Contrary to what one might think, implementing a text classification task in the context of
imbalanced datasets is not so straightforward. Indeed, we intended to apply the SMOTE method
on the imbalanced datasets using the specific “imblearn” package in Python. However, it was
incompatible with some of the libraries for cross-validation and proved to be an obstacle,
hindering our algorithm’s evaluation. After 4 weeks spent attempting to resolve the
incompatibility issues, we decided to drop SMOTE and consider other resampling techniques.
This enabled us to focus on more essential tasks for this dissertation. Specifically, we resampled
the datasets using the random undersampling and oversampling methods. These methods
have been manually implemented to come with a more balanced distribution. The reason why
these two methods have been implemented is that they both present some advantages and
drawbacks and it is interesting to see which one of them leads to better results. This will be
presented in chapter 5.
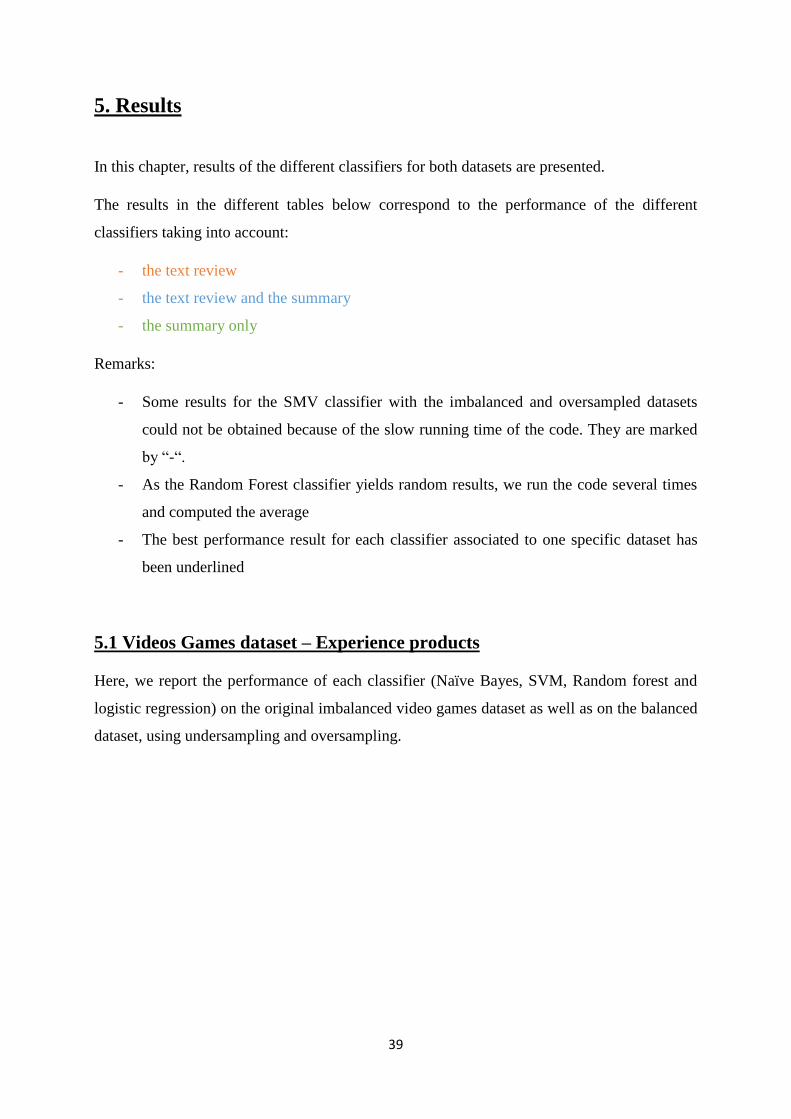
The size of the resampled datasets is available in the table below. Note that the original size of
each dataset amounted 10,000 reviews.
Dataset Resampling method Total size of the dataset
Video Games
Undersampling – 2 classes 2670
Oversampling – 2 classes 17330
Undersampling – 5 classes 3255
Oversampling – 5 classes 23130
Cell Phones and Accessories
Undersampling – 2 classes 2450
Oversampling – 2 classes 17548
Undersampling – 5 classes 2785
Oversampling – 5 classes 27690
Table 4.2: Size of the resampled datasets
After presenting the data pre-processing tasks, we next describe how we trained and tested our
classifiers on the (pre-processed) data.
37
4.2.5 Training a classifier
In the training phase, the classifier assigns a class to each instance that has been annotated
beforehand. This steps enables the classifier to learn from the instances to be later able to
accurately classify some new instances.
Annex 2 illustrates a sample of the labeled training data that is provided to the classifier during
the training phase. We can see the different classes that can be assigned depending on the chosen
approach.
In order to implement this training step, the Python programming language and its Scikit-learn
libraries were used.
Firstly, the training corpus (reviews and corresponding classes) developed in the previous steps
has been treated as a bag-of-words (BoW) and turned into numerical features vectors using
CountVectorizer method. Indeed, the latter allows to tokenize35 text in order to obtain a
dictionary of features and a term-document matrix.
In order to attribute each feature a more relevant index than just its occurrence, the
tdIdfTransformer method has been used in order to obtain its tf-idf. As explained in the section
2.4 above, this tf-idf allows to capture the relevance of terms (tf) while taking the importance
(discriminative power) into account by assigning them different weights (idf).
Finally, the different classifiers have been implemented in order to figure out which one of them
was the most appropriate for this text classification task.
Note that the different approaches (binary classification, multi-class classification and logistic
regression) have been trained with both resampled datasets obtained by under and
oversampling.
The code written in Python in order to build the text classifiers is available in Annex 3.
4.2.6 Evaluation
This step enables to measure the performance and test the effectiveness of the trained classifiers.
In other words, we can see whether the classifier learned some general principles and is able to
predict an accurate outcome on new unseen instances.
35 Tokenization is the process of breaking a stream of text into individual words

38
In order to perform the evaluation of the different classifiers, a pipeline has been built in order
to make the previous vectorization-transformation-classification steps easier to work with. The
classifiers are evaluated using a 10-fold cross-validation. Moreover, a classification report
displays several basic evaluation performance metrics such as precision, recall and f1-score
that have been defined in section 2.6. The three approaches (binary classification, multi-class
classification and logistic regression) and their associated classifiers are all evaluated through
these accuracy metrics so that we are able to compare them afterwards. Finally, a confusion
matrix is also computed to get an overview of the actual values vs. predicted values for each
classifier.
The results for both datasets are explained in the next chapter.
39
5. Results
In this chapter, results of the different classifiers for both datasets are presented.
The results in the different tables below correspond to the performance of the different
classifiers taking into account:
- the text review
- the text review and the summary
- the summary only
Remarks:
- Some results for the SMV classifier with the imbalanced and oversampled datasets
could not be obtained because of the slow running time of the code. They are marked
by “-“.
- As the Random Forest classifier yields random results, we run the code several times
and computed the average
- The best performance result for each classifier associated to one specific dataset has
been underlined
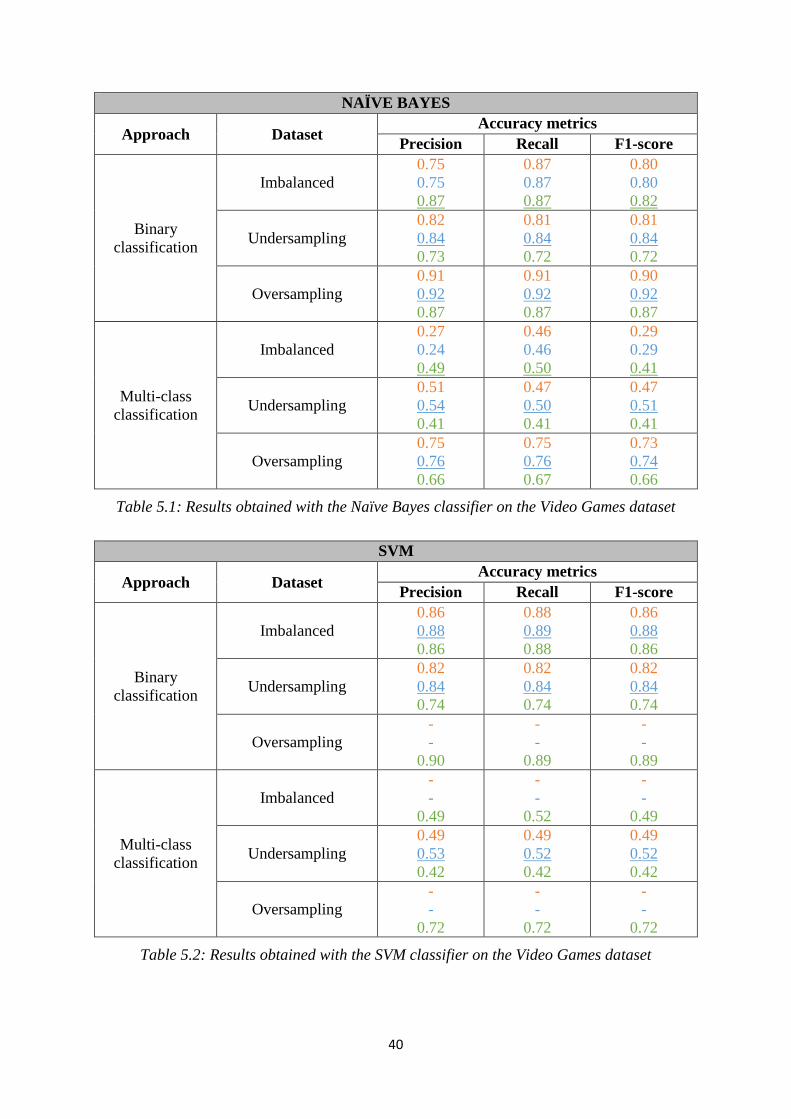
5.1 Videos Games dataset – Experience products
Here, we report the performance of each classifier (Naïve Bayes, SVM, Random forest and
logistic regression) on the original imbalanced video games dataset as well as on the balanced
dataset, using undersampling and oversampling.
40
NAÏVE BAYES
Approach Dataset Accuracy metrics
Precision Recall F1-score
Binary
classification
Imbalanced
0.75
0.75
0.87
0.87
0.87
0.87
0.80
0.80
0.82
Undersampling
0.82
0.84
0.73
0.81
0.84
0.72
0.81
0.84
0.72
Oversampling
0.91
0.92
0.87
0.91
0.92
0.87
0.90
0.92
0.87
Multi-class
classification
Imbalanced
0.27
0.24
0.49
0.46
0.46
0.50
0.29
0.29
0.41
Undersampling
0.51
0.54
0.41
0.47
0.50
0.41
0.47
0.51
0.41
Oversampling
0.75
0.76
0.66
0.75
0.76
0.67
0.73
0.74
0.66
Table 5.1: Results obtained with the Naïve Bayes classifier on the Video Games dataset
SVM
Approach Dataset Accuracy metrics
Precision Recall F1-score
Binary
classification
Imbalanced
0.86
0.88
0.86
0.88
0.89
0.88
0.86
0.88
0.86
Undersampling
0.82
0.84
0.74
0.82
0.84
0.74
0.82
0.84
0.74
Oversampling
-
-
0.90
-
-
0.89
-
-
0.89
Multi-class
classification
Imbalanced
-
-
0.49
-
-
0.52
-
-
0.49
Undersampling
0.49
0.53
0.42
0.49
0.52
0.42
0.49
0.52
0.42
Oversampling
-
-
0.72
-
-
0.72
-
-
0.72
Table 5.2: Results obtained with the SVM classifier on the Video Games dataset

41
Random Forest
Approach Dataset Accuracy metrics
Precision Recall F1-score
Binary
classification
Imbalanced
0.84
0.85
0.85
0.87
0.87
0.87
0.82
0.82
0.86
Undersampling
0.70
0.73
0.70
0.69
0.72
0.70
0.68
0.72
0.70
Oversampling
0.99
0.99
0.94
0.99
0.99
0.93
0.99
0.99
0.93
Multi-class
classification
Imbalanced
0.39
0.42
0.46
0.46
0.48
0.49
0.40
0.42
0.47
Undersampling
0.34
0.37
0.37
0.34
0.37
0.37
0.34
0.37
0.37
Oversampling
0.90
0.90
0.84
0.90
0.90
0.85
0.90
0.90
0.84
Table 5.3: Results obtained with the Random Forest classifier on the Video Games dataset
Logistic regression
Approach Dataset Accuracy metrics
Precision Recall F1-score
Logistic
regression
Imbalanced
0.48
0.50
0.49
0.50
0.52
0.52
0.48
0.51
0.49
Undersampling
0.46
0.48
0.41
0.46
0.49
0.42
0.46
0.49
0.41
Oversampling
0.89
0.90
0.71
0.89
0.90
0.71
0.89
0.90
0.71
Table 5.4: Results obtained with the Logistic regression classifier on the Video Games dataset
5.1.1 Results for the imbalanced dataset
As can be seen in Tables 5.1, 5.2 & 5.3 in the binary classification case with imbalanced
datasets, all classifiers provide quite good results, with f1-scores ranging from 0.80 to 0.88. The
best classifier is SVM and provides better results when presented to the text review
accompanied by its summary.

42
When predicting a precise numerical rating (cfr. Tables 5.1, 5.2, 5.3 & 5.4), the most performant
classifier is the logistic regression and provides the best result (f1-score of 0.51) when presented
to the text review and its summary. Note that some results for the SVM classifier could not be
obtained because of a slow running time.
However, as mentioned in section 2.7, imbalanced datasets may lead to biased results by only
predicting the overrepresented class.
Here below, we present an extreme example that perfectly illustrates the issue related to
imbalanced data. This example has been run with the Naïve Bayes classifier.
Precision Recall F1-score Support
HIGH 0.87 1.00 0.93 8665
LOW 0.00 0.00 0.00 1335
Avg / total 0.75 0.87 0.80 10000
Table 5.5: Classification report for the imbalanced Video Games dataset
Classified High Classified Low
Actual High 8665 0
Actual Low 1335 0
Table 5.6 : Confusion matrix for the imbalanced Video Games dataset
As we can see from these two tables, the overall performance of the classifier is quite good at
the first sight (precision of 0.75 and recall of 0.87). However, after carefully looking at the
results, we can observe that they are highly biased. Predictions are not accurate since the
minority (low) class is never predicted.
Note that we obtain the same kind of results for the multi-class classification task (with lower
accuracy metrics) where only the overrepresented class, i.e. 5-star ratings, is predicted.
Resampling the dataset is therefore crucial in order to improve the predictive performance of
the classifiers.
5.1.2 Results for the resampled dataset
As the Tables 5.1, 5.2 & 5.3 show, in the case of binary classification, SVM and Naïve Bayes
are quite close in terms of accuracy results. SVM has the advantage to slightly outperform

43
the Naïve Bayes classifier, but on the other hand is slower at running time36. For its part, random
forest provides less accurate predictions.
Moreover, when predicting the exact value of the rating, multi-class classification offers
better results than logistic regression (cfr Tables 5.1, 5.2, 5.3 & 5.4). Naïve Bayes and SVM
also have similar results. Again, SVM slightly outperforms the Naïve Bayes classifier.
Note that the oversampled dataset offers better results than the undersampled dataset in both
binary and multi-class classification. However, these results seem fairly optimistic. For
instance, it can be seen in Table 5.3 that f1-score amounts to 0.90 in the case of multi-class
classification with random forest. Moreover, the oversampled dataset has the disadvantage of
being slower to run as its size is larger. For these reasons, we prefer to base our analysis on the
undersampled dataset.
Finally, as can be seen in Tables 5.1, 5.2, 5.3 & 5.4, classifiers offer in general better results
when presented to the combination of the text review and its summary rather than simply
with the review or the summary alone. Adding a small amount of meaningful information
(review summary) leads to better predictive results.
Here below, we decided to illustrate and analyze in more depth the performance of the best
classifier for binary and multi-class classification, i.e. SVM on the undersampled dataset with
the text review and its summary.
a) Binary classification
Precision Recall F1-score Support
HIGH 0.84 0.85 0.84 1335
LOW 0.85 0.83 0.84 1335
Avg / total 0.84 0.84 0.84 2670
Table 5.7: Classification report for the undersampled Video Games dataset
Classified High Classified Low
Actual High 1131 204
Actual Low 222 1113
Table 5.8: Confusion matrix for the undersampled Video Games dataset
36 Several minutes for the SVM classifier vs. only a few seconds for the Naïve Bayes classifier

44
As we can see in Tables 5.7 and 5.8, results for the low category largely improved. The classifier
now shows good results in predicting both classes, with an f1-score amounting to 0.84 for each
class. Note that the classifier is slighly more accurate at predicting high ratings than low ratings
since it correctly classified 1131 instances (vs. 1113 for low ratings) out of 1335. Finally, we
computed the accuracy in order to be able to compare our results with those obtained in the
litterarture. This metric amounts to 0.84.
b) Multi-class classification
Precision Recall F1-score Support
1-star 0.58 0.59 0.59 651
2-star 0.44 0.44 0.44 651
3-star 0.40 0.38 0.39 651
4-star 0.49 0.56 0.52 651
5-star 0.72 0.66 0.69 651
Avg / total 0.53 0.52 0.52 3255
Table 5.9: Classification report for the undersampled Video Games dataset
Classified
1-star
Classified
2-star
Classified
3-star
Classified
4-star
Classified
5-star
Actual 1-star 387 178 48 29 9
Actual 2-star 157 284 151 40 19
Actual 3-star 73 132 246 156 44
Actual 4-star 30 32 131 362 96
Actual 5-star 19 21 38 145 428
Table 5.10: Confusion matrix for the undersampled Video Games dataset
From these two tables, we can see that 1- and 5-star are the easiest classes to predict. As a matter
of fact, we get f1-scores of 0.59 and 0.79 respectively for these two extreme values. On the
other hand, neutral reviews, i.e. 3-star are more complicated to predict, with f1-score amounting
only to 0.39. The classifier is not good at classifying 3-star reviews as it only correctly classified
246 out of 651.
From the confusion matrix37 in Table 5.10, we can see which predictions are most often
confused. For instance, we observe that an actual 5-star is most often confused with a 4-star
than 1-star. In general, the classifier is thus rarely completely wrong (e.g. predicting an actual
1-star as a 5-star, or vice-versa). Here as well, we computed the accuracy which amounts to
0.46.
37 The diagonal in green represents all the predictions made by the classifier that were effectively correct

45
5.2 Cell phones and Accessories dataset – Search products
As in the previous section, we report the performance of each classifier (Naïve Bayes, SVM,
Random forest and logistic regression) on the original imbalanced cell phones and accessories
dataset as well as on the balanced dataset, using undersampling and oversampling.
NAÏVE BAYES
Approach Dataset Accuracy metrics
Precision Recall F1-score
Binary
classification
Imbalanced
0.89
0.77
0.89
0.88
0.88
0.89
0.82
0.82
0.85
Undersampling
0.75
0.77
0.70
0.74
0.76
0.70
0.74
0.76
0.70
Oversampling
0.92
0.93
0.88
0.92
0.93
0.88
0.92
0.93
0.88
Multi-class
classification
Imbalanced
0.31
0.37
0.55
0.55
0.55
0.58
0.39
0.39
0.48
Undersampling
0.53
0.57
0.45
0.52
0.56
0.46
0.52
0.56
0.45
Oversampling
0.79
0.81
0.68
0.80
0.81
0.68
0.79
0.81
0.68
Table 5.11: Results obtained with the Naïve Bayes classifier on the Cell phones & Accessories
dataset
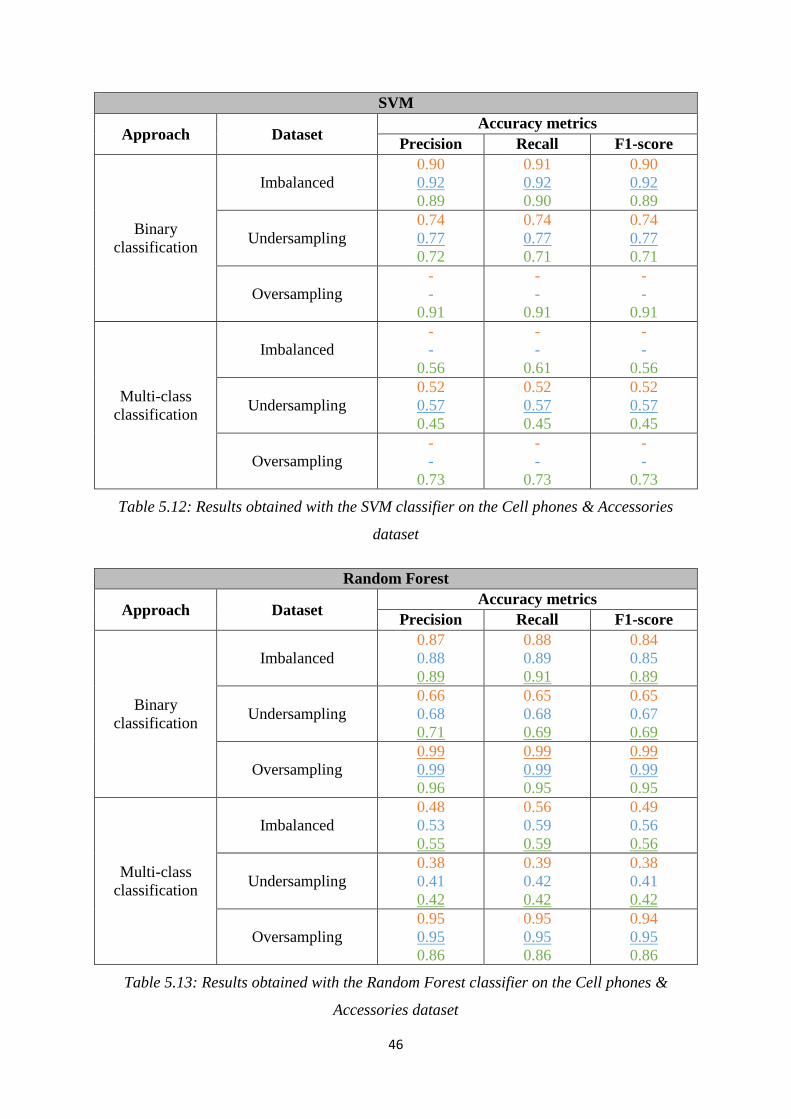
46
SVM
Approach Dataset Accuracy metrics
Precision Recall F1-score
Binary
classification
Imbalanced
0.90
0.92
0.89
0.91
0.92
0.90
0.90
0.92
0.89
Undersampling
0.74
0.77
0.72
0.74
0.77
0.71
0.74
0.77
0.71
Oversampling
-
-
0.91
-
-
0.91
-
-
0.91
Multi-class
classification
Imbalanced
-
-
0.56
-
-
0.61
-
-
0.56
Undersampling
0.52
0.57
0.45
0.52
0.57
0.45
0.52
0.57
0.45
Oversampling
-
-
0.73
-
-
0.73
-
-
0.73
Table 5.12: Results obtained with the SVM classifier on the Cell phones & Accessories
dataset
Random Forest
Approach Dataset Accuracy metrics
Precision Recall F1-score
Binary
classification
Imbalanced
0.87
0.88
0.89
0.88
0.89
0.91
0.84
0.85
0.89
Undersampling
0.66
0.68
0.71
0.65
0.68
0.69
0.65
0.67
0.69
Oversampling
0.99
0.99
0.96
0.99
0.99
0.95
0.99
0.99
0.95
Multi-class
classification
Imbalanced
0.48
0.53
0.55
0.56
0.59
0.59
0.49
0.56
0.56
Undersampling
0.38
0.41
0.42
0.39
0.42
0.42
0.38
0.41
0.42
Oversampling
0.95
0.95
0.86
0.95
0.95
0.86
0.94
0.95
0.86
Table 5.13: Results obtained with the Random Forest classifier on the Cell phones &
Accessories dataset
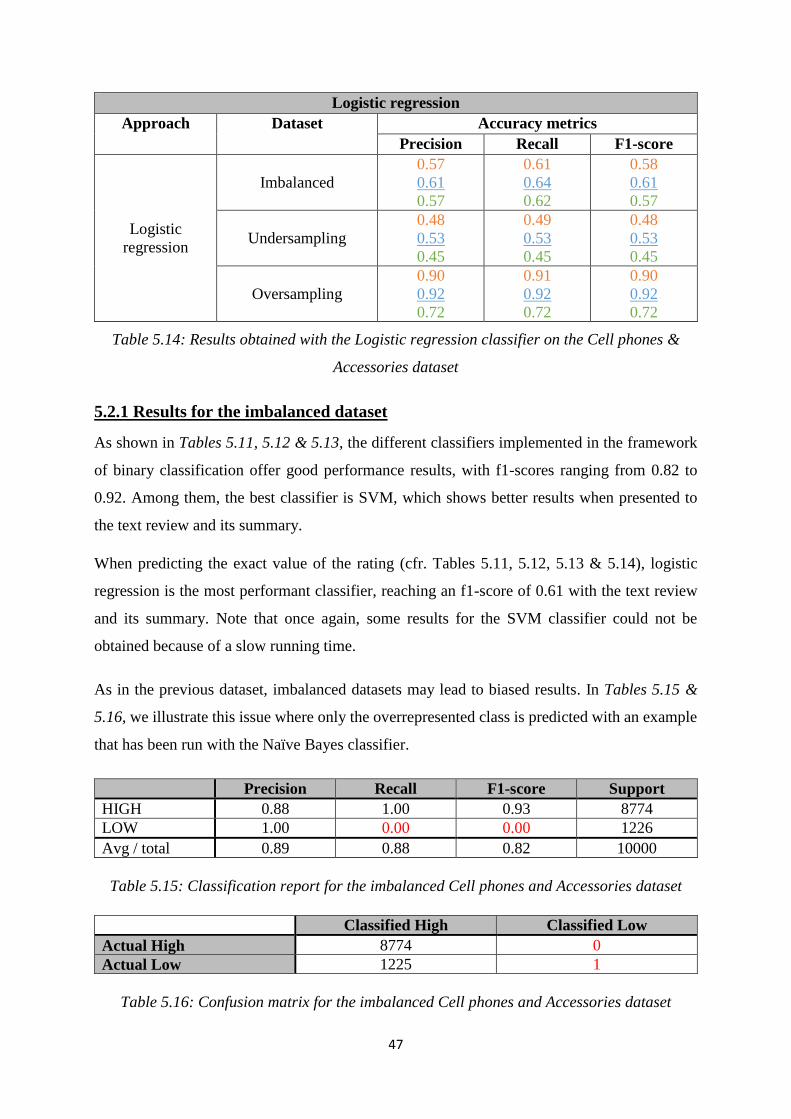
47
Logistic regression
Approach Dataset Accuracy metrics
Precision Recall F1-score
Logistic
regression
Imbalanced
0.57
0.61
0.57
0.61
0.64
0.62
0.58
0.61
0.57
Undersampling
0.48
0.53
0.45
0.49
0.53
0.45
0.48
0.53
0.45
Oversampling
0.90
0.92
0.72
0.91
0.92
0.72
0.90
0.92
0.72
Table 5.14: Results obtained with the Logistic regression classifier on the Cell phones &
Accessories dataset
5.2.1 Results for the imbalanced dataset
As shown in Tables 5.11, 5.12 & 5.13, the different classifiers implemented in the framework
of binary classification offer good performance results, with f1-scores ranging from 0.82 to
0.92. Among them, the best classifier is SVM, which shows better results when presented to
the text review and its summary.
When predicting the exact value of the rating (cfr. Tables 5.11, 5.12, 5.13 & 5.14), logistic
regression is the most performant classifier, reaching an f1-score of 0.61 with the text review
and its summary. Note that once again, some results for the SVM classifier could not be
obtained because of a slow running time.
As in the previous dataset, imbalanced datasets may lead to biased results. In Tables 5.15 &
5.16, we illustrate this issue where only the overrepresented class is predicted with an example
that has been run with the Naïve Bayes classifier.
Precision Recall F1-score Support
HIGH 0.88 1.00 0.93 8774
LOW 1.00 0.00 0.00 1226
Avg / total 0.89 0.88 0.82 10000
Table 5.15: Classification report for the imbalanced Cell phones and Accessories dataset
Classified High Classified Low
Actual High 8774 0
Actual Low 1225 1
Table 5.16: Confusion matrix for the imbalanced Cell phones and Accessories dataset
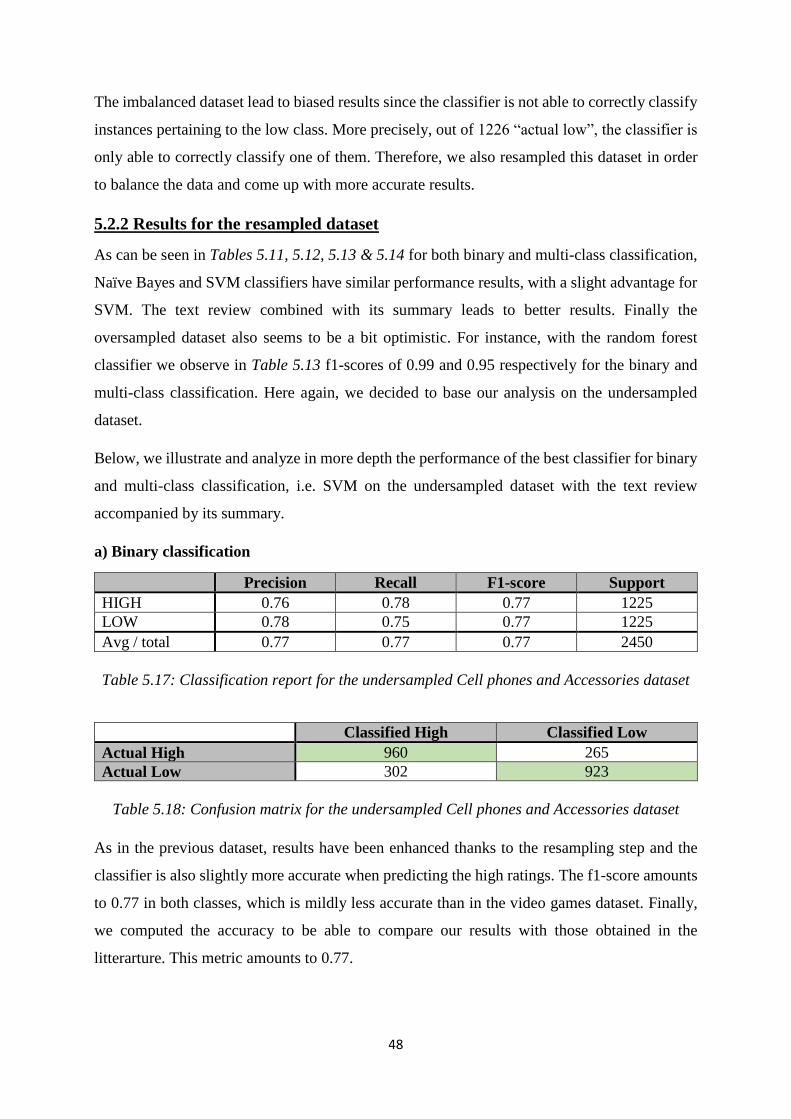
48
The imbalanced dataset lead to biased results since the classifier is not able to correctly classify
instances pertaining to the low class. More precisely, out of 1226 “actual low”, the classifier is
only able to correctly classify one of them. Therefore, we also resampled this dataset in order
to balance the data and come up with more accurate results.
5.2.2 Results for the resampled dataset
As can be seen in Tables 5.11, 5.12, 5.13 & 5.14 for both binary and multi-class classification,
Naïve Bayes and SVM classifiers have similar performance results, with a slight advantage for
SVM. The text review combined with its summary leads to better results. Finally the
oversampled dataset also seems to be a bit optimistic. For instance, with the random forest
classifier we observe in Table 5.13 f1-scores of 0.99 and 0.95 respectively for the binary and
multi-class classification. Here again, we decided to base our analysis on the undersampled
dataset.
Below, we illustrate and analyze in more depth the performance of the best classifier for binary
and multi-class classification, i.e. SVM on the undersampled dataset with the text review
accompanied by its summary.
a) Binary classification
Precision Recall F1-score Support
HIGH 0.76 0.78 0.77 1225
LOW 0.78 0.75 0.77 1225
Avg / total 0.77 0.77 0.77 2450
Table 5.17: Classification report for the undersampled Cell phones and Accessories dataset
Classified High Classified Low
Actual High 960 265
Actual Low 302 923
Table 5.18: Confusion matrix for the undersampled Cell phones and Accessories dataset
As in the previous dataset, results have been enhanced thanks to the resampling step and the
classifier is also slightly more accurate when predicting the high ratings. The f1-score amounts
to 0.77 in both classes, which is mildly less accurate than in the video games dataset. Finally,
we computed the accuracy to be able to compare our results with those obtained in the
litterarture. This metric amounts to 0.77.
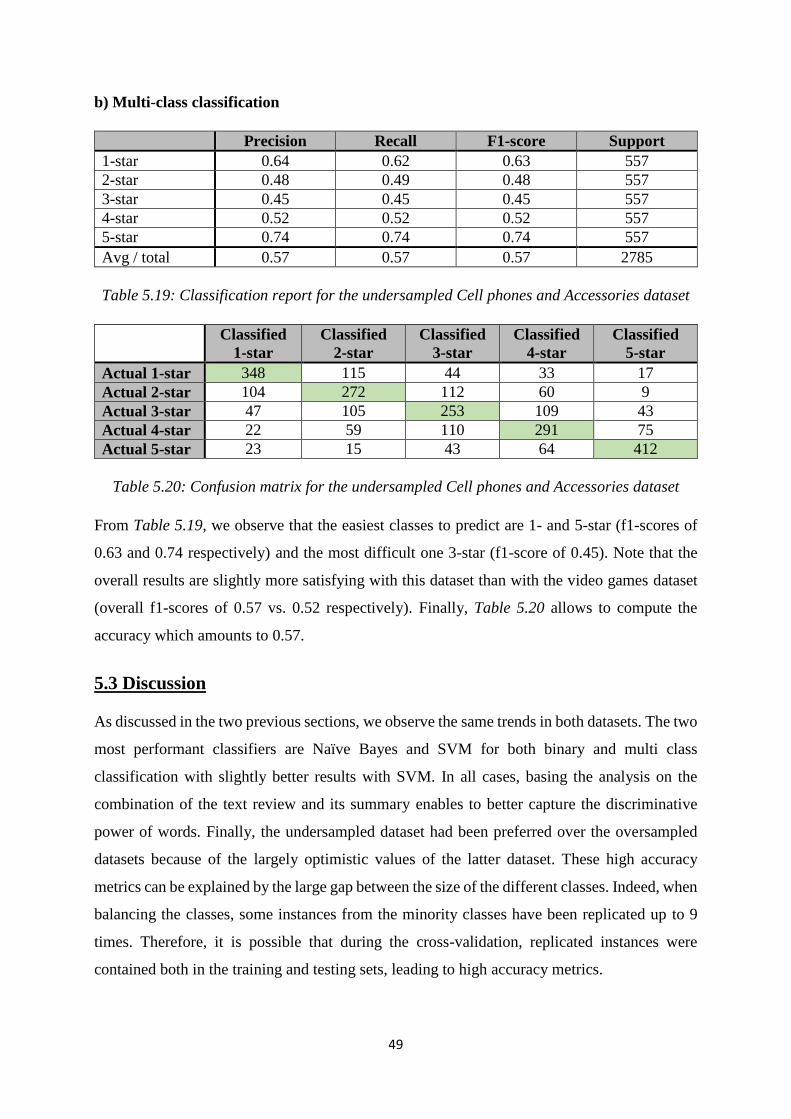
49
b) Multi-class classification
Precision Recall F1-score Support
1-star 0.64 0.62 0.63 557
2-star 0.48 0.49 0.48 557
3-star 0.45 0.45 0.45 557
4-star 0.52 0.52 0.52 557
5-star 0.74 0.74 0.74 557
Avg / total 0.57 0.57 0.57 2785
Table 5.19: Classification report for the undersampled Cell phones and Accessories dataset
Classified
1-star
Classified
2-star
Classified
3-star
Classified
4-star
Classified
5-star
Actual 1-star 348 115 44 33 17
Actual 2-star 104 272 112 60 9
Actual 3-star 47 105 253 109 43
Actual 4-star 22 59 110 291 75
Actual 5-star 23 15 43 64 412
Table 5.20: Confusion matrix for the undersampled Cell phones and Accessories dataset
From Table 5.19, we observe that the easiest classes to predict are 1- and 5-star (f1-scores of
0.63 and 0.74 respectively) and the most difficult one 3-star (f1-score of 0.45). Note that the
overall results are slightly more satisfying with this dataset than with the video games dataset
(overall f1-scores of 0.57 vs. 0.52 respectively). Finally, Table 5.20 allows to compute the
accuracy which amounts to 0.57.
5.3 Discussion
As discussed in the two previous sections, we observe the same trends in both datasets. The two
most performant classifiers are Naïve Bayes and SVM for both binary and multi class
classification with slightly better results with SVM. In all cases, basing the analysis on the
combination of the text review and its summary enables to better capture the discriminative
power of words. Finally, the undersampled dataset had been preferred over the oversampled
datasets because of the largely optimistic values of the latter dataset. These high accuracy
metrics can be explained by the large gap between the size of the different classes. Indeed, when
balancing the classes, some instances from the minority classes have been replicated up to 9
times. Therefore, it is possible that during the cross-validation, replicated instances were
contained both in the training and testing sets, leading to high accuracy metrics.
50
While binary classification offers better results with the video dataset, it is the contrary with the
multi-class classification which provides more accurate results with the cell phones and
accessories dataset. A hypothesis that can explain the latter trend is that text reviews pertaining
to search products are less subjective as these products are evaluated through well-defined
attributes. Therefore, finding relations between the review and its star rating may be an easier
task in the framework of experience products.
In general, we observed that predicting ratings of Amazon reviews was much easier in the case
of binary classification than in the case of multi-class classification and logistic regression.
Indeed, binary classification returns higher performance metrics than multi-class classification
(0.84 vs. 0.57 for the best f1-scores). This is logical as the number of classes to be predicted is
lower and therefore the probability of missing a class is smaller (1/2 vs. 4/5). A tradeoff has to
be taken into account between the predictive performance of the model and the preciseness of
the value information. The more precise information we want to predict the more difficult the
predictive task will be. As a matter of fact, binary classification enables to correctly predict
more instances but is only able to predict two different classes while multi-class classification
tends to be less accurate but leads to more precise value information (i.e. the exact value of the
rating).
Also, it might be appropriate to compare the values obtained in the framework of this
dissertation and the ones found in the literature. In the case of binary classification, our results
are quite similar to the research which also dealt with the issue of class imbalance. As a
reminder, Dave, Lawrence, and Pennock (2003) and Pang, Lee and Vaithyanathan (2002)
reached an accuracy of 85% and 82% respectively. Even if the cell phones and accessories
accuracy, amounting to 77%, is a bit lower than these baselines, the video games dataset has an
accuracy of 84%, which is a quite good performance compared to the results obtained in the
literature. However, in the case of multi-class classification, our results, i.e. accuracy of 46%
and 57% for the video games and cell phones & accessories datasets respectively, are not as
accurate as the accuracy baseline of 61% reached by Pang and Lee (2005). This can be
explained by the fact that they only predicted 4 classes while we are predicting 5 classes and
they took additional features into account. It is worth noting that these classifiers were also
tested using POS as features to train the algorithm. Nonetheless, as in the literature (Dave,
Lawrence, and Pennock (2003), Fan and Khademi (2014) and Pang, Lee and Vaithyanathan
(2002)), it did not lead to better results.
51
Finally, it is interesting to wonder whether the results obtained can be satisfying in the
framework of our predictive task. One the one hand, we expect the performance values to be as
high as possible in order to be the most accurate in our text classification task. The gap between
the values obtained and the ideal value, i.e. 1.00 demonstrates that our classifiers still have some
flaws. These results could be enhanced by including other features such as the overall sentiment
of the review, the helpfulness score or even the identity of the reviewer. On the other hand, we
can consider these performance results as acceptable since they clearly outperform the results
that would be obtained by randomly assigning a class to an instance.

52

53
6. Project Management
After highlighting the major points that have been addressed during the seminar on project
management given by Jean-Pierre Polonovski, professor at the University of Quebec in
Montreal, the present chapter will investigate to what extend the achievement of this master
thesis can refer to a structured project management approach.
6.1 Seminar summary
According to the Project Management Institute (2017), project management is "the
application of knowledge, skills, tools and techniques to a broad range of activities in order to
meet the requirements of a particular project." In other words, it can be shortly defined by the
effective organization and completion of work projects.
During the seminar, Pr. Polonovski mainly focused on the management of a portfolio of projects
within an organization. More precisely, this seminar aimed at understanding project
management concepts through various concrete examples, but also figuring out the relationship
between projects and the strategy of organizations.
According to him, it is crucial to clearly define a project by a mission, a vision as well as a
strategy. Moreover, he granted importance to the five fundamental phases of project
management, which are all essential for the success of any project. Here is a brief summary of
these phases which encompass the management of a project from start to finish.
1. Project conception and initiation: This first phase, also known as the pre-project
phase, aims at briefly defining the project objectives as well as evaluating its potential
benefits. In short, this phase is the starting point of a project and enables to figure out
whether the project for a specific organization is viable or not.
2. Project definition and planning: This step is of prime importance for the successful
achievement of any project as the detailed scope of the project allows to precisely
schedule the execution of the project as well as ascertaining the corresponding resources
(financial, human and material). In the case of a portfolio of projects, it is important to
select and prioritize the different projects that have to be realized. To sum up, this step
enables to know what has be to achieved, how it is going to be achieved and also how
long it will take.

54
3. Project execution: This step represents the concrete development of the project. During
this phase, tasks are executed as previously planned. This can take some time as projects
are usually long-term projects.
4. Project performance and control: At this stage, project managers make sure that the
project management plan previously established is met. Some adjustments may occur
regarding the schedules in some cases. Finally, some key performance indicators are
used in order to determine if the project is on the right track.
5. Project close: This last phase arises once the project is completed. A final evaluation
often takes place to assess the project success or failure and enables to learn lessons
from what has been achieved and also address some recommendations for further
improvements.
Besides these five essential phases, Pr. Polonovski also put the emphasis on the project
management triangle. As depicted on Figure 6.1, project management is subjected to three
constraints, namely scope, time and cost. They are represented by each side of the triangle.
a) Time (when) refers to the limited duration within which the project has to be completed.
This limited time frame is often called deadline.
b) Cost (how much) represents the amount of money required in order to carry out a
project. This budget is a finite amount and can be estimated taking into account all the
resources allocated to the project.
c) Scope (what) can be defined as the end result of the project. In other words, it represents
what has to be achieved in order to complete successfully the project. It is important to
properly define the scope of a project as well as its objectives beforehand so that the
goals are well understood by any stakeholder taking part in the completion of the
project.
Figure 6.1: Project management triangle38
38 Source : Polonovski, 2016

55
These three elements all have impacts on the management of a project and are interconnected
with each other. For instance, a cost increase will undeniably affect the two other elements
(scope and time), either implying the scope to be enlarged or the time to be reduced.
To conclude, efficiently balancing these key attributes and taking advantage from them will
lead to a successful project management. The way these three constraints are managed will
therefore determine the quality of the final project.
6.2 A master thesis seen as a project management approach
While the project management approach can be examined from the project manager as well as
from the organization’s perspective, only the first one can be considered in the framework of a
research thesis. Indeed, this dissertation is not aimed at solving a real problem encountered by
a company. As a result, some elements connected with project management cannot be taken
into account such as budget, team management, stakeholders, as well as constraints inherent to
the organization.
Even though this dissertation does not concern the organization environment, nor a portfolio of
projects, writing this paper can be considered in itself as a project that has to be accomplished
to complete university studies. According to this view, this research thesis can be regarded as
project-oriented since there is a precise goal as well as a specific outcome to reach within a
limited time frame.
Thereafter, we will highlight the relations between this paper and project management and
evaluate to which extend they can be related to each other. Actually, the five phases of a
structured project management approach developed above have been thoughtlessly put into
practice in the present case.
The first step of this dissertation consisted in finding a subject related to my master orientation.
As I did my internship in the field of pure supply chain management, I chose to write a
dissertation related to the other part of my specialization since I particularly appreciated the
lectures of Business analytics and Web and text analytics. In this way I was able to broaden my
knowledge in both fields of my specialization. In addition, I had to find a promotor and meet
him to define the project objectives as well as the structure of the work.
The second phase aimed at planning and scheduling all the tasks in order to successfully
complete this project within the time limit. Doing so enabled to determine the required

56
resources. In this perspective, time management as well as resource management were
undeniably key points. It is also important to mention that I had to prioritize the work. For
instance, to analyze the results and draw some conclusions it was required to implement the
predictive task beforehand.
The third step, consisting in the project implementation strictly speaking, was the most
demanding in terms of time. This phase consisted in the writing of this thesis which has been
planned into different parts: research of scientific literature to figure out which approaches had
already been developed, programming part, analysis of the results and conclusion. To do so, I
made the most of the resources that I had on hand. Besides my previously acquired knowledge,
I also had to learn by myself, especially for the programming part. I mainly used the community
Stack Overflow where thousands of people are writing comments to help other contributors.
Also, the help of my promotor was really beneficial.
During this implementation phase, some unexpected elements occurred. Mainly the imbalanced
distribution of both datasets prevented from conducting a straightforward analysis. These data
needed to be resampled to lead to more accurate outputs. This example shows that time
management represents a key issue in the framework of a master thesis, but also in any project
as discussed during the seminar, and should never be disregarded. Actually, time management
also implies being able to effectively deal with changes and unforeseen events. According to
Pr. Polonovski, “it never happens that a project is executed exactly as planned. There are always
changes happening”. Indeed, the context is variable and may change over time. Planning
everything in advance is a hard task. In brief, planning also involves to expect the unexpected
and also try to best deal with these unforeseen events, always keeping in mind the basic
objectives. The most of the writing part of a master thesis lies thus in an effective
organizational management.
After the implementation phase, I had to analyze the different results of the project. Classifiers
were evaluated thanks to the different evaluation metrics enabling to assess their performance.
This step allowed to select the best model and draw conclusions.
As mentioned in the previous section, managing a project always ends up with learning lessons
from what has been done, whatever the outcome. During the elaboration of this dissertation, I
learnt various things. Besides gaining more theoretical knowledge about a very interesting field
which is data science, I especially learnt how to organize and structure a project. Indeed, I was
used to work in a team and on smaller projects, and it was the first time that I was assigned to

57
work alone on such a long-winded project. In the end, this challenging project can only be
beneficial for my future professional life as this work enabled to exercise my decision making
as well as making experiments by myself.
Finally, some specific aspects related to project management could simply not be applied in the
case of this dissertation. First of all, I did not have to deal with team management. Indeed,
within an organization, people are frequently working in a team. In this context, communication
among the different team members is essential. However, in the framework of my thesis, I was
working alone and did not have to take into account the different stakeholders that are generally
involved in a project. Moreover, as my thesis is not at first sight project-oriented, the cost
approach could not be applied in this specific context. Indeed, without any link with a
company, the realization of this dissertation has no real cost except the time devoted to the
project which can be considered as a cost as well as all the efforts put in the project to complete
it successfully.
In conclusion, this chapter proves that a master thesis, regardless of the topic, can be
incorporated within the framework of a project management approach, even if this approach
can slightly differ from the one exposed by Pr. Polonovski during the seminar. As a result, a
dissertation does not need to be primarily project-oriented to demonstrate obvious connections
with project management. Finally, in the framework of this dissertation, time management
appeared to be the most constraining element.

58
59
7. Conclusion
In this dissertation, we have studied different models to successfully predict a user’s
numerical rating from its review text content. To do so, text classification, allowing to
automatically classify a document into a fixed set of classes after being trained over past
annotated data, has been applied on two different datasets from Amazon. These datasets pertain
to two distinct product categories: experience and search products and are characterized by an
imbalanced distribution.
Two different level prediction tasks have been implemented. On the one hand, binary
classification aimed at predicting the rating of a review as low or high. On the other hand, a
finer-grained predicting task has been investigated with the aim of predicting the exact value of
the rating for each review (multi-class classification and logistic regression). Finally, three
different classifiers (Naïve Bayes, SVM and Random Forest) were trained and tested on both
datasets.
Contrary to what one might think, implementing a text classification task in the context of
imbalanced datasets was not so straightforward. Indeed, resampling techniques were needed
in order to balance the data and alleviate biased results. As we were not able to implement the
SMOTE method, other more basic techniques such as random undersampling and oversampling
methods were used.
According to the evaluation metrics, the two most successful classifiers were Naïve Bayes and
SVM, with a slight advantage for SVM which confirms the results obtained by Pang, Lee and
Vaithyanathan (2002) and Dave, Lawrence, and Pennock (2003). Moreover, using the
summary of the review as well as its text content enables the classifier to better capture the
discriminative power of words.
Binary classification showed quite good results (f1-score of 0.84 and 0.77 for the experience
and search products respectively) while making more precise predictions (i.e. scale from 1 to
5) was significantly a harder task (f1-score of 0.52 and 0.57 for the experience and search
products respectively). More precisely, the easiest classes to predict are the extreme values, i.e.
1- and 5-star while 3-star instances are the most difficult to predict.
We observed that binary classification offers better results for the experience products while
multi-class classification performed better with the search products. We are thus not able to

60
draw any conclusion about the predictive accuracy of the classifier according to the product
type.
Finally, the evaluation metrics for the exact star rating prediction are not as accurate as we
wanted. This can be due to user bias as well as the resampling methods chosen. On the other
hand, even if the different classifiers are not perfect, we have to bear in mind that they still
achieve far better predictive results than if classes were randomly chosen.
This supervised learning task that was trained on Amazon reviews can be further applied to
many other applications where no numerical rating system is available. For instance this tool
can assign ratings to YouTube or Twitter comments or simply predict the rating of comments
from various online shops that only offer textual reviews, but no rating possibility. This tool
can thus improve consumer experience.
Besides being beneficial to consumers, this predictive task can also be of great use for
manufacturers. Based on the star-rating, they can easily identify reviews that have been badly
rated and therefore improve the quality of their products according to the customers’
requirements.
More broadly, this machine learning task can be used to facilitate other tasks such as
recommender systems, sentiment summarization, or opinion extraction.
Finally, some recommendations can be addressed in order to improve the predictive
performance of our models.
First of all, conducting the analysis on additional datasets would be more representative in
order to validate the different results obtained in the framework of this dissertation.
Secondly, exploring the SMOTE method developed by Chawla, Bowyer, Hall and Kegelmeyer
(2002) could alleviate the flaws of undersampling and oversampling methods, respectively loss
of information and overfitting.
Moreover, using feature selection such as selecting the set of the most popular k words within
the reviews of the dataset would allow to refine the performance of the classifiers and therefore
improve the accuracy metrics.
Another recommendation for further improvement is to explore the bag of opinions suggested
by Qu, Ifrim and Weikum (2010). Indeed, the bag-of-words may not always be the best
representation in the framework of product reviews. For instance, two reviews such as

61
“awesome hotel in an awful town” and “awful hotel in an awesome town” are represented the
same way with the bag-of-words model while they express completely opposite opinions. In
the same perspective, we can also compare the performance of unigrams, bigrams and trigrams
in order to see whether it leads to improvements.
Finally, taking into account additional independent variables obtained from the text such as
review length or text difficulty as well as other elements such as the helpfulness score or the
identity of the reviewer could also lead to a better predictive performance.

62
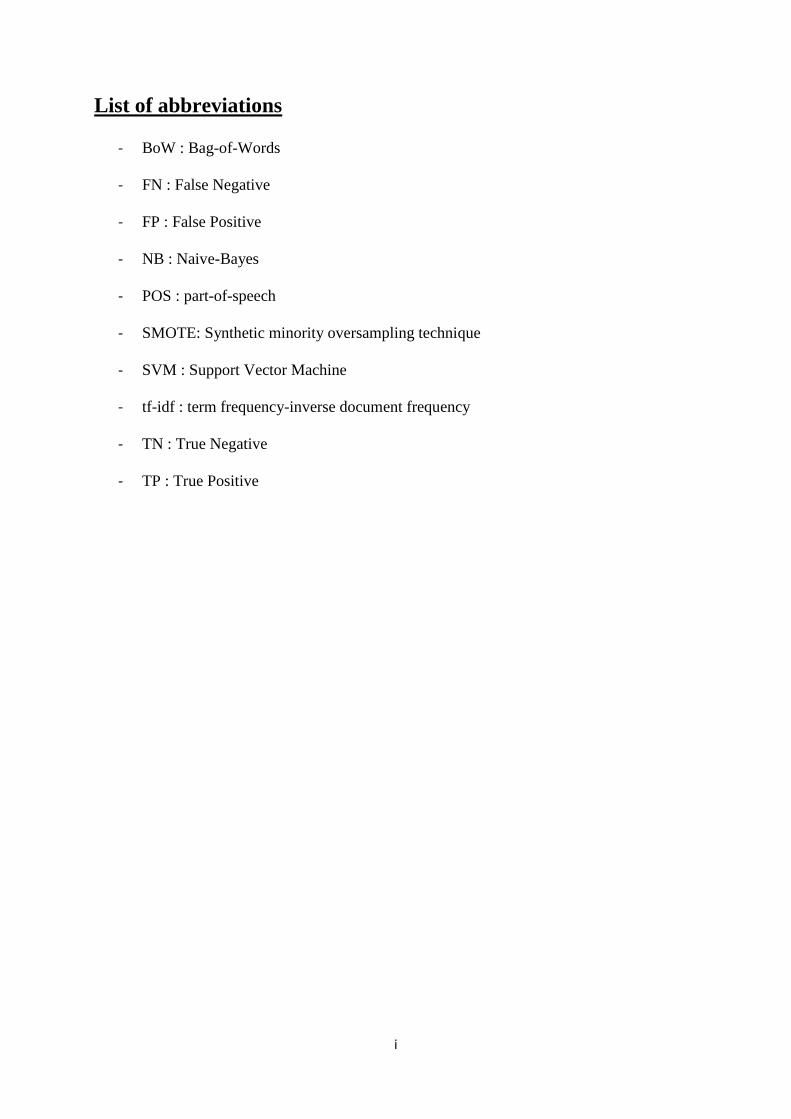
i
List of abbreviations
- BoW : Bag-of-Words
- FN : False Negative
- FP : False Positive
- NB : Naive-Bayes
- POS : part-of-speech
- SMOTE: Synthetic minority oversampling technique
- SVM : Support Vector Machine
- tf-idf : term frequency-inverse document frequency
- TN : True Negative
- TP : True Positive

ii
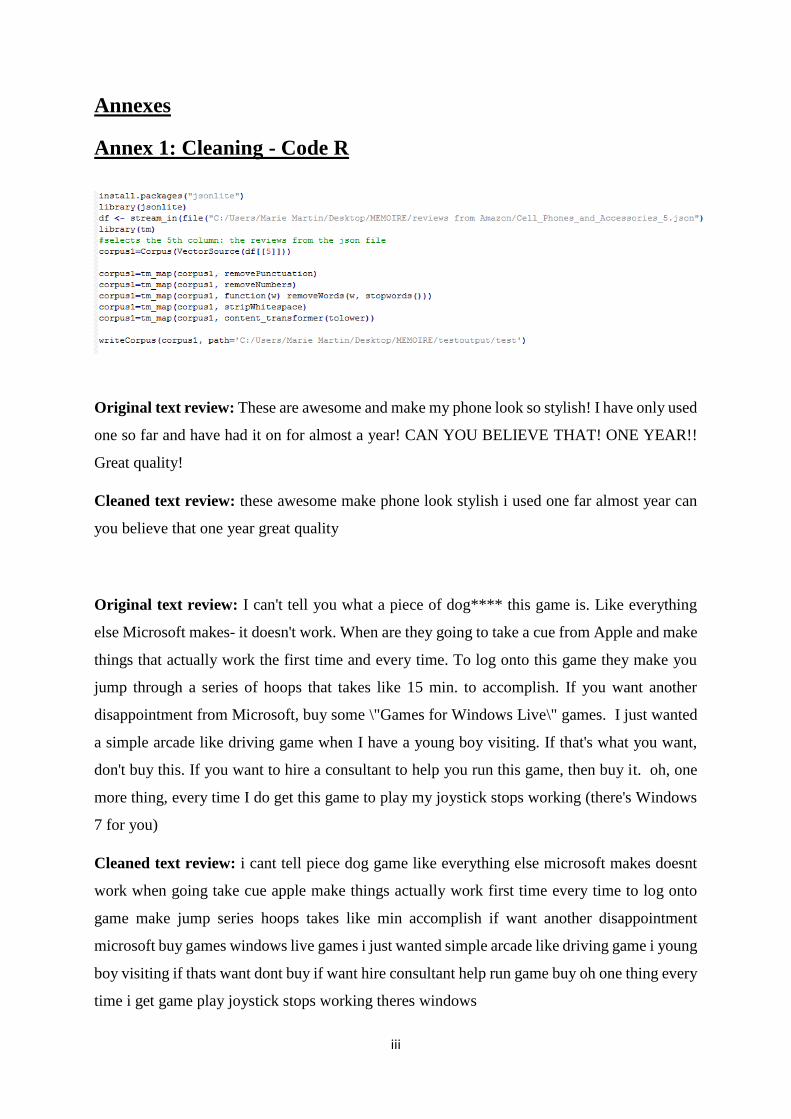
iii
Annexes
Annex 1: Cleaning - Code R
Original text review: These are awesome and make my phone look so stylish! I have only used
one so far and have had it on for almost a year! CAN YOU BELIEVE THAT! ONE YEAR!!
Great quality!
Cleaned text review: these awesome make phone look stylish i used one far almost year can
you believe that one year great quality
Original text review: I can't tell you what a piece of dog**** this game is. Like everything
else Microsoft makes- it doesn't work. When are they going to take a cue from Apple and make
things that actually work the first time and every time. To log onto this game they make you
jump through a series of hoops that takes like 15 min. to accomplish. If you want another
disappointment from Microsoft, buy some \"Games for Windows Live\" games. I just wanted
a simple arcade like driving game when I have a young boy visiting. If that's what you want,
don't buy this. If you want to hire a consultant to help you run this game, then buy it. oh, one
more thing, every time I do get this game to play my joystick stops working (there's Windows
7 for you)
Cleaned text review: i cant tell piece dog game like everything else microsoft makes doesnt
work when going take cue apple make things actually work first time every time to log onto
game make jump series hoops takes like min accomplish if want another disappointment
microsoft buy games windows live games i just wanted simple arcade like driving game i young
boy visiting if thats want dont buy if want hire consultant help run game buy oh one thing every
time i get game play joystick stops working theres windows

iv
Annex 2: Sample of annotated reviews
1) Binary classification
Dataset Review score
(y)
Review (X)
Cell phones
and
Accessories
HIGH fit perfectly nice snug fit looks beautiful galaxy s highly
recommend tihs item phone
LOW unfortunately commodity useful compared price good
serve desired purpose will benefit many good condition
index gives wrong signs find full time suddenly nothing
Video Games
HIGH
great product great valuethese silicone skins fit perfect two
dualshock ps controllersnot look good feel good toothey
small nub like grips around handle top good long play
timei recommend wireless dualshock sixaxis controllersi
wished black thats ok great value
LOW
this game lots problems first doesnt explain well whats
going note i dont manual i bought download legal site i
downloaded promoted official site game things move
slowly lot game finding way around rather action boring
the graphics also dont render well can see right floor many
places the cutscenes also make sense a good idea fun spent
time making sure things work right translation us market
Figure A2.1: Example of labeled data in the framework of binary classification for both
datasets

v
2) Multi-class classification and logistic regression
Dataset Review score
(y)
Review (X)
Cell phones
and
Accessories
1-star these worst headphones i ever owned the audio terrible
feel cheap plus wont last long use jogging
2-star
i little disappointed get something much average company
i like the case looks good really feels like little impact
resistance i feel like i almost get protection fullbody film
wrap without added thickness also time bottom gotten
loose
3-star not exactly i thought looking picture i thought white
actually clear case in end okay
4-star fits phone great far everything seems looking good cant
beat price pack lifetime replacement warranty
5-star
super adjustable tried galaxy nexus otterbox case also tried
iphone otterbox fit perfectly the one touch lock
mechanism perfect suction car dashboard slim slickjust
perfect definitely worth
Video Games
1-star
i like game the graphics good i really didnt like game i
found hard handle controller games i playing i just felt
silly working controller game playit justoddi tried twice
sold
2-star
dark sectors mediocre graphics paltry story can
overlooked concise linear gameplay engaging combat
while game can completed hours youll find eagerly
awaiting new ability enjoying using abilities combatthere
little replay value game however good thing price point
fallen lowdefinitely worth one playthrough though
opinion
3-star the game good fact i couldnt reprogram mouse controls
disapointed i find external program control preferences
4-star
this game lot fun exactly thrill seat pants kind game there
many different games play will hard pressed enjoy
something game the graphics good the game play good the
controls good my son loves my daughter loves its lot fun
price good valuelet games begin
5-star
awsome addition games fun openworld play game
interesting storyline swordplay fun recommended game
people want kill templer baddies
Figure A2.2: Example of labeled data in the framework of multi-class classification and
logistic regression for both datasets

vi
Annex 3: Implementation of text classification - Code Python
1) Naive Bayes, SVM and Random Forest classifiers
2) Logistic Regression classifier

vii
References
Awad, M. & Khanna, R. (2015). Efficient learning machines. Theories, concepts, and
applications for engineers and system designers (pp.1-18). New York: ApressOpen.
Baccianella, S., Esuli, A. & Sebastiani, F. (2009). Multi-facet rating of product reviews.
Proceedings of the 31st European Conference on Information Retrieval (ECIR), 461-
472.
Blagus, R. & Lusa, L. (2013). SMOTE for high-dimensional class-imbalanced data. BMC
Bioinformatics, 14, 106. doi: 10.1186/1471-2105-14-106
Chawla, N. V., Bowyer, K. W., Hall, L. O. & Kegelmeyer, W. P. (2002). SMOTE: Synthetic
Minority Over-Sampling Technique. Journal of Artificial Intelligence Research, 16,
321-357. doi: 10.1613/jair.953
Chevalier, J. & Mayzlin, D. (2006). The Effect of Word of Mouth on Sales: Online Book
Reviews. Journal of Marketing Research, 43, 345-354. doi: 10.3386/w10148
Dal Pozzolo, A., Caelen, O., Bontempi, G. (2013). Comparison of balancing techniques for
unbalanced datasets. Technical report, Machine Learning Group University of
Bruxelles, Belgium.
Dave, K., Lawrence, S. & Pennock, D. M. (2003). Mining the Peanut Gallery: Opinion
Extraction and Semantic Classification of Product Reviews. Proceedings of the
12th International Conference on World Wide Web, 519–528. doi :
10.1145/775152.775226
Fan, M. & Khademi, M. (2014). Predicting a Business’ Star in Yelp from Its Reviews’ Text
Alone. ArXiv e-prints. doi : 1401.0864
Fawcett, T. (2016). Learning from Imbalanced Classes. Retrieved from
https://svds.com/learning-imbalanced-classes/
Ganu, G., Elhadad, N. & Marian, A. (2009). Beyond the Stars: Improving Ratings Predictions
using Review Text Content. WebDB, 1-6.
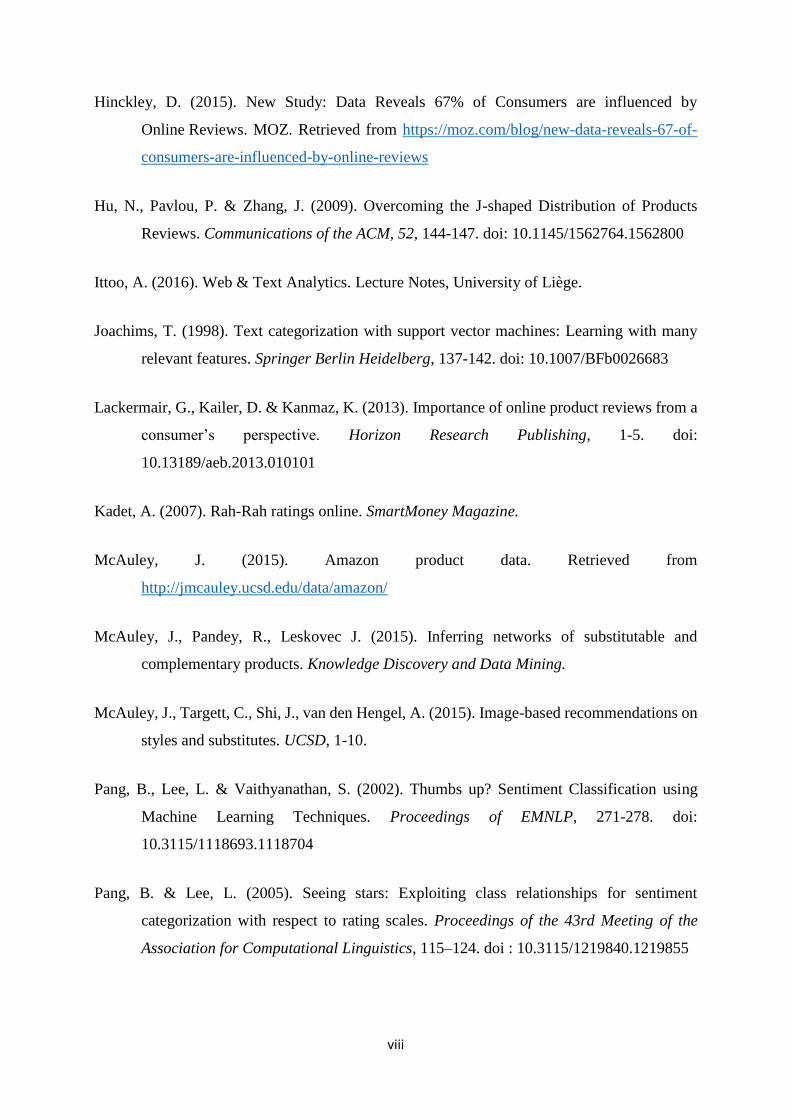
viii
Hinckley, D. (2015). New Study: Data Reveals 67% of Consumers are influenced by
Online Reviews. MOZ. Retrieved from https://moz.com/blog/new-data-reveals-67-of-
consumers-are-influenced-by-online-reviews
Hu, N., Pavlou, P. & Zhang, J. (2009). Overcoming the J-shaped Distribution of Products
Reviews. Communications of the ACM, 52, 144-147. doi: 10.1145/1562764.1562800
Ittoo, A. (2016). Web & Text Analytics. Lecture Notes, University of Liège.
Joachims, T. (1998). Text categorization with support vector machines: Learning with many
relevant features. Springer Berlin Heidelberg, 137-142. doi: 10.1007/BFb0026683
Lackermair, G., Kailer, D. & Kanmaz, K. (2013). Importance of online product reviews from a
consumer’s perspective. Horizon Research Publishing, 1-5. doi:
10.13189/aeb.2013.010101
Kadet, A. (2007). Rah-Rah ratings online. SmartMoney Magazine.
McAuley, J. (2015). Amazon product data. Retrieved from
http://jmcauley.ucsd.edu/data/amazon/
McAuley, J., Pandey, R., Leskovec J. (2015). Inferring networks of substitutable and
complementary products. Knowledge Discovery and Data Mining.
McAuley, J., Targett, C., Shi, J., van den Hengel, A. (2015). Image-based recommendations on
styles and substitutes. UCSD, 1-10.
Pang, B., Lee, L. & Vaithyanathan, S. (2002). Thumbs up? Sentiment Classification using
Machine Learning Techniques. Proceedings of EMNLP, 271-278. doi:
10.3115/1118693.1118704
Pang, B. & Lee, L. (2005). Seeing stars: Exploiting class relationships for sentiment
categorization with respect to rating scales. Proceedings of the 43rd Meeting of the
Association for Computational Linguistics, 115–124. doi : 10.3115/1219840.1219855

ix
Pawar, P. & Gawande, S. (2012). A Comparative Study on Different Types of Approaches to
Text Categorization. International Journal of Machine Learning and Computing, 2.
doi : 10.7763/IJMLC.2012.V2.158
Polonovski, J. P. (2016). Introduction to Project Management. Lecture notes. University of
Quebec (Montreal).
Project Management Institute. (2017). What is project management?. Retrieved from
https://www.pmi.org/about/learn-about-pmi/what-is-project-management
Schyns, M. (2016). Business analytics. Lecture Notes, University of Liège.
Woolf, M. (2017). Playing with 80 Million Amazon Product Review Ratings Using Apache
Spark. Retrieved from http://minimaxir.com/2017/01/amazon-spark/
Zhang, H. (2004). The optimality of naive Bayes. Proceedings of the 17th International FLAIRS
Conference, 1, 3.

x

Executive summary
The goal of this dissertation is to successfully predict a user’s numerical rating from its review
text content. To do so, supervised machine learning techniques and more specifically text
classification are used.
Three distinct approaches are presented, namely binary classification, aiming at predicting the
rating of a review as low or high, as well as multi-class classification and logistic regression
whose aim is to predict the exact value of the rating for each review. Moreover, three different
classifiers (Naïve Bayes, Support Vector Machine and Random Forest) are trained and tested
on two different datasets from Amazon. These datasets are divided into two major categories:
experience and search products and are characterized by an imbalanced distribution. We
overcome this issue by applying sampling techniques to even out the class distributions.
Eventually, the performance of those classifiers is tested and assessed thanks to accuracy
metrics, including precision, recall and f1-score.
Our results show that the two most successful classifiers are Naïve Bayes and SVM, with a
slight advantage for the latter one for both datasets. Binary classification shows quite good
results while making more precise predictions (i.e. scale from 1 to 5) is significantly a harder
task. Nevertheless, these results are still acceptable.
More practically, our approach enables users’ feedbacks to be automatically expressed on a
numerical scale and therefore to ease the consumer decision process prior to making a purchase.
This can in turn be extended to various other situations where no numerical rating system is
available, for instance comments on YouTube or Twitter.
Keywords: product review, rating, supervised machine learning, prediction, text
classification, binary classification, multi-class classification, logistic regression, imbalanced
datasets
Top Related